Author Contributions
Conceptualization, R.S.P., B.R.C. and R.J.E.; Data curation, R.S.P.; Formal analysis, R.S.P. and B.R.C.; Funding acquisition, B.R.C.; Investigation, R.S.P.; Methodology, R.S.P., B.R.C. and R.J.E.; Project administration, B.R.C. and R.J.E.; Resources, B.R.C.; Supervision, B.R.C. and R.J.E.; Validation, R.S.P.; Visualization, B.R.C.; Writing—original draft, R.S.P.; Writing—review and editing, R.S.P., B.R.C. and R.J.E.
Figure 1.
Relative soil water content of pots containing perennial ryegrass (PR), cocksfoot (CF), tall fescue (TF) and chicory (Chi) during consecutive heat and drought treatments and subsequent recovery periods. (a), (b) and (c) represent well-watered (WW) plants grown at control, moderate and severe heat stresses, respectively, while (d), (e) and (f) represent corresponding water stressed (WS) plants. T-0 denotes pre-treatment, T-1 and T-2 denote treatments and R-1 and R-2 denote recovery periods. Mean values (n = 5) are provided with error bars representing ± standard error
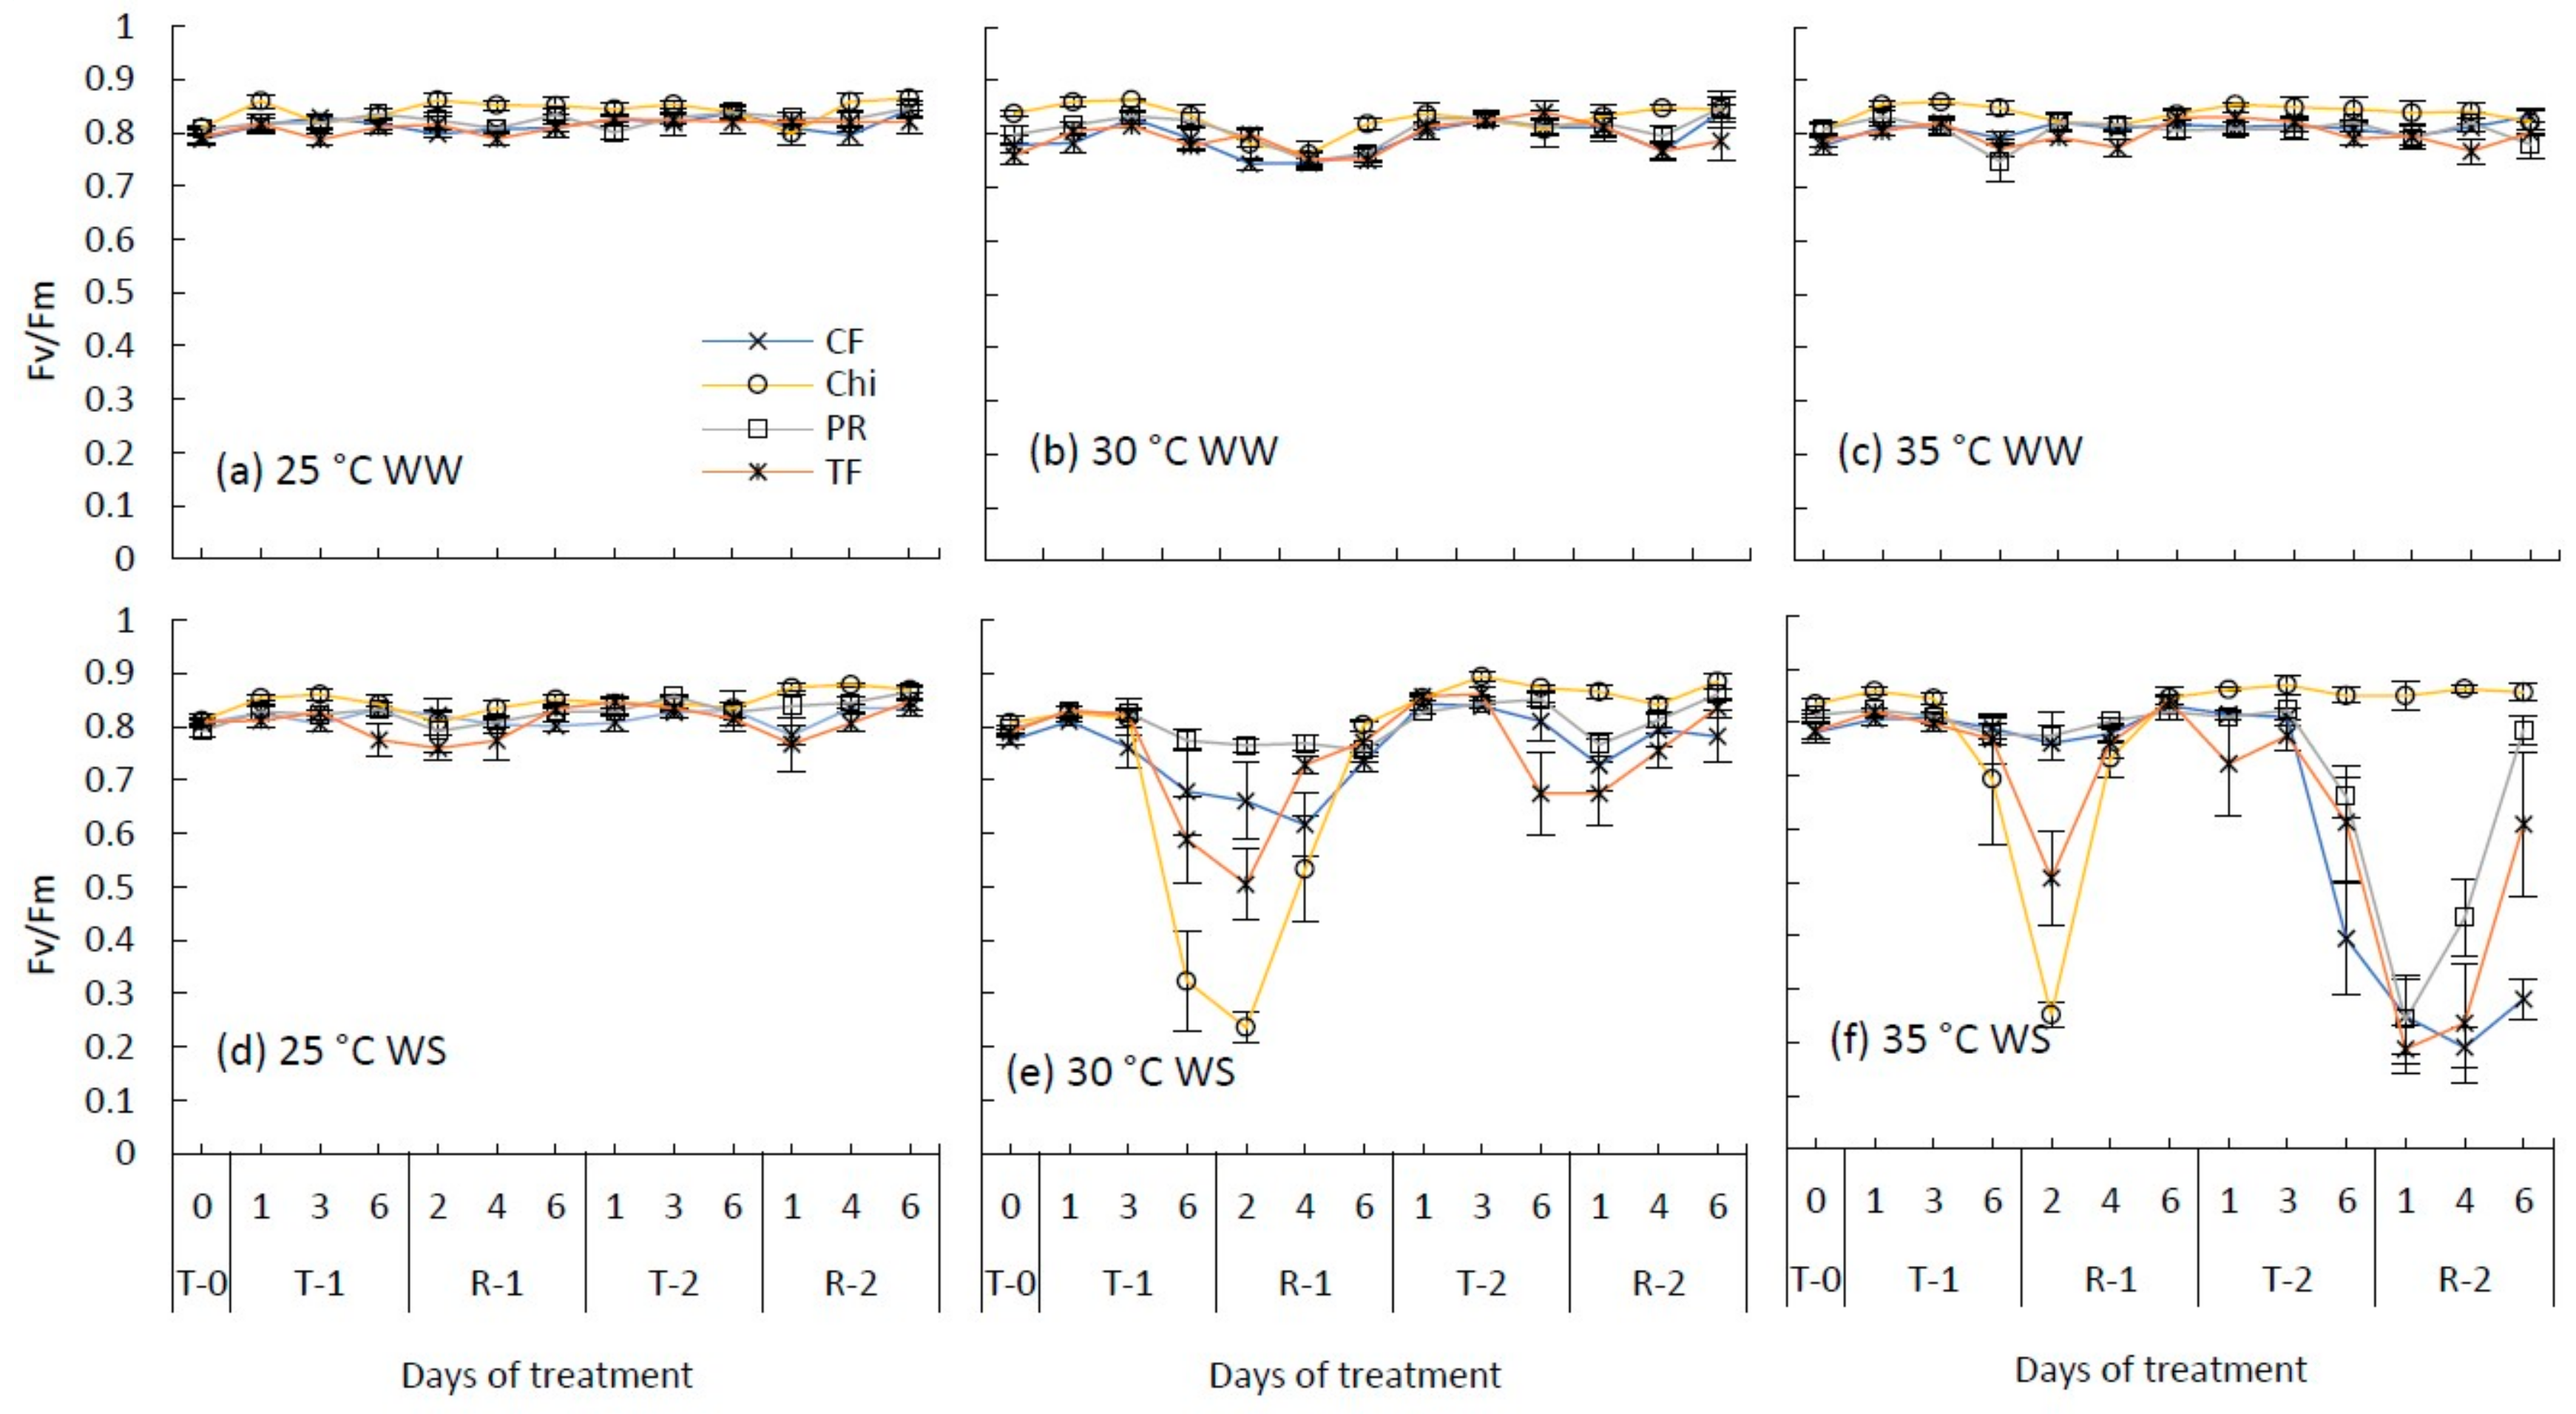
Figure 2.
Maximum photochemical efficiency of photosystem II (Fv/Fm) during consecutive temperature and drought treatments and subsequent recovery of cocksfoot (CF), chicory (Chi), perennial ryegrass (PR) and tall fescue (TF). (a), (b) and (c) represent well-watered (WW) plants grown at control, moderate and severe heat stress, respectively, while (d), (e) and (f) represent corresponding water stressed (WS) plants. T-0 denotes pre-treatment, T-1 and T-2 denote treatments and R-1 and R-2 denote recovery periods. Mean (n = 3–5) values are provided with error bars representing ± standard error.
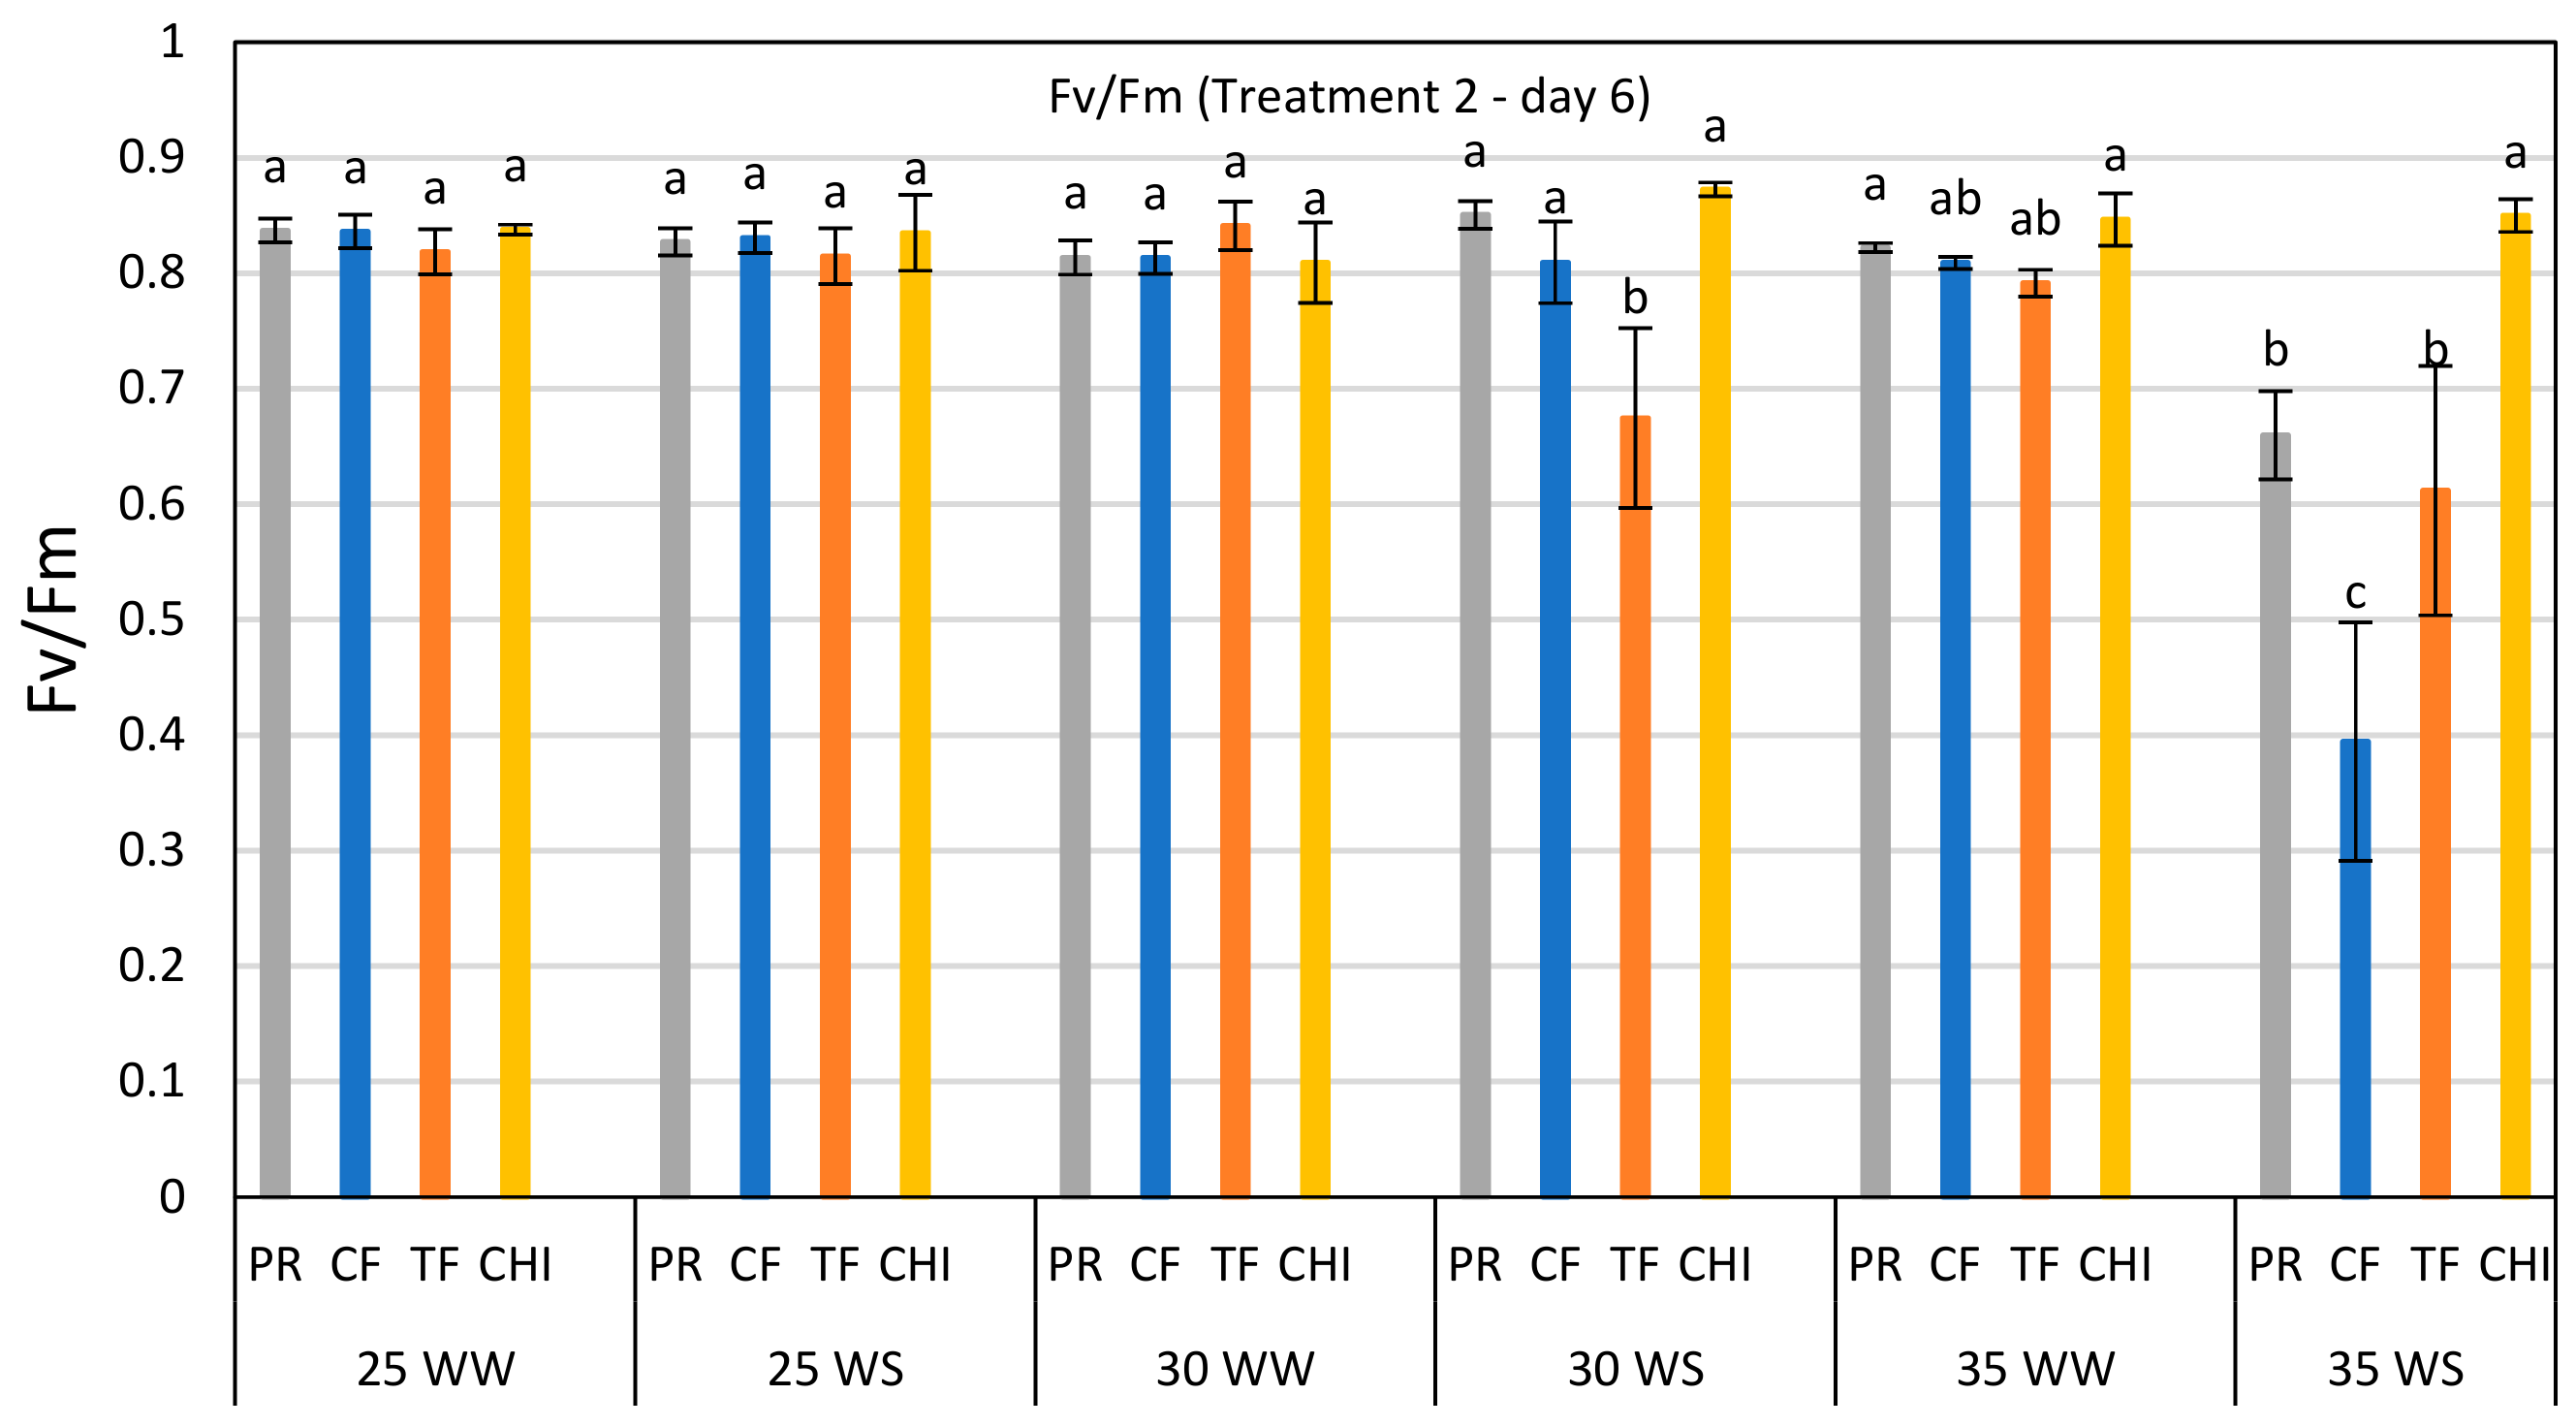
Figure 3.
Comparison of Fv/Fm ratio of perennial ryegrass (PR), cocksfoot (CF), tall fescue (TF) and chicory (CHI) on day 6 of the second heat and water stress treatment. Each bar represents mean (
n = 3–5) Fv/Fm value with ±SE. Significant differences are shown by different letters. The values in this bar graph can also be read from the day 6 of T-2 in each graph of
Figure 2.
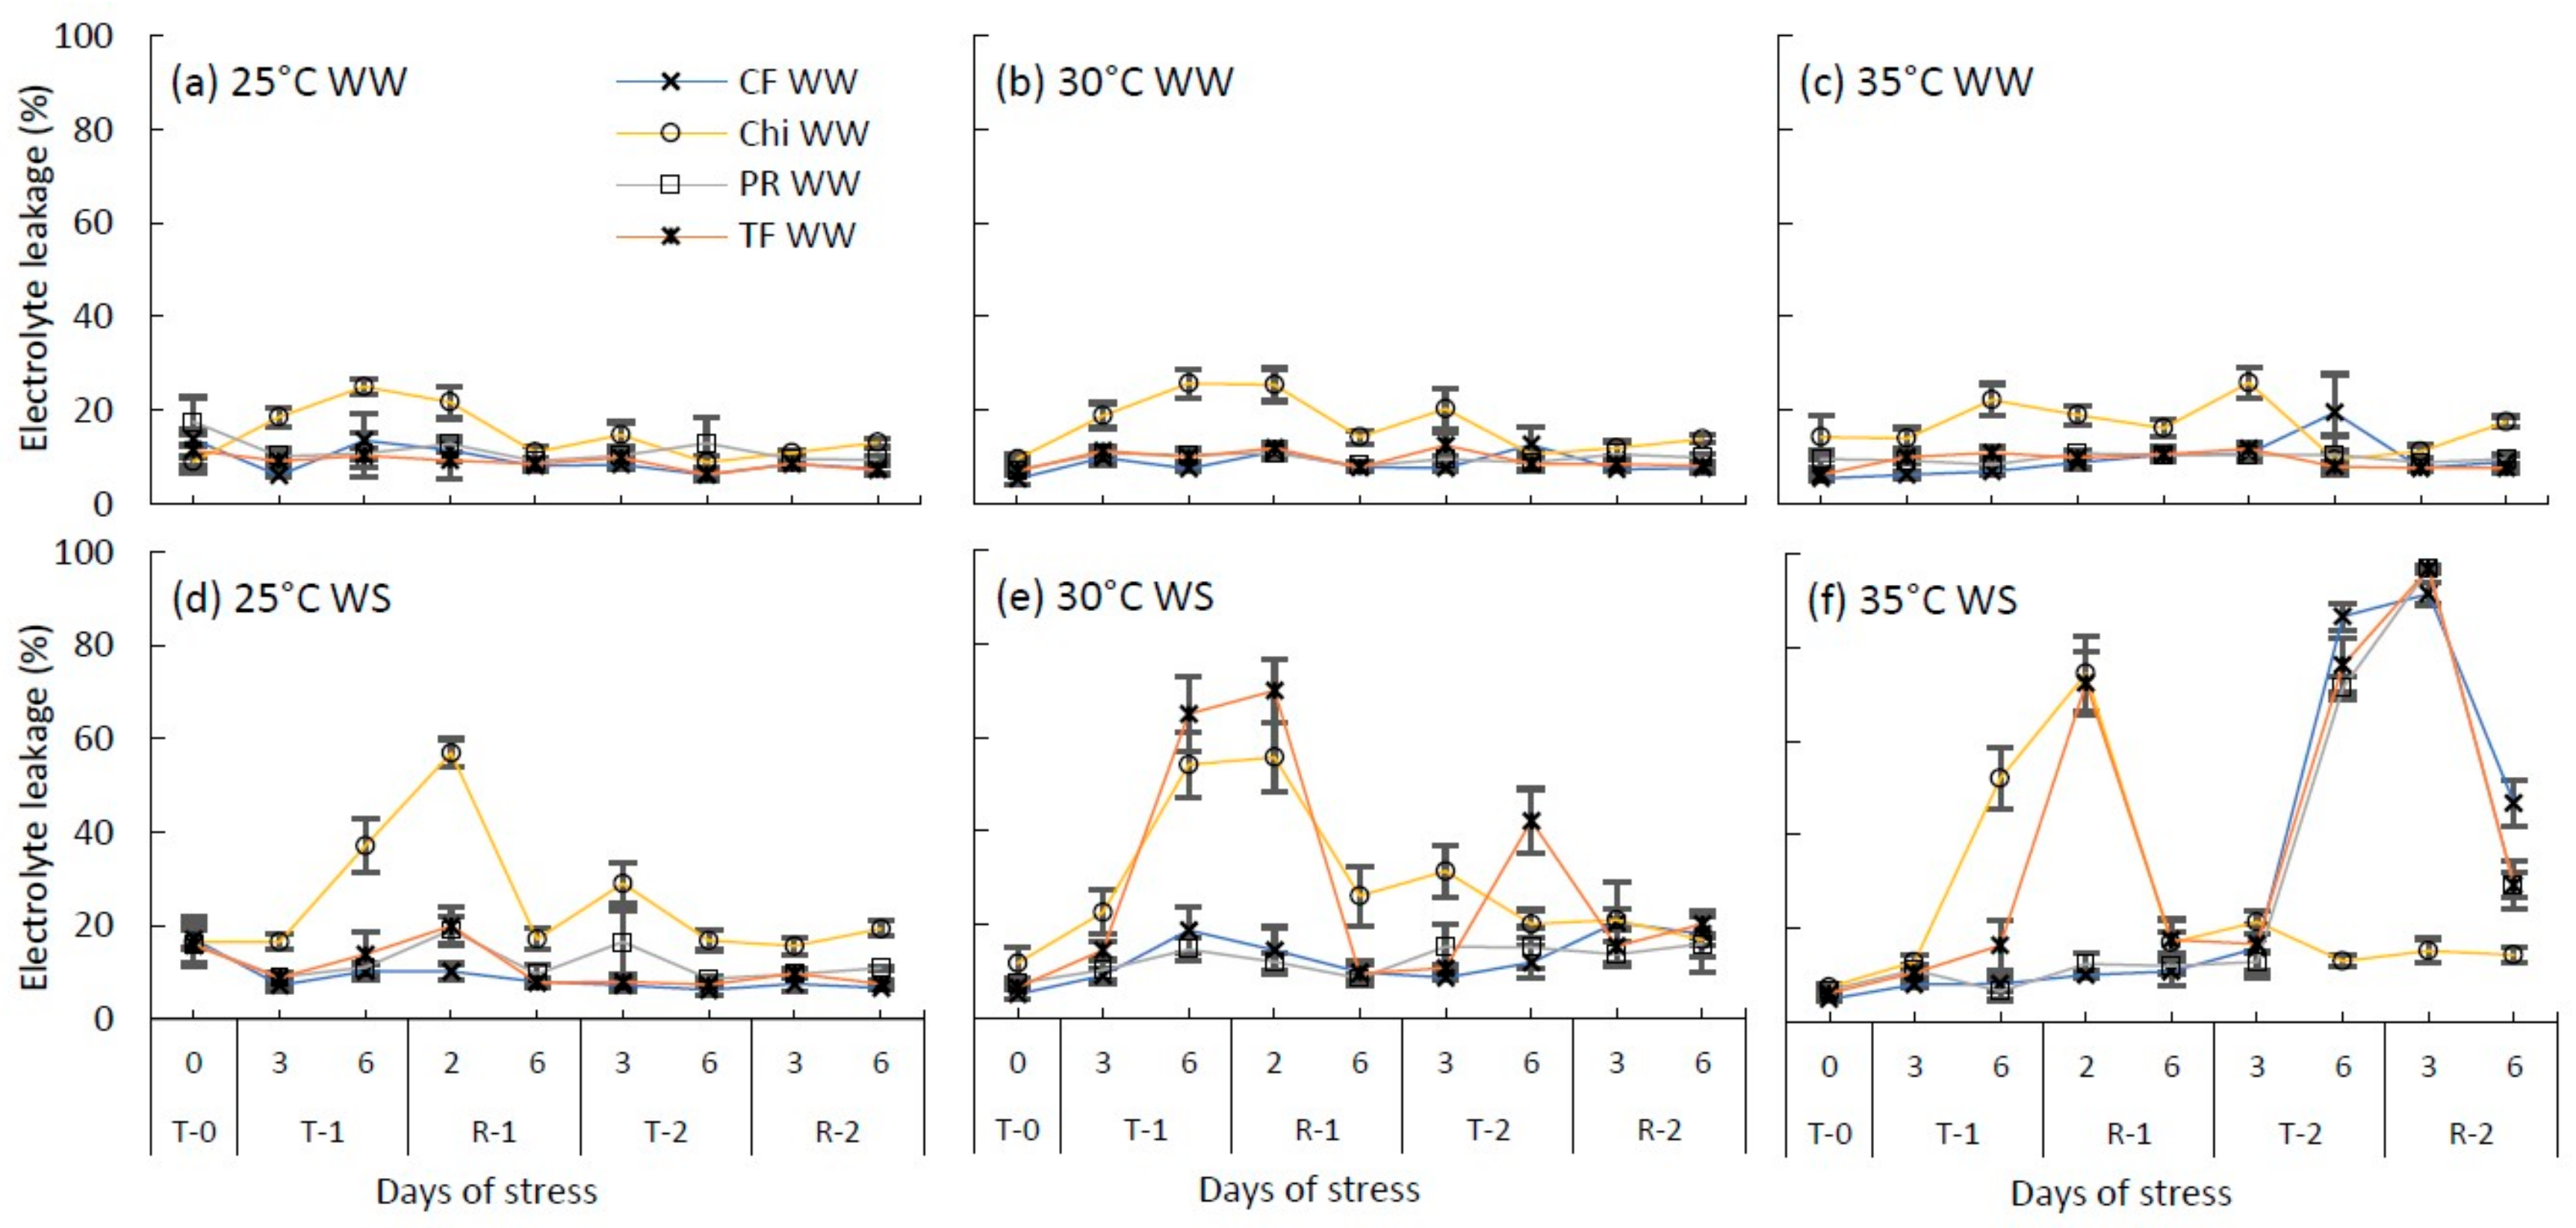
Figure 4.
Changes to the cell membrane permeability (measured using electrolyte leakage %) of cocksfoot (CF), chicory (Chi), perennial ryegrass (PR) and tall fescue (TF) during the consecutive temperature and water treatments and subsequent recovery phases. (a), (b) and (c) represent well-watered (WW) plants grown at control, moderate and severe heat stress, respectively, while (d), (e) and (f) represent corresponding water stressed plants (WS). T-0 denotes pre-treatment, T-1 and T-2 denote treatments and R-1 and R-2 denote recovery periods. Mean values (n = 3–5) are provided with error bars representing ± standard error.
Figure 5.
Leaf elongation rates of perennial ryegrass (PR) cocksfoot (CF), tall fescue (TF) and chicory (Chi) measured as cmd−1 during the consecutive temperature and drought treatments and subsequent recovery phases. (a), (b) and (c) represent well-watered (WW) plants grown at control, moderate and severe temperatures, respectively, while (d), (e) and (f) represent corresponding water stressed (WS) plants. T-0 denotes pre-treatment, T-1 and T-2 denote treatments and R-1 and R-2 denote recovery periods. Mean values (n = 3–5) are provided with the error bars representing the ± standard error.
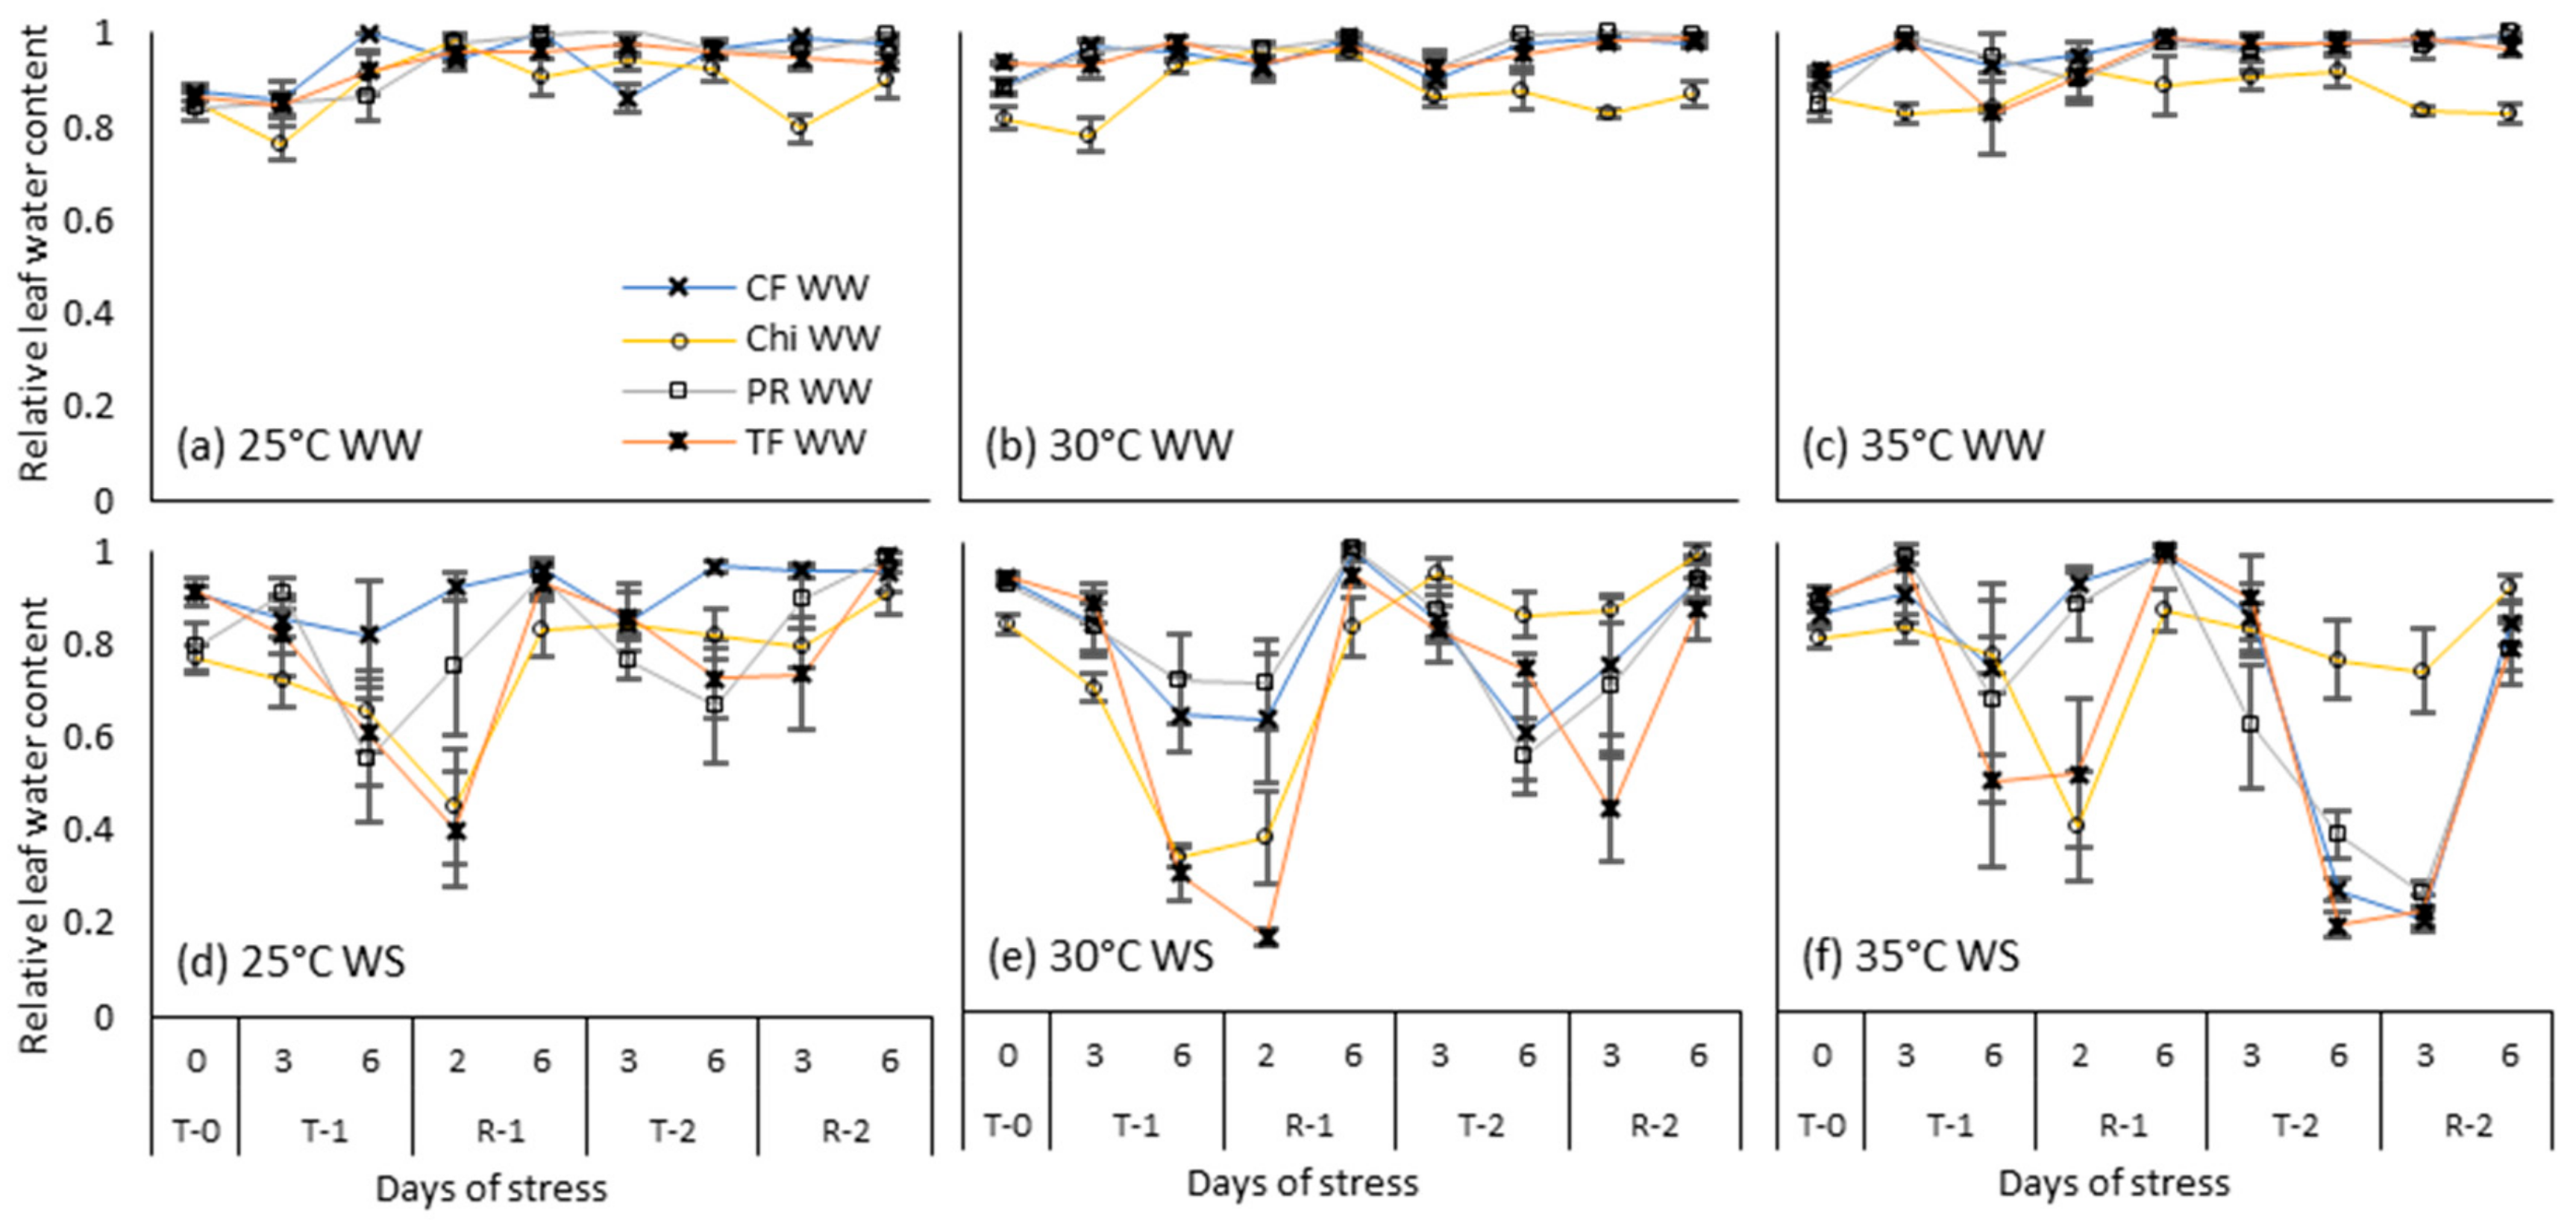
Figure 6.
Relative leaf water content during consecutive temperature and drought treatments and subsequent recovery phases of cocksfoot (CF), chicory (Chi), perennial ryegrass (PR) and tall fescue (TF). (a), (b) and (c) represent well-watered (WW) plants grown at control, moderate and severe temperatures respectively while (d), (e) and (f) represent corresponding water stressed (WS) plants. T-0 denotes pre-treatment, T-1 and T-2 denote treatments and R-1 and R-2 denote recovery periods. Mean values (n = 3–5) are provided with error bars representing ± standard error.
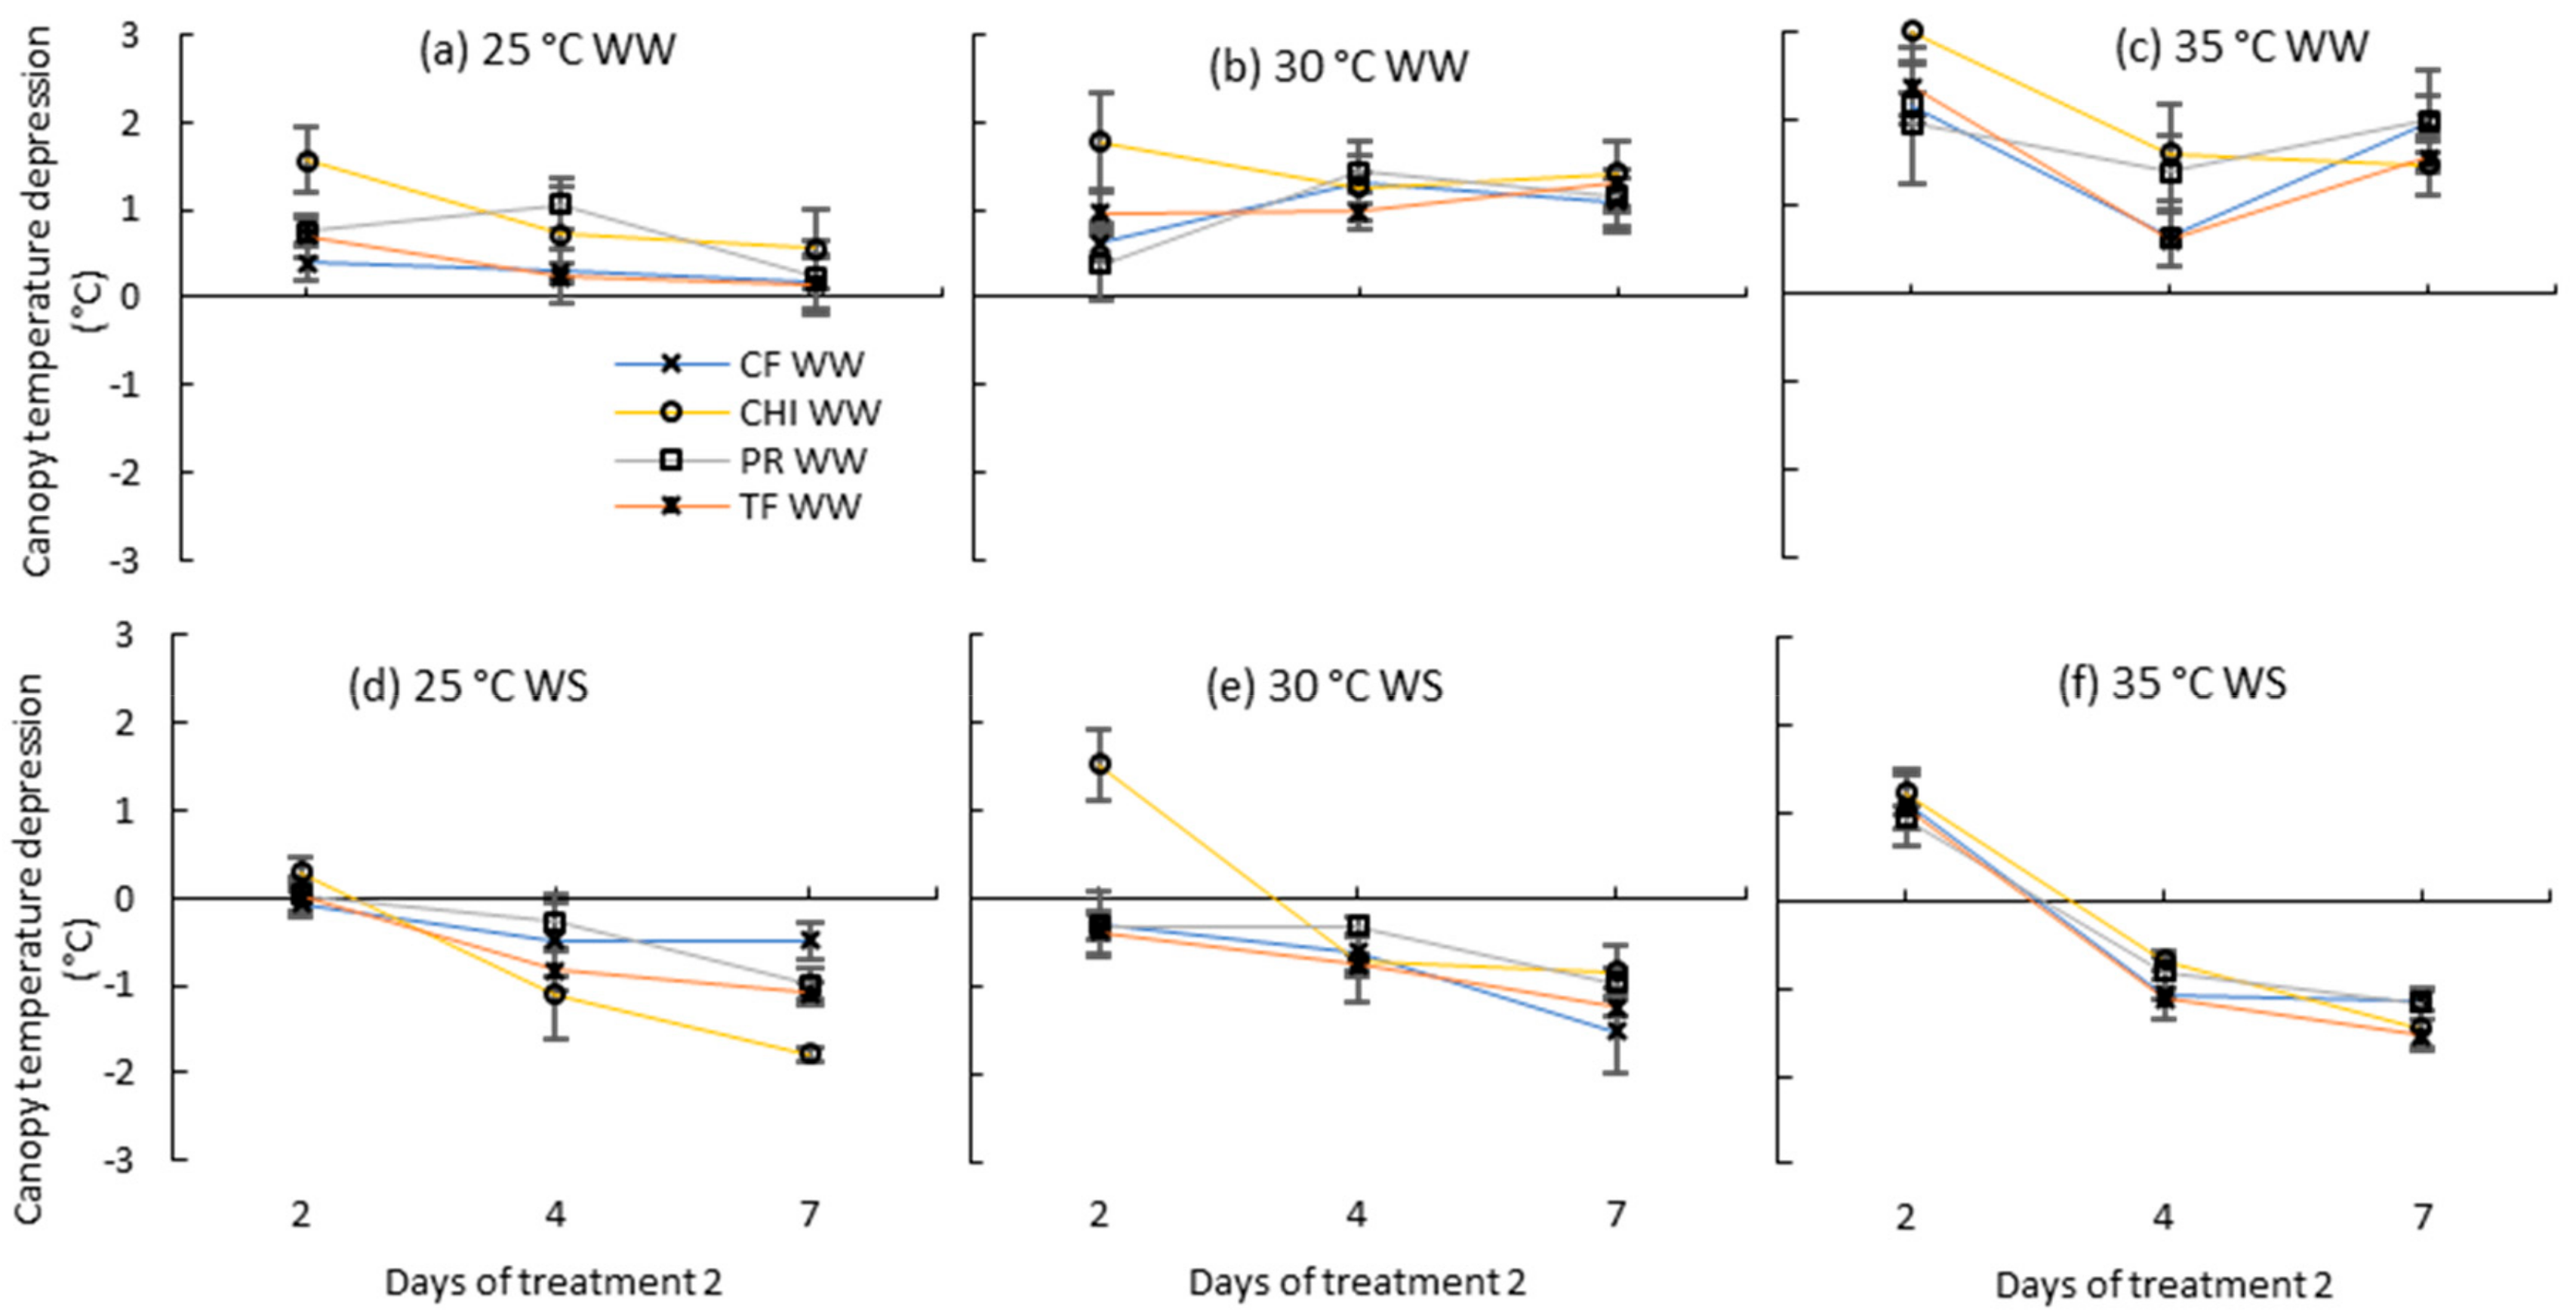
Figure 7.
Canopy temperature depression (Ta-Tc) of perennial ryegrass (PR), cocksfoot CF), tall fescue (TF) and chicory (CHI) during day 2, 4 and 7 of the second treatment period. (a), (b) and (c) represent well-watered (WW) plants grown at control, moderate and severe temperatures, respectively, while (d), (e) and (f) represent corresponding water stressed (WS) plants. Means are shown (n = 3 or 5) with error bars representing ± standard error.
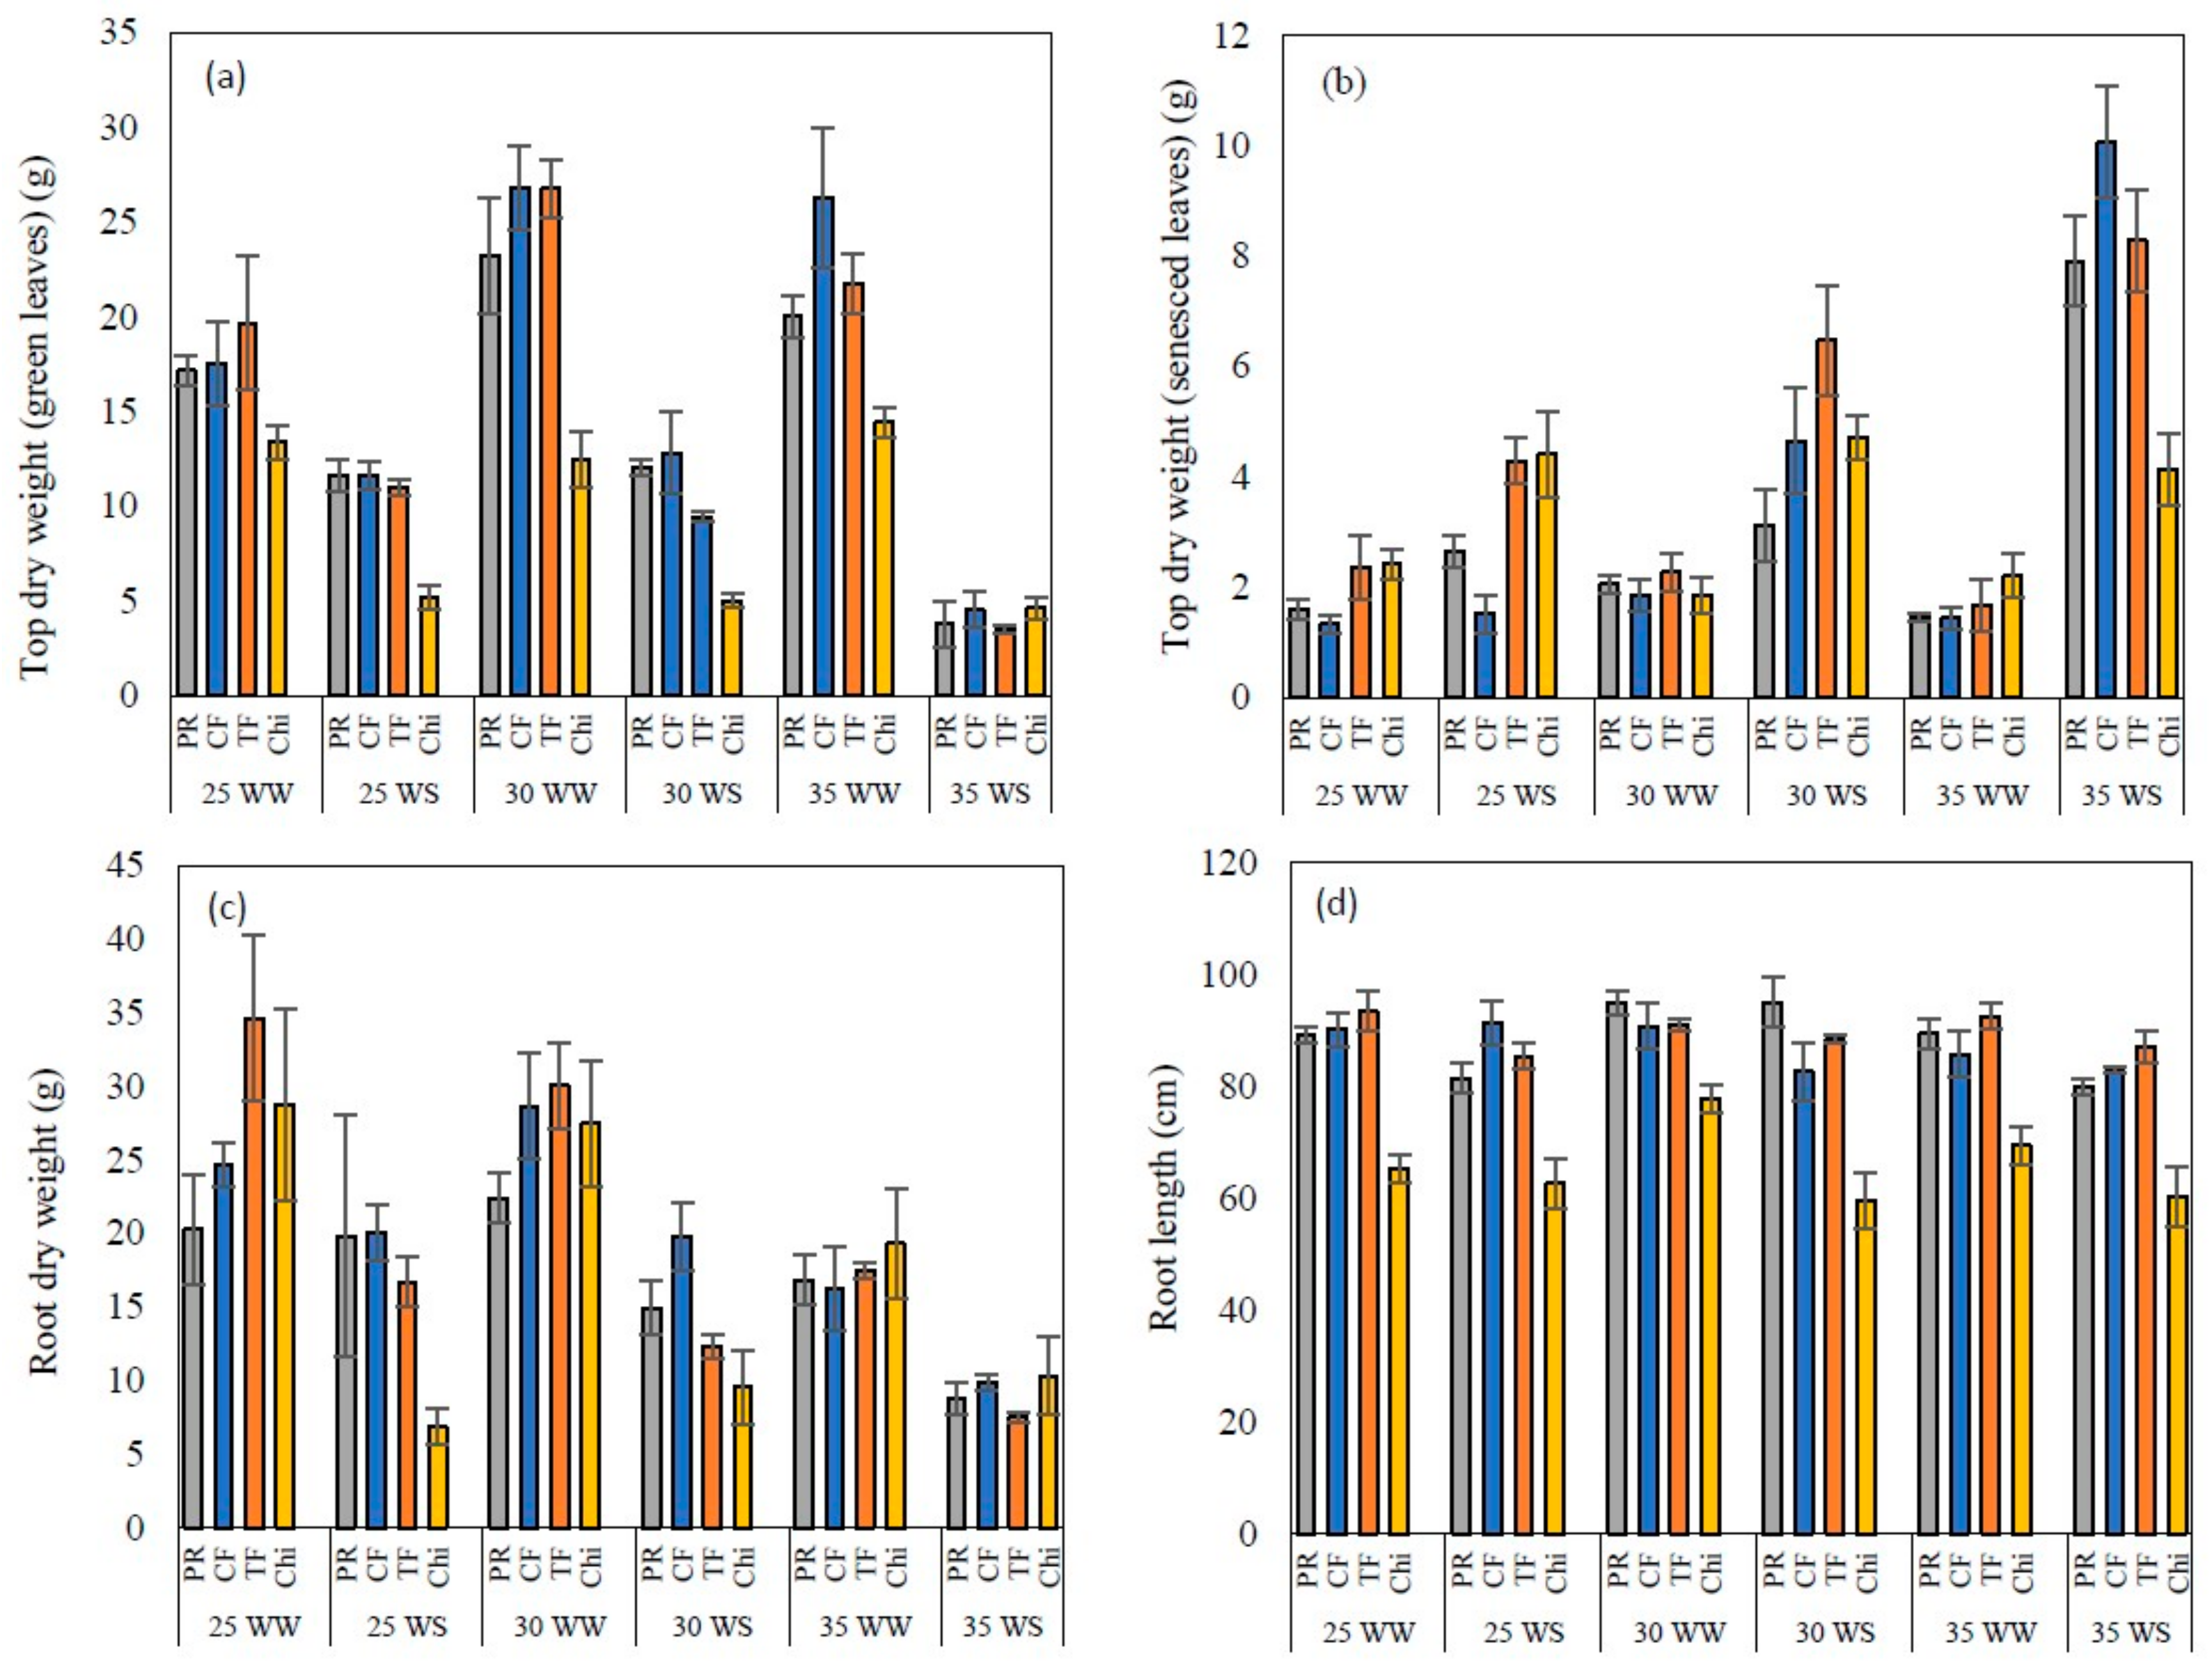
Figure 8.
Top dry weight of green (a) and senesced leaves (b), root dry weight (c) and root length (d) of perennial ryegrass (PR), cocksfoot CF), tall fescue (TF) and chicory (Chi) measured at the end of the experiment. Mean values n = 5 are shown with the error bars representing standard error.
Figure 8.
Top dry weight of green (a) and senesced leaves (b), root dry weight (c) and root length (d) of perennial ryegrass (PR), cocksfoot CF), tall fescue (TF) and chicory (Chi) measured at the end of the experiment. Mean values n = 5 are shown with the error bars representing standard error.
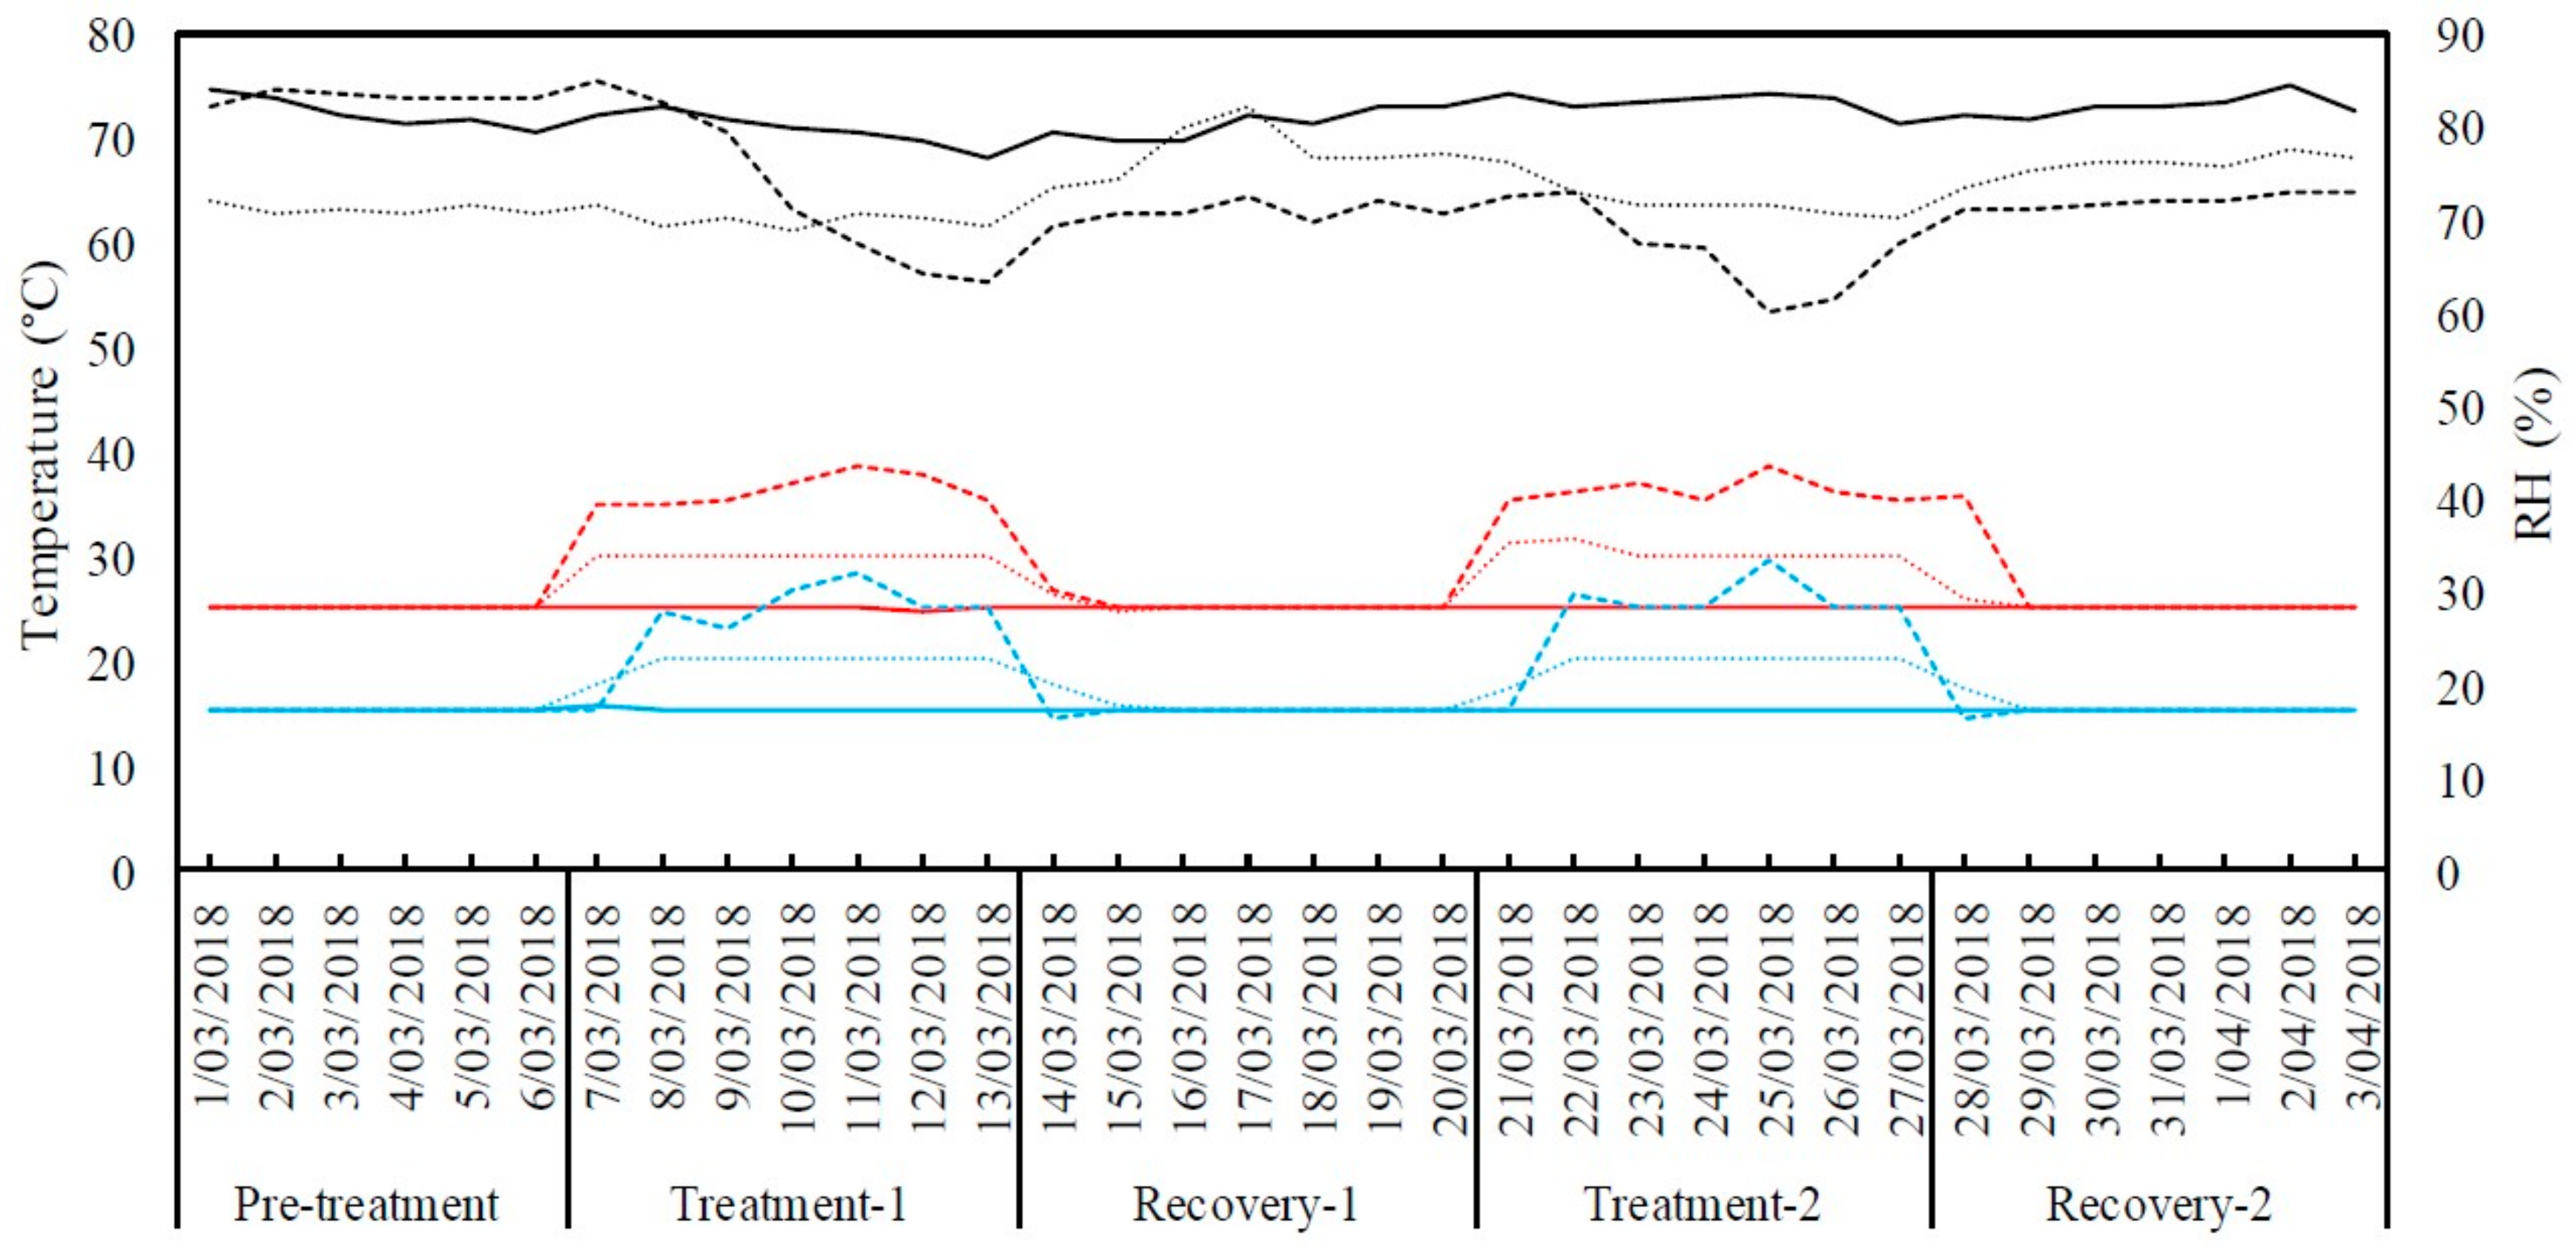
Figure 9.
Daily maximum (red), minimum (blue) temperatures and average relative humidity (RH %) (black) inside the growth chambers for the duration of experiment. The thick line represents control (25 °C/15 °C day/night) treatment, the dotted line represents moderate heat stress treatment (30 °C/20 °C day/night) and the dashed line represents severe heat stress treatment (35 °C/25 °C day/night).
Table 1.
Level of significance of the main factors and their interactions in relative soil water content.
Table 1.
Level of significance of the main factors and their interactions in relative soil water content.
| Main Factors and Interactions | Pre-Treatment | Treatment 1 | Recovery 1 | Treatment 2 | Recovery 2 |
|---|
| Day 1 | Day 3 | Day 6 | Day 2 | Day 4 | Day 7 | Day 3 | Day 5 | Day 7 | Day 2 | Day 4 | Day 7 | Day 2 | Day 5 | Day 7 |
|---|
| Temperature | NS | NS | NS | NS | NS | NS | NS | NS | NS | NS | NS | NS | NS | NS | NS |
| Water status | NS | NS | NS | *** | *** | *** | * | NS | NS | *** | *** | *** | * | NS | * |
| Species | * | *** | *** | *** | *** | * | NS | NS | NS | * | NS | * | * | NS | NS |
| Temperature × Water status | NS | NS | NS | ** | *** | NS | NS | NS | NS | NS | ** | NS | NS | NS | NS |
| Temperature × Species | NS | NS | ** | ** | ** | NS | NS | NS | NS | NS | NS | NS | NS | NS | NS |
| Water status × Species | NS | NS | NS | ** | *** | NS | * | * | NS | * | * | NS | * | NS | * |
| Temperature × Water status × Species | NS | NS | NS | NS | * | * | NS | NS | NS | NS | * | * | NS | NS | NS |
Table 2.
Level of significance of the main factors and their interactions on each day for maximum photochemical efficiency of photosystem II (Fv/Fm).
Table 2.
Level of significance of the main factors and their interactions on each day for maximum photochemical efficiency of photosystem II (Fv/Fm).
| Main Factors and Interactions | Pre-Treatment | Treatment 1 | Recovery 1 | Treatment 2 | Recovery 2 |
|---|
| Day 0 | Day 1 | Day 3 | Day 6 | Day 2 | Day 4 | Day 6 | Day 1 | Day 3 | Day 6 | Day 1 | Day 4 | Day 6 |
|---|
| Temperature | NS | NS | NS | NS | NS | NS | NS | NS | NS | NS | NS | NS | NS |
| Water status | NS | NS | NS | ** | *** | *** | NS | NS | * | *** | *** | *** | *** |
| Species | *** | *** | *** | * | *** | NS | *** | * | *** | *** | *** | *** | *** |
| Temperature × Water status | NS | NS | * | * | *** | * | NS | NS | * | *** | NS | *** | *** |
| Temperature × Species | NS | NS | NS | ** | *** | * | NS | NS | NS | *** | * | *** | *** |
| Water status × Species | NS | NS | NS | *** | *** | * | NS | NS | NS | ** | NS | *** | *** |
| Temperature × Water status × Species | NS | NS | NS | ** | *** | NS | NS | NS | NS | ** | NS | *** | *** |
Table 3.
Level of significance of the main factors and their interactions on each day for cell membrane permeability.
Table 3.
Level of significance of the main factors and their interactions on each day for cell membrane permeability.
| Main Factors and Interactions | Pre-Treatment | Treatment 1 | Recovery 1 | Treatment 2 | Recovery 2 |
|---|
| Day 0 | Day 3 | Day 6 | Day 2 | Day 6 | Day 3 | Day 6 | Day 3 | Day 6 |
|---|
| Temperature | NS | NS | NS | NS | NS | NS | NS | *** | NS |
| Water status | NS | NS | *** | *** | ** | * | *** | *** | *** |
| Species | NS | *** | *** | *** | *** | *** | *** | *** | NS |
| Temperature × Water status | NS | NS | *** | *** | NS | NS | *** | *** | *** |
| Temperature × Species | NS | NS | *** | *** | NS | NS | *** | *** | *** |
| Water status × Species | NS | NS | *** | *** | NS | NS | *** | *** | *** |
| Temperature × Water status × Species | NS | NS | *** | *** | NS | NS | *** | *** | *** |
Table 4.
Level of significance of the main factors and their interactions on each day for leaf elongation rate.
Table 4.
Level of significance of the main factors and their interactions on each day for leaf elongation rate.
| Main Factors and Interactions | Pre-Treatment | Treatment 1 | Recovery 1 | Treatment 2 | Recovery 2 |
|---|
| Day 3 | Day 6 | Day 2 | Day 4 | Day 7 | Day 3 | Day 5 | Day 7 | Day 2 | Day 4 | Day 7 | Day 2 | Day 5 | Day 7 |
|---|
| Temperature | NS | NS | NS | NS | NS | NS | NS | NS | NS | NS | NS | NS | NS | NS |
| Water status | NS | NS | * | *** | *** | *** | NS | NS | NS | *** | *** | *** | *** | *** |
| Species | *** | *** | *** | *** | *** | NS | ** | * | *** | *** | *** | *** | * | *** |
| Temperature × Water status | NS | NS | NS | NS | NS | NS | NS | NS | NS | NS | * | NS | NS | NS |
| Temperature × Species | NS | NS | NS | NS | * | NS | NS | NS | NS | NS | NS | * | NS | NS |
| Water status × Species | NS | NS | NS | NS | *** | *** | NS | *** | *** | NS | NS | NS | * | * |
| Temperature × Water status × Species | NS | NS | NS | NS | *** | NS | NS | NS | NS | NS | NS | NS | NS | NS |
Table 5.
Level of significance of the main factors and their interactions on each day for relative leaf water content.
Table 5.
Level of significance of the main factors and their interactions on each day for relative leaf water content.
| Main Factors and Interactions | Pre-Treatment | Treatment 1 | Recovery 1 | Treatment 2 | Recovery 2 |
|---|
| Day 0 | Day 3 | Day 6 | Day 2 | Day 6 | Day 3 | Day 6 | Day 3 | Day 6 |
|---|
| Temperature | NS | NS | NS | NS | NS | NS | NS | NS | NS |
| Water status | NS | * | *** | *** | * | *** | *** | *** | *** |
| Species | *** | *** | * | *** | *** | NS | *** | * | NS |
| Temperature × Water status | NS | NS | NS | * | NS | NS | *** | *** | *** |
| Temperature × Species | NS | NS | NS | NS | NS | NS | *** | *** | NS |
| Water status × Species | NS | NS | NS | *** | NS | * | *** | *** | *** |
| Temperature × Water status × Species | NS | NS | NS | NS | NS | NS | *** | ** | * |
Table 6.
Level of significance of canopy temperature depression measured on day 2, 4 and 7 in the second treatment period.
Table 6.
Level of significance of canopy temperature depression measured on day 2, 4 and 7 in the second treatment period.
| Main Factors and Interactions | Treatment 2 |
|---|
| Day 2 | Day 4 | Day 7 |
|---|
| Temperature | NS | NS | NS |
| Water status | *** | *** | *** |
| Species | *** | * | NS |
| Temperature × Water status | NS | NS | *** |
| Temperature × Species | NS | NS | NS |
| Water status × Species | NS | NS | NS |
| Temperature × Water status × Species | NS | NS | NS |
Table 7.
Level of significance of the top weight (green), top weight (senesced), root weight and root length measured at the end of the experiment.
Table 7.
Level of significance of the top weight (green), top weight (senesced), root weight and root length measured at the end of the experiment.
| Main Factors and Interactions Terms | Top Dry Weight (Green) | Top Dry Weight (Dead) | Root Dry Weight | Root Length |
|---|
| Temperature | NS | NS | NS | NS |
| Water status | *** | *** | *** | ** |
| Species | *** | * | NS | *** |
| Temperature × Water status | *** | *** | NS | NS |
| Temperature × Species | * | *** | NS | * |
| Water status × Species | ** | * | ** | NS |
| Temperature × Water status × Species | NS | *** | NS | NS |


