Article

The AabHLH35 Transcription Factor Identified from Anthurium andraeanum is Involved in Cold and Drought Tolerance

Department of Horticulture, Nanjing Agricultural University, Nanjing 210095, China
*
Author to whom correspondence should be addressed.
These authors contributed equally to this work.
Plants 2019, 8(7), 216; https://doi.org/10.3390/plants8070216
Submission received: 21 June 2019 / Revised: 5 July 2019 / Accepted: 9 July 2019 / Published: 11 July 2019
(This article belongs to the Section Plant Molecular Biology)

Abstract

:
Anthurium andraeanum Lind. is a popular potted and cut-flower plant with an attractive spathe and foliage. It is native to tropical rainforest areas and is able to blossom throughout the year under suitable conditions. However, various abiotic stresses seriously restrict the ornamental value of A. andraeanum and increase the costs of cultivation. A dark green (dg) leaf color mutant of A. andraeanum ‘Sonate’, which accumulates high levels of anthocyanin, has shown increased vigor and tolerance to stresses during cultivation and is, thus, an ideal germplasm for studying stress tolerance in this species. Here, we show that the anthocyanin content in dg mutant plants at different stages of leaf development was higher than in wild-type (WT) plants, and the ability to tolerate under low-temperature (LT, 14 °C) stress was stronger in dg than in WT plants. RNA-Seq of cDNA libraries from young leaves of dg and WT identified AabHLH35 as a differentially expressed gene (DEG) that was significantly up-regulated in dg. Furthermore, heterologous expression of AabHLH35 improved tolerance to cold and drought stresses in Arabidopsis. These results have built an important molecular foundation for further study of stress tolerance in A. andraeanum.

1. Introduction

Anthurium andraeanum Lind. is a popular potted and cut-flower plant with an attractive spathe and foliage. It is native to tropical rainforest areas and is able to blossom throughout the year under suitable conditions, but abiotic stresses during cultivation, especially cold stress, are serious threats to its growth and development and compromise the economic and ornamental importance of this species. In our previous studies, we acquired a spontaneous leaf color mutant, dark green (dg), which originated from a leaf color chimera population of tissue culture-derived plantlets in A. andraeanum ‘Sonate’ [1]. During natural greenhouse growth, dg showed stronger growth vigor and more stress tolerance than wild-type (WT) plants (data not shown). Specifically, the chilling injury traits of WT plants were more obvious than those of dg at low temperature environment (Figure S1). However, the molecular mechanism in dg that improves plant tolerance to stresses remains elusive.
It has been found that several families of transcription factors (TFs) regulate gene expression in response to stress signals in plants. Among them, three kinds of TFs containing MYB, basic helix-loop-helix (bHLH) and WD repeat (WDR) domains form a complex (designated the MBW complex) that improves plant stress tolerance via an anthocyanin-dependent pathway [2], especially, bHLH proteins belong to one of the largest families of TFs that are involved in tolerance to a variety of abiotic stresses independent of anthocyanin accumulation, including salt [3], cold and freezing [4,5], drought and oxidative stress [5,6]. bHLH proteins contain a highly conserved DNA-binding domain and sequence-specific interaction domain. A typical bHLH domain consists of approximately 60 amino acids that include the basic region and the HLH region [7]. In Arabidopsis, ICE1 (INDUCER OF CBF EXPRESSION 1), a MYC-like bHLH gene, enhances freezing tolerance through binding to the CBF3 promoter [4]. AtbHLH112 is induced by salt, drought and abscisic acid (ABA) and mediates physiological responses to enhance stress tolerance [3]. AtbHLH68 also has a function in response to drought stress, likely through an ABA-dependent pathway [6]. In addition, bHLHs have been reported to play crucial roles in gene regulation upon abiotic stress in many non-model plants, such as Citrus sinensis [5], Chrysanthemum dichrum [8], Phalaenopsis aphrodite [9], Brassica campestris [10], Fagopyrum tataricum [11].
In this study, we speculated that some genes, especially TFs, play an important role in the improvement of stress resistance in dg. In order to find out the pivotal TFs related to stress tolerance differences between WT and dg mutant, we conducted transcriptome analysis through RNA-Seq and identified a differentially expressed TF gene, AabHLH35, which had the highest fold-increase in dg compared with WT (>17-fold). Further, we found that the AabHLH35 improved cold and drought stresses tolerance in transgenic Arabidopsis thaliana. The present study establishes an important molecular basis for further study of stress tolerance in A. andraeanum and is crucial for understanding the leaf color mutation mechanism in foliage plants.

2. Results

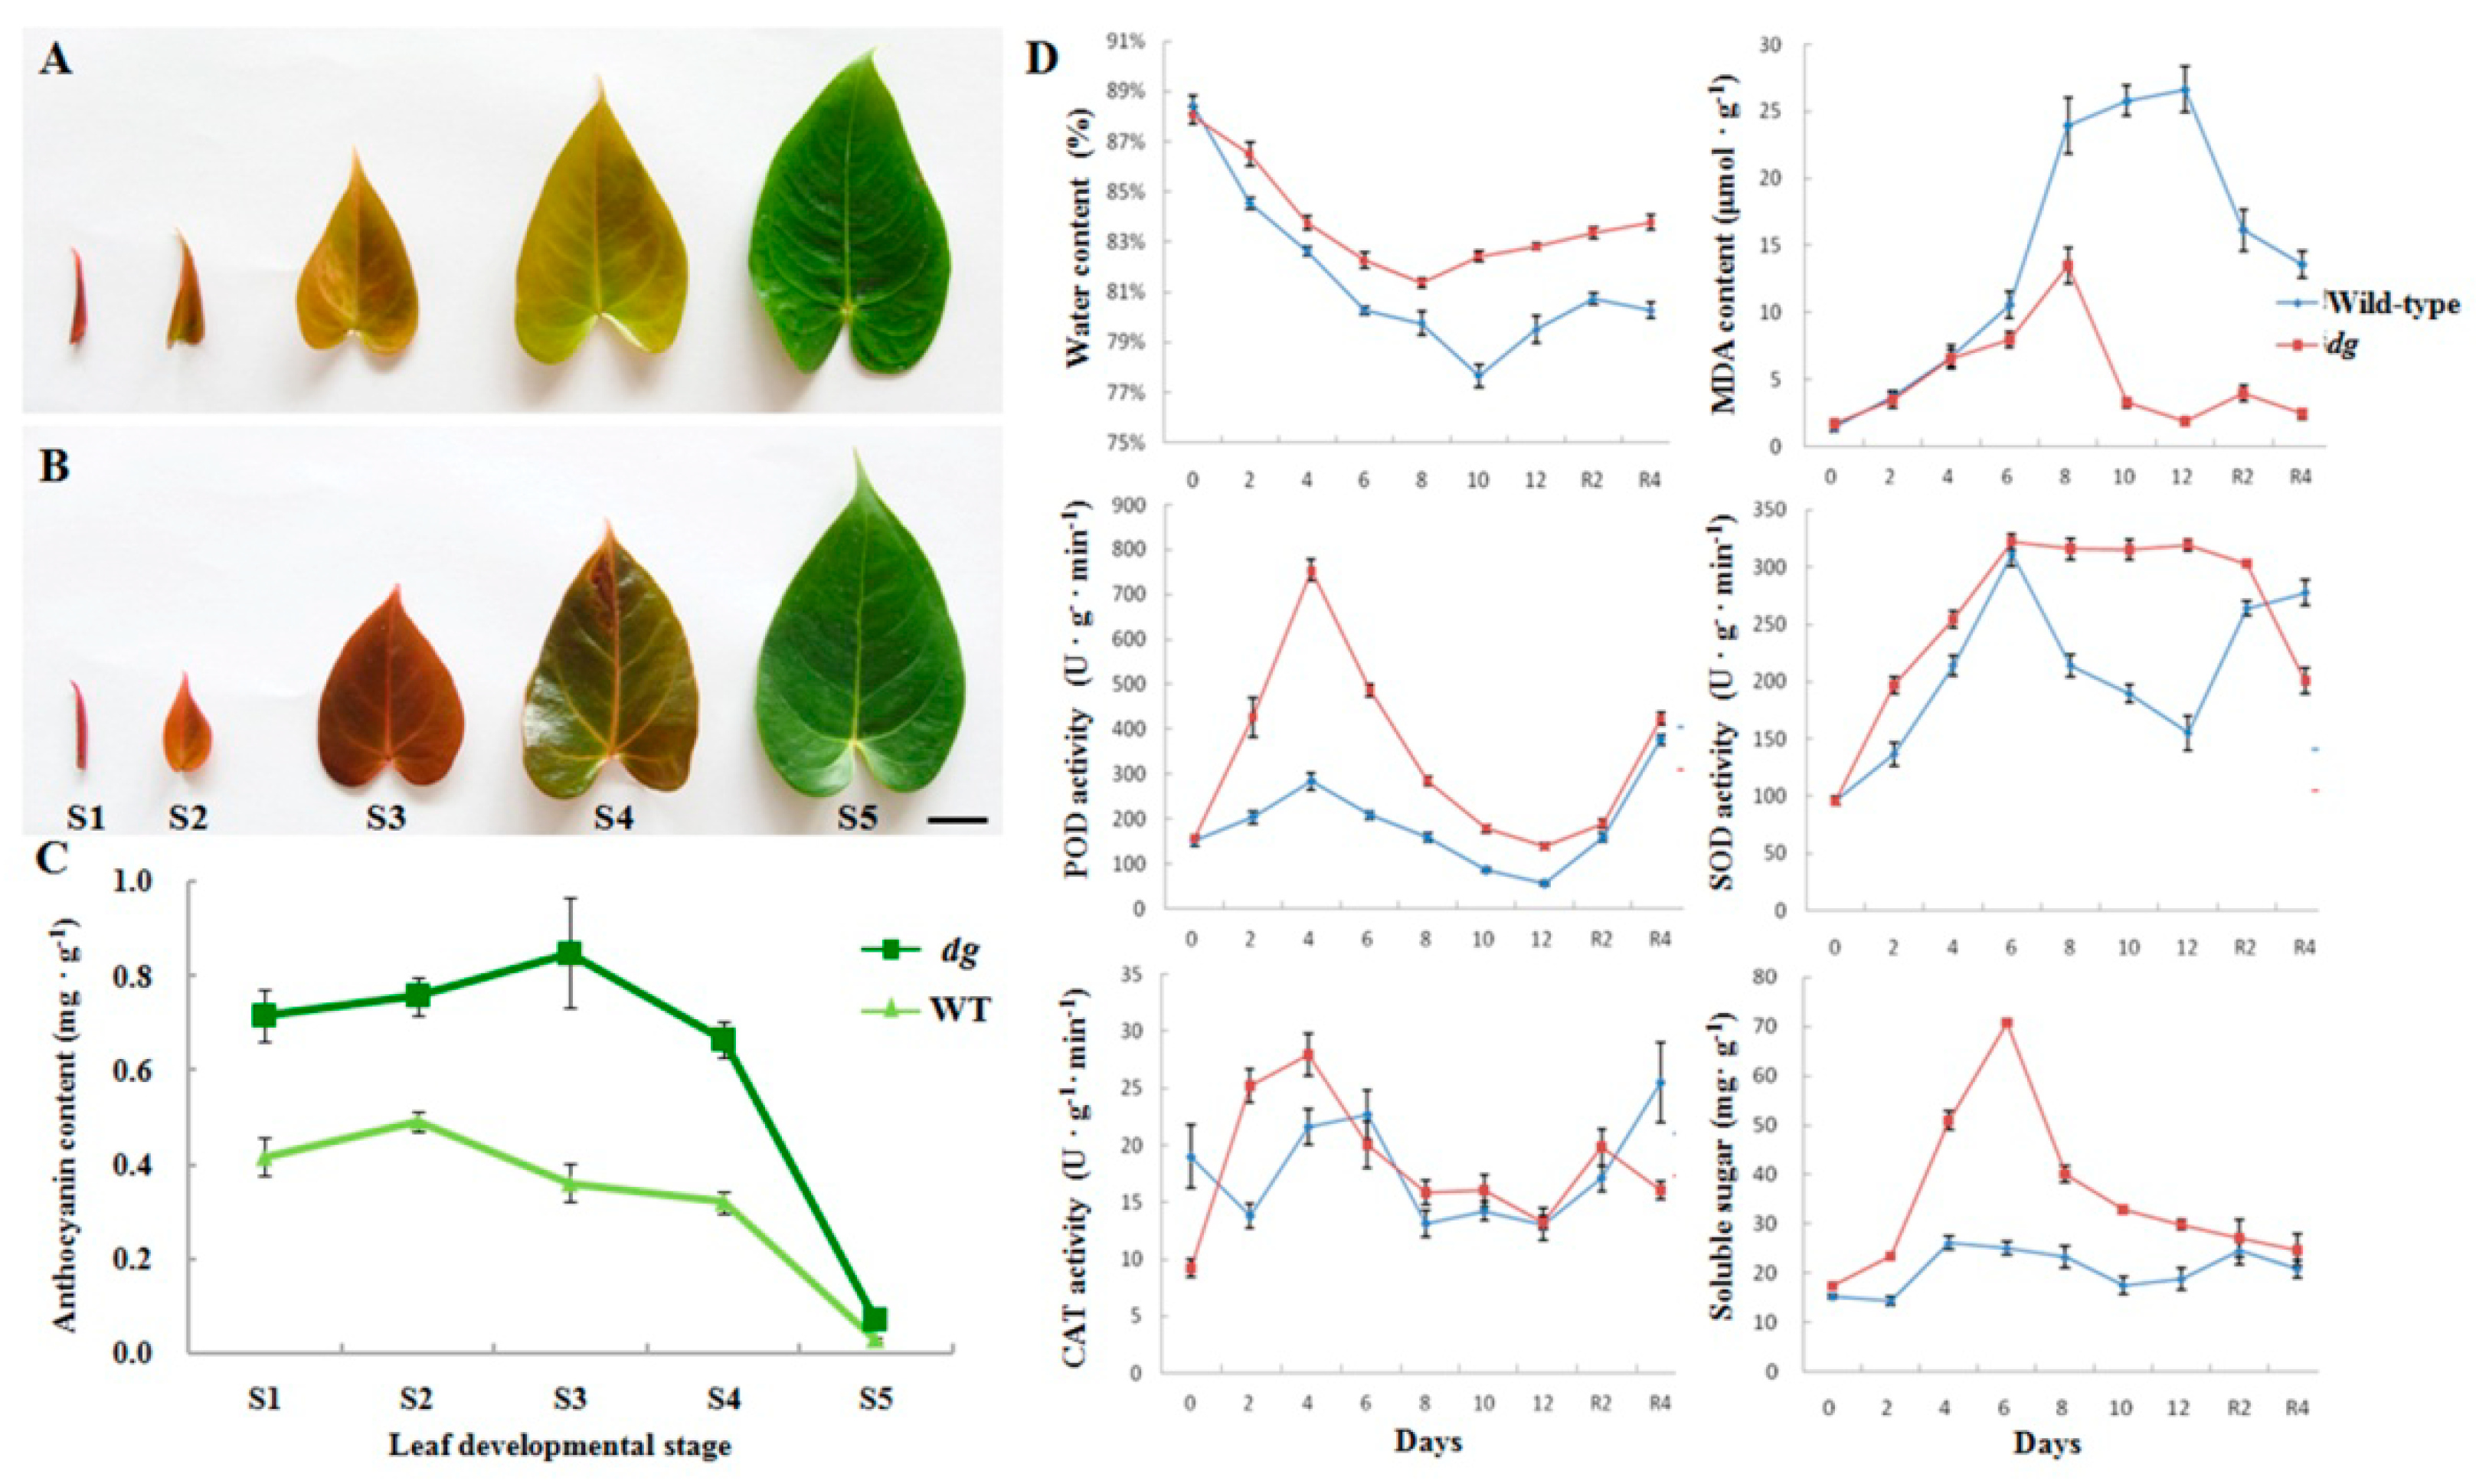
2.1. Effects of Low-Temperature Stress on dg Mutant and WT Plants of A. andraeanum ‘Sonate’

The leaf anthocyanin content of the dg mutant at different developmental stages (stages 1–5) was significantly higher than that in WT, except at stage 5 (Figure 1A–C). Given that anthocyanin production is closely related to stress tolerance, especially cold stress, the effects of low-temperature (LT, 14 °C) stress on dg and WT plants of A. andraeanum ‘Sonate’ were analyzed. The water content of both dg and WT plants decreased until day 8 (dg) and day 10 (WT), increased until day 12, and increased further when restored at 25 °C (Figure 1D). The decrease of water content in dg (from 88.0% down to 81.4%) was less than that in WT (from 88.5% down to 77.7%), which suggests that dg has stronger water retention ability under LT stress (Figure 1D). The malondialdehyde (MDA) level of dg at day 12 and after 4 d of restoration at 25 °C was close to the level observed before treatment, whereas the maximum MDA content of WT at 14 °C was twice that of dg and did not return to the pre-treatment level even after restoration (Figure 1D). These results showed that the degree of membrane lipid peroxidation in WT was greater than in dg, and that LT stress caused more cell membrane damage in WT, while dg had a more efficient free radical quenching system and could provide better protection against oxidative stress. The higher levels of peroxidase (POD), superoxide dismutase (SOD), catalase (CAT) and soluble sugars in dg relative to WT at most time points indicated that dg could adapt to LT stress better than WT through an increase in antioxidant enzyme activity and decrease in membrane damage (Figure 1D).

2.2. Analyses of Two Transcriptome Libraries and Differentially Expressed Genes (DEGs) between dg Mutant and WT Plants

In total, 22.2 and 29.8 million clean reads were acquired from the cDNA libraries of WT and dg mutant, respectively (Table S1). Among them, 16.1 and 21.1 million mapped reads were obtained from the WT (72.70%) and dg (70.73%) libraries, respectively (Table S1). A total of 105,737 transcripts with mean length of 1020.83 nt and 68,179 unigenes with mean length of 777.14 nt were obtained from the two libraries. The N50 lengths of transcripts and unigenes were 1747 and 1352, respectively, indicating their high assembly integrity (Table S2). The majority of unigenes in the two libraries were between 200 and 3000 nt in length, while some were longer than 3000 nt (Figure S2). In total, 24,035 annotated unigenes were ultimately confirmed through alignment of unigene sequences in various databases: the highest frequency of annotated unigenes (98.25%) was found in the Nr database (Figure S3). The Nr database BLAST of A. andraeanum unigenes against sequences from known species revealed that 22.52% of the unigenes showed the closest matches with sequences from Elaeis guineensis, followed by Phoenix dactylifera (20.14%), Nelumbo nucifera (10.49%), Musa acuminate (8.01%) and Vitis vinifera (5.76%) (Figure S4).
In total, we obtained 2565 DEGs, of which 1317 were significantly up-regulated and 1248 were significantly down-regulated in dg relative to WT (Figure S5). In a sample of 12 randomly selected DEGs, 5 exhibited lower expression and 7 showed higher expression in dg than in WT. All 12 of the selected genes displayed the same expression pattern in the transcriptome data as in qRT-PCR (Figure S6). The Pearson correlation coefficient between the qRT-PCR and RNA-Seq data for the selected genes was 0.866 (p < 0.01), suggesting that our transcriptome data were highly credible. Because bHLH-like TFs have important roles in plant stress tolerance, the 7 significantly differentially expressed bHLH-like genes from DEGs were examined (Table S3). The three most up-regulated TF genes were annotated as bHLH35-like (log2FC = 4.15), HEC1-like (log2FC = 3.55) and ILR3-like (log2FC = 1.23), and the two down-regulated TF genes were annotated as bHLH51-like (log2FC = −1.42) and bHLH113-like (log2FC = −1.40) (Table S3). Two bHLH TFs, ILR3 and MYC2, modulate stress responses under iron deficiency and jasmonate signaling, respectively [12,13]. Moreover, AtbHLH92 functions in plant responses to osmotic stresses in Arabidopsis [14]. This suggests that the bHLH35-like gene identified here, which was the most up-regulated TF gene in dg relative to WT, might have a positive role in stress tolerance.

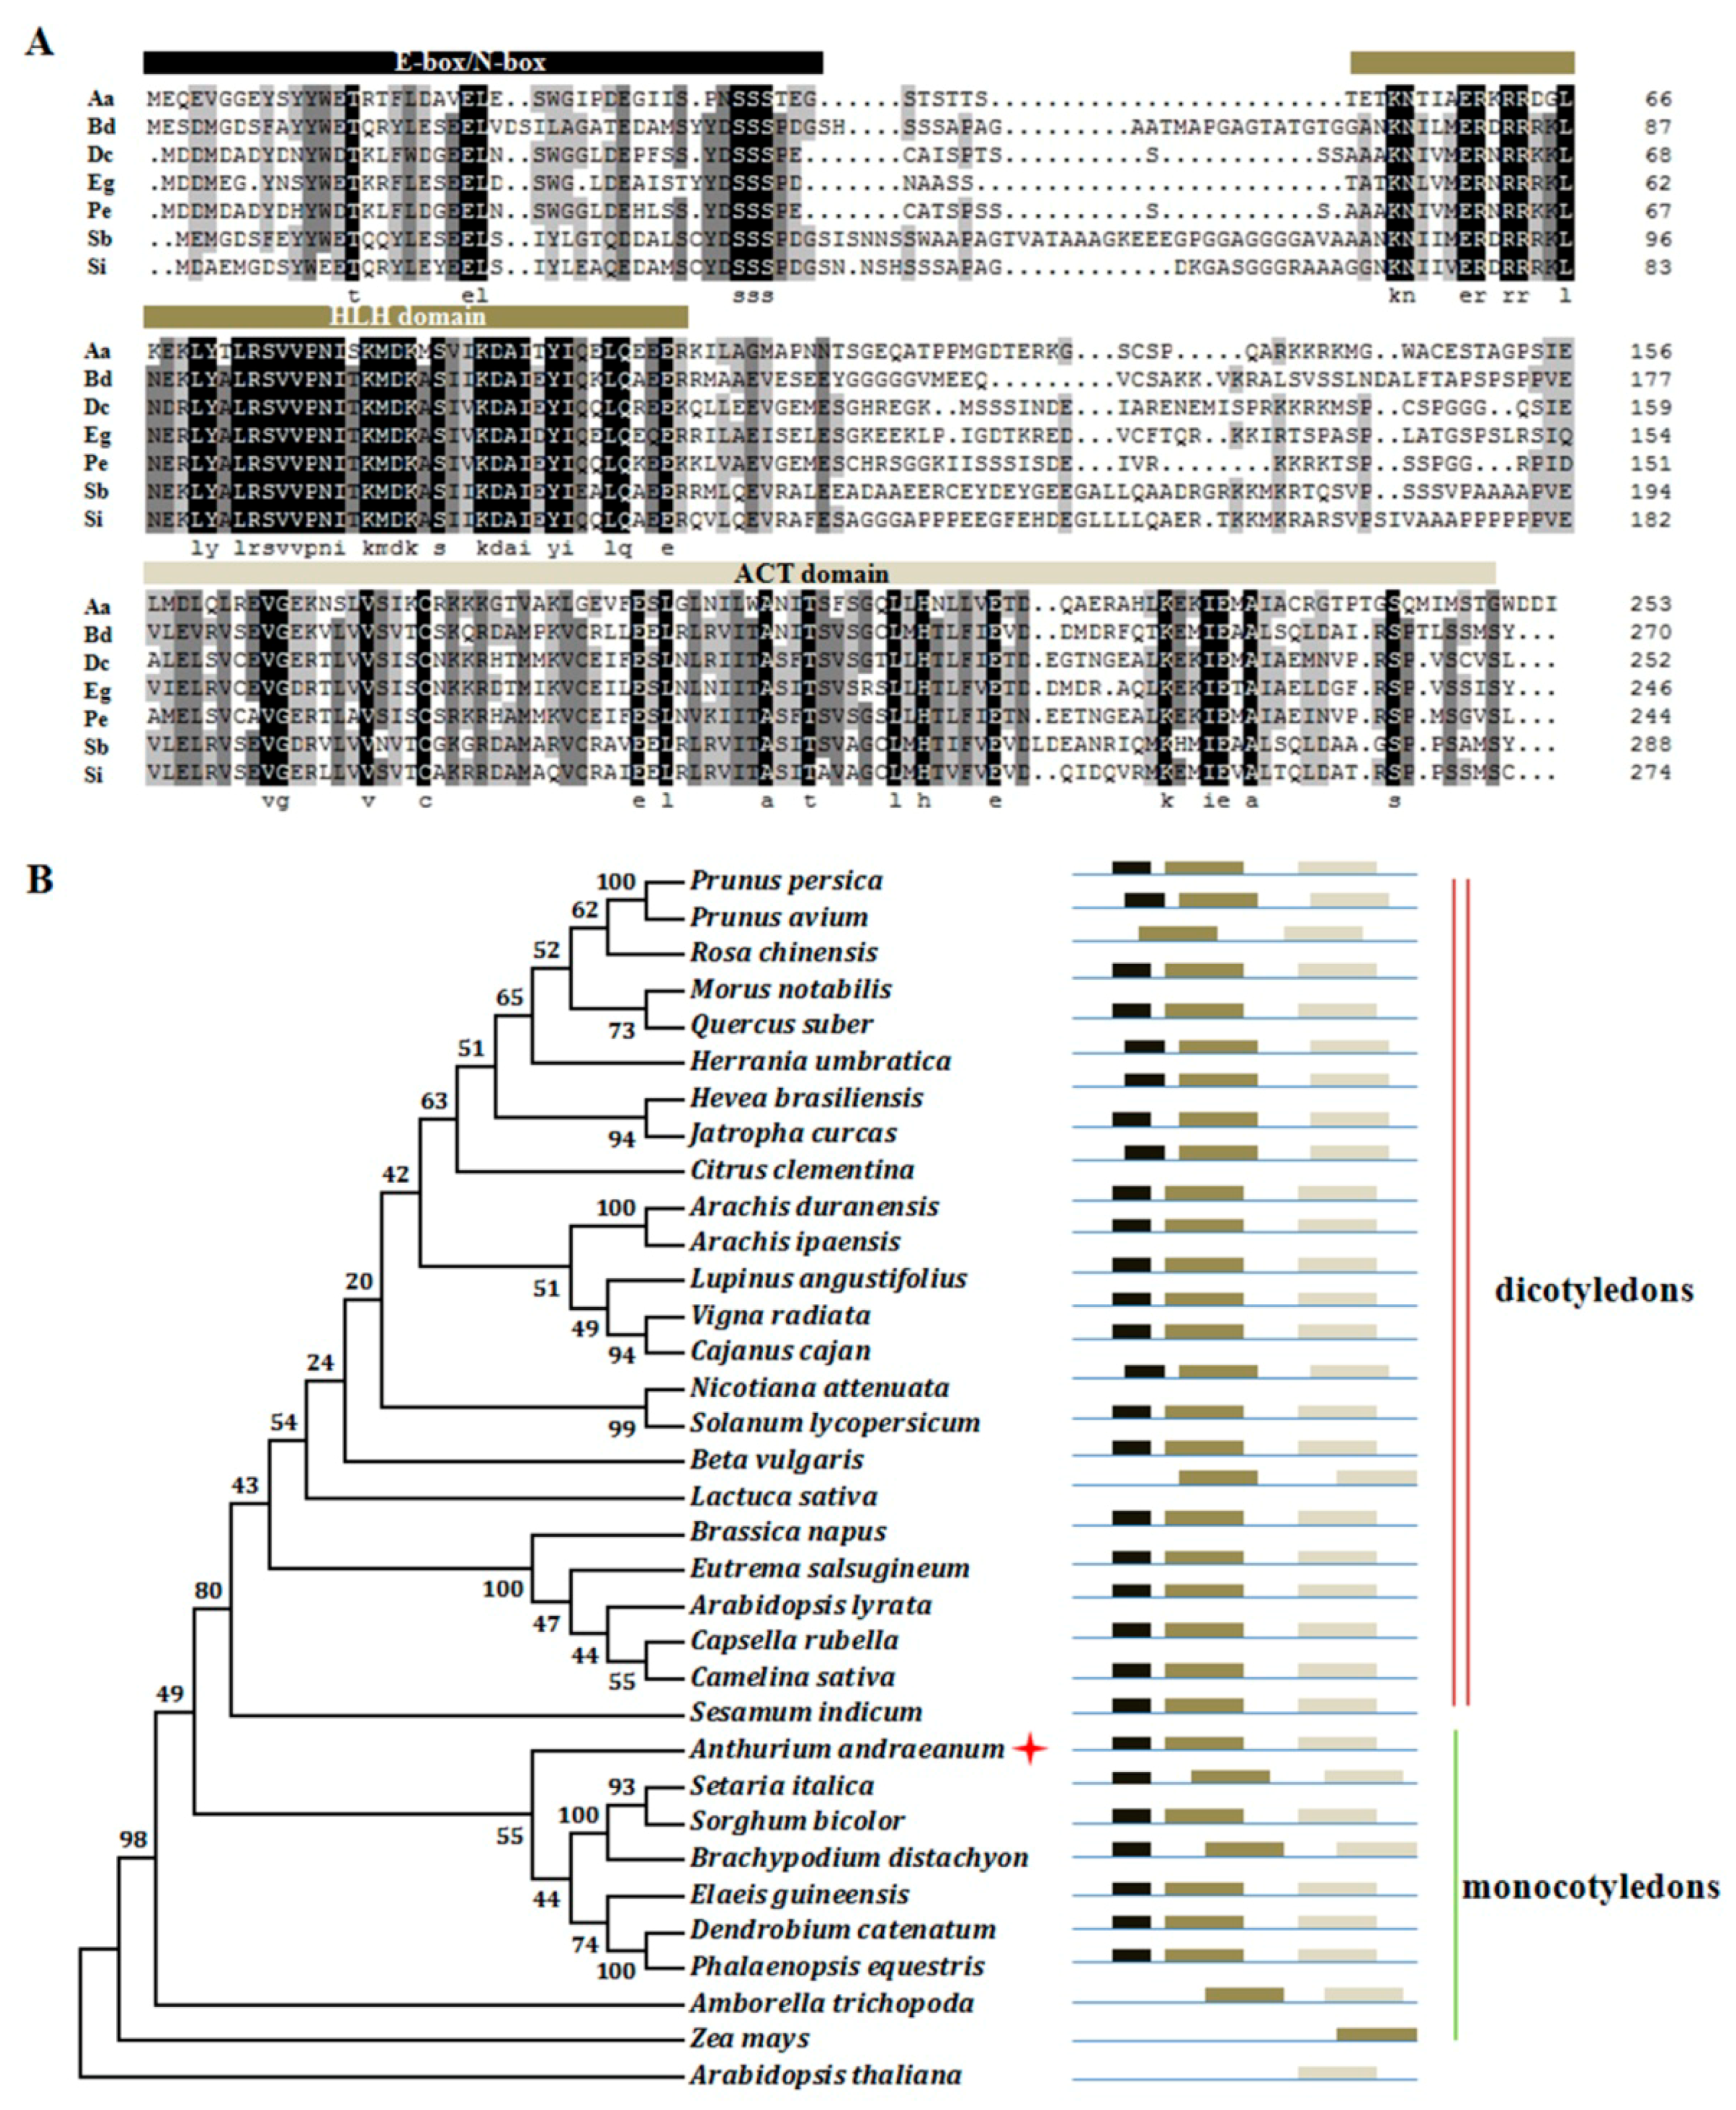
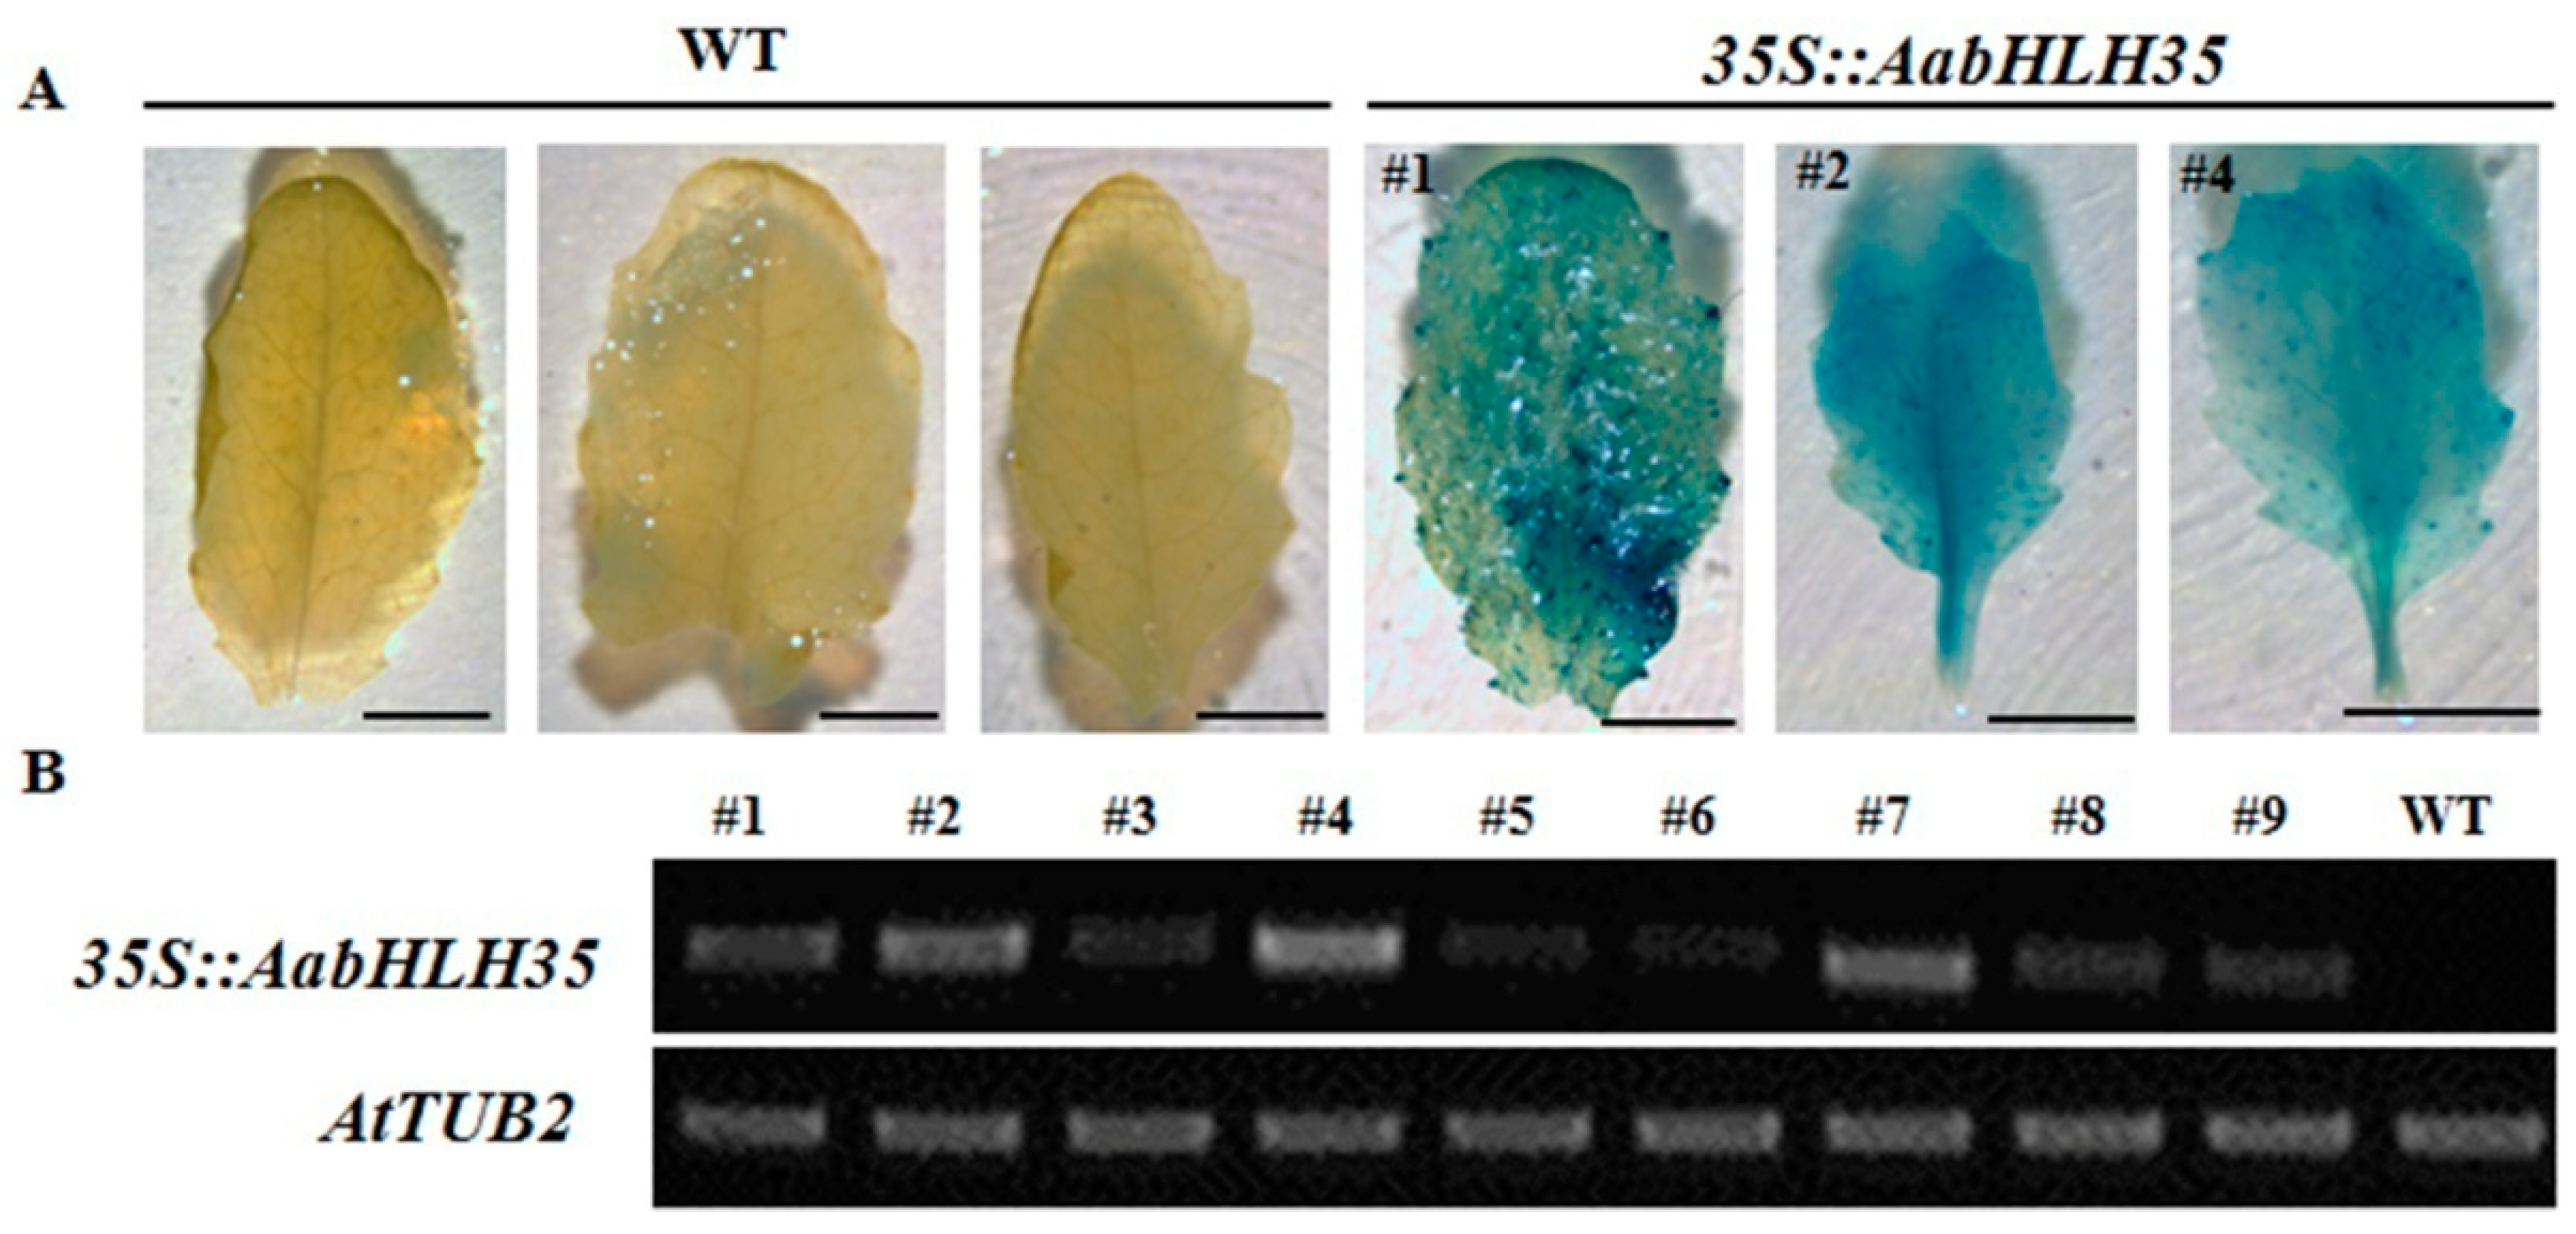
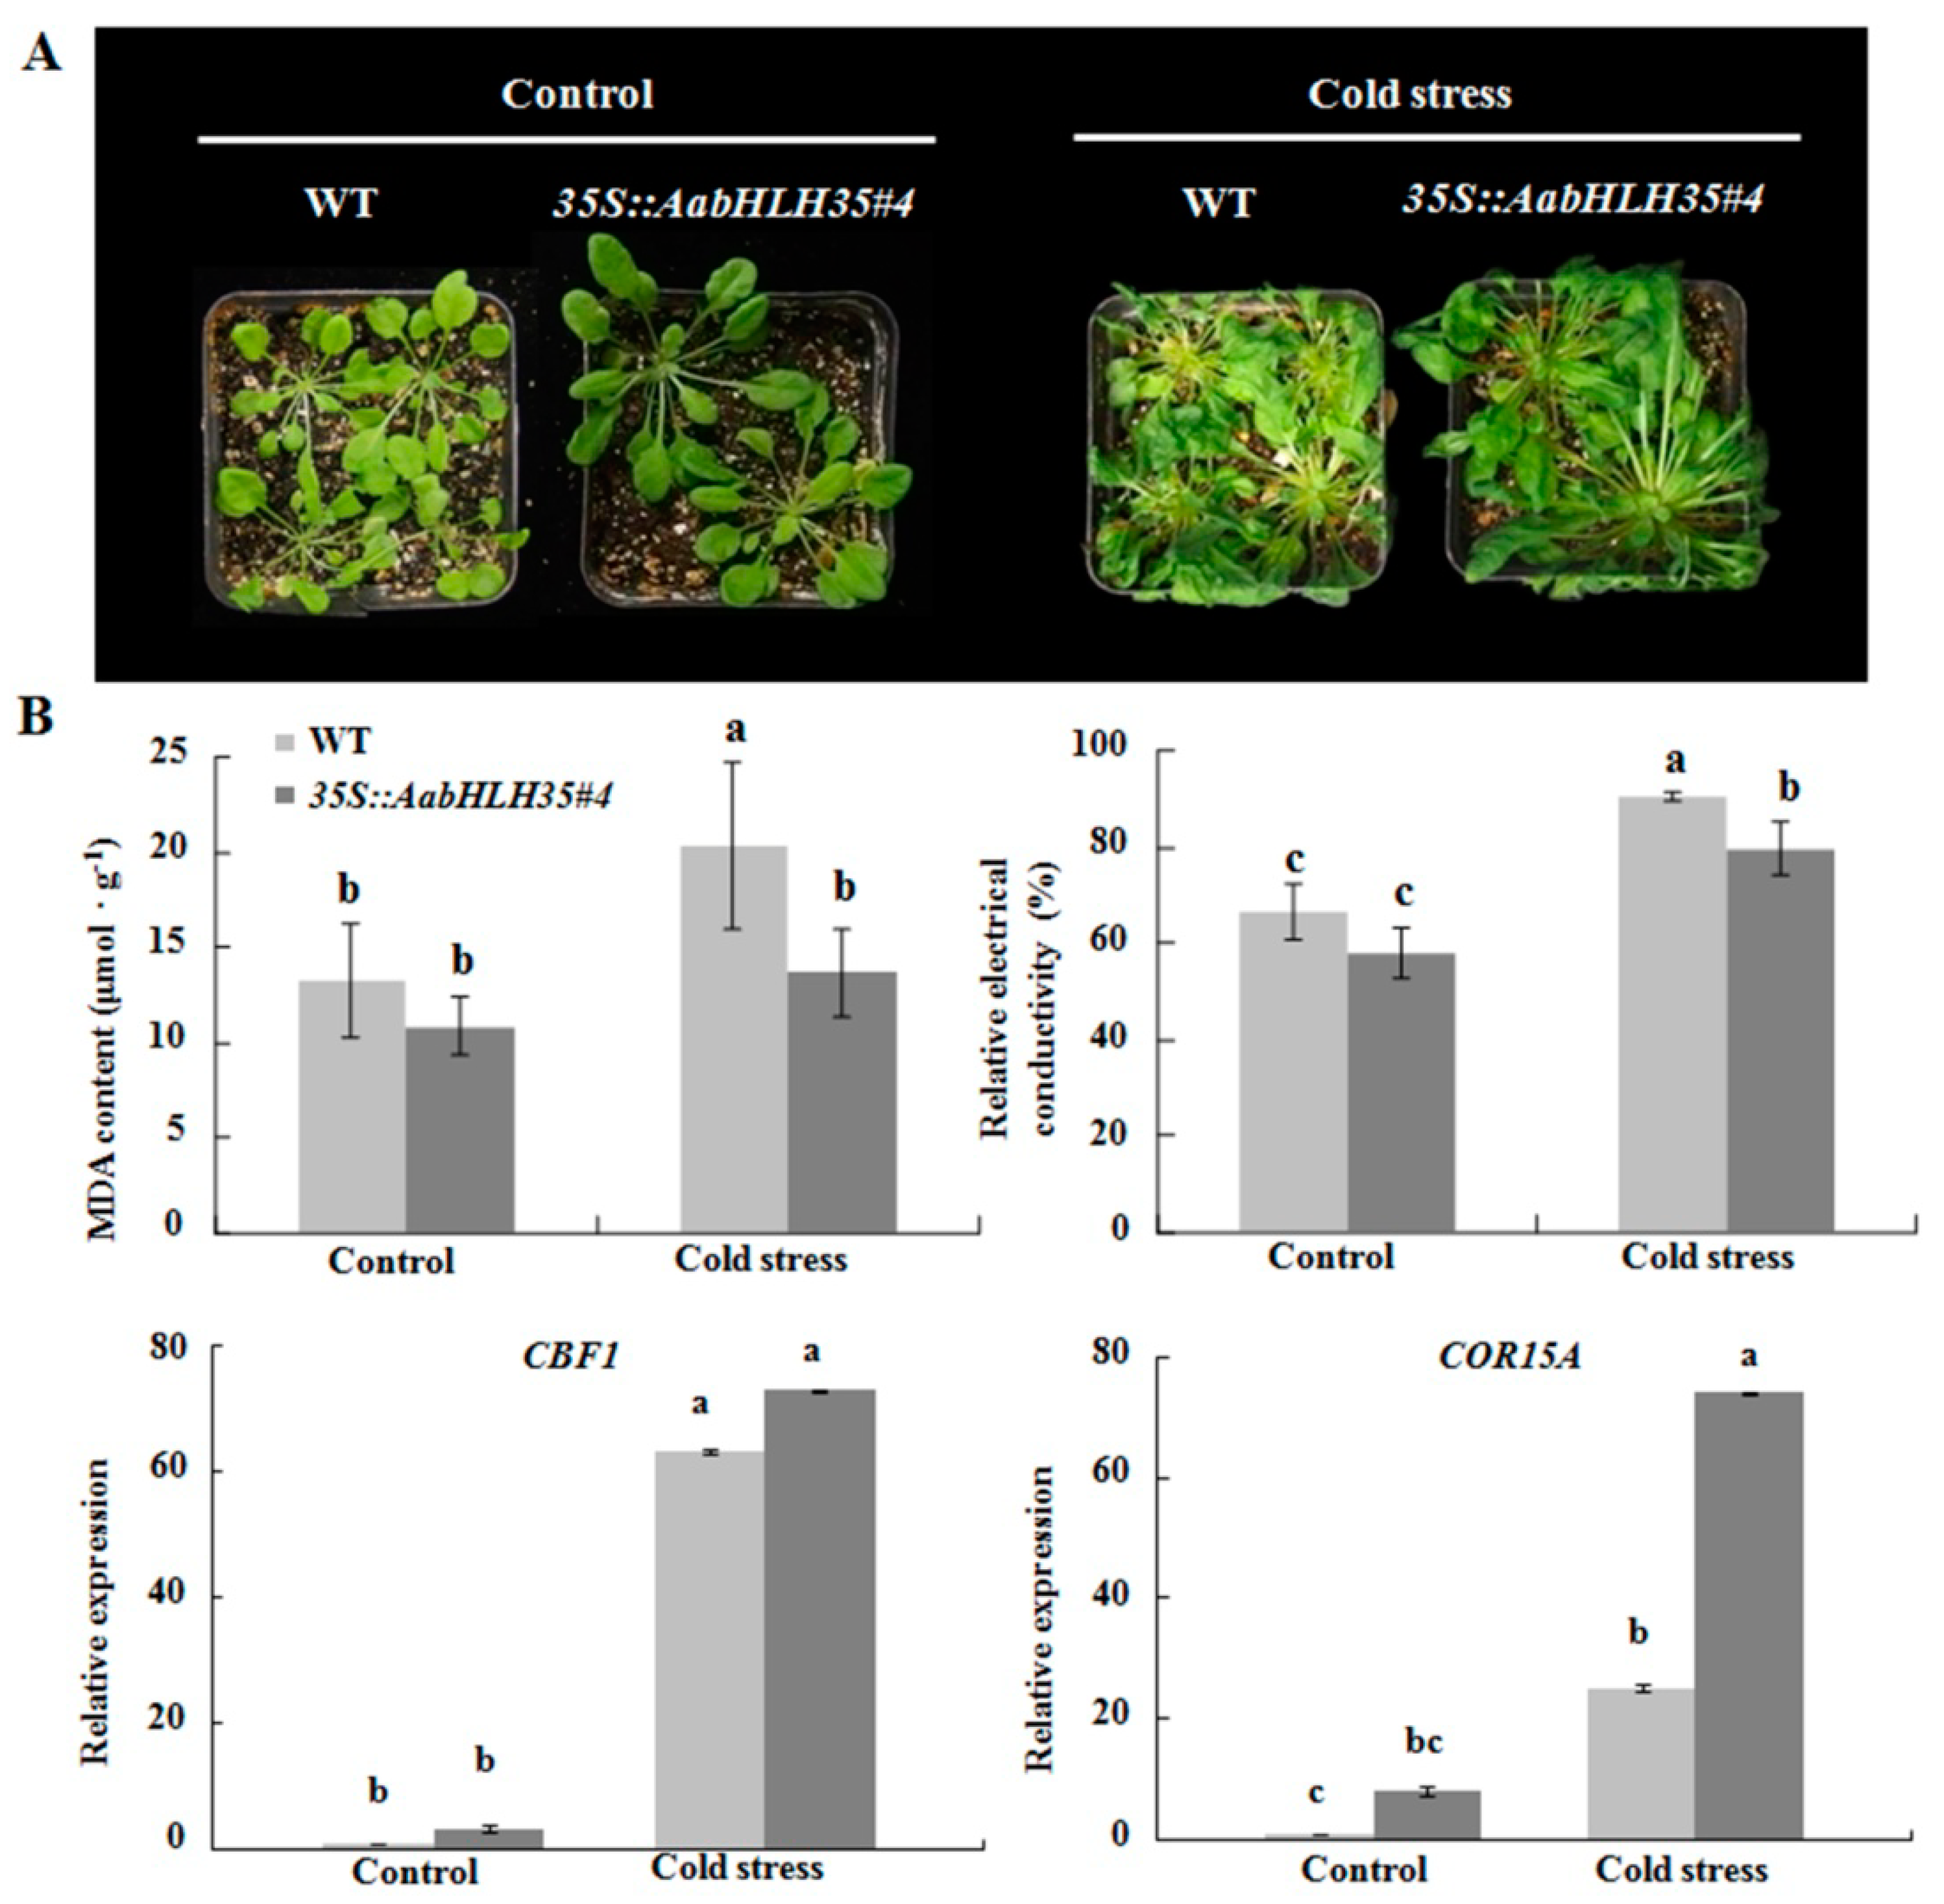
2.3. Isolation of AabHLH35 and Functional Analysis of AabHLH35

A coding sequence (CDS) of 765 bp encoding AabHLH35 (c59064.graph_c0) was isolated from A. andraeanum leaves. A conserved-domain analysis of the predicted protein sequence showed that AabHLH35 contained the E-box/N-box, HLH domain and ACT domain (Figure 2A). Phylogenetic analysis showed that AabHLH35 was clustered into the same subgroup with other bHLH35-like proteins in monocots, suggesting that AabHLH35 belongs to the bHLH family and that its function in A. andraeanum may be similar to that in other species (Figure 2B).
To investigate the function of AabHLH35 under abiotic stress, its coding sequence was heterologous expressed in wild-type Arabidopsis. Kanamycin-resistance screening and DNA analysis identified nine independent transgenic lines. GUS assay was performed to further verify the transgenic Arabidopsis (Figure 3A). Among them, a 35S::AabHLH35 transgenic line (#4) with strong levels of AabHLH35 expression was subjected to cold and drought stress treatments (Figure 3B).
To assess the cold stress tolerance of transgenic Arabidopsis, we investigated the phenotypic characteristics of 35S::AabHLH35 and WT plants under cold stress and normal growth condition (22 °C/20 °C, 12 h/12 h). Under normal condition, no significant differences were found between transgenic lines and WT plants (Figure 4A). Under cold stress, the leaves of WT Arabidopsis began to turn yellow and showed severe wilting. However, the growth vigor of transgenic plants was significantly better than that of WT plants, although the leaves of 35S::AabHLH35 also displayed wilting to a certain extent (Figure 4A). The MDA content and relative electrical conductivity in cold-stressed 35S::AabHLH35 were significantly lower than those in WT plants, also indicating better cold tolerance (Figure 4B). In Arabidopsis, C-REPEAT/DRE BINDING FACTOR 1 (CBF1), a regulator of COR (cold-regulated) gene, controlled the level of COR gene expression, which in turn promoted tolerance to freezing [15]. Heterologous expression of cold-regulated 15A (COR15A) gene enhanced chilling tolerance in transgenic eggplant (Solanum melongena L.) [16]. In this study, the expression of CBF1 and COR15A was significantly up-regulated in both WT and 35S::AabHLH35 transgenic plants under cold stress compared to the unstressed control. Furthermore COR15A displayed almost 3-fold higher expression in 35S::AabHLH35 than in WT under cold stress, illustrating that AabHLH35 may promote COR15A expression in response to cold stress (Figure 4B).
Under drought stress, the leaves of WT displayed more shrinkage, wilting and dehydration than leaves of transgenic line #4 (Figure 5A). The MDA content was significantly lower in 35S::AabHLH35 than in WT under drought stress (Figure 5B). The expression of a drought-responsive gene, SHORT VEGETATIVE PHASE (SVP) [17], was significantly higher in 35S::AabHLH35 than in WT regardless of drought stress treatment (Figure 5B). Drought stress did not induce any significant change in transcript levels of ABSCISIC ACID-DEFICIENT 4 (ABA4) in WT plants (Figure 5B). However, the expression of ABA4 was significantly higher in 35S::AabHLH35 under drought stress (Figure 5B). It was previously reported that aba4 mutants lead to increase water loss rate compared to WT under rapid dehydration, which is consistent with our results on the activation of ABA4 expression and in turn promotion of tolerance to drought in 35S::AabHLH35 transgenic lines [18]. These results indicated that AabHLH35 dependent or independent drought stress induced the expression of ABA4 and SVP to improve drought stress tolerance.

3. Discussion

In this study, we performed de novo transcriptome comparisons between A. andraeanum dg mutant and WT plants to identify key DEGs, from which we isolated and characterized a bHLH35-like gene, AabHLH35. First, we found that anthocyanin contents were much higher in the leaves of dg mutant than in WT (Figure 1) and that 11 anthocyanin-metabolism-related genes were significantly up-regulated in dg mutant plants relative to WT (Table S4).
Next, we found that the majority of MYB-, bHLH- and WDR-like TFs corresponding to the DEGs (both up- and down-regulated) was involved in plant development and stress response (Table S3). Two bHLH TFs, ILR3 and MYC2, modulate stress responses under iron deficiency and jasmonate signaling, respectively [12,13]. Moreover, AtbHLH92 functions in plant responses to osmotic stresses in Arabidopsis [14]. Notably, OsbHLH35 was involved in response to salinity stress in rice [19], and overexpressing PebHLH35 from Populus euphratica improved drought tolerance in Arabidopsis [20]. In addition, bHLH35-like gene expression was positively correlated with anthocyanin accumulation in pear [21]. In the present study, AabHLH35 displayed 17-fold higher expression in dg than in WT (Table S3). Given that both anthocyanin accumulation and cold tolerance in dg are stronger than in WT (Figure 1), we speculate that AabHLH35 plays a major role in stress responses in A. andraeanum.
Members of the bHLH TF family were previously reported to regulate anthocyanin accumulation and improve stress tolerance in various species [22,23]. The overexpression of AabHLH35 in Arabidopsis enhanced abiotic stress tolerance, especially, the tolerance to cold and drought stresses in 35S::AabHLH35 transgenic lines was improved compared to that in WT Arabidopsis (Figure 4, Figure 5). However, under cold or drought stress, there was no obvious difference in anthocyanin content between transgenic plants and WT (data not shown), illustrating that AabHLH35 may play a role in stress tolerance through anthocyanin-independent pathways.

4. Materials and Methods

4.1. Plant Materials and Growth Conditions

The wild-type (normal green type, WT) and leaf color mutant (dark green type, dg mutant) were grown in a standard greenhouse at Nanjing Agricultural University (Nanjing, Jiangsu Province, China). Spray watering, fertilizer management and disease and pest control were performed using standard methods [24]. Five stages (stages 1–5) of leaves from WT and dg were classified on the basis of leaf size and pigment accumulation and used for anthocyanin determination. A. andraeanum plants with consistent growth under a 12-h photoperiod (180 μmol m−2 s−1 light intensity) at 25 °C were used for cold stress treatment (14 °C for 12 days and recovery at 25 °C for 4 days). Samples were frozen in liquid nitrogen and stored at −80 °C until use.
The wild-type Arabidopsis Columbia ecotype (Col-0) was used for transgenic plant analysis. Seedlings at the two-true-leaf stage were transplanted into soil and placed in a light incubator under a 12-h photoperiod (150 μmol m−2 s−1 light intensity) with 22 °C/20 °C light/dark temperatures. As many inflorescences as possible (with the exception of blooming flowers) were used for transformation.

4.2. Measurement of Physiological Indexes in A. andraeanum

Anthocyanin extraction was performed as previously described and anthocyanin content was detected by the pH differential method [25,26]. Water content was determined by drying weighing method. The samples were fixed at 105 °C for 30 min and dried at 70 °C until constant weight in the oven. Water content = (W1−W2)/W1 × 100%. W1 stands for leaves fresh weight and W2 for leaves dry weight. MDA content was determined by thiobarbituric acid (TBA) method. 0.1 g of leaves was ground to homogenate by adding 2.0 mL 5% trichloroacetic acid (TCA) and centrifuged at 3000 r min−1 for 20 min. And then 1.5 mL supernatant was added 1.5 mL 0.67% TBA solution with mixing well, boiling for 30 min and cooling quickly in ice bath. The absorbance at 600 nm, 532 nm and 450 nm was measured after centrifugation at 3000 r min−1 for 10 min at 4 °C. MDA concentration (C) = 6.45 × (OD532 − OD600) − 0.56 × OD450 and MDA content = (C VT) / (W V1). VT stands for total volume of enzyme solution, W for fresh weight and V1 for volume of enzyme solution for determination. POD activity, SOD activity, and CAT activity were determined by guaiacol chromogenic method, photochemical reduction of nitroblue tetrazole (NBT) method and ultraviolet absorption method, respectively. Soluble sugar content was determined by anthrone colorimetry [27]. All measurements were performed on three biological replicates and significance analyses were performed using SPSS 10.0 software (IBM, USA).

4.3. RNA Extraction, Library Construction and RNA-Seq Analysis

Total RNA was extracted from WT and dg leaves (stage 2) using an improved cetyltrimethylammonium ammonium bromide (CTAB) method [28]. The concentration, purity and integrity of total RNA were identified with a NanoDrop 2000 (Thermo Fisher, USA), Qubit 2.0 (Thermo Fisher, USA) and Agilent 2100 (Agilent, USA), respectively. A total of 1 μg RNA was used for library construction. Sequencing libraries were generated using NEBNext®Ultra™ RNA Library Prep Kit for Illumina®(NEB, USA) following manufacturer’s recommendations and index codes were added to attribute sequences to each sample. Briefly, mRNA was purified from total RNA using poly-T oligo-attached magnetic beads. Fragmentation was carried out using divalent cations under elevated temperature in NEBNext First Strand Synthesis Reaction Buffer (5X). First strand cDNA was synthesized using random hexamer primer and M-MuLV Reverse Transcriptase. Second strand cDNA synthesis was subsequently performed using DNA Polymerase I and RNase H. Remaining overhangs were converted into blunt ends via exonuclease/polymerase activities. After adenylation of 3’ ends of DNA fragments, NEBNext Adaptor with hairpin loop structure were ligated to prepare for hybridization. In order to select cDNA fragments of preferentially 240 bp in length, the library fragments were purified with AMPure XP system (Beckman Coulter, Beverly, USA). Then 3 μl USER Enzyme (NEB, USA) was used with size-selected, adaptor-ligated cDNA at 37 °C for 15 min followed by 5 min at 95 °C before PCR. Then PCR was performed with Phusion High-Fidelity DNA polymerase, Universal PCR primers and Index (X) Primer. At last, PCR products were purified (AMPure XP system) and library quality was assessed on the Agilent Bioanalyzer 2100 system. The libraries were sequenced on an Illumina HiSeq X Ten platform and the paired-end sequencing read length was PE150. The sequencing work was completed by Biomarker Technologies Corporation (Beijing, China).
Raw data (raw reads) of fastq format were firstly processed through in-house perl scripts. In this step, ploy-N and low-quality reads and adapter sequences from the raw data were removed to obtain clean data (clean reads). Meanwhile, Q20, Q30, GC-content and sequence duplication level of the clean data were calculated. All the downstream analyses were based on clean data with high quality. For each sample, the clean reads were assembled using Trinity software with min_kmer_cov set to 2 by default and all other parameters set default to acquire transcript and unigene libraries [29]. The full data sets have been submitted to the Sequence Read Archive (SRA) database of NCBI under accession SRP148842, BioProject: PRJNA472850. The unigenes function was annotated against the NR (NCBI non-redundant protein sequences), Swiss-Prot (A manually annotated and reviewed protein sequence database), GO (Gene Ontology), KOG/COG/eggNOG (Clusters of Orthologous Groups of proteins), KEGG (Kyoto Encyclopedia of Genes and Genomes) and Pfam (Protein family) databases using BLAST [30] with a cutoff of E-value < 1e-05 and HMMER [31] with a cutoff of E-value < 1e−10. Differential expression analysis of two libraries was performed using EBSeq [32]. The significant p-value obtained from the original hypothesis test was adjusted by the Benjamini–Hochberg method [33], and finally, the corrected p-value, i.e., the FDR (False Discovery Rate), was used as the key index for screening DEGs. FDR < 0.05 & |log2 fold change (FC)| > 1 was set as the threshold for significantly differential expression. The edgeR package was used to draw an MA map of the DEGs [34].

4.4. Gene Expression Analysis

SYBR Premix Ex TaqTM II (Til RNaseH Plus) (Takara, Japan) and QuantStudioTM 3 Real-Time PCR Systems (ABI, USA) were used for real-time quantitative reverse transcription PCR (qRT-PCR) analyses. The housekeeping gene glyceraldehyde-3-phosphate dehydrogenase (GAPDH) was used as an internal reference to normalize the expression data. The 2−∆∆Ct method was used to calculate the relative expression level [35], and the standard deviation was calculated from three biological replicates. The t-test (p < 0.05) was selected for statistical analysis. Three biological and three technical replicates were performed for each gene. Leaves of 35S::AabHLH35 and wild-type Arabidopsis were frozen in liquid nitrogen and stored at −80 °C for semi-quantitative RT-PCR analysis. Total RNA extraction and reverse transcription methods were the same as those used for qRT-PCR. Arabidopsis tubulin (AtTUB2) and actin (AtActin2) genes were used as internal controls. Each gene expression analysis was performed at least three times. The gene-specific primers are listed in Supplementary Table S5.

4.5. Cloning of AabHLH35 and Amino Acid Sequence Analysis

Total RNA was extracted from young dg leaves (stage 2) using a modified CTAB method [28]. cDNA was synthesized using TransScript One-Step gDNA Removal and cDNA Synthesis SuperMix (TransGen, China). The coding sequence (CDS) of AabHLH35 was obtained using gene-specific primers (Table S5).
The amino acid sequences of related bHLH35-like proteins in various species were obtained by Protein BLAST searches (https://blast.ncbi.nlm.nih.gov/Blast.cgi). The conserved domains analysis was performed with DNAMAN software (Lynnon Biosoft, USA). A phylogenetic tree based on amino acid sequences was constructed using the neighbor-joining (NJ) method via MEGA4 software [36,37].

4.6. Heterologous Expression of AabHLH35 and Abiotic Stresses in Arabidopsis

The full-length CDS of AabHLH35 was amplified by PCR and then inserted into the XbaI and BamHI sites of the pBI121 vector, which carries the 35S promoter and β-glucuronidase (GUS) reporter gene. The recombinant plasmid was introduced into Agrobacterium strain EHA105 and transformed into Arabidopsis wide-type (Col-0) plants through the floral dip method [38]. The transgenic plants were screened on Murashige and Skoog (MS) medium with 75 mg L−1 kanamycin and confirmed by GUS assay and PCR amplification assay. The acquired kanamycin-resistant plants were used for subsequent analysis. The primers for vector construction are listed in Table S5.
For cold stress treatment, 4-week-old 35S::AabHLH35#4 and WT plants grown in soil were placed in a light incubator at 4 °C for 6 h and 0 °C for 1 h. MDA content and relative electrical conductivity (a measure of intracellular electrolyte exosmosis) were detected after resuming growth under a 12-h photoperiod and 22 °C/20 °C light/dark temperatures for 24 h. For drought stress treatment, 3-week-old 35S::AabHLH35#4 and WT plants grown in soil were placed in a light incubator (22 °C/20 °C light/dark and 12-h photoperiod). One week after growing under normal conditions, the drought treatment was conducted by natural drought (withholding water). Phenotypic observation, MDA content determination and gene expression analysis were performed after withholding water for 15 d.

5. Conclusions

The results of this study demonstrated that a bHLH TF, denoted as AabHLH35, was identified in A. andraeanum through RNA-Seq from WT and dg mutant. AabHLH35 was higher expressed in dg than in WT plants, suggesting it may be related to stress resistance as a differential gene. In addition, heterologous expression of CDS (765 bp) of AabHLH35 in Arabidopsis improved cold and drought tolerance, which is useful for improving abiotic stress tolerance in the cultivation and production of A. andraeanum and possibly other ornamentals. However, the specific molecular regulation mechanisms in abiotic stress tolerance remain elusive and need further investigation.

Supplementary Materials

The following are available online at https://www.mdpi.com/2223-7747/8/7/216/s1, Figure S1: The phenotype of wild-type (WT) and dark green (dg) mutant of A. andraeanum ‘Sonate’ under cold stress. Upper row, the WT treated for 0 h (a), 12 h (b), 24 h (c), 48 h (d); Lower row, the dg treated for 0 h (e), 12 h (f), 24 h (g), 48 h (h), Figure S2: Unigene length distribution from transcriptome libraries of A. andraeanum ‘Sonate’ WT and dg mutant, Figure S3: Summary statistics of functional annotation for A. andraeanum unigenes in various databases. Statistics include unigenes from both WT and dg mutant, Figure S4: Species distribution of Nr database homologs of unigenes from A. andraeanum ‘Sonate’, Figure S5: MA map of differentially expressed genes (DEGs) in dg vs WT plants. FPKM indicates fragments per kilobase of transcript per million mapped reads, Figure S6: Expression verification of differentially expressed genes (DEGs) in dg vs WT by qRT-PCR. The error bars represent ± SD (n = 3), Table S1: Summary of transcriptome sequencing data, Table S2: Overview of the assembly results from transcriptome of A. andraeanum ‘Sonate’ leaf, Table S3: List of significantly differentially expressed transcription factor genes in WT and dg mutant, Table S4: Differentially expressed genes (DEGs) of anthocyanin metabolism pathway between WT and dg mutant of A. andraeanum ‘Sonate’, Table S5: Primers used in this study.

Author Contributions

L.J., X.T., S.L., Y.F. and J.X. performed the experiments. L.J., X.T., and G.W. designed the research and wrote the manuscript. All authors approved the final manuscript.

Funding

This work was supported by the National Natural Science Foundation of China (Grant No. 30871725).

Conflicts of Interest

The authors declare no conflict of interest.

References

  1. Xu, B.; Xin, W.J.; Wang, G.D.; Guo, W.M.; Wen, F.D.; Jin, J.P. Characteristics of chimeras of Anthurium andraeanum from in vitro mutation. Chin Bull. Bot. 2006, 23, 698–702. [Google Scholar]
  2. Xu, W.J.; Dubos, C.; Lepiniec, L. Transcriptional control of flavonoid biosynthesis by MYB-bHLH-WDR complexes. Trends Plant Sci. 2015, 20, 176–185. [Google Scholar] [CrossRef] [PubMed]
  3. Liu, Y.J.; Ji, X.Y.; Nie, X.G.; Qu, M.; Zheng, L.; Tan, Z.L.; Zhao, H.M.; Huo, L.; Liu, S.N.; Zhang, B.; et al. Arabidopsis AtbHLH112 regulates the expression of genes involved in abiotic stress tolerance by binding to their E-box and GCG-box motifs. New Phytol. 2015, 207, 692–709. [Google Scholar] [CrossRef] [PubMed]
  4. Chinnusamy, V.; Ohta, M.; Kanrar, S.; Lee, B.H.; Hong, X.H.; Agarwal, M.; Zhu, J.K. ICE1: A regulator of cold-induced transcriptome and freezing tolerance in Arabidopsis. Gene Dev. 2003, 17, 1043–1054. [Google Scholar] [CrossRef] [PubMed]
  5. Geng, J.J.; Liu, J.H. The transcription factor CsbHLH18 of sweet orange functions in modulation of cold tolerance and homeostasis of reactive oxygen species by regulating the antioxidant gene. J. Exp. Bot. 2018, 69, 2677–2692. [Google Scholar] [CrossRef] [PubMed] [Green Version]
  6. Le Hir, R.; Castelain, M.; Chakraborti, D.; Moritz, T.; Dinant, S.; Bellini, C. AtbHLH68 transcription factor contributes to the regulation of ABA homeostasis and drought stress tolerance in Arabidopsis thaliana. Physiol. Plantarum 2017, 160, 312–327. [Google Scholar] [CrossRef] [PubMed]
  7. Murre, C.; Mccaw, P.S.; Baltimore, D. A new DNA binding and dimerization motif in immunoglobulin enhancer binding, daughterless, MyoD and myc proteins. Cell 1989, 56, 777–783. [Google Scholar] [CrossRef]
  8. Chen, L.; Chen, Y.; Jiang, J.; Chen, S.; Chen, F.; Guan, Z.; Fang, W. The constitutive expression of Chrysanthemum dichrum ICE1 in Chrysanthemum grandiflorum improves the level of low temperature, salinity and drought tolerance. Plant Cell Rep. 2012, 31, 1747–1758. [Google Scholar] [CrossRef]
  9. Peng, P.; Lin, C.; Tsai, H.; Lin, T. Cold response in Phalaenopsis aphrodite and characterization of PaCBF1 and PaICE1. Plant Cell Physiol. 2014, 55, 1623–1635. [Google Scholar] [CrossRef]
  10. Zhang, T.; Mo, J.; Zhou, K.; Chang, Y.; Liu, Z. Overexpression of Brassica campestris BcICE1 gene increases abiotic stress tolerance in tobacco. Plant Physiol. Bioch. 2018, 132, 515–523. [Google Scholar] [CrossRef]
  11. Yao, P.; Sun, Z.; Li, C.; Zhao, X.; Li, M.; Deng, R.; Huang, Y.; Zhao, H.; Chen, H.; Wu, Q. Overexpression of Fagopyrum tataricum FtbHLH2 enhances tolerance to cold stress in transgenic Arabidopsis. Plant Physiol. Bioch. 2018, 125, 85–94. [Google Scholar] [CrossRef] [PubMed]
  12. Dombrecht, B.; Xue, G.P.; Sprague, S.J.; Kirkegaard, J.A.; Ross, J.J.; Reid, J.B.; Fitt, G.P.; Sewelam, N.; Schenk, P.M.; Manners, J.M.; et al. MYC2 differentially modulates diverse jasmonate-dependent functions in Arabidopsis. Plant Cell 2007, 19, 2225–2245. [Google Scholar] [CrossRef] [PubMed]
  13. Samira, R.; Li, B.; Kliebenstein, D.; Li, C.; Davis, E.; Gillikin, J.W.; Long, T.A. The bHLH transcription factor ILR3 modulates multiple stress responses in Arabidopsis. Plant Mol. Biol. 2018, 97, 297–309. [Google Scholar] [CrossRef] [PubMed]
  14. Jiang, Y.Q.; Yang, B.; Deyholos, M.K. Functional characterization of the Arabidopsis bHLH92 transcription factor in abiotic stress. Mol. Genet. Genomics 2009, 282, 503–516. [Google Scholar] [CrossRef] [PubMed]
  15. Jaglo-Ottosen, K.R.; Gilmour, S.J.; Zarka, D.G.; Schabenberger, O.; Thomashow, M.F. Arabidopsis CBF1 overexpression induces COR genes and enhances freezing tolerance. Science 1998, 280, 104–106. [Google Scholar] [CrossRef] [PubMed]
  16. Wan, F.X.; Pan, Y.; Li, J.H.; Chen, X.F.; Pan, Y.L.; Wang, Y.Q. Tian SB, Zhang XG. Heterologous expression of Arabidopsis C-repeat binding factor 3 (AtCBF3) and cold-regulated 15A (AtCOR15A) enhanced chilling tolerance in transgenic eggplant (Solanum melongena L.). Plant Cell Rep. 2014, 33, 1951–1961. [Google Scholar] [CrossRef]
  17. Wang, Z.; Wang, F.; Hong, Y.; Yao, J.; Ren, Z.; Shi, H.; Zhu, J. The flowering repressor SVP confers drought resistance in Arabidopsis by regulating abscisic acid catabolism. Mol. Plant 2018, 11, 1184–1197. [Google Scholar] [CrossRef]
  18. North, H.M.; De Almeida, A.; Boutin, J.; Frey, A.; To, A.; Botran, L.; Sotta, B.; Marion-Poll, A. The Arabidopsis ABA-deficient mutant aba4 demonstrates that the major route for stress-induced ABA accumulation is via neoxanthin isomers. Plant J. 2007, 50, 810–824. [Google Scholar] [CrossRef]
  19. Chen, H.; Cheng, W.; Hong, C.; Chang, Y.S.; Chan, M.C. The transcription factor OsbHLH035 mediates seed germination and enables seedling recovery from salt stress through ABA-dependent and ABA-independent pathways, respectively. Rice 2018, 11, 50. [Google Scholar] [CrossRef]
  20. Dong, Y.; Wang, C.; Han, X.; Tang, S.; Liu, S.; Xia, X.; Yin, W. A novel bHLH transcription factor PebHLH35 from Populus euphratica confers drought tolerance through regulating stomatal development, photosynthesis and growth in Arabidopsis. Biochem. Bioph. Res. Co. 2014, 450, 453–458. [Google Scholar]
  21. Wang, Z.; Du, H.; Zhai, R.; Song, L.; Ma, F.; Xu, L. Transcriptome analysis reveals candidate genes related to color fading of ‘Red Bartlett’ (Pyrus communis L.). Front. Plant Sci. 2017, 8, 455. [Google Scholar] [CrossRef] [PubMed]
  22. Naing, A.H.; Park, K.I.; Ai, T.N.; Chung, M.Y.; Han, J.S.; Kang, Y.W.; Lim, K.B.; Kim, C.K. Overexpression of snapdragon Delila (Del) gene in tobacco enhances anthocyanin accumulation and abiotic stress tolerance. BMC Plant Biol. 2017, 17, 65. [Google Scholar] [CrossRef] [PubMed]
  23. Wang, F.; Zhu, H.; Chen, D.; Li, Z.; Peng, R.; Yao, Q. A grape bHLH transcription factor gene, VvbHLH1, increases the accumulation of flavonoids and enhances salt and drought tolerance in transgenic Arabidopsis thaliana. Plant Cell Tiss. Org. Cul. 2016, 125, 387–398. [Google Scholar] [CrossRef]
  24. Hennen, G. Anthurium. In Ball Redbook, 16th ed.; Ball, V., Ed.; Ball Publishing: Batavia, IL, USA, 1998; pp. 352–356. [Google Scholar]
  25. Liu, R.D.; Zhang, M.; Li, X.X. Comparisons of extraction solvents and quantitative-methods for analysis of anthocyanins in strawberry and blueberry fruits. Acta Hortic. Sin. 2008, 35, 655–660. [Google Scholar]
  26. Lee, J.; Durst, R.W.; Wrolstad, R.E. Determination of total monomeric anthocyanin pigment content of fruit juices, beverages, natural colorants, and wines by the pH differential method: Collaborative study. J. AOAC Int. 2005, 88, 1269–1278. [Google Scholar] [PubMed]
  27. Li, H.S. Principles and Techniques of Plant Physiology and Biochemistry Experiment; Higher Education Press: Beijing, China, 2000. [Google Scholar]
  28. Wang, Y.; Sun, G.S.; Wang, G.D. Optimization of the method on total RNA extraction from the leaf of Anthurium andraeanum. Genomics Applied Biol. 2011, 30, 1189–1193. [Google Scholar]
  29. Grabherr, M.G.; Haas, B.J.; Yassour, M.; Levin, J.Z.; Thompson, D.A.; Amit, I.; Adiconis, X.; Fan, L.; Raychowdhury, R.; Zeng, Q. Full-length transcriptome assembly from RNA-Seq data without a reference genome. Nat. Biotechnol. 2011, 29, 130–644. [Google Scholar] [CrossRef]
  30. Altschul, S.F.; Madden, T.L.; Schäffer, A.A.; Zhang, J.; Zhang, Z.; Miller, W.; Lipman, D.J. Gapped BLAST and PSI-BLAST: A new generation of protein database search programs. Nucleic Acids Res. 1997, 25, 3389–3402. [Google Scholar] [CrossRef]
  31. Eddy, S.R. Profile hidden Markov models. Bioinformatics 1998, 14, 755–763. [Google Scholar] [CrossRef]
  32. Leng, N.; Dawson, J.A.; Thomson, J.A.; Ruotti, V.; Rissman, A.I.; Smits, B.M.G.; Haag, J.D.; Gould, M.N.; Stewart, R.M.; Kendziorski, C. EBSeq: An empirical Bayes hierarchical model for inference in RNA-seq experiments. Bioinformatics 2013, 29, 2073. [Google Scholar] [CrossRef]
  33. Benjamini, Y.; Hochberg, Y. Controlling the false discovery rate: A practical and powerful approach to multiple hypothesis testing. J. R. Stat. Soc. B 1995, 57, 289–300. [Google Scholar] [CrossRef]
  34. Robinson, M.D.; McCarthy, D.J.; Smyth, G.K. edgeR: A Bioconductor package for differential expression analysis of digital gene expression data. Bioinformatics 2010, 26, 139–140. [Google Scholar] [CrossRef] [PubMed]
  35. Livak, K.J.; Schmittgen, T.D. Analysis of relative gene expression data using real-time quantitative PCR and the 2(-Delta Delta C(T)) Method. Methods 2001, 25, 402–408. [Google Scholar] [CrossRef] [PubMed]
  36. Saitou, N.; Nei, M. The neighbor-joining method: A new method for reconstructing phylogenetic trees. Mol. Biol. Evol. 1987, 4, 406–425. [Google Scholar] [PubMed]
  37. Tamura, K.; Dudley, J.; Nei, M.; Kumar, S. MEGA4: Molecular evolutionary genetics analysis (MEGA) software version 4.0. Mol. Biol. Evol. 2007, 24, 1596–1599. [Google Scholar] [CrossRef] [PubMed]
  38. Clough, S.J.; Bent, A.F. Floral dip: A simplified method for Agrobacterium-mediated transformation of Arabidopsis thaliana. Plant J. 1998, 16, 735–743. [Google Scholar] [CrossRef] [PubMed]
Figure 1. Anthocyanin content in wild-type (WT) and dg mutant of A. andraeanum ‘Sonate’ and physiological index measurement under low-temperature (14 °C) stress. (A,B) Leaf developmental stages 1–5 (S1–S5) in WT (A) and dg mutant (B) of A. andraeanum ‘Sonate’. Scale bar represents 2 cm. (C) Anthocyanin content of WT (light green) and dg mutant (dark green) at the stages pictured in (A,B). The error bars in (C) represent ± SD (n ≥ 3). (D) Water content, malondialdehyde (MDA) content, peroxidase (POD) activity, superoxide dismutase (SOD) activity, catalase (CAT) activity and soluble sugar content in leaves of WT (blue lines) and dg (red lines) treated at 14 °C for 12 days. Measurements were taken every 2 days (i.e., on day 0, 2, 4, 6, 8, 10 and 12). R2 and R4 indicate plants recovered at 25 °C for 2 and 4 days, respectively. Horizontal coordinates indicate the number of days of low-temperature treatment and recovery. Error bars represent ± SD (n = 3).
Plants 08 00216 g001
Figure 2. Conserved-domain and phylogenic tree analysis of (helix-loop-helix) bHLH35-like proteins in various species. (A) Conserved domains of bHLH35-like proteins. The E-box/N-box, HLH domain and ACT domain are marked by black, green and gray bars, respectively. Aa, Anthurium andraeanum; Bd, Brachypodium distachyon; Dc, Dendrobium catenatum; Eg, Elaeis guineensis; Pe, Phalaenopsis equestris; Sb, Sorghum bicolor; Si, Setaria italica. (B) Phylogenetic tree of bHLH35-like proteins in various species. Full-length amino acid sequences of bHLH35-like proteins were aligned by ClustalW. The phylogenetic tree was constructed by MEGA 4 according to the Neighbor-Joining method with 1000 bootstrap replicates. Numbers on the tree indicate consensus support values (%). Red star indicates AabHLH35. The colored rectangles correspond to the conserved domains shown in (A). The red double line at the right indicates dicotyledons and the green single line indicates monocotyledons.
Plants 08 00216 g002
Figure 3. Identification of different 35S::AabHLH35 transgenic lines of Arabidopsis. (A) Histochemical GUS assays of WT and 35S::AabHLH35 transgenic Arabidopsis leaves. (B) Expression levels of different 35S::AabHLH35 transgenic lines (#1–#9) determined by semi-quantitative PCR analysis.
Plants 08 00216 g003
Figure 4. AabHLH35 improves cold stress in Arabidopsis. (A) Wild-type (WT) and 35S::AabHLH35 Arabidopsis plants subjected to cold stress treatment (4 °C for 6 h and 0 °C for 1 h). (B) MDA content, relative electrical conductivity and expression levels of CBF1 and COR15A in WT and 35S::AabHLH35 Arabidopsis plants under cold stress treatment. Error bars represent ± SD (n = 3). Letters indicate significant differences (P < 0.05, Student’s t-test).
Plants 08 00216 g004
Figure 5. AabHLH35 improves drought stress in Arabidopsis. (A) Wild-type (WT) and 35S::AabHLH35 Arabidopsis plants subjected to drought stress treatment for 15 d. (B) MDA content and expression levels of ABA4 and SVP in WT and 35S::AabHLH35 Arabidopsis plants under drought stress treatment. Error bars represent ± SD (n = 3). Letters indicate significant differences (P < 0.05, Student’s t-test).
Plants 08 00216 g005

