Interspaced Repeat Sequences Confer the Regulatory Functions of AtXTH10, Important for Root Growth in Arabidopsis

Institute of Life Sciences, Jiangsu University, Zhenjiang 212013, China
*
Author to whom correspondence should be addressed.
Plants 2019, 8(5), 130; https://doi.org/10.3390/plants8050130
Submission received: 3 April 2019
/
Revised: 6 May 2019
/
Accepted: 14 May 2019
/
Published: 16 May 2019
(This article belongs to the Section Plant Genetics, Genomics and Biotechnology)
Abstract
:An interspaced repeat sequence (IRS) is a unique sequence similar to prokaryotic CRISPR in structure. In this study, 1343 IRSs were identified in the Arabidopsis genome. Functional annotation of the IRS-related genes showed that they were associated with various growth and development processes. More than 30% of the IRSs were located in promoter regions. Deletion of some IRSs affected promoter activity, suggesting their roles in the regulation of gene expression. Next, the function of the AtXTH10 gene was further analyzed, and the expression of this gene was regulated by IRSs in its promoter region. Transgenic and mutant plants analysis indicated that the AtXTH10 gene was associated with root development by affecting cell wall structure. Moreover, the expression profiles of some key genes involved in root development signaling pathways were also affected by AtXTH10. These results suggest that IRSs could be involved in regulating the expression of genes with important roles in plant development.
1. Introduction
A repeat sequence is a special arrangement form of DNA. Prokaryotic and eukaryotic genomes contain many different types of repetitive DNA sequences, such as tandem repeats and inverted repeats [1], that play important roles in genome evolution, chromosome rearrangement, and regulation of expression [2,3]. Transcription is an important regulatory step in gene expression. The promoter possesses a variety of cis-elements, which play very important roles in transcription [4]. Therefore, it is important to study the functional sequence of a promoter to investigate the gene expression mechanism. The promoter is also an important component of the engineering vector. Therefore, understanding the molecular nature of the promoter is an important way to provide highly efficient expression vectors [5].
Interspaced repeat sequences (IRSs) are sequences with unique structures in the genome, in which the repeat units are separated by interval sequences. The sequences of the repeat units are highly conserved and are separated by different intervals or spacer sequences within an IRS. Different repeat units usually occur between different IRSs. IRSs are structurally similar to the CRISPR (clustered regularly interspaced short palindromic repeat) sequences in bacteria, which are important for RNA-guided adaptive immunity system with the CRISPR-associated (Cas) protein [6]. This system has been widely used for genomic engineering and editing in many studies [7,8]. Cas genes are present in almost all archaea and many bacteria, and this system only exists in these organisms [9,10]. In other words, Cas genes might have disappeared from eukaryotes during evolution. No studies have been conducted on the CRISPR similar IRS sequences in eukaryotes.
As plant-specific Ca2+ sensors, calcineurin B-like proteins (CBLs) can interact with CBL-interacting protein kinases (CIPKs) and play key roles in plant growth and development and various abiotic stress responses [11,12]. CBLs have been identified in Arabidopsis and other species. CBL9 is involved in abscisic acid biosynthesis during seed germination [13]. CBLs also affect pollen germination and pollen tube growth by controlling K+ homeostasis [14,15]. CBL1 positively regulates the salt and drought responses of plants [16]. Moreover, overexpression of the CBL5 gene endows the transgenic plants with osmotic or drought resistance [17].
Xyloglucan endotransglucosylase/hydrolase (XTH) widely occurs in various tissues and cells of plants. It belongs to a member of the glycoside hydrolase GH16 family. According to its sequence and function, the XTH protein can be divided into three major classes (I, II, and III). Among them, classes I and II have both xyloglcan endotransglycosylase (XET) and xyloglucan endohydrolase (XEH) activities, while class III proteins only have XEH activity. XTH modifies the cellulose–xyloglucan complex structure of the plant cell wall by catalyzing the breakage and relinking of the xyloglucan molecule [18]. It first combines with a substrate by hydrolysis to form a covalent intermediate of the glycosyl enzyme. Then, the enzyme is transferred to the reductive end of the polysaccharide residue and performs the glycosyl reaction (XET activity), or the enzyme hydrolyzes glycosylated water molecules (XEH activity) [19]. Studies have shown that XTH genes are involved in multiple growth and development processes in plants. The CaXTH1 gene of chickpea can be efficiently induced by hormones in growth tissues and plays an important role in elongation of vascular cells [20]. The rose ethylene-responsive RbXTH1 and RbXTH2 genes have different expression levels during different flower developmental stages, indicating that they may play diverse roles in the growth and development of rose flowers and petal abscission [21]. The expression levels of some XTH genes change under mechanical stimulation or aluminum and hypoxic stressors [22,23,24]. Brassinosteroids (BR) regulate activity of the XTH enzyme and increase ductility of the cell wall. In Arabidopsis, the expression levels of the AtXTH22 and AtXTH24 increase significantly after treatment with BR, which could be further related with cell wall elongation. In contrast, their expression levels decrease significantly in dwf1 mutant plants [25]. Treating Arabidopsis seedlings with gibberellin increases transcription of the AtXTH21 gene, indicating that AtXTH21 is affected by this hormone [26].
For the first time, IRSs were identified in Arabidopsis, and their putative role in controlling gene expression was demonstrated here. Manipulation of an IRS located at the AtXTH10 promoter region using mutants and transgenic plants suggested that IRSs can affect transcriptional activity of the promoter, and that AtXTH10 regulates root growth and development by altering plant cell wall structure. These results indicate that eukaryotic IRSs may be involved in the growth and development of plants by regulating the expression of key genes.
2. Materials and Methods
2.1. Identification of Arabidopsis IRS and Functional Annotation of the IRS-Related Genes
All previously sequenced Arabidopsis BAC sequences were obtained from TAIR (The Arabidopsis Information Resource: www.arabidopsis.org) and submitted to the CRISPRFinder tool [27] to identify the IRS structures with default parameters. Next, all predicted IRSs (Table S1) were located to the genome according to their sequences and BAC clone information. In this study, an IRS-related gene was defined as a gene containing IRSs in its sequence (including the promoter region). Functional annotation of the IRS-related genes was performed with a Gene Ontology (GO) enrichment analysis server (http://geneontology.org) [28].
2.2. Functional Identification of the IRSs in the CR6 and CR12 Promoters
In our previous study, 13 gene promoters were analyzed and their transcriptional activity was observed by mutating some IRSs. The results showed that about half of the promoter activity was affected by its IRS sequence. Two of the most representative promoters, CR6 and CR12, were selected for further analysis. The IRSs on these two promoters play completely opposite roles in their activity. To isolate the CR6 promoter (that is, the promoter of the AT2G14620 (AtXTH10) gene) and to develop the expression vectors lacking the different IRS, specific primers (CR6-1, CR6-2, CR6-4, and CR6-6) were designed (see details at Table S2) using the Primer3 program [29,30] following default parameters. The CR6-1/CR6-2 primers were used to isolate the wild type promoter CR6. Then, using the CR6 promoter as a template, the CR6-1/CR6-4, CR6-1/CR6-6, and CR6-1/CR6-8 primers were used to develop the other vectors (CR6m1, CR6m2, and CR6m3), which lack different IRSs or spacers, respectively. In the same way, the CR12 promoter (that is, the promoter of AT4G01420 (CBL5) gene) isolation and deletion were performed with specific primers (CR12-1, CR12-2, CR12-a, CR12-b, CR12-c, and CR12-3) (Table S2). After all promoters or their mutants were confirmed to be correct by sequencing, they were inserted into the pBI121 vector, in which the 35S promoter was cleaved by restriction endonucleases (HindIII and BamHI) to construct different expression vectors. Agrobacteria infiltration [31] in tobacco leaves and GUS measurements [32] were used to determine the activities of these promoters.
2.3. Vector Construction and Subcellular Localization of the AtXTH10 Protein
cDNA was synthetized by reverse transcription using 0.5 μg RNA extracted with the TRIzol® total RNA extraction kit (Sangon, Shanghai, China), 2 μL of 4×gDNA Wiper Mi and Nuclease-free H2O were added until the total reaction volume (8 µL) was met. Mixtures were incubated in a GeneAmp® PCR System 9700 (Applied Biosystems, Foster City, CA, USA) for 2 min at 42 °C. Further, 2 μL of 5× HiScript II Q RT SuperMix IIa was added and reverse transcription reaction was run in a GeneAmp® PCR System 9700 (Applied Biosystems, USA) for 10 min at 25 °C followed by 30 min at 50 °C, and 5 min at 85 °C. The primers (AtXTH10-F; AtXTH10-R) (Table S2) were designed as described above and used for isolating open reading frame of the AtXTH10 gene using the synthetized cDNA as the template. The gene was sequenced for verification and then inserted into the pBI121-eGFP vector (named pBI121-AtXTH10-eGFP), which was further transformed into Agrobacterium tumefaciens EHA105 for transient expression [33]. The pBI121-eGFP vector was modified based on the pBI121 vector, that is, the GUS gene of the pBI121 vector was replaced with the eGFP gene. The inner epidermis of onion was placed on 1/2MS (1.5% sucrose) solid medium for transient expression [34]. A. tumefaciens EHA105 containing the pBI121-AtXTH10-eGFP vector constructed above was cultured as described previously [31]. The cells were then resuspended in a solution containing 10 mM Mes (pH 5.5), 10 mM MgSO4, and 100 mM acetosyringone, and the OD600 of the suspension was adjusted to 0.5–0.8 before infiltration. The liquid Agrobacterium bacterial solution was dripped onto the inner epidermis of the onion for about 30 min using a pipette. The excess was washed off with filter paper. Inoculated tissues were incubated at 28 °C under dark conditions for 2 days. After cocultivation period, onion epidermis tissues were rinsed gently twice with 1×PBS (phosphate buffered saline) solution (pH7.0) and one time with sterile water, and further placed on glass slides for fluorescence microscopy.
2.4. Obtaining Transgenic AtXTH10 and Mutant Plants
AtXTH10 gene cloning and vector construction were described above. A. tumefaciens EHA105 containing the 35S::AtXTH10 vector was used to transform A. thaliana (Col) plants using the floral dip method [35]. Kanamycin (35 μg/mL)-resistant transformants (T0) were screened by polymerase chain reaction (PCR) using genomic DNA as the template; the forward primer (35S-1) is located at the 35S promoter and the reverse primer (AtXTH10-R) is located at the AtXTH10 gene. Homozygotes (T2) obtained from two generations of self-bred transgenic plants (T0) were used for the phenotypic analysis. T-DNA insertion mutant (SALK_1235) of the AtXTH10 gene was obtained from the ABRC (Arabidopsis Biological Resource Center, http://abrc.osu.edu). In this mutant, one T-DNA was inserted into the first exon of the AtXTH10 gene (Figure S1).
2.5. Scanning Electron Microscopic Observations
To visualize the changes in root microstructure in the wild type (Col), mutant (AtXTH10m) and overexpressing (AtXTH10-OE) plants, the samples were first fixed in solutions containing 0.05 M potassium phosphate (pH 7.0), 4% (w/v) paraformaldehyde, and 0.02% Triton X-100 in vacuum for 3–5 h to ensure that the solutions penetrated into the tissues. The fixed samples were left in the same solutions at 4 °C overnight, and then rinsed several times with 0.05 M potassium phosphate (pH 7.0) and distilled water. The samples were dehydrated through a graded ethanol series at room temperature. The tissue samples were dried in liquid carbon dioxide. Each root tissue was mounted on conductive tape, and sputtered with 10 nm JFC-1600 ion-plated gold film for 120 s. The structures were observed with a JSM-6360LV scanning electron microscope and photographed [36,37].
2.6. Detection the Relative Expression Levels of Known Root Development-Related Genes by Reverse Transcription Quantitative Real-Time Polymerase Chain Reaction (RT-qPCR) in the Col, AtXTH10m and AtXTH10-OE Plants
To detect signal transduction of the AtXTH10 gene in response to root development, the expression patterns of 24 known genes (Table S3) that affect root growth of Arabidopsis were further examined in the wild type (Col), mutant (AtXTH10m), and overexpressing (AtXTH10-OE) plants. Plant seedlings were grown in a greenhouse at 24 °C under a 14 h photoperiod. Total RNA of 1-week-old seedlings was extracted with the TRIzol® total RNA extraction kit (Sangon, Shanghai, China). RNA yield was determined using a NanoDrop 2000 spectrophotometer (Thermo Scientific, Waltham, MA, USA), and integrity was evaluated using agarose gel electrophoresis followed by staining with ethidium bromide (EB). A 0.5 μg aliquot of RNA, 2 μL of 4× gDNA Wiper Mix, and Nuclease-free H2O was added to 8 μL of total reaction volume and incubated in a GeneAmp® PCR System 9700 (Applied Biosystems, Foster City, CA, USA) for 2 min at 42 °C. Further, 2 μL of 5× HiScript II Q RT SuperMix IIa was added and reverse transcription have run in a GeneAmp® PCR System 9700 (Applied Biosystems, USA) for 10 min at 25 °C followed by 30 min at 50 °C, and for 5 min at 85 °C. The 10 μL RT reaction mix was then diluted ×10 in nuclease-free water and held at −20 °C. Real-time PCR was performed using the LightCycler® 480 II Real-time PCR Instrument (Roche, Basel, Switzerland) with a 10 μL PCR reaction mixture that included 1 μL of cDNA, 5 μL of 2× QuantiFast® SYBR® Green PCR Master Mix (Qiagen, Hilden, Germany), 0.2 μL of each forward and reverse primer (10 μM), and 3.6 μL of nuclease-free water. Reactions carried out in a 384-well optical plate (Roche) for 40 cycles, each cycle consisting in 10 s at 95 °C followed by 30 s at 60 °C. An initial step at 95 °C for 5 min was also considered. Nontemplate controls (NTC) were used to monitor for potential contamination within the RT-qPCR reagents. Three biological replicates were used for the analysis. A melting curve analysis was performed to validate specific generation of the expected PCR product. The primer sequences (Table S3) were designed as described above. The mRNA expression levels were normalized to those of the Arabidopsis actin2 gene (AT3G18780.1) [38] and were calculated using the 2−ΔΔCt method [39].
3. Results and Discussion
3.1. Identification of IRSs and Functional Annotation of the IRS-Related Genes
The entire genome sequence of A. thaliana was first analyzed and about 1343 IRS structures were identified (Table S1). A GO enrichment analysis was performed to investigate the functional relevance of IRS-related genes present in this genome. The results revealed that most IRS-related genes were involved in molecular functions, such as binding, monooxygenase activity, oxygen binding, and translation factor activity. In addition, biological processes, such as developmental processes, structural development, organism development, and macromolecule biosynthetic processes, were common in the IRS-related genes (Figure 1). These findings suggest that IRSs may play roles in various developmental processes in Arabidopsis.
3.2. IRSs Confer a Regulatory Function of Gene Expression
Next, the genomic locations of these IRSs were determined. The results indicated that more than 30% of the sequences were located in the promoter regions, accounting for the maximum number of all location types (Figure 2A). The second location-dense space was the intergenic region, representing ~25% of all IRSs. About one-fifth of the IRSs were located in or near the transposable element. A very small number of IRS sequences were located in the 5’-untranslated region (UTR) and the 3’-UTR (Figure 2A). Moreover, the number of repeat units was nonuniformly distributed in all identified IRSs, that is, 89.79% of the IRSs contained two repeat units and a maximum of nine repeat units appeared in an intergenic region (Figure 2B). In bacteria, 63% of the IRS similar structures (CRISPRs) have fewer than five repeat units. Some CRISPR loci are repeated up to 250 times [40]. This suggests that the number of repeat IRS units in Arabidopsis is much lower than that in bacteria. The promoter is a key gene expression regulatory region [41]. As more than 30% of the IRSs were located in the gene promoter region, it is considered whether these IRSs conferred a gene expression regulatory function. To answer this question, 13 promoters containing the IRSs were randomly selected to evaluate the effect of deletions in our previous study. Through comparing the expressive activity of the wild type promoter and the deleted IRSs promoter, it is determined whether the IRSs can regulate the promoter activity. The results indicated that some IRSs affected the promoter activity, whereas others had little effect. Two promoters were examined in detail (Figure 2C). One was the promoter (named CR6) of the AT2G14620 gene (encoding the xyloglucan endotransglucosylase/hydrolase 10 (AtXTH10) protein), and the other was the promoter (named CR12) of the AT4G01420 gene [encoding the calcineurin B-like 5 (CBL5) protein]. The CR6 promoter contained two repeats (R1 and R2), and deleting the repeats resulted in a sharp decrease in the promoter activity, indicating that these IRSs could act as cis-elements and enhance promoter activity (Figure 2C). There were four repeat units in the CR12 promoter. When R1, R3, and R4 were sequentially deleted, promoter activity was gradually enhanced, indicating that the presence of these three repeat units partially inhibited activity of the CR12 promoter. However, when R2 was deleted, promoter activity decreased, suggesting that the effect of the R2 repeat is just the opposite of the other three repeats (R1, R3, and R4) (Figure 2C). These results suggest that the IRSs on the Arabidopsis promoter region act as cis-elements and play an important role regulating gene expression.
3.3. The AtXTH10 Gene Regulates the Growth and Development of Roots
As described above, IRSs regulated the expression of the CBL5 and AtXTH10 genes. Overexpression of the CBL5 gene confers the osmotic or drought stress tolerance in plants [17]. However, the function of the AtXTH10 gene is currently unknown, so its function was investigated in detail. An overexpressing vector (35S::AtXTH10-eGFP) was constructed and transgenic plants (AtXTH10-OE) were obtained. T-DNA insertion mutant (SALK_1235, named AtXTH10m) of this gene was obtained from the ABRC (Arabidopsis Biological Resource Center, http://abrc.osu.edu). Fluorescence confocal microscopy revealed that most of the AtXTH10 protein was localized in the cell wall (Figure 3A). AtXTH10-OE plants presented a 48.6% increase in root length compared with the wild type (Col), whereas the mutation of this gene led to about a one-third reduction in root length (Figure 3B), suggesting that this gene is involved in root development. Microstructural differences in the root epidermal cells were also observed in the three plants (Col, AtXTH10-OE, and AtXTH10m) by scanning electron microscope. The arrangement of the root epidermal cells in the AtXTH10m mutant was disordered, and the root cells were shorter than those of the wild type (Figure 3C). The arrangement of root epidermal cells in AtXTH10-OE plants was more regular and their root cells were longer than those of wild type plants (Figure 3C). These results indicate that the AtXTH10 gene affects growth and development of the roots by modifying the cell wall structure.
3.4. Prediction of the Root Development Signaling Pathway Involved with the AtXTH10 Gene
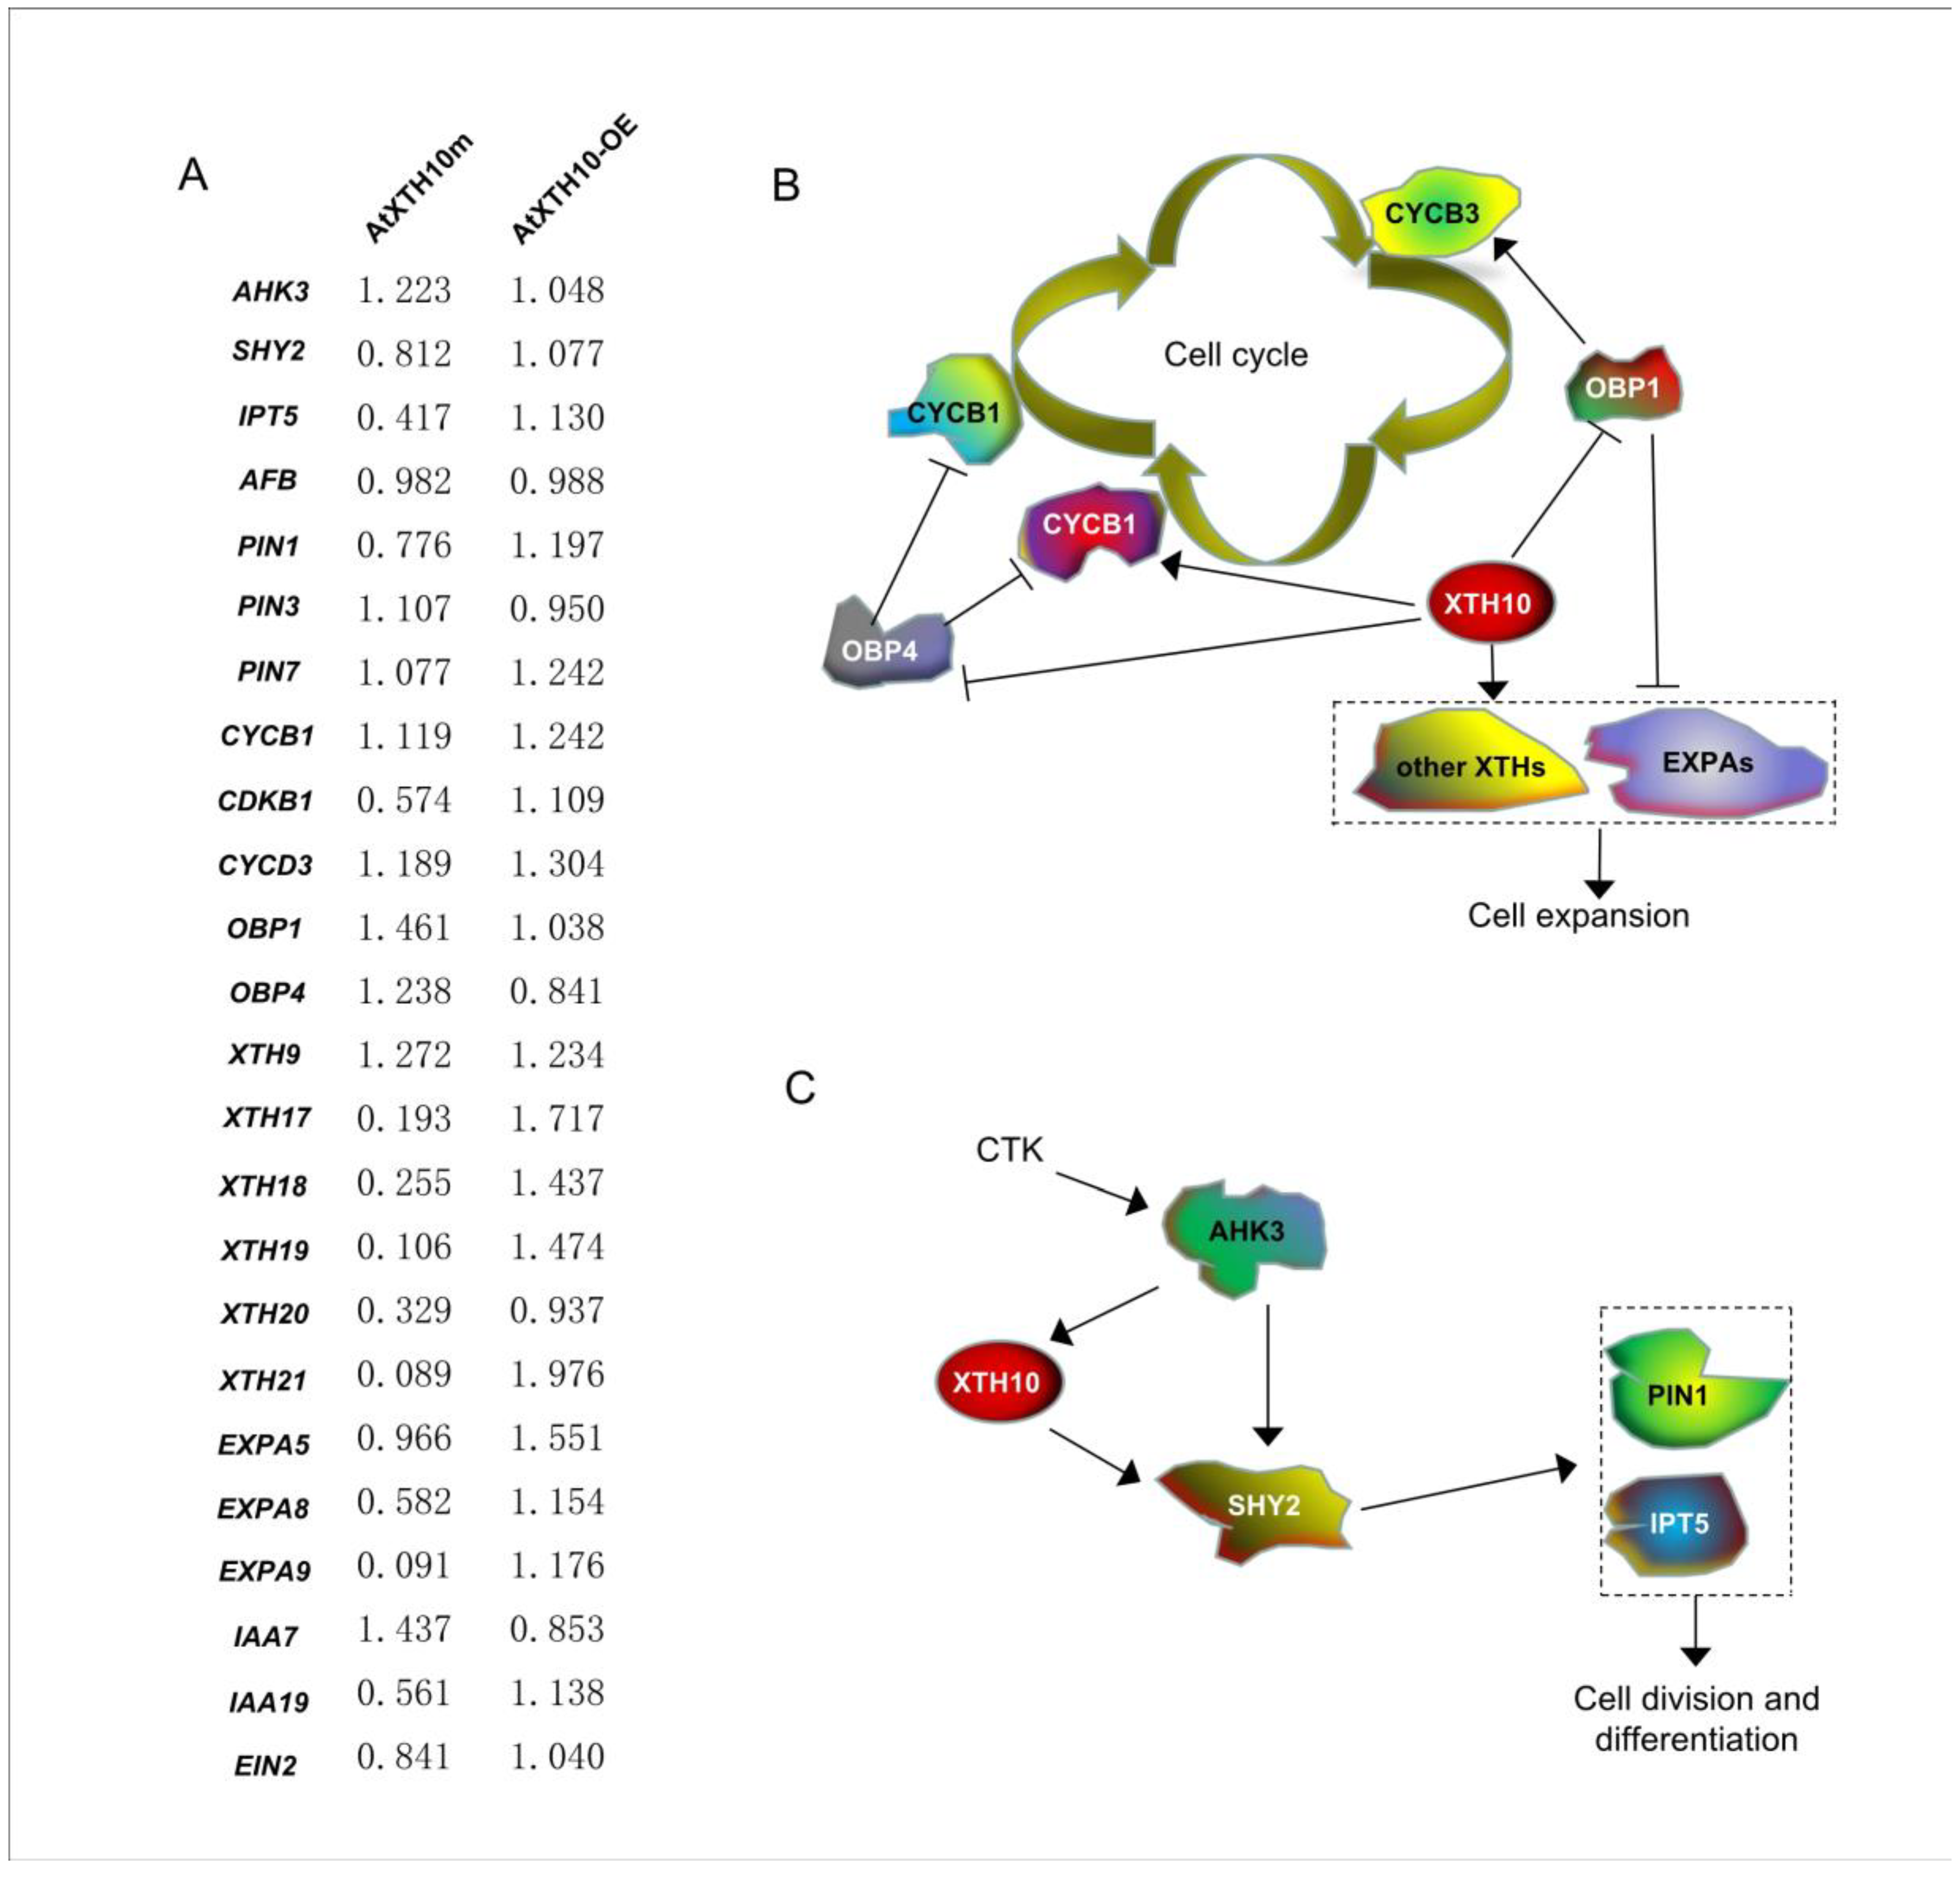
Cell wall remodeling during plant growth is accompanied by a change in cell volume and number. Breakage and regeneration of cell wall xyloglucans play an important role in cell wall remodeling [42]. XTH is an important cell wall modification enzyme that catalyzes the cleavage and regeneration of xyloglucan [19]. Moreover, some key genes that affect root development have been investigated in Arabidopsis (see Methods). To elucidate whether the AtXTH10 gene is also involved in the root growth and development signaling pathways and consequently associated with key genes expression patterns, RT-qPCR was used to detect expression levels of 24 genes in wild type (Col), mutant (AtXTH10m), and overexpressing (AtXTH10-OE) plants (Figure 4A). The results indicated that the AtXTH17, AtXTH18, AtXTH19, and AtXTH21 genes showed similar expression patterns in these three plants, which were downregulated in the mutant AtXTH10m plants and upregulated in the AtXTH10-OE plants. These results suggest that AtXTH10 may function upstream of these genes (Figure 4B). Plant expansin proteins are responsible for cell wall loosening during cell growth, fruit softening, and tube elongation [43]. Mutations or overexpression of the AtXTH10 gene decreased or increased transcriptional levels of the EXPA5, EXPA8, and EXPA9 genes, respectively, suggesting that AtXTH10 may participate in cell wall remodeling upstream of these genes (Figure 4B). Moreover, the cell cycle regulator (CDKB1) had the highest activity during cell division. When the AtXTH10 gene was mutated, the transcription level of CDKB1 was reduced, and overexpression of the AtXTH10 gene increased the transcription level of this gene, indicating that both regulate cell division (Figure 4B). In addition, the AtXTH10 gene inhibited expression of the OCS element binding factor binding protein 1 and 4 (OBP1 and OBP4) genes during root development, which are involved in the control of cell division and regulation of the cell cycle [44,45].
One study showed that AHK3, SHY2, and IPT5 are involved in the cytokinin (CTK) signaling pathway during root cell division and differentiation [46]. CTK regulates its receptor gene AHK3, and then AHK3 regulates its downstream SHY2 gene. Similarly, SHY2 also regulates expression of the IPT5 gene [46]. This study reported that the expression level of the AHK3 gene increases in AtXTH10 mutant plants, while the expression levels of SHY2 and IPT5 decreased. The SHY2 and IPT5 genes were upregulated in AtXTH10-OE plants, while the expression level of AHK3 was similar to that of the wild type. This result suggests that AHK3 may regulate the AtXTH10 gene, thereby affecting expression of the SHY2 and IPT5 genes. That is, the AtXTH10 gene was located downstream of the AHK3 and upstream of the SHY2 and IPT5 in this signaling pathway (Figure 4C). Auxin regulates growth and development in plants. Polar transport and distribution of auxin transport carrier genes play important roles in the development of root apices [47]. Next, the expression patterns of three auxin transport protein genes (PIN1, PIN3, and PIN7) were examined, and only the PIN1 gene had a significant expression change in these three plants. This result indicates that PIN1 may be regulated by the AtXTH10 gene and plays a major role in the development of roots (Figure 4C). In this study, the expression pattern of the indole-3-acetic acid inducible 19 (IAA19) gene was also investigated and its expression profiles were similar to those of XTH and EXPA, as described above. However, the expression profiles of the IAA7 gene contrasted to those of IAA19 in the wild type, mutant, and overexpressing plants. Perhaps, AtXTH10 plays a negative role regulating function of the IAA7 gene. All of these results suggest that IRSs could play crucial roles in growth and developmental processes in plants.
4. Conclusions
In this study, 1343 IRS sequences were identified in the Arabidopsis genome, and more than 30% of the structures were located in the promoter regions. A deletion analysis of the IRSs was performed in detail on the CR6 and CR12 promoters. The results indicated that the CR6 and CR12 IRSs play positive and negative roles in promoter activity, respectively, suggesting that they may contribute to regulatory function. Next, the function of the AtXTH10 gene containing the CR6 promoter was also investigated in detail. Transgenic and mutant plants analysis showed that AtXTH10 affected root growth and development by regulating cell wall structure. Moreover, some key genes involved in root development were also verified to be affected by the AtXTH10 gene. This finding suggests that plant IRSs play crucial roles in regulating gene expression that consequently affect plant growth and developmental processes.
Supplementary Materials
The following are available online at https://www.mdpi.com/2223-7747/8/5/130/s1. Table S1: All identified IRSs and their locations in Arabidopsis genome. Table S2: Primers used for construction of expression vectors and transgenic plant analysis. Table S3: Primers used for RT-qPCR in this study. Figure S1: Location of T-DNA insertion in the mutant (SALK_1235).
Author Contributions
J.C. designed and supervised the experiments, J.C., Y.L., and X.L. carried out the experiments. J.C. wrote the manuscript. All authors read and approved the manuscript.
Funding
This project is supported by grants from the National Science Foundation of China (No. 31100923 and 31871655).
Conflicts of Interest
The authors declare no conflict of interest.
References
- Holkers, M.; de Vries, A.A.; Gonçalves, M.A. Nonspaced inverted DNA repeats are preferential targets for homology-directed gene repair in mammalian cells. Nucleic Acids Res. 2012, 40, 1984–1999. [Google Scholar] [CrossRef]
- Pearson, C.E.; Edamura, K.C.; Cleary, J.D. Repeat instability: Mechanisms of dynamic mutations. Nat. Rev. Genet. 2005, 6, 729–742. [Google Scholar] [CrossRef]
- Mizuno, K.; Lambert, S.; Baldacci, G.; Murray, J.M.; Carr, A.M. Nearby inverted repeats fuse to generate acentric and dicentric palindromic chromosomes by a replication template exchange mechanism. Genes Dev. 2009, 23, 2876–2886. [Google Scholar] [CrossRef] [Green Version]
- Yamaguchi-Shinozaki, K.; Shinozaki, K. Organization of cis-acting regulatory elements in osmotic- and cold-stress-responsive promoters. Trends Plant Sci. 2005, 10, 88–94. [Google Scholar] [CrossRef] [PubMed]
- Venter, M. Synthetic promoters: Genetic control through cis engineering. Trends Plant Sci. 2007, 12, 118–124. [Google Scholar] [CrossRef] [PubMed]
- Amitai, G.; Sorek, R. CRISPR-Cas adaptation: Insights into the mechanism of action. Nat. Rev. Microbiol. 2016, 14, 67–76. [Google Scholar] [CrossRef]
- Mahfouz, M.M.; Piatek, A.; Stewart, C.N., Jr. Genome engineering via TALENs and CRISPR/Cas9 systems: Challenges and perspectives. Plant Biotechnol. J. 2014, 12, 1006–1014. [Google Scholar] [CrossRef] [PubMed]
- Komor, A.C.; Badran, A.H.; Liu, D.R. CRISPR-Based Technologies for the Manipulation of Eukaryotic Genomes. Cell 2017, 168, 20–36. [Google Scholar] [CrossRef]
- Takeuchi, N.; Wolf, Y.I.; Makarova, K.S.; Koonin, E.V. Nature and intensity of selection pressure on CRISPR-associated genes. J. Bacteriol. 2012, 194, 1216–1225. [Google Scholar] [CrossRef]
- Zhang, Q.; Doak, T.G.; Ye, Y. Expanding the catalog of cas genes with metagenomes. Nucleic Acids Res. 2014, 42, 2448–2459. [Google Scholar] [CrossRef]
- Luan, S. The CBL-CIPK network in plant calcium signaling. Trends Plant Sci. 2009, 14, 37–42. [Google Scholar] [CrossRef] [PubMed]
- Kudla, J.; Batistic, O.; Hashimoto, K. Calcium signals: The lead currency of plant information processing. Plant Cell 2010, 22, 541–563. [Google Scholar] [CrossRef]
- Pandey, G.K.; Cheong, Y.H.; Kim, K.N.; Grant, J.J.; Li, L.; Hung, W.; D’Angelo, C.; Weinl, S.; Kudla, J.; Luan, S. The calcium sensor calcineurin B-like 9 modulates abscisic acid sensitivity and biosynthesis in Arabidopsis. Plant Cell 2004, 16, 1912–1924. [Google Scholar] [CrossRef]
- Mähs, A.; Steinhorst, L.; Han, J.P.; Shen, L.K.; Wang, Y.; Kudla, J. The calcineurin B-like Ca2+ sensors CBL1 and CBL9 function in pollen germination and pollen tube growth in Arabidopsis. Mol. Plant 2013, 6, 1149–1162. [Google Scholar] [CrossRef]
- Tang, R.J.; Luan, S. Regulation of calcium and magnesium homeostasis in plants: From transporters to signaling network. Curr. Opin. Plant Biol. 2017, 39, 97–105. [Google Scholar] [CrossRef]
- Cheong, Y.H.; Kim, K.N.; Pandey, G.K.; Gupta, R.; Grant, J.J.; Luan, S. CBL1, a calcium sensor that differentially regulates salt, drought, and cold responses in Arabidopsis. Plant Cell 2003, 15, 1833–1845. [Google Scholar] [CrossRef]
- Cheong, Y.H.; Sung, S.J.; Kim, B.G.; Pandey, G.K.; Cho, J.S.; Kim, K.N.; Luan, S. Constitutive overexpression of the calcium sensor CBL5 confers osmotic or drought stress tolerance in Arabidopsis. Mol. Cells 2010, 29, 159–165. [Google Scholar] [CrossRef]
- Cosgrove, D.J. Growth of the plant cell wall. Nat. Rev. Mol. Cell Biol. 2005, 6, 850–861. [Google Scholar] [CrossRef]
- Eklöf, J.M.; Brumer, H. The XTH gene family: An update on enzyme structure, function, and phylogeny in xyloglucan remodeling. Plant Physiol. 2010, 153, 456–466. [Google Scholar] [CrossRef] [PubMed]
- Jiménez, T.; Martín, I.; Labrador, E.; Dopico, B. The immunolocation of a xyloglucan endotransglucosylase/hydrolase specific to elongating tissues in Cicer arietinum suggests a role in the elongation of vascular cells. J. Exp. Bot. 2006, 57, 3979–3988. [Google Scholar] [CrossRef]
- Singh, A.P.; Tripathi, S.K.; Nath, P.; Sane, A.P. Petal abscission in rose is associated with the differential expression of two ethylene-responsive xyloglucan endotransglucosylase/hydrolase genes, RbXTH1 and RbXTH2. J. Exp. Bot. 2011, 62, 5091–5103. [Google Scholar] [CrossRef]
- Ko, J.H.; Han, K.H.; Park, S.; Yang, J. Plant body weight-induced secondary growth in Arabidopsis and its transcription phenotype revealed by whole-transcriptome profiling. Plant Physiol. 2004, 135, 1069–1083. [Google Scholar] [CrossRef] [PubMed]
- Yang, J.L.; Zhu, X.F.; Peng, Y.X.; Zheng, C.; Li, G.X.; Liu, Y.; Shi, Y.Z.; Zheng, S.J. Cell wall hemicellulose contributes significantly to aluminum adsorption and root growth in Arabidopsis. Plant Physiol. 2011, 155, 1885–1892. [Google Scholar] [CrossRef]
- Ookawara, R.; Satoh, S.; Yoshioka, T.; Ishizawa, K. Expression of alpha-expansin and xyloglucan endotransglucosylase/hydrolase genes associated with shoot elongation enhanced by anoxia, ethylene and carbon dioxide in arrowhead (Sagittaria pygmaea Miq.) tubers. Ann. Bot. 2005, 96, 693–702. [Google Scholar] [CrossRef]
- He, J.X.; Fujioka, S.; Li, T.C.; Kang, S.G.; Seto, H.; Takatsuto, S.; Yoshida, S.; Jang, J.C. Sterols regulate development and gene expression in Arabidopsis. Plant Physiol. 2003, 131, 1258–1269. [Google Scholar] [CrossRef] [PubMed]
- Liu, Y.B.; Lu, S.M.; Zhang, J.F.; Liu, S.; Lu, Y.T. A xyloglucan endotransglucosylase/hydrolase involves in growth of primary root and alters the deposition of cellulose in Arabidopsis. Planta 2007, 226, 1547–1560. [Google Scholar] [CrossRef]
- Grissa, I.; Vergnaud, G.; Pourcel, C. CRISPRFinder: A web tool to identify clustered regularly interspaced short palindromic repeats. Nucleic Acids Res. 2007, 35, W52–W57. [Google Scholar] [CrossRef] [PubMed]
- Mi, H.; Huang, X.; Muruganujan, A.; Tang, H.; Mills, C.; Kang, D.; Thomas, P.D. PANTHER version 11: Expanded annotation data from Gene Ontology and Reactome pathways, and data analysis tool enhancements. Nucleic Acids Res. 2017, 45, D183–D189. [Google Scholar] [CrossRef]
- Koressaar, T.; Remm, M. Enhancements and modifications of primer design program Primer3. Bioinformatics 2007, 23, 1289–1291. [Google Scholar] [CrossRef] [Green Version]
- Untergasser, A.; Cutcutache, I.; Koressaar, T.; Ye, J.; Faircloth, B.C.; Remm, M.; Rozen, S.G. Primer3—New capabilities and interfaces. Nucleic Acids Res. 2012, 40, e115. [Google Scholar] [CrossRef] [PubMed]
- Cakir, B.; Agasse, A.; Gaillard, C.; Saumonneau, A.; Delrot, S.; Atanassova, R. A grape ASR protein involved in sugar and abscisic acid signaling. Plant Cell 2003, 15, 2165–2180. [Google Scholar] [CrossRef] [PubMed]
- Jefferson, R.A.; Kavanagh, T.A.; Bevan, M.W. GUS fusions: Beta-glucuronidase as a sensitive and versatile gene fusion marker in higher plants. EMBO J. 1987, 6, 3901–3907. [Google Scholar] [CrossRef] [PubMed]
- Dekeyser, R.A.; Claes, B.; De Rycke, R.; Habets, M.E.; Van Montaqu, M.C.; Caplan, A.B. Transient gene expression in intact and organized rice tissues. Plant Cell 1990, 2, 591–602. [Google Scholar] [CrossRef] [PubMed]
- Murashige, T.; Skoog, F. A revised medium for rapid growth and bioassays with tobacco tissue cultures. Physol. Plant 1962, 15, 473–497. [Google Scholar] [CrossRef]
- Clough, S.J.; Bent, A.F. Floral dip: A simplified method for Agrobacterium-mediated transformation of Arabidopsis thaliana. Plant J. 1998, 16, 735–743. [Google Scholar] [CrossRef] [PubMed]
- Dart, P.J. Scanning electron microscopy of plant root. J. Exp. Bot. 1971, 22, 163–168. [Google Scholar] [CrossRef]
- Lincoln, C.; Britton, J.H.; Estelle, M. Growth and development of the axr1 mutants of Arabidopsis. Plant Cell 1990, 2, 1071–1080. [Google Scholar] [CrossRef]
- Martinis, J.; Glauser, G.; Valimareanu, S.; Stettler, M.; Zeeman, S.C.; Yamamoto, H.; Shikanai, T.; Kessler, F. ABC1K1/PGR6 kinase: A regulatory link between photosynthetic activity and chloroplast metabolism. Plant J. 2014, 77, 269–283. [Google Scholar] [CrossRef]
- Livak, K.J.; Schmittgen, T.D. Analysis of relative gene expression data using real-time quantitative PCR and the 2(-Delta Delta C(T)) Method. Methods 2001, 25, 402–408. [Google Scholar] [CrossRef]
- Grissa, I.; Vergnaud, G.; Pourcel, C. The CRISPRdb database and tools to display CRISPRs and to generate dictionaries of spacers and repeats. BMC Bioinform. 2007, 8, 172. [Google Scholar] [CrossRef]
- Hagen, G.; Guilfoyle, T. Auxin-responsive gene expression: Genes, promoters and regulatory factors. Plant Mol. Biol. 2002, 49, 373–385. [Google Scholar] [CrossRef]
- Fry, S. The structure and functions of xyloglucan. J. Exp. Bot. 1989, 40, 1–11. [Google Scholar] [CrossRef]
- Cosgrove, D.J. Loosening of plant cell walls by expansins. Nature 2000, 407, 321–326. [Google Scholar] [CrossRef]
- Skirycz, A.; Radziejwoski, A.; Busch, W.; Hannah, M.A.; Czeszejko, J.; Kwaśniewski, M.; Zanor, M.I.; Lohmann, J.U.; De Veylder, L.; Witt, I.; et al. The DOF transcription factor OBP1 is involved in cell cycle regulation in Arabidopsis thaliana. Plant J. 2008, 56, 779–792. [Google Scholar] [CrossRef]
- Xu, P.; Chen, H.; Ying, L.; Cai, W. AtDOF5.4/OBP4, a DOF Transcription Factor Gene that Negatively Regulates Cell Cycle Progression and Cell Expansion in Arabidopsis thaliana. Sci. Rep. 2016, 6, 27705. [Google Scholar] [CrossRef] [PubMed]
- Dello Ioio, R.; Nakamura, K.; Moubayidin, L.; Perilli, S.; Taniguchi, M.; Morita, M.T.; Aoyama, T.; Costantino, P.; Sabatini, S. A genetic framework for the control of cell division and differentiation in the root meristem. Science 2008, 322, 1380–1384. [Google Scholar] [CrossRef] [PubMed]
- Robert, H.S.; Friml, J. Auxin and other signals on the move in plants. Nat. Chem. Biol. 2009, 5, 325–332. [Google Scholar] [CrossRef] [PubMed]
Figure 1.
Gene Ontology (GO) functional enrichment analysis of the interspaced repeat sequence (IRS)-related genes in Arabidopsis. GO enrichment analysis was performed using the online server (http://geneontology.org). Approximately 914 mapped IDs and results only for uncorrected p < 0.05 were displayed. The top 20 biological processes are shown here. A: developmental process; B: anatomical structure development; C: multicellular organismal process; D: multicellular organism development; E: macromolecule biosynthetic process; F: cellular macromolecule biosynthetic process; G: cellular amide metabolic process; H: growth; I: cellular carbohydrate metabolic process; J: cell growth; K: plant organ morphogenesis; L: chemical homeostasis; M: secondary metabolic process; N: polysaccharide metabolic process; O: cellular polysaccharide metabolic process; P: pollen development; Q: plant epidermis development; R: root morphogenesis; S: positive regulation of metabolic process; T: cellular carbohydrate biosynthetic process.

Figure 2.
Distribution characteristics (A) and number (B) of Arabidopsis IRSs and regulation function analysis of IRSs in CR12 and CR6 promoters (C). Different repeat units and spacer sequences are identified in the form of R and S, respectively. The numbers behind R and S are helpful to distinguish them. The scale bar of GUS activity is 100 (4-MU pmol/mg protein/min). Significance was tested relative to each wild type using t-test. Significance of * p < 0.05 and ** p < 0.01. Error bar: standard deviation.
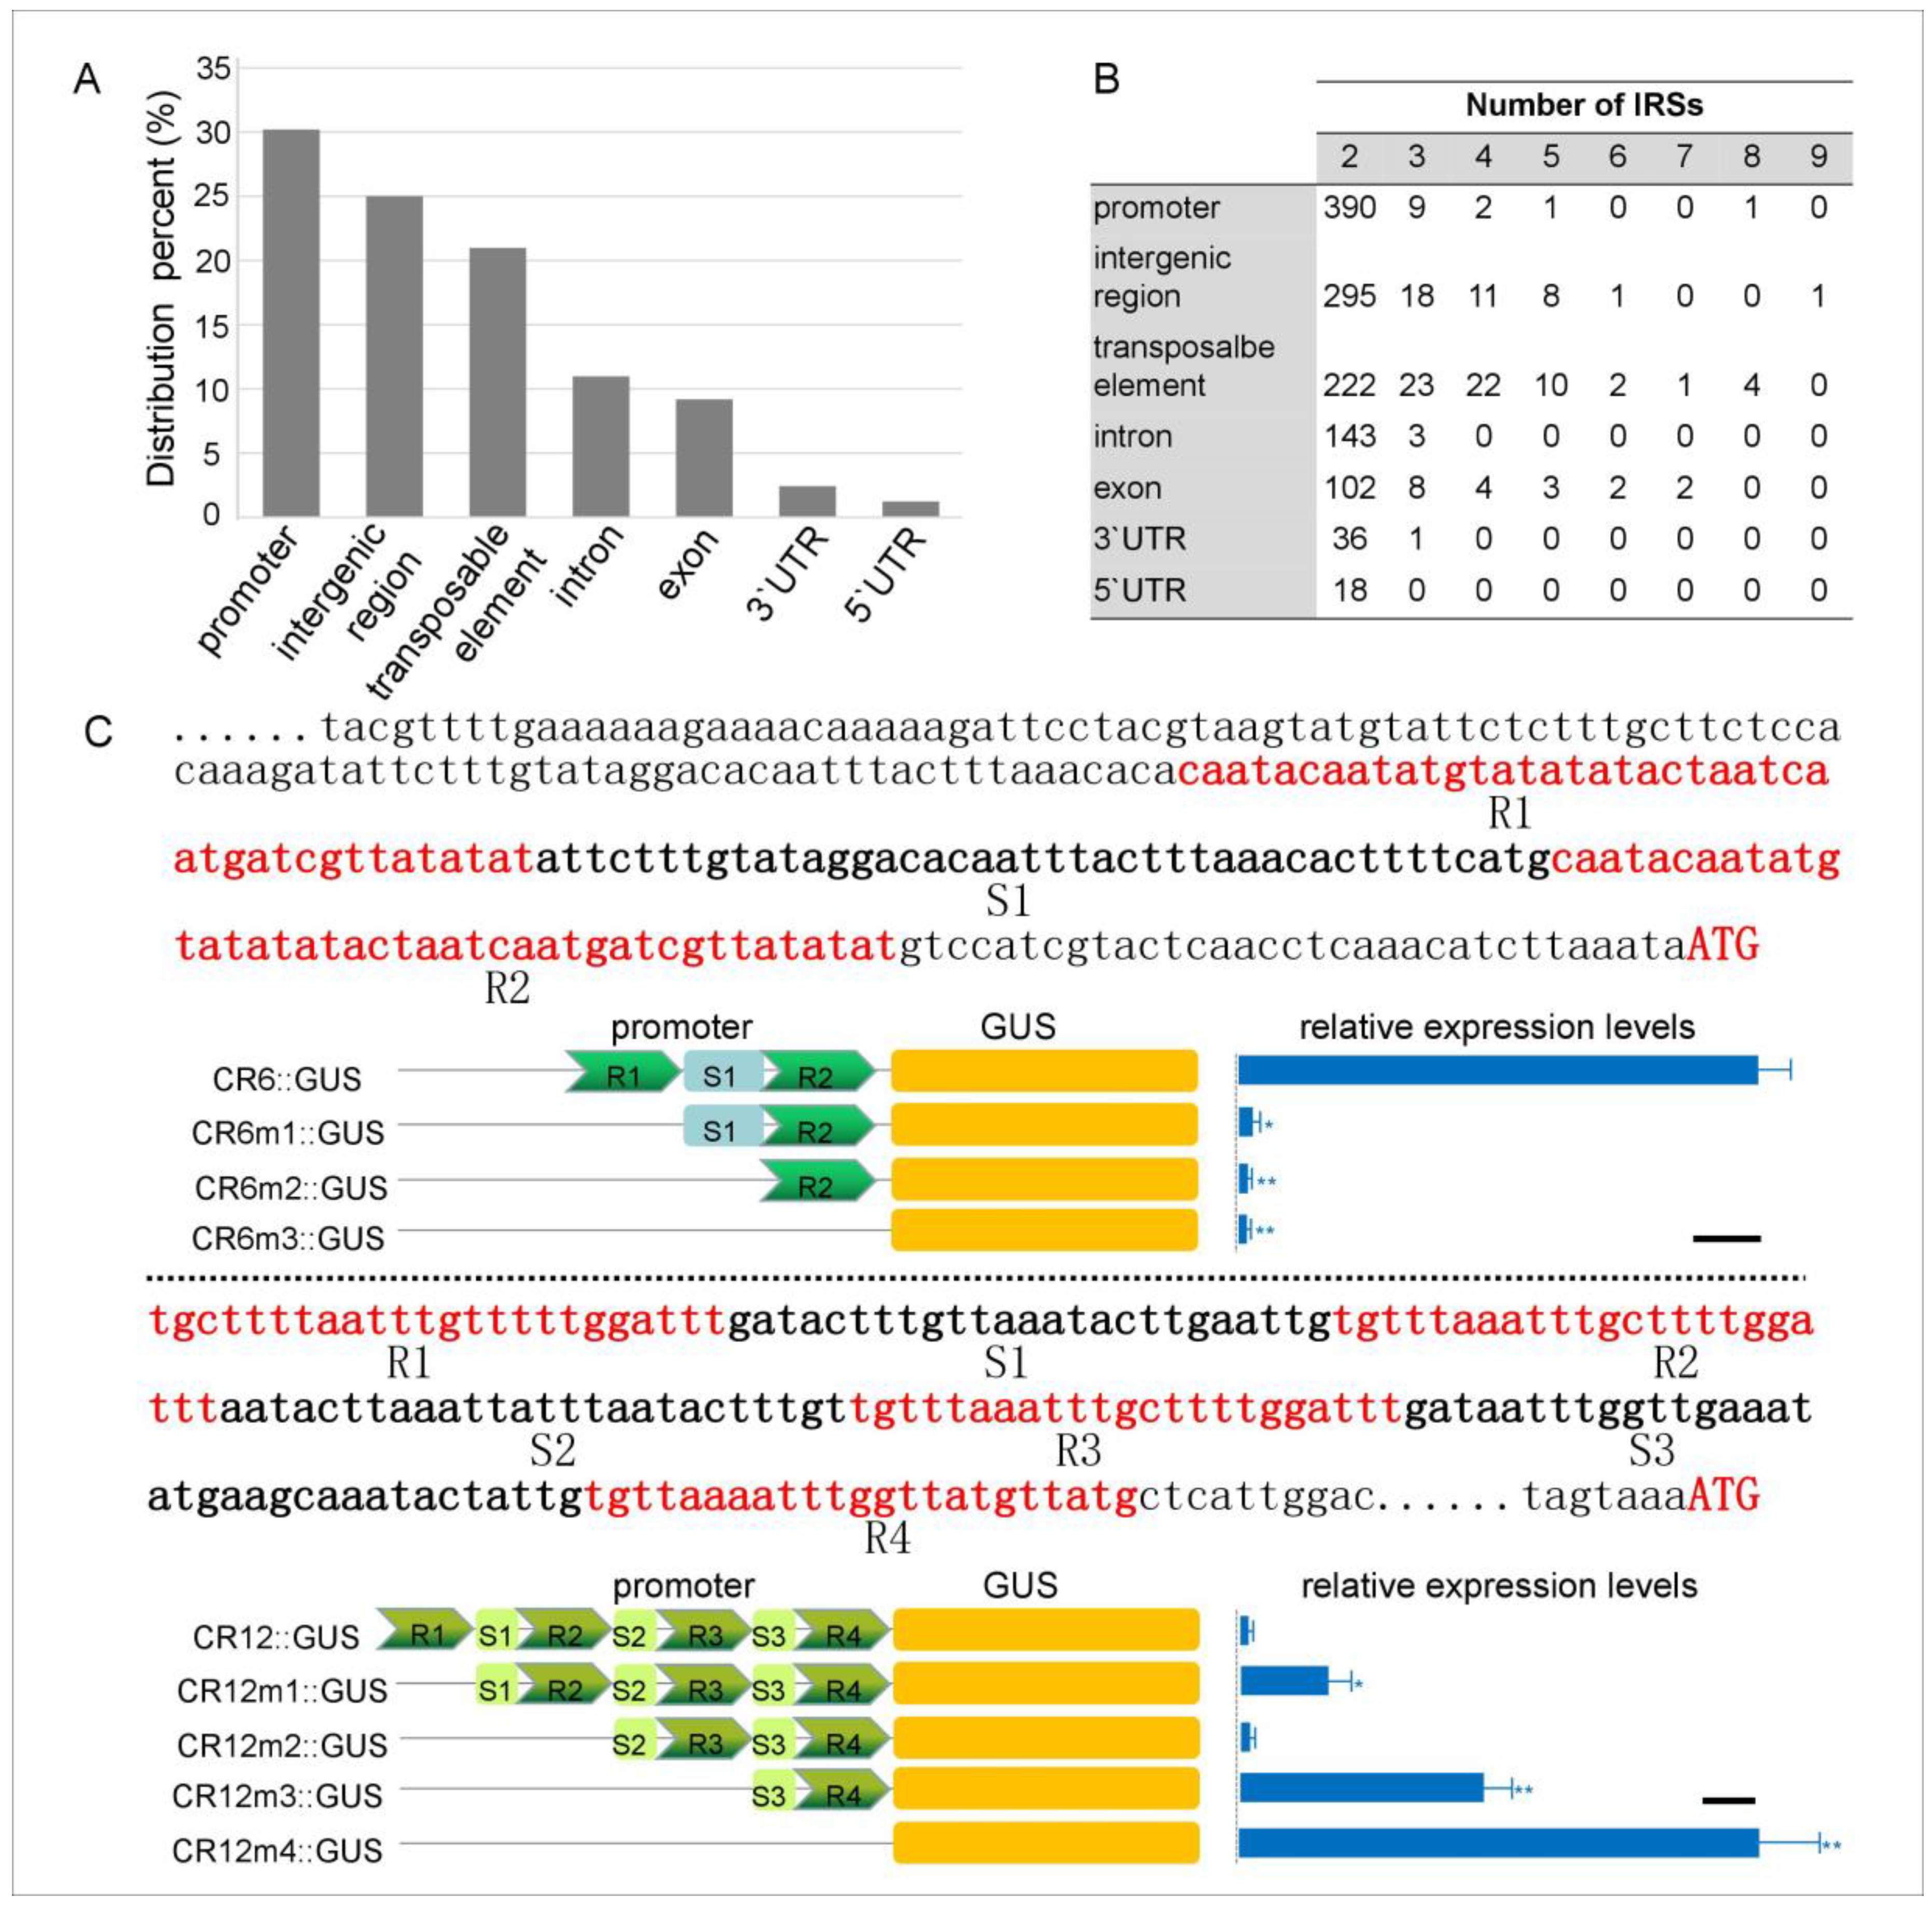
Figure 3.
Subcellular localization of AtXTH10 protein (A), phenotypic analysis of AtXTH10 gene affecting root development (scale bar stands for 0.5 cm) (B), and scanning electron microscope observation of root microstructure (scale bar is 10 μm) (C). Significance was tested relative to the wild type (Col) using t-test. Significance of ** p < 0.01. Error bar: standard deviation.
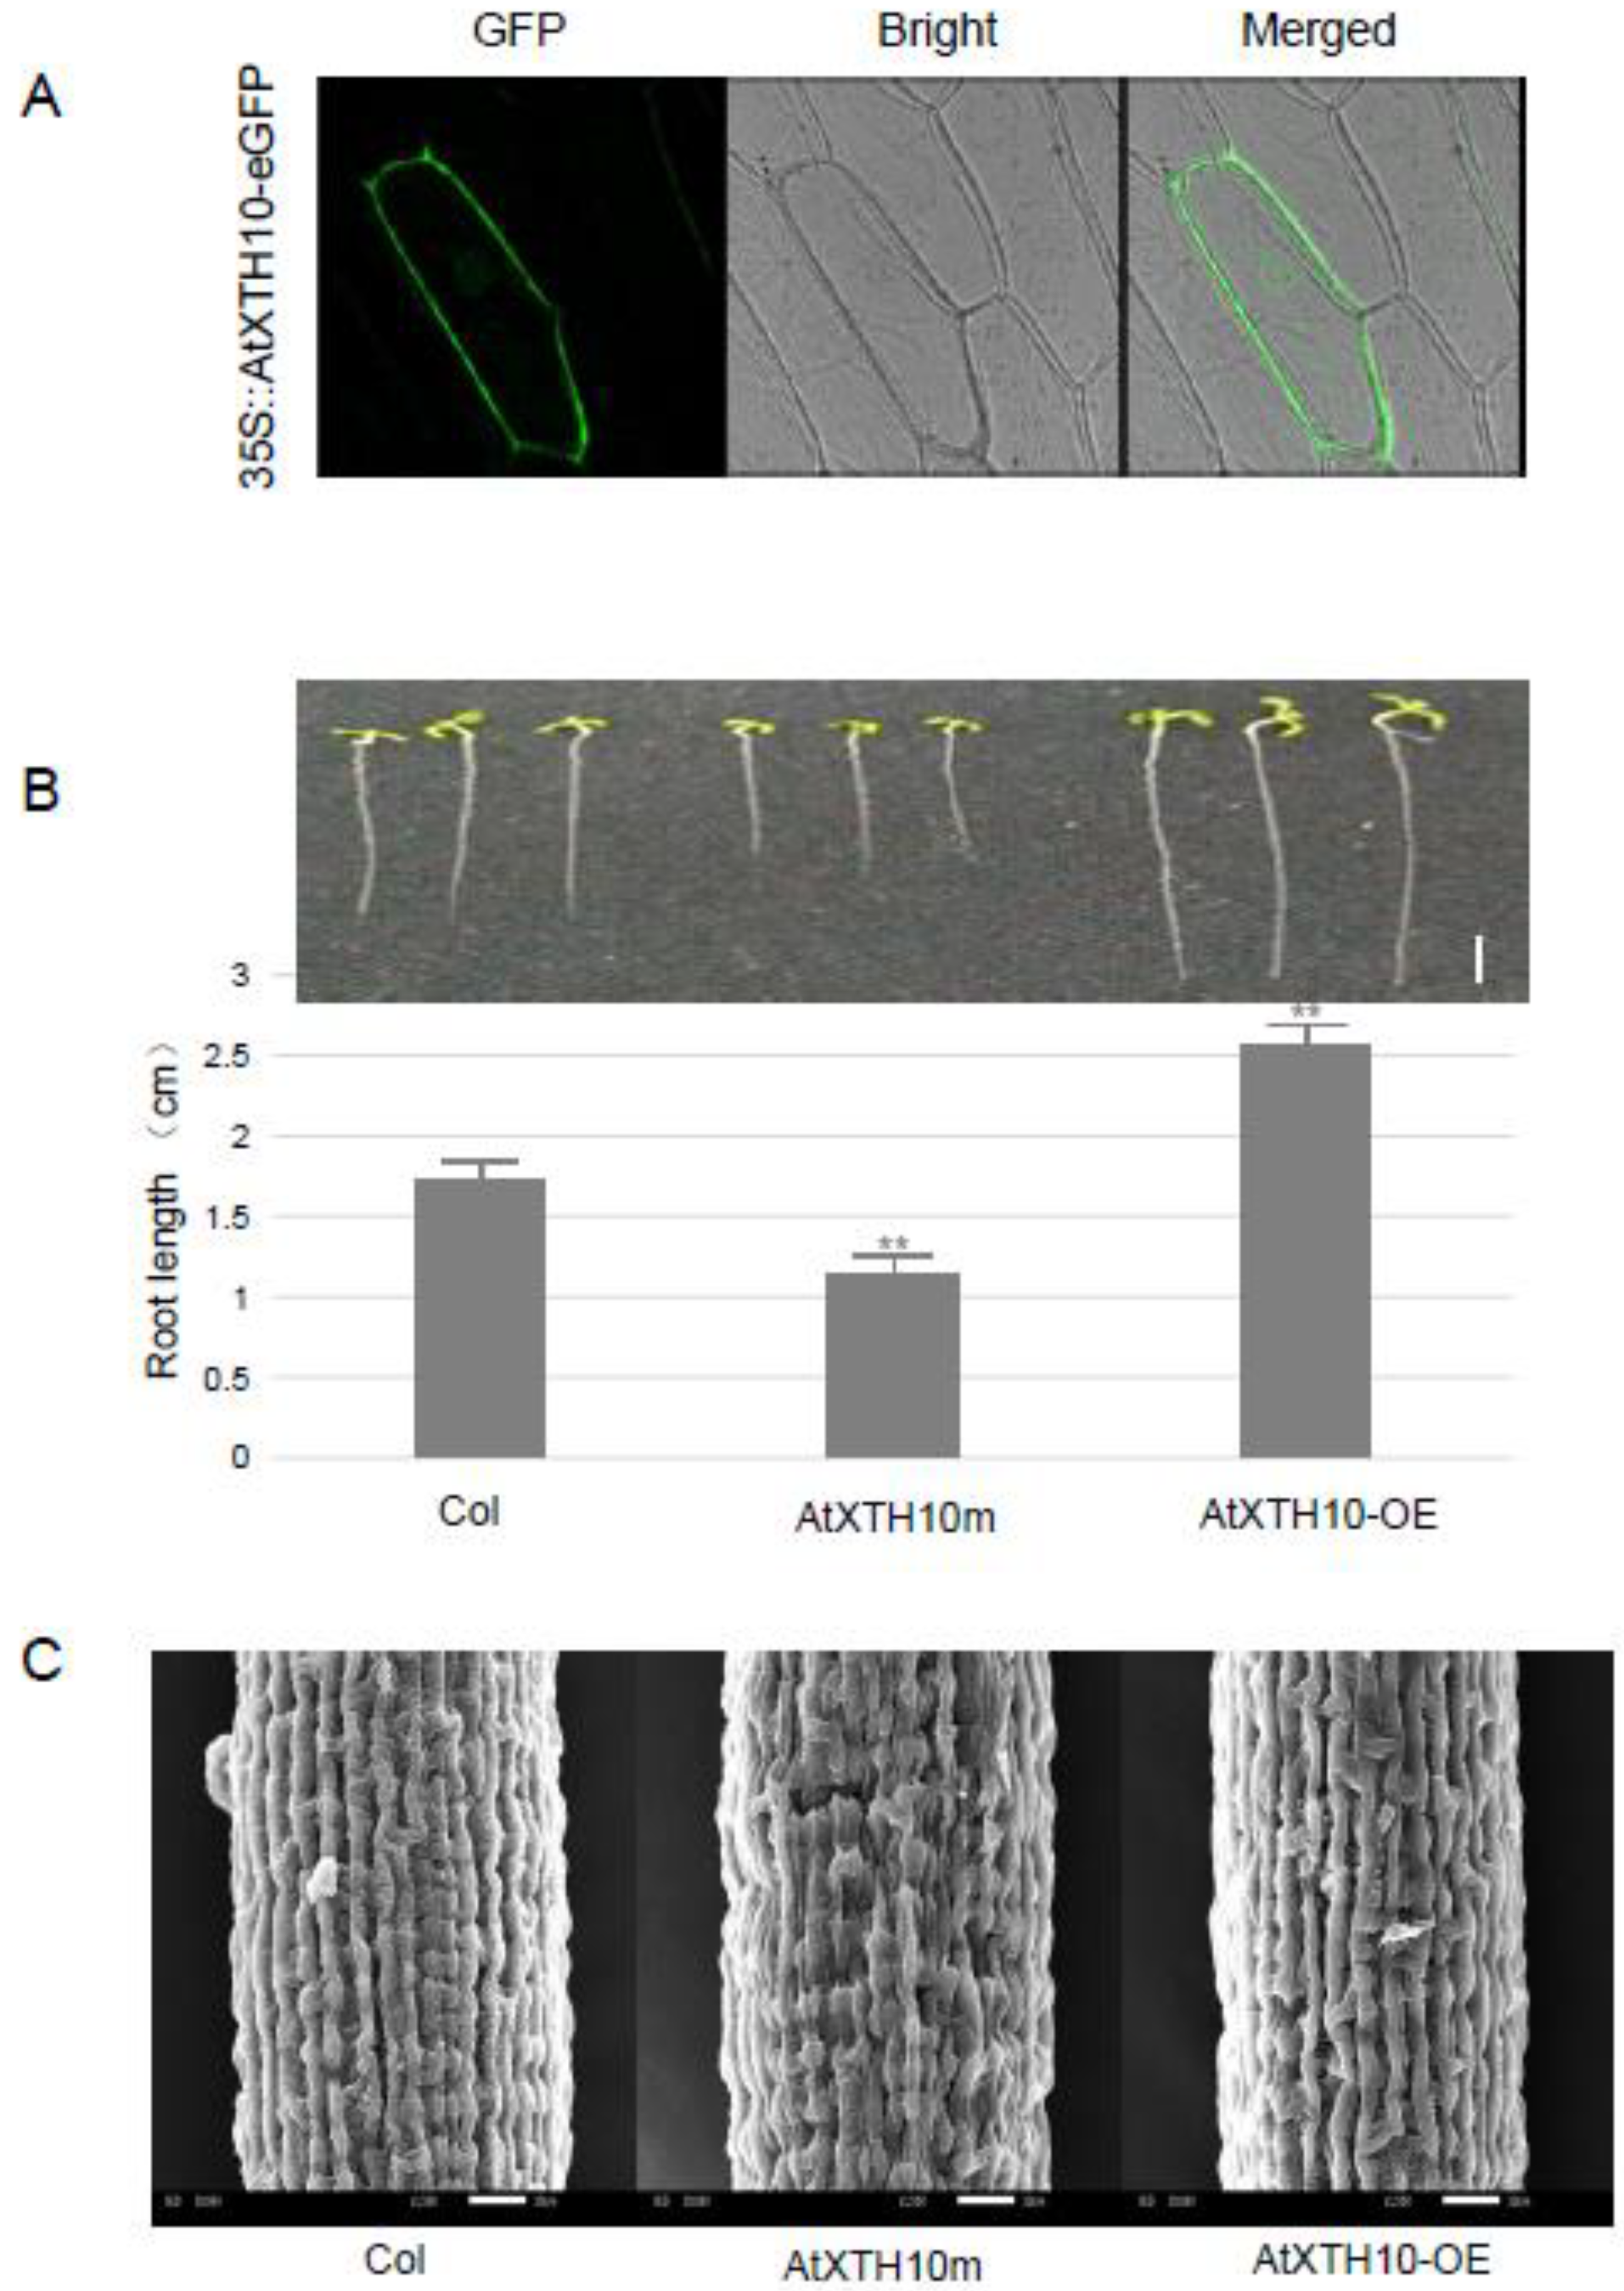
Figure 4.
Relative expression levels of the known key genes of root development signal pathway in AtXTH10m and AtXTH10-OE compared with wild type Arabidopsis (Col) plants (A). The signal pathway of root cell expansion mediated by cell cycle (B). The signal pathway of cytokinin-mediated root division and differentiation (C). The graph (A) is automatically generated by BAR HeatMapper Tool (http://bar.utoronto.ca) and the depth of color represents the difference of expression. Three biological repeats were performed for this RT-qPCR analysis. Their average relative expression data are marked on the graph.
© 2019 by the authors. Licensee MDPI, Basel, Switzerland. This article is an open access article distributed under the terms and conditions of the Creative Commons Attribution (CC BY) license (http://creativecommons.org/licenses/by/4.0/).
Share and Cite
MDPI and ACS Style
Cao, J.; Lv, Y.; Li, X. Interspaced Repeat Sequences Confer the Regulatory Functions of AtXTH10, Important for Root Growth in Arabidopsis. Plants 2019, 8, 130. https://doi.org/10.3390/plants8050130
AMA Style
Cao J, Lv Y, Li X. Interspaced Repeat Sequences Confer the Regulatory Functions of AtXTH10, Important for Root Growth in Arabidopsis. Plants. 2019; 8(5):130. https://doi.org/10.3390/plants8050130
Chicago/Turabian StyleCao, Jun, Yueqing Lv, and Xiang Li. 2019. "Interspaced Repeat Sequences Confer the Regulatory Functions of AtXTH10, Important for Root Growth in Arabidopsis" Plants 8, no. 5: 130. https://doi.org/10.3390/plants8050130
Note that from the first issue of 2016, this journal uses article numbers instead of page numbers. See further details here.