Article

Differences among the Anthocyanin Accumulation Patterns and Related Gene Expression Levels in Red Pears

College of Horticulture, Northwest A&F University, Taicheng Road NO. 3, Yangling 712100, Shanxi Province, China
*
Authors to whom correspondence should be addressed.
Meng Wu and Jianlong Liu made the same contribution in this study.
Plants 2019, 8(4), 100; https://doi.org/10.3390/plants8040100
Submission received: 8 March 2019 / Revised: 30 March 2019 / Accepted: 11 April 2019 / Published: 16 April 2019

Abstract

:
Differences in coloration exist among red pear cultivars. Here, we selected six red pear cultivars with different genetic backgrounds to elucidate the characteristics of fruit pigmentation. We detected anthocyanin contents and the expression levels of anthocyanin synthesis-related genes in these cultivars at different stages of fruit development. The anthocyanin contents of all six cultivars showed a rise–drop tendency. Principal component and hierarchical cluster analyses were used to distinguish the types of cultivars and the genes crucial to each anthocyanin accumulation pattern. The six cultivars were divided into three groups. Red Zaosu were clustered into one group, Red Sichou and Starkrimson into another group, and Palacer, Red Bartlett, and 5 Hao clustered into a third group. The expression levels of F3H, UFGT2, MYB10, and bHLH3 were similar among the differential coloration patterns of the six cultivars, suggesting a critical and coordinated mechanism for anthocyanin synthesis. Anthocyanin transporters (GST) and light-responsive genes, such as COP1, PIF3.1, and PIF3.2 played limited roles in the regulation of anthocyanin accumulation. This study provides novel insights into the regulation of anthocyanins synthesis and accumulation in red pears.

1. Introduction

Pears are an important fruit worldwide. The color of the pear is an important factor in consumer acceptance of fresh pears. However, pears show different coloring patterns owing to different genetic backgrounds. At present, there are four major pear classifications in the world, including the Asian pear species (Pyrus pyrifolia, Pyrus bretschneideri, and Pyrus ussuriensis) and European pear species (Pyrus communis). Red pears are mostly classified as European pears, while the coloration of most Asian pear cultivars ranges from yellow-green to brown, with a few being red [1]. Little is known about the coloring mechanisms of different red pear cultivars. Thus, it is important to study the mechanisms responsible for the different coloring patterns of red pears.
The main components of the red color in pears are anthocyanins [2,3,4]. The well-characterized anthocyanin biosynthetic pathway is a highly conserved network found in many plant species [5,6,7,8,9] (Figure S1). Anthocyanin accumulation is controlled coordinately by structural and regulatory genes. Additionally, the structural genes are regulated by the MYB-bHLH-WD40 complex, consisting of MYB, basic helix-loop-helix (bHLH) and WD40 repeat families [10,11,12,13]. In addition, anthocyanin synthesis is controlled by external environmental factors, such as nutrient depletion, drought, pathogen infection, temperature, and light [14]. Light and temperature are decisive environmental factor that affect the accumulation of anthocyanins in fruit. Generally, light can increase the anthocyanin accumulation [15]. Higher temperatures lead to a decrease in anthocyanin accumulation, while low temperatures promote anthocyanin accumulation [16]. Anthocyanin synthesis and degradation occur simultaneously. It is generally believed that anthocyanin degradation occurs as a result of plant-specific developmental stages or changes in environmental factors [17]. Planta degradation of anthocyanins may occur as a result of active enzyme-driven breakdown processes. The color of the Brunfelsia calycina flower changed rapidly from deep purple to completely white after flowering, a vacuolar class III peroxidase (BcPrx01) was suggested to be responsible for anthocyanin degradation [18,19]. Some light-responsive genes play important roles in anthocyanin accumulation. In apples (Malus × domestica), MdCOP1 degrades the MdMYB1 protein, resulting in the inhibition of fruit coloration in a light-dependent manner [20]. Phytochrome-interacting factor 3 (PIF3) is a bHLH transcription factor, having critical roles in light signaling [21]. PIF3 and HY5 promote anthocyanin accumulation by simultaneously binding the promoters of structural genes at separate sequence elements in Arabidopsis [22]. The anthocyanin is synthesized in the cytoplasm and finally stored in the vacuole, so anthocyanin transport can affect the accumulation of anthocyanin content. GST is an anthocyanins synthesis-related transporter. It was first discovered in maize, in which it was involved in the transfer of anthocyanins from the endoplasmic reticulum to the vacuole [23]. GST has a positive correlation with anthocyanin accumulations in different species [24,25,26,27].
In pear species, the structural genes for anthocyanin biosynthesis, such as PAL, CHS, CHI, F3H, DFR, ANS, and UFGT have been isolated [28,29]. ANS and UFGT are crucial genes for anthocyanin synthesis in Asian and European pears [30]. PAL is not a key gene in anthocyanin biosynthesis because anthocyanin accumulation does not change with PAL activity [31]. Some transcription factors are also involved in the regulation of anthocyanin biosynthesis in pears. P. pyrifolia MYB10 (PyMYB10) plays a role in regulating anthocyanin biosynthesis, and P. communis MYB10 (PcMYB10) could regulate the accumulation of anthocyanins by associating with the promoter of UFGT [32,33]. Furthermore, P. bretschneideri MYB10 (PbMYB10b) regulates anthocyanins by inducing the expression of PbDFR, and PbMYB9 induces the synthesis of anthocyanins by binding the PbUFGT1 promoter in pear fruit [34]. In addition, the expression levels of MYB10 and bHLH33 were significantly correlated in European pears but not in Asian pears [30].
The regulatory pathway of anthocyanin synthesis is very complicated. The anthocyanin synthesis pathway has been widely studied in pears. At present, there is limited research on anthocyanin accumulation patterns in different red pears. To study the different coloring patterns of the red pear cultivars, we investigated the different stages of fruit development in six cultivars, 5 Hao, ‘Red Zaosu’, Red Sichou, Palacer, Starkrimson and Red Bartlett. 5 Hao and Red Zaosu are Asian pear species, Red Sichou, Palacer, Starkrimson and Red Bartlett are European pear species. Different red pear cultivars were classified according to the difference in gene expression levels. We aimed to identify key genes that control coloration during fruit development in red pears. The study provides comprehensive insights into the molecular mechanism of anthocyanin accumulation in red pears, especially in the different species of red pear at different stages of fruit development, and provides novel insights into the regulation of anthocyanins.

2. Results

2.1. Total Anthocyanin Accumulation in Different Pear Cultivars

5 Hao is a blushed red pear, Starkrimson, Palacer and Red Sichou are fully red pears, and Red Bartlett has full-red fruit in the early stages of fruit development that subsequently fade to red-green after maturity [35]. Red Zaosu is a fully red pear at the early stages of fruit development, while its red-green stripes appear at the middle and late stages of fruit development (Figure 1a). The anthocyanin contents of all six cultivars showed a rise–drop tendency (Figure 1b). The anthocyanin content increased gradually in the early stages of fruit development (15 and 35 DAFB), with the highest contents occurring in the middle stages of fruit development (55 and 75 DAFB). In the late stages of fruit development (95 and 115 DAFB), the anthocyanin content began to decline. The anthocyanin contents of 5 Hao and Red Bartlett peaked at 75 DAFB and then declined. In the other four cultivars, the anthocyanin content reached a maximum at 55 DAFB. Among these cultivars, the highest content of anthocyanins in all stages was found in Starkrimson, followed by Red Zaosu, Red Sichou and Palacer, which all had similar anthocyanin contents.

2.2. Expression Levels of Anthocyanin Synthesis-Related Structural Genes

To determine the critical genes involved in the regulation of anthocyanin synthesis, the expression levels of structural genes PAL, CHS, CHI, F3H, DFR1, DFR2, ANS1, ANS2, ANR, UFGT1, and UFGT2 were determined by quantitative real-time PCR (qPCR) during the developmental stages (Figure 2). PAL showed a peak of expression at 75 DAFB in Red Zaosu. However, PAL was highly expressed at the early stages of fruit development in the other cultivars. CHS, F3H, and UFGT2 had the same trend, showing their highest expression levels in the six cultivars at 75 DAFB. The trend was basically consistent with the accumulation of anthocyanins. However, the expression level of CHS in Starkrimson was an exception—its highest expression levels occurred at 15 DAFB. The relative expression level of CHI in all of the developmental stages of the fruit did not change significantly, but was slightly higher at 35 and 75 DAFB than at the other periods. The expression level of DFR1 in Red Zaosu was much greater than in the other cultivars, while the expression level of DFR2 was much greater in Red Bartlett than in the other cultivars. The expression levels of ANS1 and ANS2 peaked at 75 DAFB in Red Zaosu and peaked at 95 DAFB in 5 Hao. However, in other cultivars, the expression levels of ANS1 and ANS2 were higher at 15 and 75 DAFB, and showed a drop–rise–drop tendency that was not consistent with the trend in anthocyanin accumulation. The expression levels of ANR did not change much during any of the stages of fruit development. UFGT1 generally showed the same trend in Red Bartlett, Red Sichou and Starkrimson, with the trend similar to the change in the anthocyanin content. These data indicated that the expression of the F3H and UFGT2 genes have essential roles in the anthocyanin accumulation of the six cultivars.

2.3. Expression Levels of Anthocyanin Synthesis-Related Regulatory Genes

Four anthocyanin synthetic transcription factors, MYB10, MYB10b, bHLH3, and bHLH33, were selected and their expression levels determined during the stages of fruit development (Figure 3). The highest expression of MYB10 occurred at 75 DAFB in the six cultivars, and overall it showed a tendency to first increase and then decrease, which was consistent with the trend of anthocyanin accumulation. The expression levels of MYB10 in Starkrimson and Red Sichou were higher than in the other cultivars. The expression level of MYB10b was higher at the early stages of fruit development in Red Sichou, Palacer, Starkrimson, and Red Bartlett. However, MYB10b peaked at 75 DAFB in 5 Hao and Red Zaosu. The highest expression of bHLH3 also appeared at 75 DAFB in the six cultivars, showing a tendency to first increase and then gradually decrease, like the trend of the anthocyanin accumulation. bHLH33 showed a tendency to slowly decrease throughout the fruit’s developmental stages, contrary to the trend of the anthocyanin accumulation.

2.4. Expression Levels of Anthocyanins Synthesis-Related Transporter and Light-Responsive Genes

The expression levels of the transporter and light-responsive genes—GST, COP1, PIF3.1, and PIF3.2—involved in anthocyanin synthesis were also determined (Figure 4). The expression level of GST reached maximum values at 75 DAFB, having shown a tendency to increase first and then decrease. The expression level of COP1 did not change significantly during the stages of fruit development. The expression level of PIF3.1 showed a rise–drop trend and peaked when the highest anthocyanin content occurred at 35 DAFB in Red Zaosu. However, the expression level of PIF3.1 showed a rise–drop–rise trend in 5 Hao, Red Bartlett, Starkrimson, and Palacer. The expression level of PIF3.1 reached a peak at 55 DAFB in 5 Hao, Red Bartlett and Palacer, and reached a peak at 75 DAFB in Red Sichou and Starkrimson. PIF3.2 had an initial peak in the early developmental stages in all cultivars, and had a second peak at 75 DAFB in ‘Red Zaosu’, Starkrimson, and Palacer. In addition, the expression of PIF3.2 in Red Bartlett was much higher than in the other cultivars.

2.5. Correlation Analysis of Anthocyanin Contents and Gene Expression Levels

In all structural genes, the anthocyanin content of 5 Hao was significantly positively correlated with the expression levels of PAL, CHS, F3H, DFR1, DFR2, and UFGT2, with CHS, F3H, and UFGT2 being the three most relevant. The anthocyanin content of Red Bartlett was significantly positively correlated with the expression levels of CHS, CHI, F3H, DFR1, ANS1, UFGT1, and UFGT2, the highest of which was F3H. Red Zaosu had significant positive correlations with the expression levels of PAL, CHS, and ANS2, anthocyanin accumulation did not show significant correlation with UFGT1 and UFGT2. The anthocyanin content of Palacer showed significant positive correlations with the expression levels of CHS, CHI, F3H, and ANR, but did not show significant positive correlations with UFGT1 and UFGT2. The anthocyanin content of Red Sichou showed significant positive correlations with the expression levels of PAL, CHS, CHI, F3H, ANR, DFR2, and UFGT2, with CHS, CHI, and F3H being the three most relevant. In Starkrimson, on the other hand, there was a significant positive correlation between anthocyanin content and the expression of F3H, DFR1, UFGT1 and UFGT2, and the most relevant genes were UFGT1 and UFGT2 (Table 1).
The expression level of MYB10 was significantly positively correlated with the anthocyanin contents of 5 Hao, Red Sichou, Palacer, Starkrimson, and Red Bartlett, while the expression level of MYB10b was only significantly positively correlated with the content of 5 Hao. The expression level of bHLH3 was significantly positively correlated with the anthocyanin contents of all of the cultivars, except for Red Zaosu. The expression level of bHLH33 was not significantly correlated with the anthocyanin contents of the six cultivars, however it showed a positive correlation to the content of Red Zaosu (Table 1).
The expression level of GST was significantly positively correlated with the anthocyanin contents of 5 Hao, Starkrimson, and Red Bartlett, and it also showed positive correlations with the contents of the other three cultivars. COP1’s expression level showed a significantly positive correlation with the anthocyanin contents of Palacer, Starkrimson, and Red Bartlett. PIF3.1 showed significantly positive correlations with the contents of Red Zaosu, Red Sichou and Starkrimson, while that of PIF3.2 only showed a positive correlation with the anthocyanin content of Red Zaosu (Table 1).

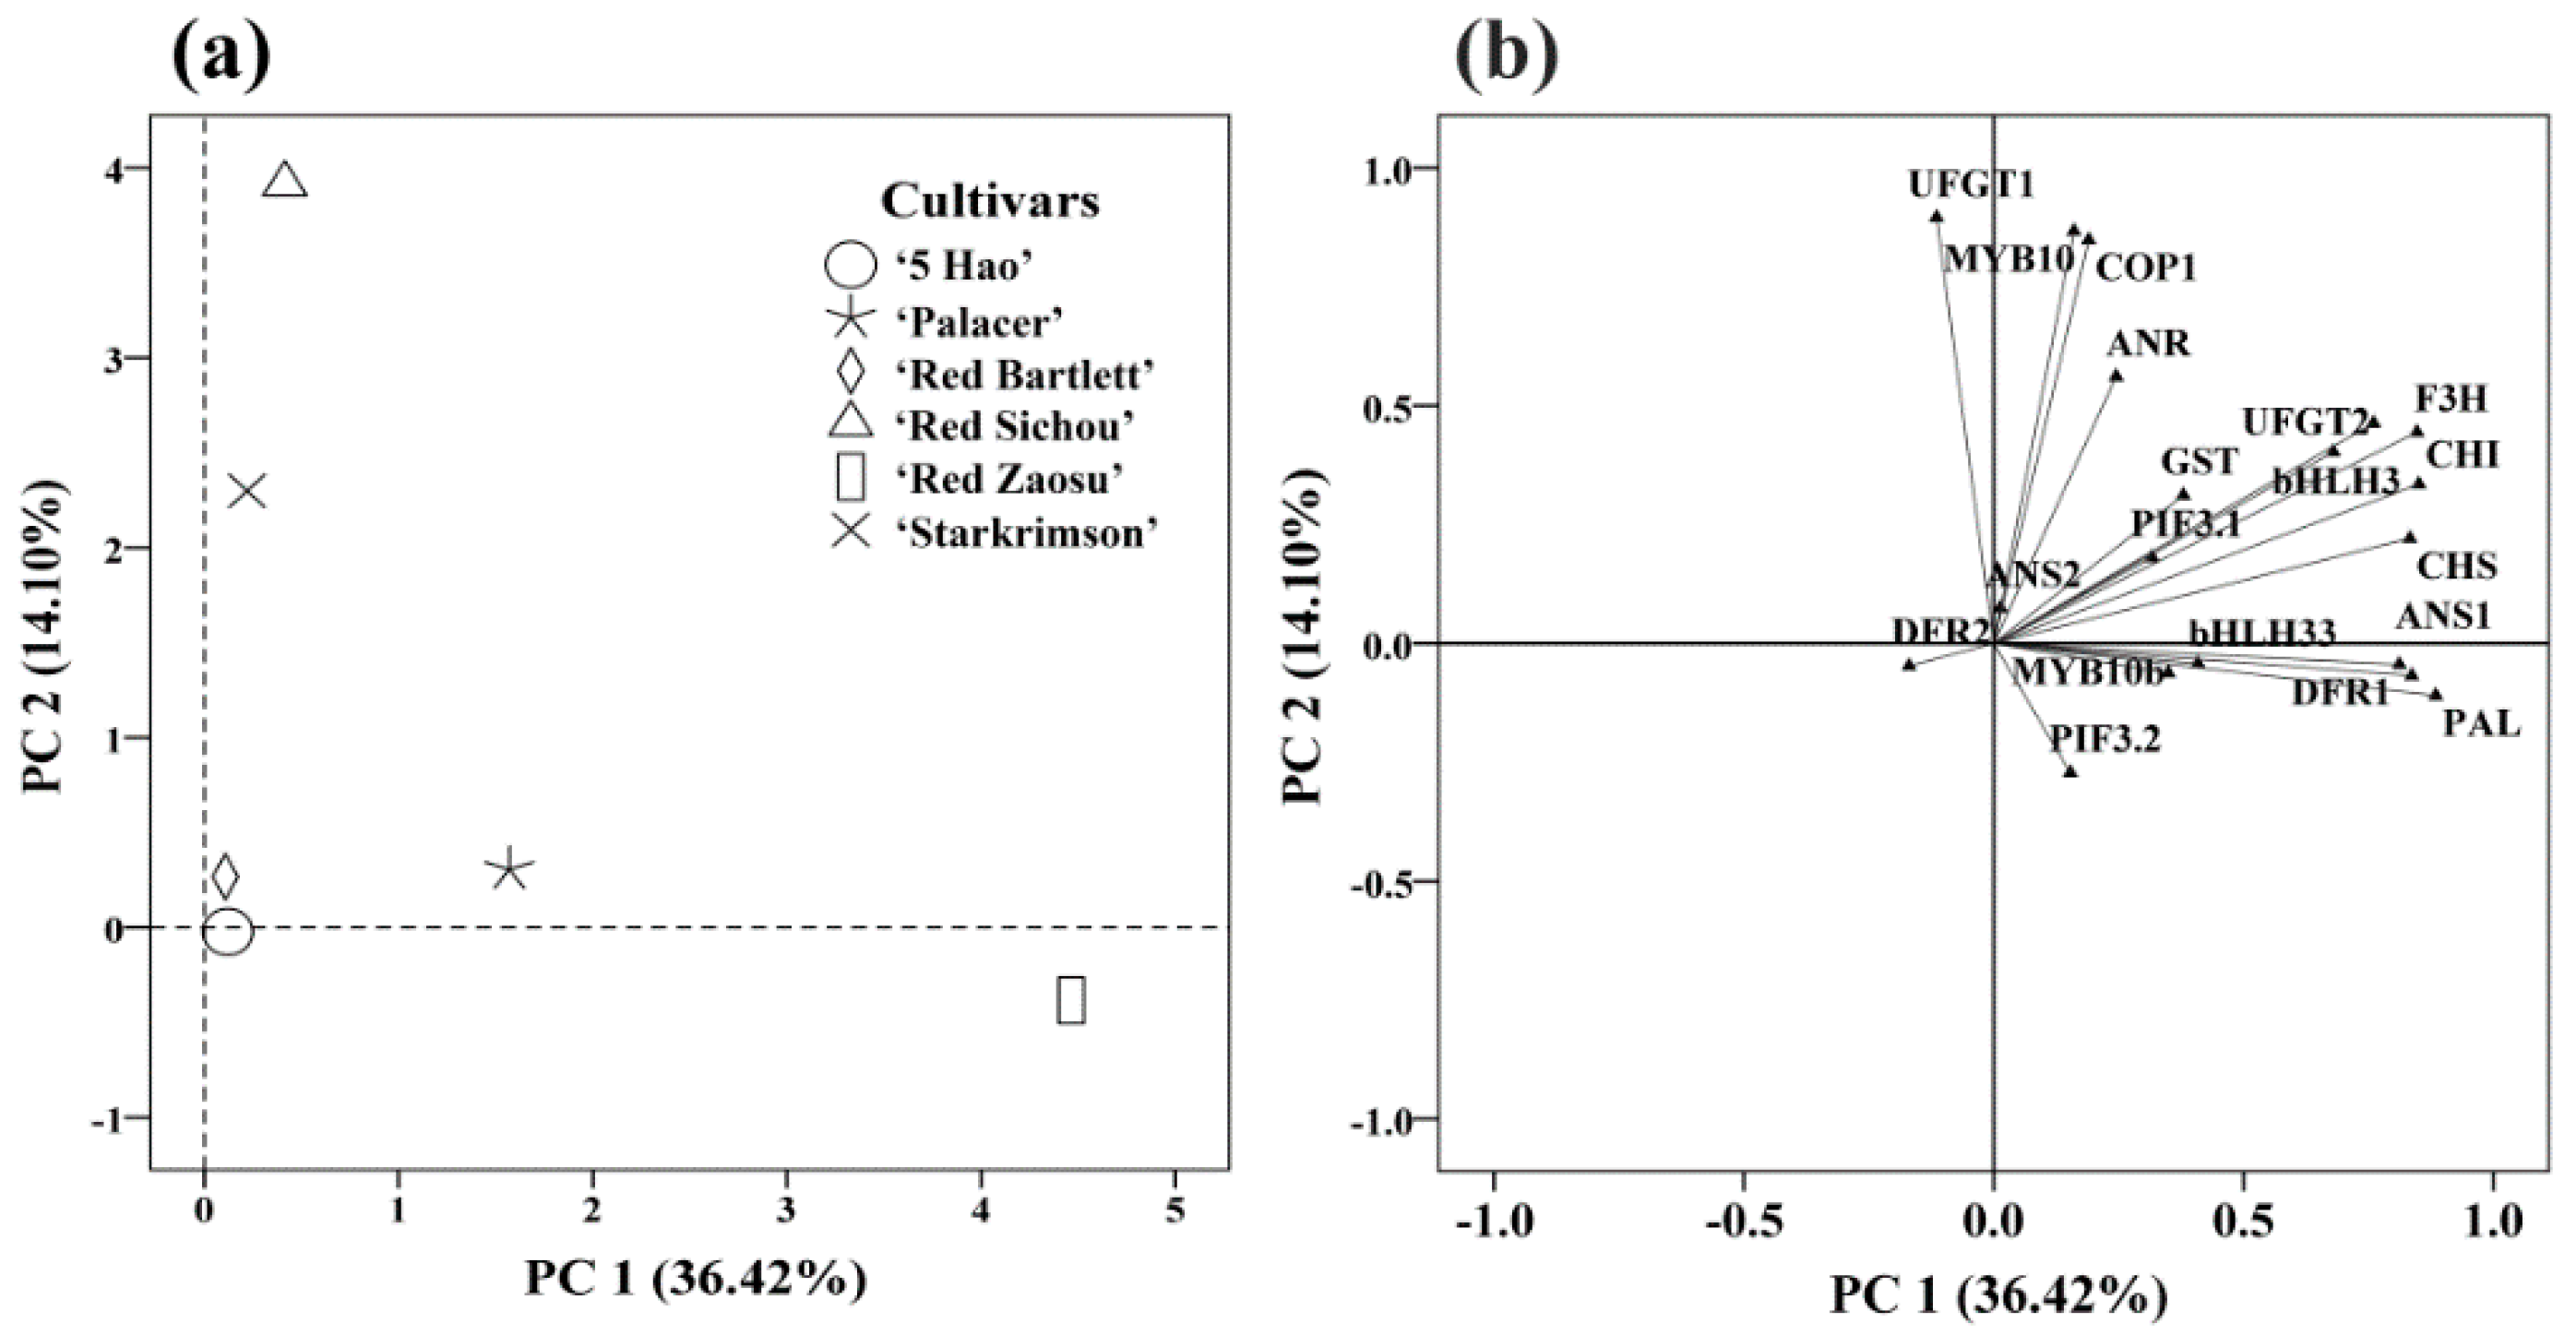
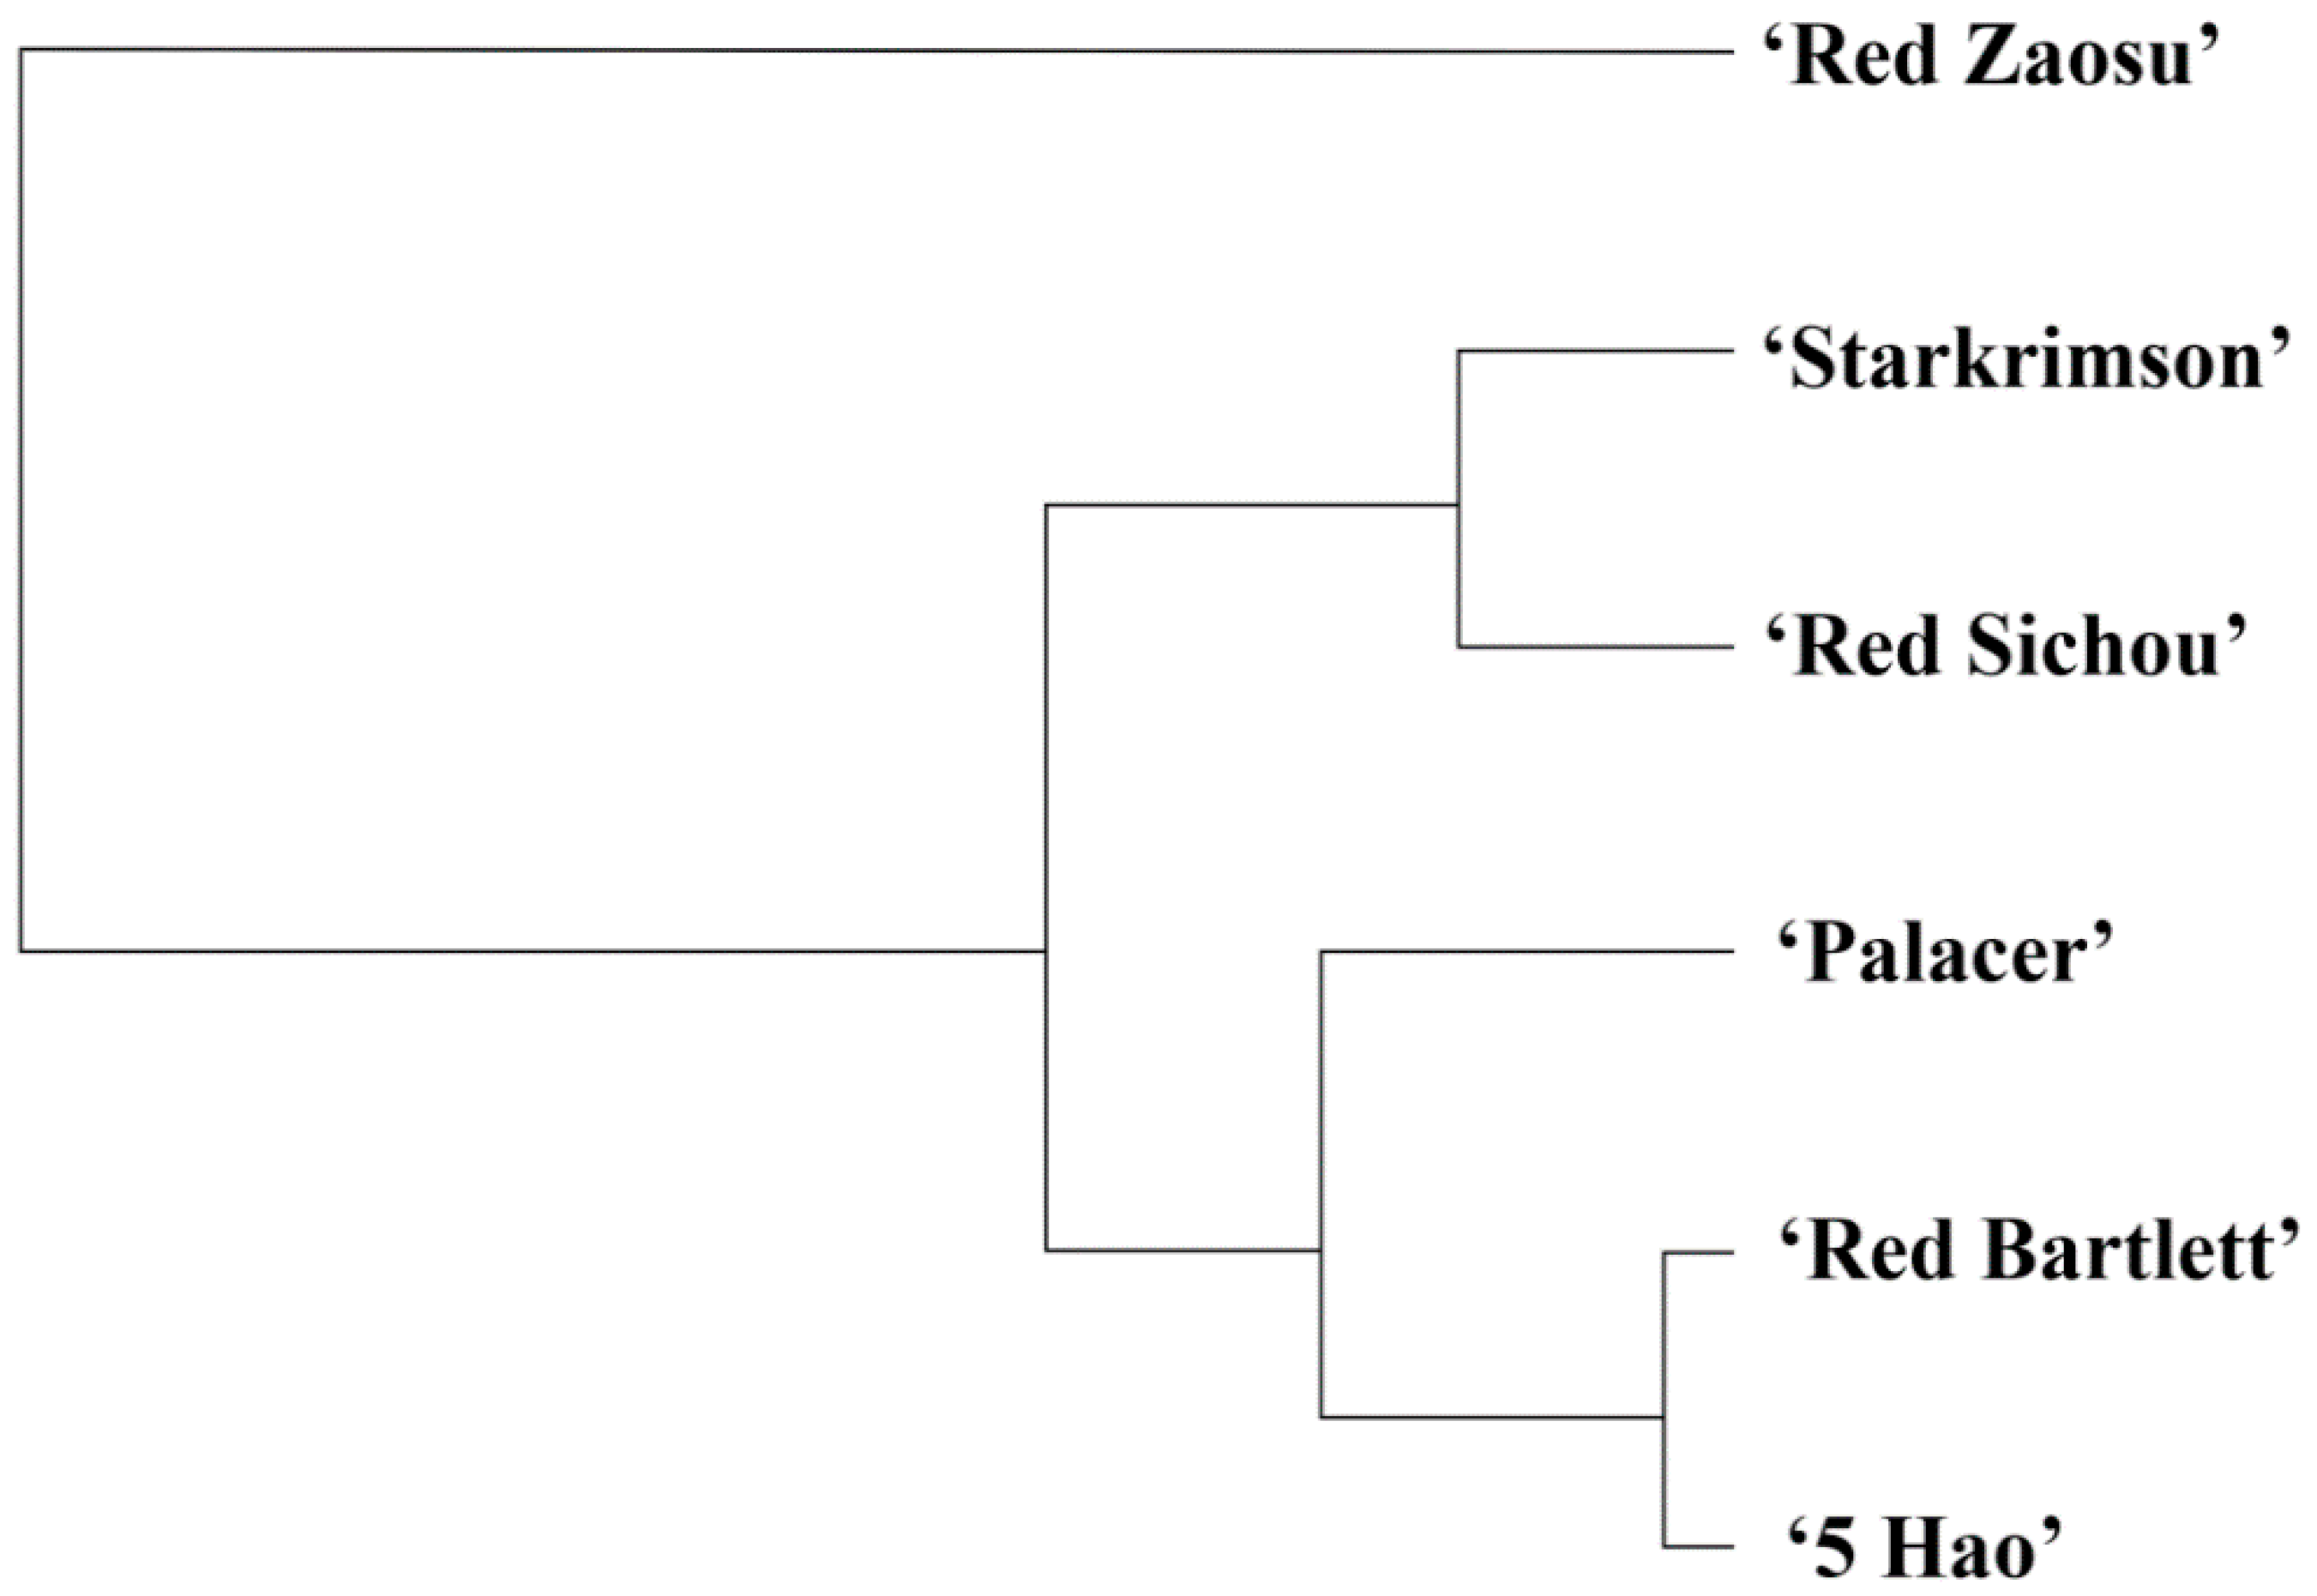
2.6. Classification and Analysis of Important Genes in the Six Red Pear Cultivars

To identify different coloring patterns and the responsible genes in six red pear cultivars, a Principal component analysis (PCA) was conducted on the anthocyanin accumulation (Figure 5a). Because the anthocyanin content peaked at 75 DAFB, we selected the quantitative data of genes at this developmental stage for analysis. The PCA readily discriminated the six cultivars using the first two principal components (PCs), which explained 50.52% of the total variance. PC1 discriminated Red Zaosu, mainly through differences in the expression levels of PAL, CHI, F3H, ANS1, CHS, DFR1, UFGT2, bHLH33, bHLH3, GST, MYB10b, and PIF3.1. PC2 discriminated Red Sichou and Starkrimson, based mainly on the transcriptional levels of CHI, F3H, UFGT2, bHLH3, GST, UFGT1, MYB10, COP1, and ANR (Figure 5b; Table S3). Palacer, 5 Hao, and Red Bartlett were discriminated by the two PCs. CHI, F3H, UFGT2, bHLH3, and GST were determined by the two PCs, indicating that these genes had commonalities in the six cultivars and could not be distinguished. The genes in PC1, PAL, ANS1, CHS, DFR1, bHLH33, MYB10b, and PIF3.1, were particular to Red Zaosu, indicating that their expression levels resulted in the unique anthocyanin accumulation pattern of Red Zaosu compared with the patterns of the other cultivars. The genes in PC2, UFGT1, MYB10, COP1, and ANR, were particular to the anthocyanin accumulation patterns of Red Sichou and Starkrimson.
To further classify the six cultivars, we performed a hierarchical cluster analysis according to the trends of anthocyanin accumulation (Figure 6). The six cultivars were divided into two groups. The European pears (Palacer, Red Bartlett, Starkrimson and Red Sichou) and the interspecific hybrid (5 Hao) were clustered into one group. Palacer, 5 Hao, and Red Bartlett were grouped on one branch, and the relationship between 5 Hao and Red Bartlett was the closest. Starkrimson and Red Sichou were grouped on to another branch. In addition, Red Zaosu (Asian pear) was clustered into one group, which had a special position in the dendrogram. The clustering results were basically consistent with the PCA (Figure 6).

3. Discussion

UFGT and ANS are downstream genes of anthocyanin biosynthesis [28]. Litchi, grape, apple, and other studies have confirmed the positive correlation between UFGT and anthocyanin accumulation [36,37,38]. In pears, the UFGT may be the decisive gene for the anthocyanin synthesis pathways [39,40,41]. There are also other studies showing that UFGT activity is not significantly correlated with anthocyanin accumulation. In the early development of pear fruits, anthocyanin contents and UFGT activity increased, while UFGT activity did not decrease when anthocyanin content decreased near maturity [31]. PbUFGT1 may be the key factor because its transcriptional level increased rapidly after picking in Red Zaosu, while PbUFGT2 showed a quite low transcriptional level after picking [42]. Moreover, the anthocyanin accumulation and transcriptional level of UFGT2 are highly correlated [43]. In our study, UFGT1 was only significantly positively correlated with the anthocyanin content of Red Bartlett and Starkrimson. However, UFGT2 was significantly positively correlated with the anthocyanin contents of multiple cultivars (5 Hao, Red Bartlett, Red Sichou, and Starkrimson) and positively correlated with those of Palacer and Red Zaosu (Figure 2; Table 1). Therefore, we speculate that UFGT2 may be an important gene for anthocyanin synthesis in the six pear cultivars. In red pears, ANS may also be a key gene for the anthocyanin synthesis pathways [39,40]. The expression trend of ANS1 and ANS2 was inconsistent with the trend of anthocyanin accumulation. In addition, the expression levels of ANS1 and ANS2 showed negative correlations with the anthocyanin contents in 5 Hao and Palacer (Figure 2; Table 1). PCA also showed that ANS1 and ANS2 were not key genes for anthocyanin accumulation in 5 Hao and Palacer (Figure 5). Analysis of the structural genes of anthocyanin in the kiwifruit Hongyang--F3H2 and F3GT1—shows that they may be important for the formation of red flesh during fruit development [44]. In apple skin, the expression level of F3H is consistent with anthocyanin accumulation, showing a positive correlation [37]. Our results also showed that F3H is positively correlated with anthocyanin accumulation.
MYB10 plays an important role in the regulation of anthocyanins in Rosaceae [45,46]. In pears, PyMYB10 and PbMYB10b play important roles in regulating anthocyanin biosynthesis [32,33,34]. Here, the expression level of MYB10 had a significant positive correlation with the anthocyanin contents of the cultivars, except Red Zaosu. MYB10b only had a significantly positive correlation with the anthocyanin content of 5 Hao (Table 1). Thus, MYB10 may be a key transcription factor involved in anthocyanin synthesis. In addition, the overexpression of MYB10/bHLH3 increases the production of anthocyanins in peaches by up-regulating CHS, DFR, and UFGT [47]. In apples, the interactions of MdbHLH3, MdbHLH33, and MdMYB10 induce anthocyanin accumulation, and the binding of MdMYB10/MdbHLH3 activates the DFR promoter much more than the binding of MdbHLH33 does [48]. Our study showed the same result. The expression level of bHLH33 did not show significant positive correlations with the anthocyanin levels in any of the cultivars, and only showed positive correlations to the levels in Red Zaosu, Palacer, and Red Sichou (Table 1). However, bHLH3 showed positive correlations with the anthocyanin accumulations in all of the cultivars. Thus, bHLH3 may play an important role in regulating anthocyanin synthesis in red pears. MYB10 and bHLH3 are crucial transcription factors involved in the anthocyanin biosynthesis of red pears.
Our study showed that some genes exhibited lower expression level at 55 DAFB. It is speculated that the rate of anthocyanin synthesis was affected by the high temperature or physiological reasons. High temperatures (greater than 30 °C) inhibit the expression of anthocyanin activators and related structural genes (CHS, F3H, DFR, LDOX and UFGT) in grapes, which affects anthocyanin synthesis [49].
GST has a positive correlation with anthocyanin accumulations in different species [24,25,26,27]. Our study corroborated these results. GST played an important role in the accumulation of anthocyanins and was positively correlated with the anthocyanin contents of the other three cultivars (Table 1). Many light-responsive genes are involved in anthocyanin synthesis. In apples and arabidopsis, COP1 degrade the MYB protein, which inhibits fruit coloration under dark conditions [20,50,51]. In this study, COP1 did not show a negative correlation with the anthocyanin contents of the cultivars, except for 5 Hao (Table 1). This result differs from those of previous reports, which might be the result of the different regulatory mechanisms of anthocyanin biosynthesis in different species. Overexpression of PIF3 can promote anthocyanins accumulation and can activate promoters of structural genes in the anthocyanin synthetic pathway [22]. PIF3.1’s expression level was positively correlated with the anthocyanin contents of the cultivars, except for 5 Hao (Table 1). This may be because 5 Hao is a hybrid of P. bretschneideri × P. communis. The expression level of PIF3.2 was only significantly positively correlated with the anthocyanin contents of Red Zaosu. This indicates that PIF3.1 plays an important role in the anthocyanin biosynthesis of red pears.
The PCA divided the six red pear cultivars into three types according to the dynamic expression levels of anthocyanin synthesis-related genes. Red Zaosu was separated into PC1 (Figure 5). The hierarchical cluster analysis also separated Red Zaosu into one group, showing that it has a distant relationship with the other five cultivars (Figure 6). There was a significant difference between the phenotype of Red Zaosu, in which the skin shows red-green stripes, and those of the other cultivars (Figure 1). Red Zaosu is the red bud mutation of Zaosu. Zaosu is a hybrid offspring of Mishirazi and Pingguoli (P. pyrifolia × P. ussuriensis). Mishirazi is native to Japan, with unknown parents, and is considered to be a hybrid offspring of P. communis × P. pyrifolia [52]. The PCA and cluster analysis separated 5 Hao and Red Bartlett into one group (Figure 5 and Figure 6). Many of their genes (CHS, F3H, MYB10, and bHLH3) had the same expression trends, and they all showed significant positive correlations with the anthocyanin contents (Table 1). Red Bartlett is the red bud mutation of Bartlett (P. communis), and 5 Hao is the hybrid offspring of Bartlett and an Asian pear. Their anthocyanin contents first increased and then decreased, with maximum accumulations at 75 DAFB. At that time, their anthocyanin contents dropped sharply as they entered the late stages of fruit development, and the fruits’ color faded.

4. Materials and Methods

4.1. Plant Materials and Experimental Treatments

The sample collection list is shown in Table S1. The six cultivars were collected from an orchard in Meixian, Shaanxi Province, China, in 2017. The pears were collected at 15, 35, 55, 75, and 95 days after full bloom (DAFB) (Table S1). Fifteen fruits acted as biological repeats, with three biological replicates per period. For each sample, the peels of the fruits were removed, immediately frozen in liquid nitrogen and stored at −80 °C for further use.

4.2. Anthocyanin Analysis

The total anthocyanin extraction was carried out as described by Giusti and Wrolstad [53], with slight modifications. Samples (0.2 g) were rapidly ground into a powder in liquid nitrogen, and then 1% HCL–methanol solution (5 mL) was added. Specific extraction steps and the method of calculation of the anthocyanin content are in accordance with the method of Wang et al. [24]. The anthocyanin content was determined spectrophotometrically. The absorbance of each extract was measured at 520 nm and 700 nm with a UV-Visible spectrophotometer (UV-1700, Kyoto, Japan). The total anthocyanin content was expressed as mg/kg fresh weight (FW). The value used for each sample was the mean of three independent biological replicates.

4.3. Quantification of Genes Expression

Total RNA from the ground sample was isolated according to Reid et al. [54]. RNA isolation was followed by a DNase I treatment (Tiangen, Beijing, China). The RNA concentration and quality were detected by UV spectrophotometry and by running samples on a 1.2% agar ethidium bromide-stained gel. Then, 1 μg of total RNA was reverse-transcribed to cDNA using a PrimeScript RT reagent kit with gDNA Eraser (TaKaRa, Dalian, China). Every quantitative real-time PCR (qRT-PCR) was performed in three replicates on an Icycler iQ5 (Bio-Rad, Berkeley, CA, USA) with the SYBR Premix Ex Taq II (TaKaRa, Dalian, China) according to the manufacturer’s instructions. Reaction mixes (20 μL) included 10 μL of SYBR Green Supermix (TaKaRa, Dalian, China), 2 μL of diluted cDNA, and 0.4 μM of each primer. The specific annealing of the oligonucleotides was verified by dissociation kinetics at the end of each PCR run. The efficiency of each primer pair was quantified using a PCR-product serial dilution. All biological samples were assayed in technical triplicates. The EF1 and GAPDH genes were used as internal standards and for normalizing the expression. Data were analyzed using iQ5 2.0 software (Bio-Rad) with the 2−ΔΔCT algorithm. All primer sequences are listed in Table S2.

4.4. Statistical Analyses

Statistical analyses were performed using Microsoft Excel 2010 and GraphPad Prism 5.01. (GraphPad Prism Software, San Diego, CA, USA). Each value is the mean ± standard deviation of three independent biological replicates.
Data were analyzed with multivariate analysis methods using SPSS 23.0 software (SPSS, Chicago, IL, USA). The Pearson correlation analysis (r) of the anthocyanin content and gene transcript levels was used to test for statistical significance (P). Statistically significant correlations were based on p ≤ 0.05. A PCA was conducted on the mean-centered and scaled data to investigate the discrimination of different cultivars using gene transcript levels. The ability of each principal component (PC) to explain the corresponding variables (select data with correlation coefficients greater than the absolute value 0.3) is shown in Supplementary Table S3. A dendrogram for the six pear cultivars was derived from the results of the real-time PCR by a hierarchical cluster analysis.

5. Conclusions

The peak accumulations of anthocyanin in all of the cultivars occurred during the middle stages of fruit development. The different expression levels of the structural genes F3H and UFGT2 were important for anthocyanin accumulation in the six cultivars. The transcription factors MYB10 and bHLH3 were also important for anthocyanin accumulation. A PCA and hierarchical cluster analysis were used to distinguish the types of cultivars and the genes important for each type of anthocyanin accumulation pattern. The anthocyanin contents of all six cultivars showed a rise–drop tendency. The six cultivars were divided into three groups, with Red Zaosu (Asian pear) clustered into one group, Red Sichou and Starkrimson (European pears) clustered into another group, and the Palacer, Red Bartlett (European pears), and 5 Hao (interspecific Pyrus hybrid) clustered into a third group. The potential mechanisms behind the regulation of anthocyanin synthesis are complex, and further studies of related gene functions still need to be explored.

Supplementary Materials

The following are available online at https://www.mdpi.com/2223-7747/8/4/100/s1, Table S1: Sample site of six red pear cultivars, Table S2: Sequences of primers used for qRT-PCR analysis, Table S3: Rotated Component Matrix, Figure S1: A schematic presentation of the flavonoid biosynthetic pathway leading to anthocyanins.

Author Contributions

Conceptualization, M.W., J.L., L.X. and Z.W.; data curation, M.W. and Z.W.; formal analysis, M.W., X.L. and J.L.; funding acquisition, L.X. and Z.W.; methodology, M.W. and Z.W.; project administration, L.X. and Z.W.; resources, L.X.; software, M.W. and J.L.; supervision, L.S. and Z.W.; validation, M.W., J.L., L.C. Z.L. and R.Y.; writing—original draft, M.W. and J.L.; writing—review and editing, L.S., C.Y. and Z.W.

Funding

This work was supported by the National Natural Science Foundation of China (31572086, 31171925, 31401845), Weinan Experimental Station foundation of Northwest A&F University and China Postdoctoral Science Foundation funded project(2015M582714).

Acknowledgments

We thank Lesley Benyon, from LiwenBianji, Edanz Group China (www.liwenbianji.cn/ac), for editing the English text of a draft of this manuscript.

Conflicts of Interest

The authors declare that the research was conducted in the absence of any commercial or financial relationships that could be construed as a potential conflict of interest.

References

  1. Tao, P.; Shu, Q.; Wang, J.J.; Zhang, W.B. Present situation and prospect of research and utilization on red pear germplasm resources. Southwest China J. Agric. Sci. 2004, 17, 409–412. [Google Scholar]
  2. Dussi, M.C.; Sugar, D.; Wrolstad, R.E. Characterizing and quantifying anthocyanins in red pears and the effect of light quality on fruit color. J. Am. Soc. Hortic. Sci. 1995, 120, 785–789. [Google Scholar] [CrossRef]
  3. Dayton, D.F. The pattern and inheritance of anthocyanin distribution in red pears. J. Am. Soc. Hortic. Sci. 1996, 89, 110–116. [Google Scholar]
  4. Xiao, C.; Jiaming, L.I.; Yao, G.F.; Liu, J.; Hu, H.J. Characteristics of components and contents of anthocyanin in peel of red-skinned pear fruits from different species. J. Nanjing Agric. Univ. 2004, 37, 60–66. [Google Scholar]
  5. Holton, T.A.; Cornish, E.C. Genetics and Biochemistry of Anthocyanin Biosynthesis. Plant Cell 1995, 7, 1071–1083. [Google Scholar] [CrossRef] [PubMed]
  6. Boss, P.K.; Davies, C.; Robinson, S.P. Analysis of the Expression of Anthocyanin Pathway Genes in Developing Vitis vinifera L. cv Shiraz Grape Berries and the Implications for Pathway Regulation. Plant Physiol. 1996, 111, 1059–1066. [Google Scholar] [CrossRef] [PubMed]
  7. Grotewold, E. The genetics and biochemistry of floral pigments. Annu. Rev. Plant Biol. 2006, 57, 761–780. [Google Scholar] [CrossRef]
  8. Bogs, J.; Ebadi, A.; McDavid, D.; Robinson, S.P. Identification of the flavonoid hydroxylases from grapevine and their regulation during fruit development. Plant Physiol. 2006, 140, 279–291. [Google Scholar] [CrossRef] [PubMed]
  9. Han, Y.P.; Vimolmangkang, S.; Soria-Guerra, R.E.; Rosales-Mendoza, S.; Zheng, D.M.; Lygin, A.V.; Korban, S.S. Ectopic expression of apple F3’H genes contributes to anthocyanin accumulation in the Arabidopsis tt7 mutant grown under nitrogen stress. Plant Physiol. 2010, 153, 806–820. [Google Scholar] [CrossRef] [PubMed]
  10. Allan, A.C.; Hellens, R.P.; Laing, W.A. MYB transcription factors that colour our fruit. Trends Plant Sci. 2008, 13, 99–102. [Google Scholar] [CrossRef]
  11. Feller, A.; Machemer, K.; Braun, E.L.; Grotewold, E. Evolutionary and comparative analysis of MYB and bHLH plant transcription factors. Plant J. 2011, 66, 94. [Google Scholar] [CrossRef]
  12. Lai, Y.; Huanxiu, L.I.; Yamagishi, M. A review of target gene specificity of flavonoid R2R3-MYB transcription factors and a discussion of factors contributing to the target gene selectivity. Front. Biol. 2013, 8, 577–598. [Google Scholar] [CrossRef]
  13. Starkevič, P.; Paukštytė, J.; Kazanavičiūtė, V.; Denkovskienė, E.; Stanys, V.; Bendokas, V. Expression and anthocyanin biosynthesis-modulating potential of sweet cherry (prunus avium L.) MYB10 and bHLH genes. PLoS ONE 2015, 10, e0126991. [Google Scholar]
  14. Cutuli, B.; Lemanski, C.; Fourquet, A.; Lafontan, B.D.; Giard, S.; Lancrenon, S. Environmental significance of anthocyanins in plant stress responses. Photochem. Photobiol. 2010, 70, 1–9. [Google Scholar]
  15. Jaakola, L. New insights into the regulation of anthocyanin biosynthesis in fruit. Trends Plant Sci. 2013, 18, 477–483. [Google Scholar] [CrossRef] [PubMed]
  16. Shaked-Sachray, L.; Weiss, D.; Reuveni, M.; Nissim-Levi, A.; Oren-Shamir, M. Increased anthocyanin accumulation in aster flowers at elevated temperatures due to magnesium treatment. Physiol. Plant. 2002, 114, 559–565. [Google Scholar] [CrossRef] [PubMed]
  17. Oren-Shamir, M. Does anthocyanin degradation play a significant role in determining pigment concentration in plants? Plant Sci. 2009, 177, 310–316. [Google Scholar] [CrossRef]
  18. Vaknin, H.; Bar-Akiva, A.; Ovadia, R.; Nissim-Levi, A.; Forer, I.; Weiss, D.; Oren-Shamir, M. Active anthocyanin degradation in brunfelsia calycina(yesterday–today–tomorrow) flowers. Planta 2005, 222, 19–26. [Google Scholar] [CrossRef] [PubMed]
  19. Zipor, G.; Patrícia, D.; Inês, C.; Shahar, L.; Ovadia, R.; Teper-Bamnolker, P.; Eshel, D.; Levin, Y.; Doron-Faigenboim, A.; Sottomayor, M.; et al. In planta anthocyanin degradation by a vacuolar class III peroxidase in brunfelsia calycina flowers. New Phytol. 2015, 205, 653–665. [Google Scholar] [CrossRef] [PubMed]
  20. Li, Y.Y.; Mao, K.; Zhao, C.; Zhao, X.Y.; Zhang, H.L.; Shu, H.R.; Hao, Y.J. MdCOP1 Ubiquitin E3 Ligases Interact with MdMYB1 to Regulate Light-Induced Anthocyanin Biosynthesis and Red Fruit Coloration in Apple. Plant Physiol. 2012, 160, 1011–1022. [Google Scholar] [CrossRef]
  21. Toledoortiz, G.; Huq, E.; Quail, P.H. The Arabidopsis basic/helix-loop-helix transcription factor family. Plant Cell 2003, 15, 1749–1770. [Google Scholar] [CrossRef]
  22. Shin, J.; Park, E.; Choi, G. PIF3 regulates anthocyanin biosynthesis in an HY5-dependent manner with both factors directly binding anthocyanin biosynthetic gene promoters in Arabidopsis. Plant J. 2007, 49, 981–994. [Google Scholar] [CrossRef] [PubMed] [Green Version]
  23. Marr, K.A.; Alfenito, M.R.; Lloyd, A.M.; Walbot, V. A glutathione S-transferase involved in vacuolar transfer encoded by the maize gene Bronze-2. Nature 1995, 375, 397–400. [Google Scholar] [CrossRef] [PubMed]
  24. Mueller, L.A.; Goodman, C.D.; Silady, R.A.; Walbot, V. AN9, a petunia glutathione S-transferase required for anthocyanin sequestration, is a flavonoid-binding protein. Plant Physiol. 2000, 123, 1561–1570. [Google Scholar] [CrossRef] [PubMed]
  25. Kitamura, S.; Shikazono, N.; Tanaka, A. TRANSPARENT TESTA 19 is involved in the accumulation of both anthocyanins and proanthocyanidins in Arabidopsis. Plant J. 2004, 37, 104–114. [Google Scholar] [CrossRef] [PubMed]
  26. Conn, S.; Curtin, C.; Bezier, A.; Franco, C.; Zhang, W. Purification, molecular cloning, and characterization of glutathione S-transferases (GSTs) from pigmented Vitis vinifera L. cell suspension cultures as putative anthocyanin transport proteins. J. Exp. Bot. 2008, 59, 3621–3634. [Google Scholar] [CrossRef]
  27. Kitamura, S.; Akita, Y.; Ishizaka, H.; Narumi, I.; Tanaka, A. Molecular characterization of an anthocyanin-related glutathione S-transferase gene in cyclamen. J. Plant Physiol. 2012, 169, 636–642. [Google Scholar] [CrossRef]
  28. Fischer, T.C.; Gosch, C.; Pfeiffer, J.; Halbwirth, H.; Halle, C.; Stich, K.; Forkmann, G. Flavonoid genes of pear (Pyrus communis). Trees 2007, 21, 521–529. [Google Scholar] [CrossRef]
  29. Yu, B.; Zhang, D.; Huang, C.; Qian, M.J.; Zheng, X.Y.; Teng, Y.W.; Su, J.; Shu, Q. Isolation of anthocyanin biosynthetic genes in red Chinese sand pear (Pyrus pyrifolia Nakai) and their expression as affected by organ/tissue, cultivar, bagging and fruit side. Sci. Hortic. 2012, 136, 29–37. [Google Scholar] [CrossRef]
  30. Yang, Y.N.; Yao, G.F.; Zheng, D.M.; Zhang, S.L.; Wang, C.; Zhang, M.Y.; Wu, J. Expression differences of anthocyanin biosynthesis genes reveal regulation patterns for red pear coloration. Plant Cell Rep. 2015, 34, 189–198. [Google Scholar] [CrossRef]
  31. Steyn, W.J.; Holcroft, D.M.; Wand, S.J.E.; Jacobs, G. Regulation of pear color development in relation to activity of flavonoid enzymes. J. Am. Soc. Hortic. Sci. 2004, 129, 6–12. [Google Scholar] [CrossRef]
  32. Feng, S.Q.; Wang, Y.L.; Yang, S.; Xu, Y.T.; Chen, X.S. Anthocyanin biosynthesis in pears is regulated by a R2R3-MYB transcription factor PyMYB10. Planta 2010, 232, 245–255. [Google Scholar] [CrossRef]
  33. Wang, Z.G.; Meng, D.; Wang, A.D.; Li, T.L.; Jiang, S.L.; Cong, P.H.; Li, T. The methylation of the PcMYB10 promoter is associated with green-skinned sport in Max Red Bartlett pear. Plant Physiol. 2013, 162, 885–896. [Google Scholar] [CrossRef]
  34. Zhai, R.; Wang, Z.M.; Zhang, S.W.; Meng, G.; Song, L.Y.; Wang, Z.G.; Li, P.; Ma, F.; Xu, L. Two MYB transcription factors regulate flavonoid biosynthesis in pear fruit (Pyrus bretschneideri Rehd.). J. Exp. Bot. 2016, 67, 1275. [Google Scholar] [CrossRef]
  35. Wang, Z.G.; Du, H.; Zhai, R.; Song, L.Y.; Ma, F.W.; Xu, L.F. Transcriptome Analysis Reveals Candidate Genes Related to Color Fading of Red Bartlett (Pyrus communis L.). Front. Plant Sci. 2017, 8, e0142112. [Google Scholar] [CrossRef]
  36. Kobayashi, S.; Ishimaru, M.; Ding, C.K.; Yakushiji, H.; Goto, N. Comparison of UDP-glucose: Flavonoid 3-O-glucosyltransferase (UFGT) gene sequences between white grapes (Vitis vinifera) and their sports with red skin. Plant Sci. 2001, 163, 543–550. [Google Scholar] [CrossRef]
  37. Kim, S.H.; Lee, J.R.; Hong, S.T.; Yoo, Y.K.; An, G.; Kim, S.R. Molecular cloning and analysis of anthocyanin biosynthesis genes preferentially expressed in apple skin. Plant Sci. 2003, 165, 403–413. [Google Scholar] [CrossRef]
  38. Zhao, Z.C.; Hu, G.B.; Hu, F.C.; Wang, H.C.; Yang, Z.Y.; Lai, B. The udp glucose: Flavonoid-3-o-glucosyltransferase (ufgt) gene regulates anthocyanin biosynthesis in litchi (litchi chinesissonn.) during fruit coloration. Mol. Biol. Rep. 2012, 39, 6409–6415. [Google Scholar] [CrossRef]
  39. Pierantoni, L.; Dondini, L.; De Franceschi, P.; Musacchi, S.; Winkel, B.S.J.; Sansavini, S. Mapping of an anthocyanin-regulating MYB transcription factor and its expression in red and green pear, Pyrus communis. Plant Physiol. Biochem. 2010, 48, 1020. [Google Scholar] [CrossRef]
  40. Yang, Y.N.; Zhao, G.; Yue, W.Q.; Zhang, S.L.; Gu, C.; Wu, J. Molecular cloning and gene expression differences of the anthocyanin biosynthesis-related genes in the red/green skin color mutant of pear (Pyrus communis L.). Tree Genet. Genomes 2013, 9, 1351–1360. [Google Scholar] [CrossRef]
  41. Zhu, Y.F.; Su, J.; Yao, G.F.; Liu, H.N.; Gu, C.; Qin, M.F.; Bai, B.; Cai, S.S.; Wang, G.M.; Wang, R.Z.; et al. Different light-response patterns of coloration and related gene expression in red pears (Pyrus L.). Sci. Hortic. 2018, 229, 240–251. [Google Scholar] [CrossRef]
  42. Zhai, R.; Liu, X.T.; Feng, W.T.; Chen, S.S.; Xu, L.F.; Wang, Z.G.; Zhang, J.L.; Li, P.M.; Ma, F.W. Different biosynthesis patterns among flavonoid 3-glycosides with distinct effects on accumulation of other flavonoid metabolites in pears (Pyrus bretschneideri Rehd.). PLoS ONE 2014, 9, e91945. [Google Scholar] [CrossRef]
  43. Qian, M.J.; Sun, Y.W.; Allan, A.C.; Teng, Y.W.; Zhang, D. The red sport of ‘Zaosu’ pear and its red-striped pigmentation pattern are associated with demethylation of the PyMYB10 promoter. Phytochemistry 2014, 107, 16–23. [Google Scholar] [CrossRef]
  44. Huang, C.H.; Ge, C.L.; Zhang, X.H.; Wu, H.; Qu, X.Y.; Xu, X.B. Expression analysis of structural genes related to anthocyanin synthesis in a mutant of ‘Hongyang’ kiwifruit. J. Fruit Sci. 2014, 31, 169–174. [Google Scholar]
  45. Chagné, D.; Carlisle, C.M.; Blond, C.; Volz, R.K.; Whitworth, C.J.; Oraguzie, N.C.; Crowhurst, R.N.; Allan, A.C.; Espley, R.V.; Hellens, R.P. Mapping a candidate gene (MdMYB10) for red flesh and foliage colour in apple. BMC Genom. 2007, 8, 212. [Google Scholar] [CrossRef] [PubMed]
  46. Kui, L.W.; Bolitho, K.; Grafton, K.; Kortstee, A.; Karunairetnam, S.; McGhie, T.K.; Espley, R.V.; Hellens, R.P.; Allan, A.C. An R2R3 MYB transcription factor associated with regulation of the anthocyanin biosynthetic pathway in Rosaceae. BMC Plant Biol. 2010, 10, 50. [Google Scholar]
  47. Rahim, M.A.; Busatto, N.; Trainotti, L. Regulation of anthocyanin biosynthesis in peach fruits. Planta 2014, 240, 913–929. [Google Scholar] [CrossRef] [PubMed]
  48. Espley, R.V.; Hellens, R.P.; Putterill, J.; Stevenson, D.E.; Kutty-Amma, S.; Allan, A.C. Colouration in apple fruit is due to the activity of the MYB transcription factor MdMYB10. Plant J. 2007, 49, 414. [Google Scholar] [CrossRef] [PubMed]
  49. Mori, K.; Sugaya, S.; Gemma, H. Decreased anthocyanin biosynthesis in grape berries grown under elevated night temperature condition. Sci Hortic. 2005, 105, 319–330. [Google Scholar] [CrossRef]
  50. Li, T.; Jia, K.P.; Lian, H.L.; Yang, X.; Li, L.; Yang, H.Q. Jasmonic acid enhancement of anthocyanin accumulation is dependent on phytochrome a signaling pathway under far-red light in Arabidopsis. Biochem. Biophys. Res. Commun. 2014, 454, 78–83. [Google Scholar] [CrossRef]
  51. Maier, A.; Schrader, A.; Kokkelink, L.; Falke, C.; Welter, B.; Iniesto, E.; Rubio, V.; Uhrig, J.F.; Hülskamp, M.; Hoecker, U. Light and the E3 ubiquitin ligase COP1/SPA control the protein stability of the MYB transcription factors PAP1 and PAP2 involved in anthocyanin accumulation in Arabidopsis. Plant J. 2013, 74, 638–651. [Google Scholar] [CrossRef] [Green Version]
  52. Kimura, T.; Sawamura, Y.; Kotobuki, K.; Matsuta, N.; Hayashi, T.; Ban, Y.; Yamamoto, T. Parentage Analysis in Pear Cultivars Characterized by SSR Markers. J. Jpn. Soc. Hortic. Sci. 2003, 72, 182–189. [Google Scholar] [CrossRef] [Green Version]
  53. Giusti, M.M.; Wrolstad, R.E. Characterization and Measurement of Anthocyanins by UV-Visible Spectroscopy. In Current Protocols in Food Analytical Chemistry; John Wiley & Sons, Inc.: New York, NY, USA, 2001. [Google Scholar]
  54. Reid, K.E.; Olsson, N.; Schlosser, J.; Peng, F.; Lund, S.T. An optimized grapevine RNA isolation procedure and statistical determination of reference genes for real-time RT-PCR during berry development. BMC Plant Biol. 2006, 6, 27. [Google Scholar] [CrossRef] [PubMed]
Figure 1. Changes in six red pear cultivars’ skin color and anthocyanin contents at different stages of fruit development. (a) The phenotypes and changes in skin color at different stages of fruit development. (b) The total anthocyanin contents at different stages of fruit development. Data are means ± standard deviations of three biological replicates.
Plants 08 00100 g001
Figure 2. Relative expression levels of the anthocyanin biosynthesis-related structural genes of six red pear cultivars at different stages of fruit development.
Plants 08 00100 g002
Figure 3. Relative expression levels of the anthocyanin biosynthesis-related transcription factor genes of six red pear cultivars at different stages of fruit development.
Plants 08 00100 g003
Figure 4. Relative expression levels of the anthocyanin biosynthesis-related transporter and light-responsive genes of six red pear cultivars at different stages of fruit development.
Plants 08 00100 g004
Figure 5. Principal component analysis of the skin of six red pears at different stages of fruit development. (a) Discrimination of six cultivars. (b) Loading plots of metabolites and transcripts for the first two principal components (PC1 and PC2).
Plants 08 00100 g005
Figure 6. Dendrogram of the six red pear cultivars derived from the hierarchical cluster analysis.
Plants 08 00100 g006
Table 1. Correlation analysis of the anthocyanin contents of six red pear cultivars and anthocyanin synthesis-related gene expression levels.
Anthocyanin5 HaoRed BartlettRed ZaosuPalacerRed SichouStarkrimson
PAL0.590 *0.090.534 *0.1780.571 *0.058
CHS0.962 **0.779 **0.639 *0.611 *0.861 **−0.102
CHI0.3820.759 **0.4730.692 **0.830 **0.416
F3H0.943 **0.882 **0.5040.556 *0.850 **0.557 *
DFR10.794 **0.759 **0.499−0.0030.3580.586 *
DFR20.578 *0.4510.0050.0330.648 **−0.137
ANS1−0.2780.578 *0.429−0.470.4920.458
ANS2−0.2210.290.553 *−0.4110.3360.257
ANR−0.280.2270.0650.590 *0.523 *−0.049
UFGT10.3010.792 **−0.0730.2310.4490.754 **
UFGT20.949 **0.725 **0.5130.4590.775 **0.767 **
MYB10b0.809 **−0.1690.3580.017−0.065−0.222
MYB100.953 **0.875 **0.3920.745 **0.679 **0.725 **
bHLH30.744 **0.747 **0.3110.639 *0.680 **0.751 **
bHLH33−0.273−0.0550.470.0230.219−0.009
GST0.948 **0.908 **0.3990.4770.5130.773 **
COP1−0.2990.860 **0.0710.670 **0.2780.716 **
PIF3.1−0.2940.4880.684 **0.3790.791 **0.692 **
PIF3.2−0.046−0.040.783 **0.1430.4810.297
All data are means based on three replicates. Levels of significance: * p ≤ 0.05; ** p ≤ 0.01.

