1. Introduction
The importance of mesophyll conductance to CO
2 movement (g
m) within leaves of C
3 species in limiting rates of photosynthesis (A) has become increasingly apparent [
1,
2,
3]. Several basically different methods of estimating g
m have been developed, including on-line carbon isotope discrimination [
4,
5], two different types of chlorophyll fluorescence measurements combined with CO
2 fixation rates [
6], methods based on the curvature of initial A vs. C
i curves [
7], and calculation based on the oxygen sensitivity of photosynthesis [
8]. All of these methods are based on discrepancies between sub-stomatal CO
2 (C
i) values estimated by gas exchange and estimates of CO
2 at the site of Rubisco inside the chloroplast (C
c) based on the biochemical C
3 photosynthesis model of Farquhar, von Caemmerer and Berry [
9]. Several variations on some of the fluorescence-based methods have also been developed. Singh and Reddy [
10] compared several methods and some of their variations in soybean leaves, and found little disagreement among the methods compared. Killi and Haworth [
11] reported similar g
m values obtained from curvature of A vs. C
i curves and from fluorescence measurements combined with gas exchange. However, those comparisons did not deal with possible changes in g
m with CO
2 concentration. Variation in g
m with measurement CO
2 concentration has been reported in several cases [
5,
12,
13,
14,
15,
16], but was not found in others [
4,
6,
16]. However, many of these measurements were limited to C
i values > 200 μmol mol
−1 because lower C
i values increase errors in the estimate [
6]. However, because photosynthesis would be most sensitive to variation in g
m in the Rubisco-limited region of low C
i, this work focused on comparing methods in this region of response curves. Some modelling efforts suggested that some apparent variation in g
m with CO
2 concentration could be artefacts caused by photorespiration [
17]. However, Flexas et al. [
12] and Mizokami et al. [
18] reported changes in g
m with CO
2 even at low O
2, which eliminates photorespiration in these particular cases. Furthermore, an effect of CO
2 concentration on aquaporins has been reported [
19], potentially providing a mechanism for CO
2 impacts on g
m [
18].
In this paper, three different methods of estimating gm were used to test for changes in gm with Ci over the Rubisco-limited range of Ci in three different plant species. One of the methods used a new method of rapidly generating many densely positioned data points on A vs. Ci curves of single leaves.
2. Results
At 2% O
2, values of A at each C
i corrected for the O
2 sensitivity of water vapor and carbon dioxide analysis by the LiCor 6400 system software were in close agreement with values of A at the same C
i measured with the CIRAS-3 system without correction for O
2 concentration (
Figure 1).
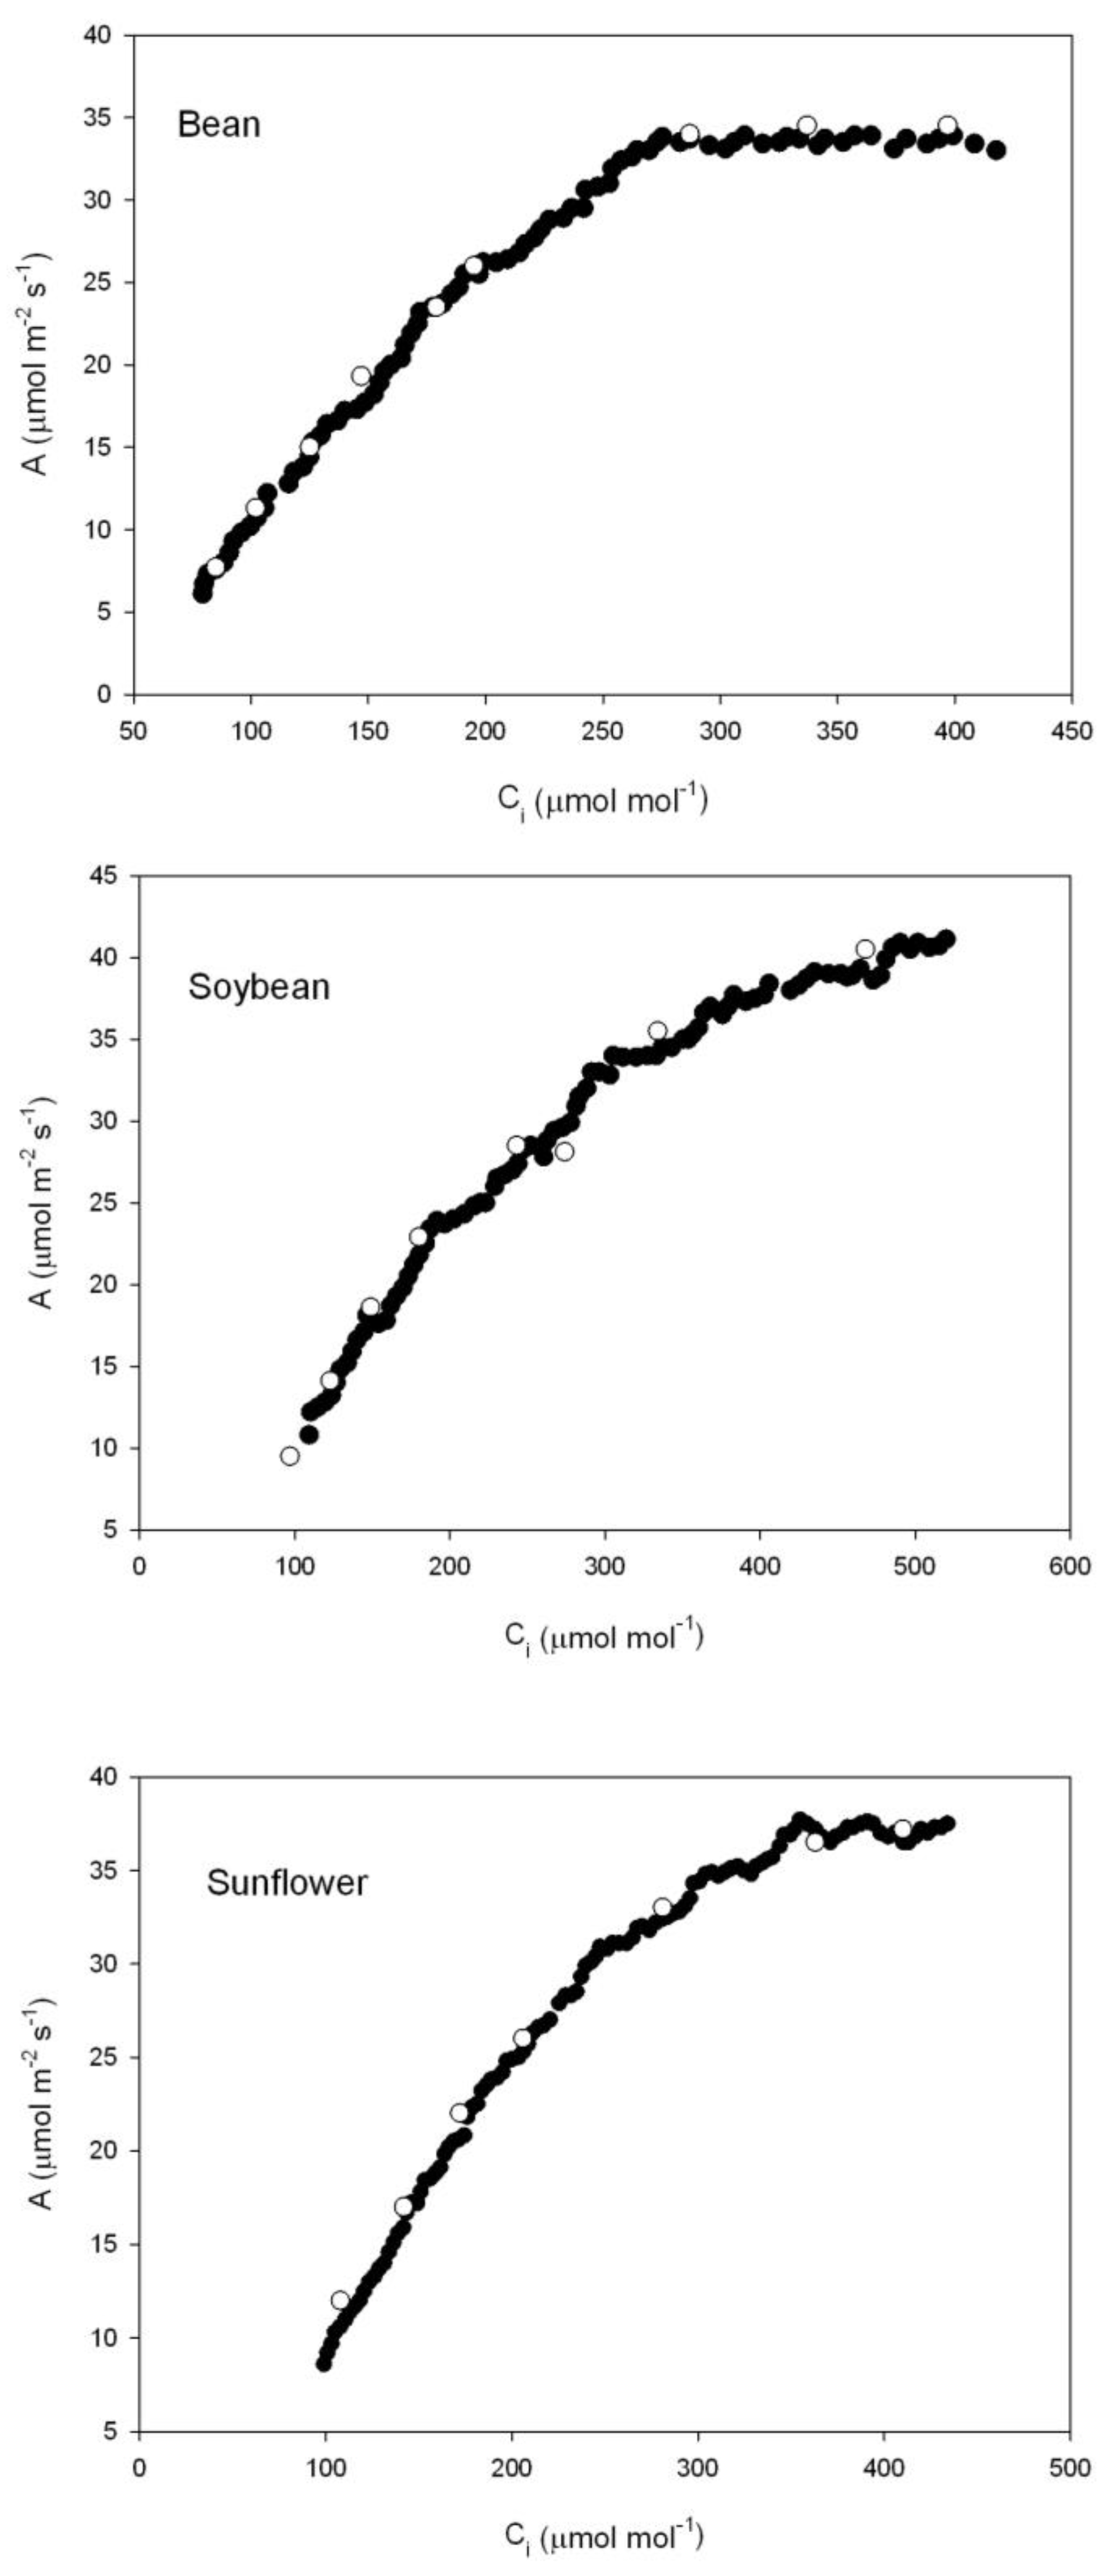
Examples of multipoint A vs. C
i curves obtained with the CIRAS-3 CO
2 ramping technique are presented in
Figure 2. The data define reasonably smooth A vs. C
i curves, and agree well with steady-state A vs. C
i curves. There were enough data points generated rapidly from single leaves to use the Sharkey et al. [
20] curve fitting program for at least three separate sections of the Rubisco-limited part of the curve. The analysis program generally requires at least five data points in the Rubisco-limited part of the curve.
In testing the sensitivity of the variable J fluorescence method of estimating g
m [
6] to values of photorespiration at high C
i, photorespiration was either estimated to be zero at the external CO
2 concentration of 1800 μmol mol
−1 or to be 2.5% of photosynthesis (see
Section 4). The values of g
m in the C
i range of 100 to 200 μmol mol
−1 estimated from combined gas exchange and fluorescence varied by only a few percent depending on the assumed values of photorespiration. At higher C
i values, those differences in g
m estimates would have been more substantial.
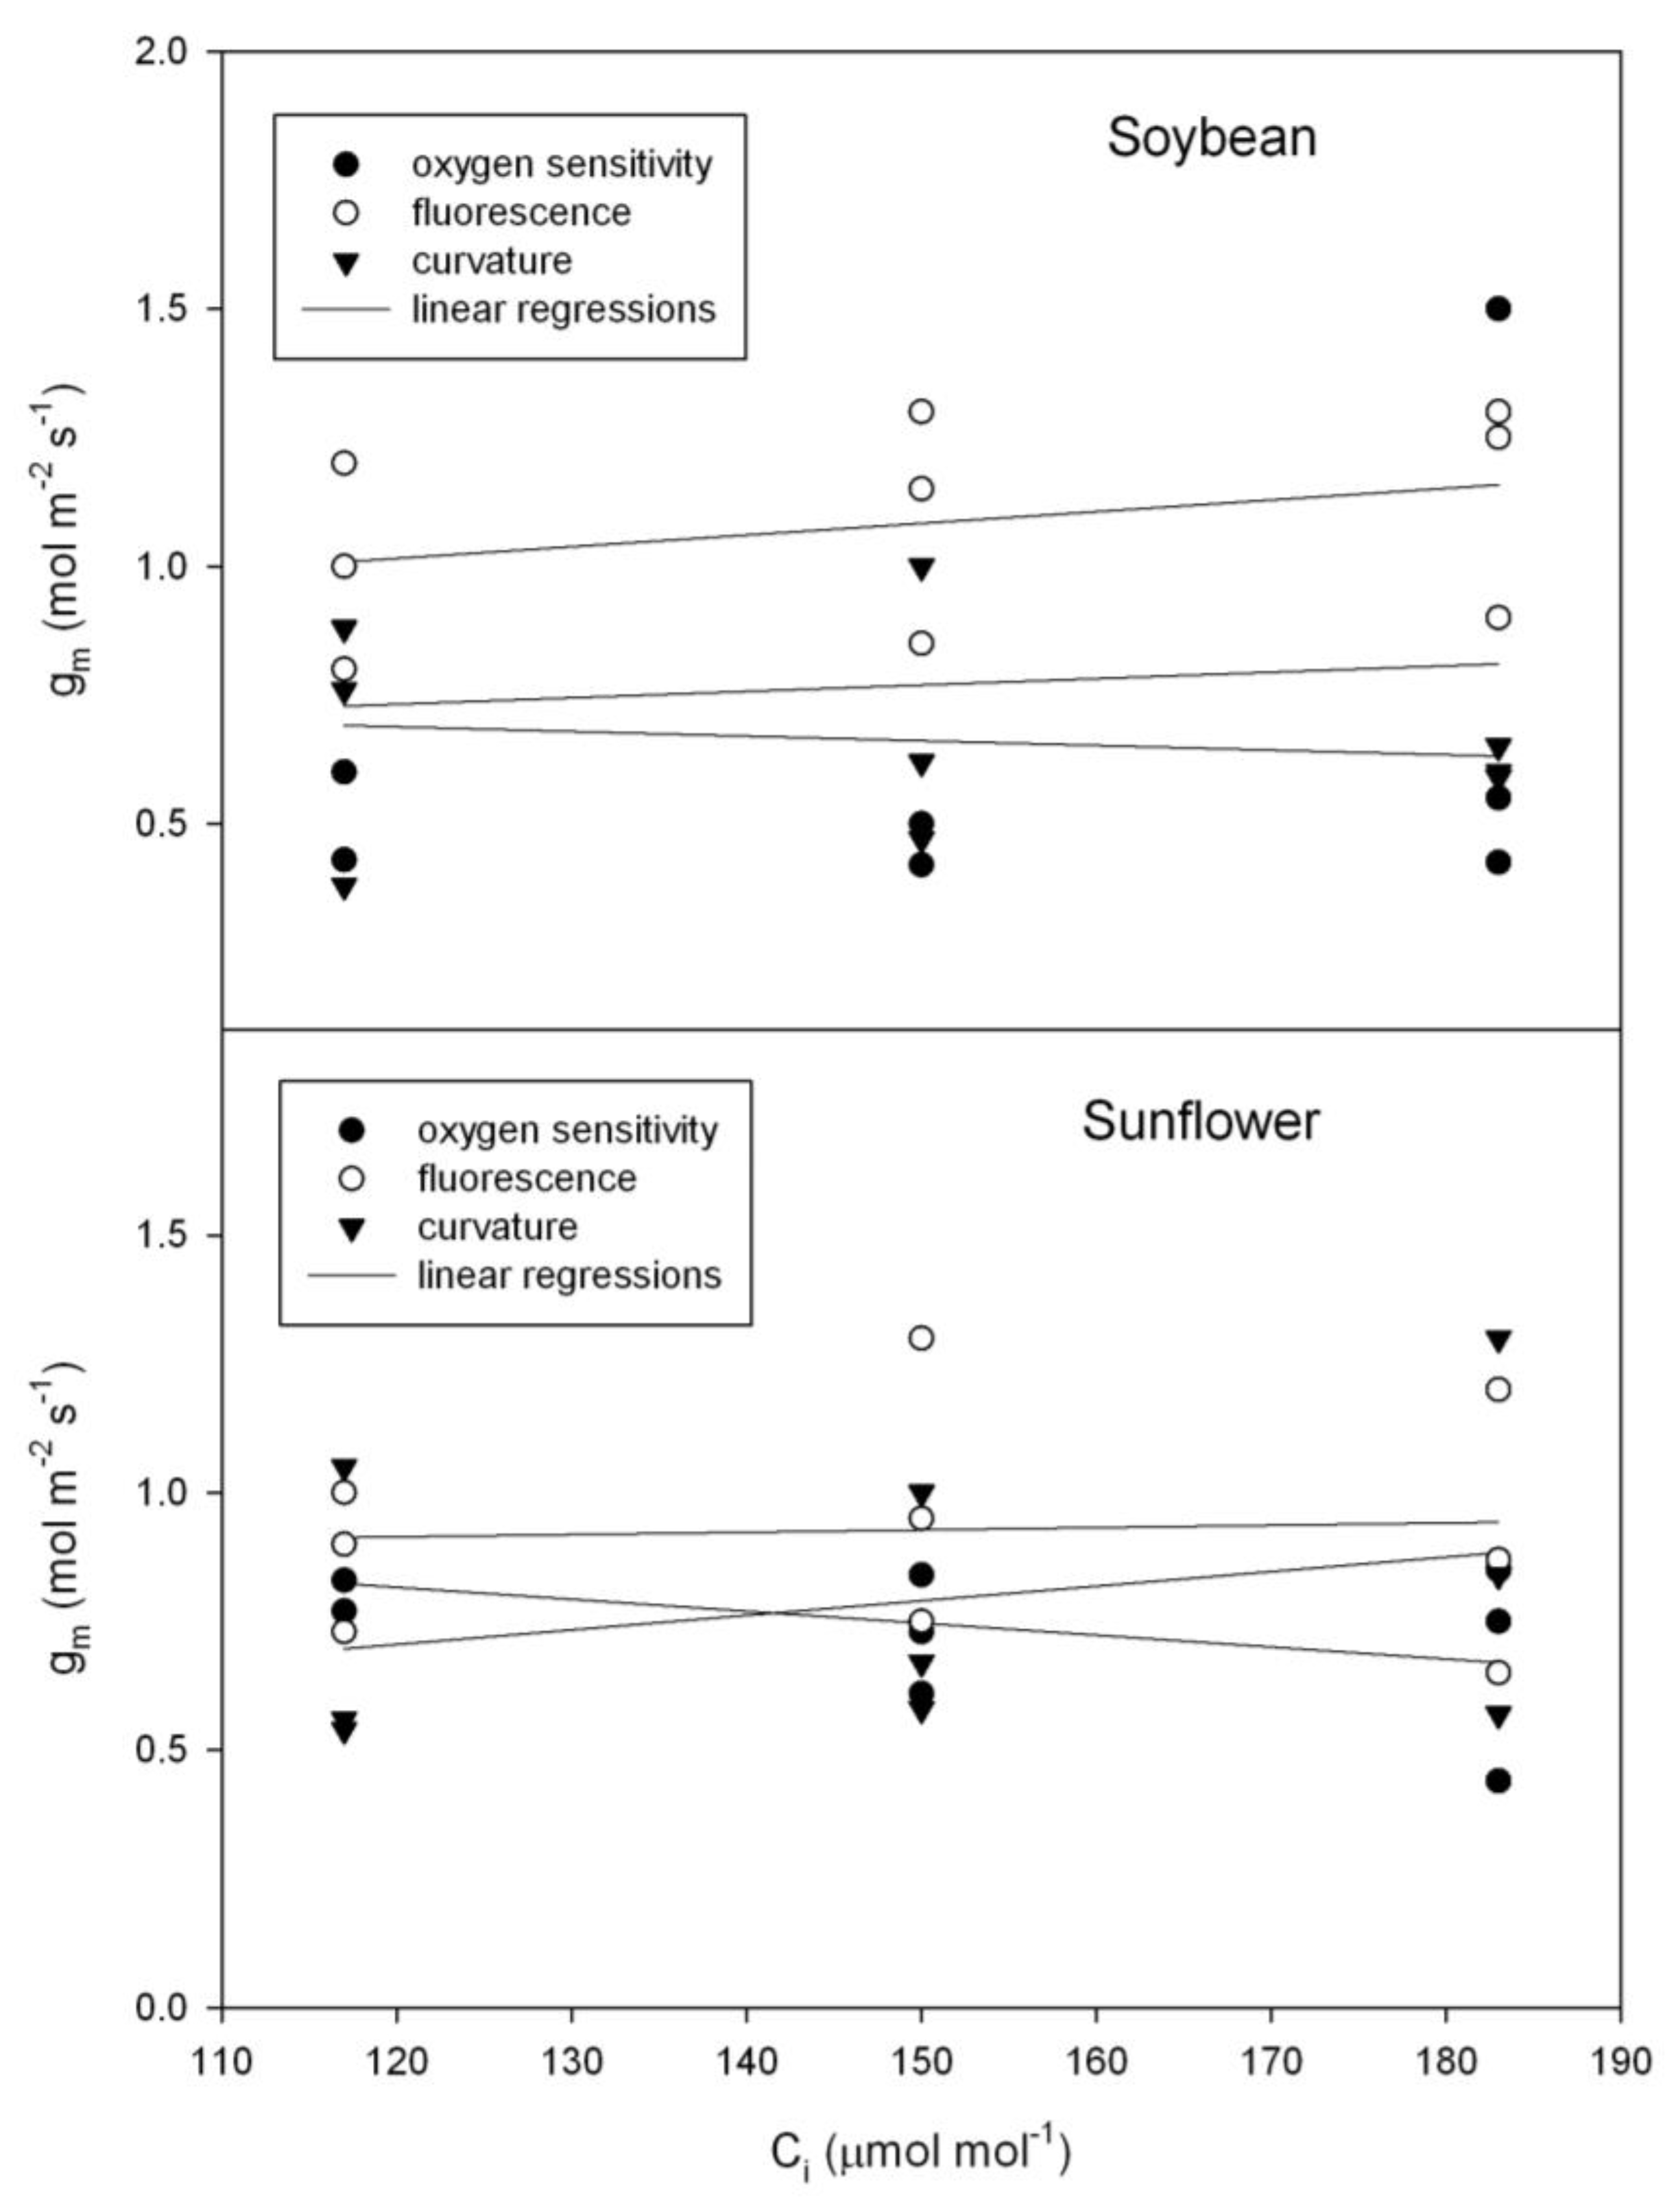
Although there was considerable leaf to leaf variation in g
m, for both sunflower (
Helianthus annuus) and soybean (
Glycine max), there was no evidence of a change in g
m with C
i using any of the three independent methods of estimating g
m (
Figure 3), as tested using repeated measures analysis of variance. In contrast with those species, in bean (
Phaseolus vulgaris), all three methods of estimating g
m indicated a significant decrease in g
m with C
i over the 117 to 183 μmol mol
−1 range of C
i (
Figure 4).
3. Discussion
All three of the methods of estimating g
m used here are based on a biochemical model of C
3 photosynthesis. However, the sensitivity of each of the three methods to model parameter values differs substantially. For example, the O
2 sensitivity method was more sensitive to errors in the CO
2 compensation point than to respiration or to Michaelis constants for CO
2 or O
2 [
8], while the variable J fluorescence method was quite sensitive to errors in J, especially when C
i was less than about 80 mol mol
−1 [
6]. Sensitivity analyses are presented in the original references to the methods. Singh and Reddy [
10] compared several variations of fluorescence-based methods with the O
2 sensitivity method, and with the estimate based on the curvature of the initial slope of A vs. C
i, and found only minor differences in g
m estimates among methods. However, that comparison used soybeans, where g
m does not change with C
i.
Many prior measurements of responses of g
m to C
i using variable J fluorescence were only considered to produce reliable results at C
i values of about 200 μmol mol
−1 and higher, (e.g., [
12,
13,
14]) based on the criterion of Harley et al. [
6]. Any changes in g
m with C
i in the region of A vs. C
i curves in which Rubisco no longer limits A are less important to A, since A becomes much less sensitive to CO
2 availability at high C
i than it is in the Rubisco-limited range [
21]. The method of estimating g
m based on O
2 sensitivity of A is most sensitive in the Rubisco-limited range of A vs. C
i curves [
8]. The method based on the curvature of A vs. C
i curves was developed for the Rubisco-limited region [
7]. The observations presented here also provided a test of the reliability of the variable J fluorescence method of estimating g
m at low C
i in these species. Unstressed leaves of C
3 species often operate at C
i values at the upper end of the Rubisco-limited region of A vs. C
i curves [
21], with generally lower C
i values in stressed leaves. This makes estimates of g
m in the Rubisco-limited region especially relevant.
All three methods of estimating g
m used here involve measurements of gas exchange at 21% O
2, hence are potentially affected by photorespiration and CO
2 transfer among cellular compartments, and are therefore potentially subject to the errors described by Tholen et al. [
17]. The constant g
m reported here for soybean and sunflower indicate that those potential errors in g
m do not always occur even at low measurements C
i, while previous measurements of g
m at low O
2 indicate that photorespiration is not necessary to observe decreases in g
m with increasing C
i [
12,
18]. Thus, it remains unclear how important the potential artefactual decreases in g
m with increasing C
i identified by Tholen et al. [
17] may be in general, although they did affect the estimates of g
m in soybean and sunflower in this experiment.
The lack of substantial change in g
m with C
i in soybean and a decrease in g
m with increasing C
i in bean has been previously reported for different cultivars of those species, using only the oxygen sensitivity method [
15]. The two additional methods used here qualitatively agreed with those results. While significant intraspecific variation in g
m values have been found in soybean, and other species c.f. [
22], the variable prior results for sunflower are difficult to reconcile. Vrabl et al. [
14] reported strongly decreasing g
m with C
i in sunflower both for control leaves and for leaves treated with abscisic acid, while Schaufele et al. [
23] found no variation in g
m with C
i for unstressed plants, but also found that application of abscisic acid resulted in large decreases in g
m with increasing C
i. Qiu et al. [
24] also found a large effect of abscisic acid on g
m in raspberry. Our results for this sunflower cultivar were similar to those of Schaufele et al. [
23], with no change in g
m with C
i for unstressed plants over the limited, low C
i range tested here. Several papers Page: 6 (e.g., [
12,
25,
26,
27]) have suggested that an influence of aquaporins on CO
2 transport and g
m might provide a mechanism for changes in g
m with C
i, such as observed here in bean. It seems possible that differences among species as to whether g
m changes with C
i might be related to the predominance of physical diffusion processes in g
m in some species and a larger contribution of metabolic factors in other species. The bean vs. soybean contrast in g
m sensitivity to C
i could be a useful experimental system to understand species differences in sensitivity.
The new method described here of ramping CO2 to rapidly obtain A vs. Ci curves could also be useful in many other situations, such as comparisons among genotypes or treatments in photosynthetic parameters. In our experiments, and perhaps in other applications of CO2 ramping, it was prudent to let CO2 increase until no further increase in photosynthesis was observed, even though this took a little extra time. During the ramping, it is very difficult to estimate immediately what the Ci value is at any point in time, so allowing CO2 to saturate photosynthesis ensures that sufficiently high Ci has been achieved. The rate of CO2 increase during ramping can be selected by the user. The rate used here was chosen so that stomatal conductance did not change significantly during the ramping for these species, simplifying post-processing of the data.
4. Materials and Methods
Soybean (Glycine max L. Merr., cultivar Holt), sunflower (Helianthus annuus L., cultivar Mammoth Gray Stripe) and common bean (Phaseolus vulgaris L., cultivar Red Hawk) were grown together in an indoor controlled environment chamber. The chamber air temperature was 25 °C, the dew point temperature was 18 °C, the photosynthetic photon flux density was 1000 μmol m−2 s−1 for 12 h per day from a mixture of metal halide and high-pressure sodium lamps, and CO2 concentration was controlled to 420 ± 20 μmol mol−1 for 24 h per day. Plants were grown one per pot in 15 cm diameter pots filled with vermiculite and flushed daily with a complete nutrient solution. Each measurement of the response of mesophyll conductance response to Ci was made on a different leaf from a different plant.
Most leaf gas exchange measurements were made with a CIRAS-3 photosynthesis system (PP Systems, Amesbury, MA, USA). The leaf cuvette had a 2.5 cm
2 window, and light was provided by red, green and blue light-emitting diodes, set for 38% red, 37% green, and 25% blue, as the closest approximation to sunlight. For estimation of g
m based on fluorescence, the instrument was equipped for simultaneously measuring chlorophyll fluorescence. Measurements of g
m based on the oxygen sensitivity of photosynthesis [
8] were made both with the CIRAS-3 and with a LiCor 6400 XT photosynthesis system (LiCor, Inc., Lincoln, NE, USA) in order to test the sensitivity of CO
2 and H
2O analysis to O
2 in the CIRAS-3. The LiCor system had a cuvette window of 6 cm
2 area, and used the LiCor red and blue light emitting dioxide light unit. The O
2 sensitivity of CO
2 and H
2O analysis in the LiCor 6400 XT is known, and corrections to outputs based on O
2 are built into the instrument operating system. The sensitivity to O
2 of the CIRAS-3 system was not known.
Three independent methods of estimating g
m were used. The curvature of the A vs. C
i curve in the Rubisco-limited region was used to estimate g
m, using the gas exchange calculation utility of Sharkey et al. [
20]. In order for this method to be applied for different Rubisco-limited C
i ranges, a new system was developed for rapidly collecting very dense data points. The CIRAS-3 system utility “stored differential-balance” was used to store the change in sensitivity of CO
2 and H
2O to background CO
2 and H
2O for the anticipated ranges of each variable. These values are quite stable over time (days), in the CIRAS-3. The CIRAS-3 system utility program which controls linear increases in reference CO
2 was set to increase the reference CO
2 from 100 μmol mol
−1 at a rate of 233 μmol mol
−1 min
−1 following an initial 2 min period of constant concentration of 100 μmol mol
−1. Data were stored approximately every 2 s during the increase in reference CO
2. First, this CO
2 ramping program was run with an empty cuvette. Then it was run with leaves in the cuvette. Leaf temperature was controlled at 25 ℃, the water vapor pressure deficit (VPD) was between 1.0 and 1.5 kPa, and the photosynthetic photon flux density (PPFD) was 1500 μmol m
-2 s
−1. Measurements on leaves were terminated when the “apparent” A values no longer increased with reference CO
2. For each time step in the data files, the “A” value for the empty cuvette was subtracted from the value when the leaf was present. This is similar to the approach of Stinziano et al. [
28], although their method of obtaining corrected values of A was more complex, as necessary with the instrument used. From the corrected A values, C
i was re-calculated in the usual way from stomatal and boundary layer conductances, A, and external CO
2 [
21], using the corrected values of A. Stomatal conductance never changed substantially during the CO
2 ramping procedures. As a test of this new method of developing A vs. C
i curves using rapid CO
2 ramping, A vs. C
i curves obtained with ramped CO
2 were compared with curves on the same leaves obtained with the same instrument using traditional steady-state gas exchange measurements at several steps of external CO
2 under the same conditions of PPFD, leaf temperature, and VPD as used in the CO
2 ramping. For tests of changes in g
m with C
i, A vs. C
i curves obtained by CO
2 ramping were arbitrarily separated into four successive sections, from C
is of 100 to 133, 134 to 166, and from C
is of 167 to 200, and all C
is above 200 μmol mol
−1. The three lower parts of the low C
i curves were separately combined with the fourth, upper C
i part. The Sharkey et al. utility [
20] was then used to estimate g
m separately for the three lower C
i sections with uniform upper C
i data, assuming limitation by the maximum carboxylation capacity of Rubisco (V
Cmax) for the three lower C
i ranges, and triose phosphate utilization (TPU) limitation at the highest Ci. The division between the V
Cmax and electron transport (J)-limited regions was done by minimizing the error term. The utility program values for temperature dependencies of parameters were used, and the utility was used to estimate respiration. Three leaves from different plants of each species were used to develop these tests of variation of g
m with C
i.
The second method used was the “variable J” method combining leaf gas exchange and fluorescence [
6]. Steady state A vs. C
i curves were obtained, using sequential external CO
2 concentrations of 400, 100, 150, 200, 250, 300, 400, 500, 600, 800, 1000, and 1800 μmol mol
−1. Leaves were measured at the same PPFD, leaf temperature (T) and VPD as previously described. Light was supplied by red, green and blue light-emitting diodes, set at 38% red, 37% green, and 25% blue as a close approximation to sunlight. Leaf absorption was assumed to be 0.84, and the fraction absorbed by photosystem II was assumed to be 0.5. At each CO
2 level, Phi PSII and J were obtained using Multi-Pulse
TM fluorescence measurements [
29]. The measurement at the highest CO
2 (“non-photorespiratory” conditions) was used to determine the proportionality between J and fluorescence yield [
6]. Because photorespiration at the highest CO
2 concentration could theoretically have still been 2 to 3% of photosynthesis [
30], additional estimates of g
m were made using adjusted values of the proportionality between J and fluorescence yield assuming photorespiration was 2.5% of photosynthesis. These measurements were made on three leaves from different plants of each species. Values of g
m for each leaf were obtained in the same three C
i regions as used in the previous method.
The third method used, the oxygen sensitivity of photosynthesis method of estimating g
m [
8] was implemented by developing A vs. C
i curves of the same leaf both at 21 and 2% O
2. Leaf temperature, VPD, and PPFD were the same as in the prior methods. The A vs. C
i curves at 2% and 21% O
2 were used to calculate g
m at C
i values ranging from below 100 to about 200 μmol mol
−1, by solving for g
m values compatible with A vs. C
i values at both O
2 concentrations [
10]. Values of respiration in the light were determined by extrapolating A vs. C
i curves at 2% O2 to 0 C
i. The calculation utility of Singh and Reddy [
10] uses the same other biochemical parameter values as in the Sharkey et al. utility [
20]. Values of A vs. C
i at 2% O
2 estimated using the LiCor 6400 XT instrument with correction for O
2 were compared with A vs. C
i values estimated using the CIRAS-3 instrument without correction for O
2 concentration. The comparisons between instruments were made using opposite sides of the same leaves for two individual plants each of sunflower and soybean. The response of g
m to C
i using the O
2 sensitivity method with the CIRAS-3 system was then determined for three leaves from different plants of each species, and summarized for the same three ranges of C
i as used in the curvature method.
Repeated measures analysis of variance was used separately for each method for each species to test whether gm changed with the Ci range.


