Article

Comprehensive Phytochemical Profiling and Chemotypic Variation Study of Three Medicinally Important Oncosiphon Species Indigenous to South Africa

1
Department of Pharmaceutical Sciences, Faculty of Science, Tshwane University of Technology, Private Bag X680, Pretoria 0001, South Africa
2
SAMRC Herbal Drugs Research Unit, Tshwane University of Technology, Pretoria 0001, South Africa
3
National Center for Natural Products Research, School of Pharmacy, University of Mississippi, University, MS 38677, USA
4
Division of Pharmacognosy, Department of BioMolecular Sciences, School of Pharmacy, University of Mississippi, University, MS 38677, USA
*
Author to whom correspondence should be addressed.
Plants 2026, 15(7), 1047; https://doi.org/10.3390/plants15071047
Submission received: 21 February 2026 / Revised: 19 March 2026 / Accepted: 25 March 2026 / Published: 28 March 2026
(This article belongs to the Special Issue Phytochemistry and Bioactivities of Plant Extracts)

Abstract

The genus Oncosiphon (Asteraceae), consisting of aromatic herbs, is indigenous to southern Africa. Oncosiphon species have been documented in Khoi-San ethnobotany as herbal remedies for typhoid fever, pneumonia, and as diuretics. Research on the biological properties and comprehensive phytochemical profiling of these important Oncosiphon species is currently limited. This study was therefore undertaken to address the knowledge void in chemical profiling, through the application of various analytical techniques to analyse the volatile and non-volatile constituents of three South African Oncosiphon species. The aerial parts of Oncosiphon suffruticosus (n = 28), O. grandiflorus (n = 16), and O. africanus (n = 4) were collected from various locations in the Western Cape Province of South Africa. The stems and leaves (SL) were separated from the flowers (F) and analysed as distinct samples. The methanol: chloroform (1:1, v/v) extracts were prepared and analysed using ultra–high–performance liquid chromatography quadrupole time-of-flight time–of–flight mass spectrometry (UHPLC–QToF–MS) and a semi–automated high–performance thin–layer chromatography (HPTLC) system. Multivariate data analysis was performed on the UHPLC–QToF–MS data to determine interspecies chemical variation. Two-dimensional (2D) gas chromatography (GCxGC–ToF–MS) was used to determine the headspace volatile profiles of the intact aerial parts. The results show that the non-volatile profiles of the Oncosiphon species are characterised by amino acids, phenolic acids, flavonoids, sesquiterpene lactones, and fatty acid derivatives. The HPTLC profiles of O. grandiflorus and O. africanus are chemically more closely related, and O. suffruticosus has a distinct profile, which is supported by the chemometrics results of the flowers. The major headspace volatile compounds in Oncosiphon flowers are α-pinene, α-ocimene, eucalyptol, o-cymene, and artemisia alcohol, whereas the stems and leaves mainly consist of α-ocimene, eucalyptol, and yomogi alcohol.

1. Introduction

The Cape Floristic Region is the richest floral region in southern Africa, with approximately 4000 plant species used by the indigenous people of South Africa as herbal remedies [1]. Among these medicinal plants are shrubs of the genus Oncosiphon (Asteraceae), which harbours seven species in South Africa, namely, O. sabulosus (Wolley-Dod) Källersjö, O. schlechteri (Bolus ex Schltr.) Källersjö, O. grandiflorus (Thunb.) Källersjö, O. inter-medius (Hutch.) Källersjö, O. piluliferus (L.f.) Källersjö, O. suffruticosus (L.) Källersjö, and O. africanus (P.J.Bergius) Källersjö [2]. The term “Oncosiphon” combines two Greek words, “oncos” and “siphon”, meaning thick and tube, respectively. Collectively, the terms refer to the conspicuously swollen corolla tube that is characteristic of Oncosiphon species [3]. Oncosiphon species are generally referred to as “stinkruid” in Afrikaans because of their strong and unpleasant odour [4]. The plants grow up to 1 m in height, with flower heads that are 5 to 8 mm in diameter [5,6]. The feathery leaves and bright yellow flower heads make the plants conspicuous in any landscape. Oncosiphon suffruticosus, O. piluliferus, and O. africanus are popularly prepared as infusions and taken to treat ailments such as typhoid fever, rheumatic fever, influenza, asthma, and pneumonia [7]. The plants are also used as general tonics, anthelmintics, diuretics, diaphoretics, and applied topically as poultices for scorpion stings [5,7]. A few drops of fresh leaf juice are added to breast milk to relieve babies from colic and stomach cramps [6]. Oncosiphon suffruticosus was used as a remedy during the Spanish flu outbreak in 1918 [5].
Despite the medicinal significance of the three Oncosiphon species, detailed scientific research on their biological properties and chemical profiles remains limited. The chemistry of the indigenous Oncosiphon species has only been reported for O. piluliferus and O. suffruticosus. In a study by Pillay et al. [8], three germacrane lactones, namely, 4,5α–epoxy–6α–hydroxy–1(10)E,11(13)–germacradien–12,8α–olide, tatridin A (tavulin) and tanachin, and two eudesmanolides (desacetyl–β–cyclopyrethrosin and sivasinolide) were isolated from O. piluliferus. Adewinogo et al. [9] reported the major essential oil constituents of O. suffruticosus as camphor (31.2%), filifolone (14.0%), chrysanthenone (8.7%), eucalyptol (1,8–cineole) (7.9%), and terpinen–4–ol (7.4%), along with 11 other minor compounds constituting approximately 85% of the total composition. The above-mentioned reports confirm the scarcity of data on the chemistry of these medicinal plants, which is an important aspect in the quality control of herbal medicines, as it directly impacts the therapeutic outcomes as well as the safety profile of the plant.
Advanced chromatography techniques such as ultra-performance liquid chromatography coupled with mass spectrometry (UPLC–MS), high-performance thin layer chromatography (HPTLC), and gas chromatography with hyphenated mass spectrometry (GC–MS) enable precise separation, quantification, and identification of plant constituents. When combined with chemometrics data analysis, these techniques can reveal chemical variation between plant species [10]. In a study conducted by Acharya et al. [11], UPLC–MS in tandem with chemometrics analysis differentiated Sutherlandia frutescens from S. microphylla and predicted the chemical markers responsible for the observed variation. A similar approach was used in the quality assessment of several indigenous South African medicinal plants, distinguishing between closely related taxa such as Pelargonium sidoides and P. reniforme [12], three Salvia species [13], Agathosma betulina and A. crenulata [14], and Harpagophytum procumbens and H. zeyheri [15]. The current study, therefore, sought to contribute to knowledge on the three South African Oncosiphon species by documenting comprehensive phytochemical profiles of both the volatile and non-volatile constituents, using various chromatography techniques. In tandem with chemometrics analysis, the study highlights interspecies chemical variation and predicts chemical markers that distinguish the species.

2. Results

2.1. The HPTLC Fingerprint Profiles of Three Oncosiphon Species

2.1.1. The HPTLC Chemical Profiles of the Flowers

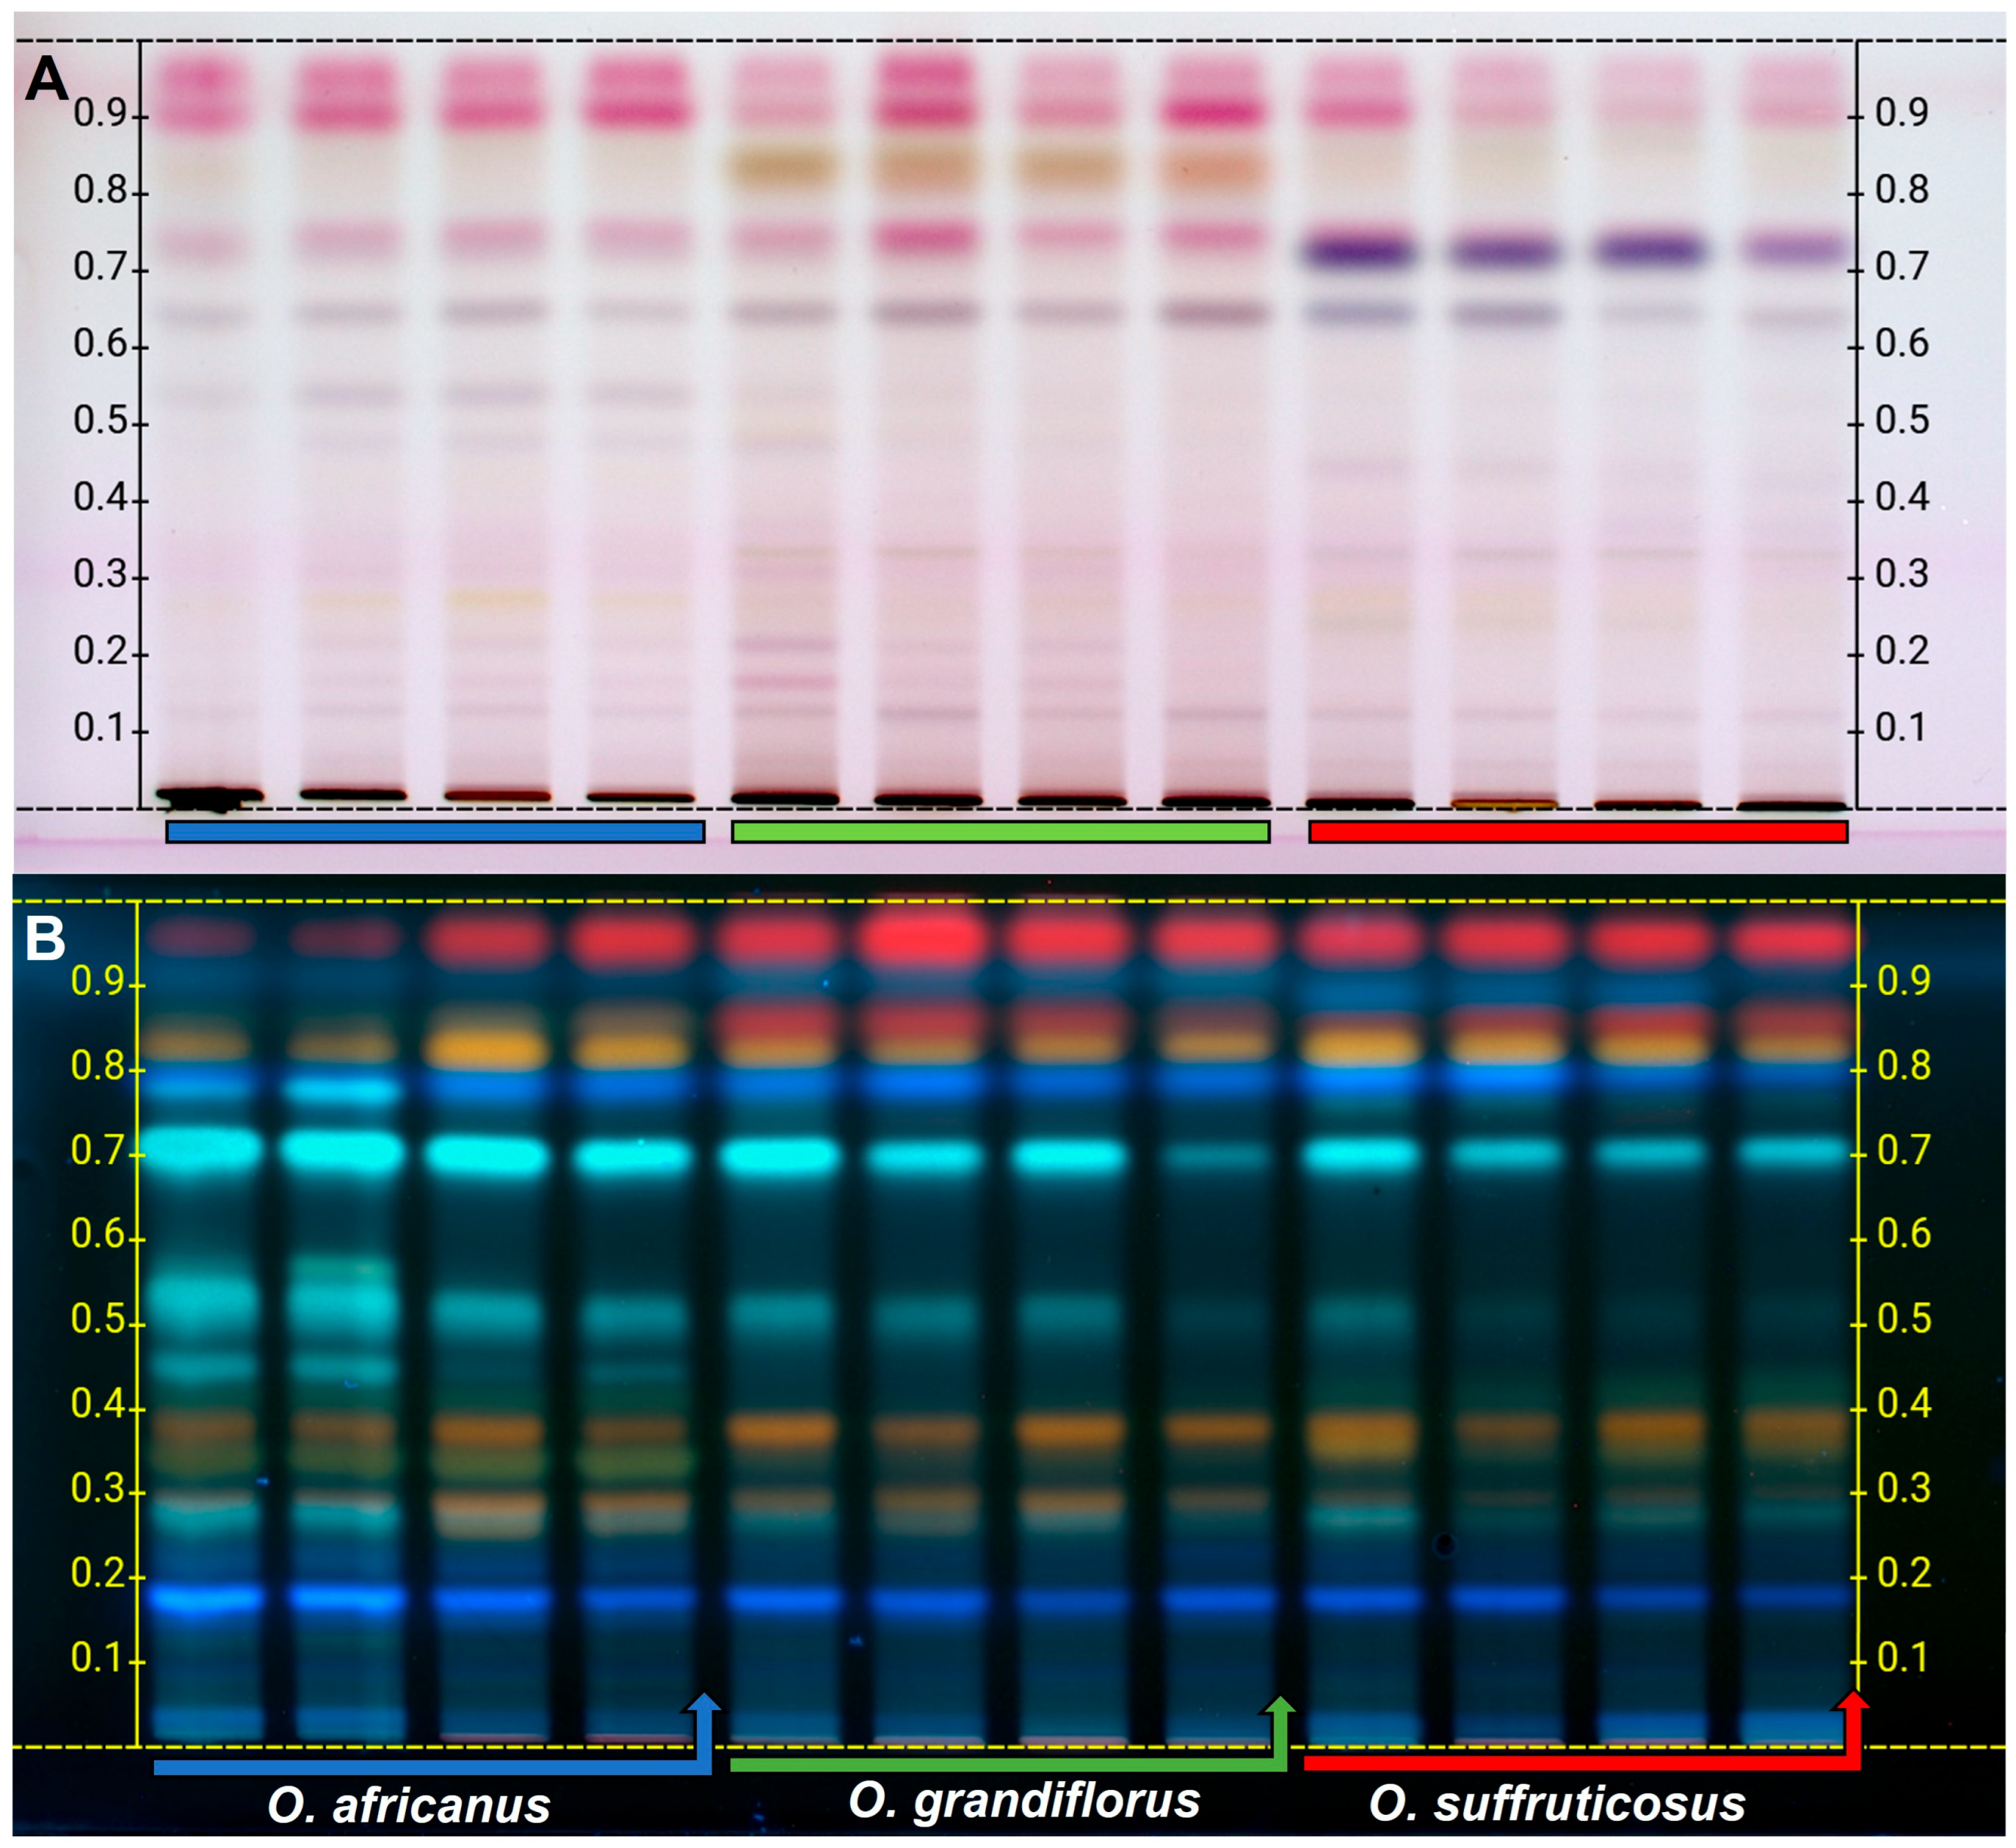
Typical HPTLC profiles of the three Oncosiphon species derivatised with solvent systems I and II and visualised with anisaldehyde reagent (A) and natural products (NP) reagent (B), respectively, are displayed in Figure 1. Chromatographic plate derivatised with anisaldehyde (Figure 1A) displayed bands in shades of pink, yellow, and violet/purple, which is consistent with the presence of flavonoid compounds, identified as marker constituents listed in Table 1. Wagner and Bladt [16] reported that flavonoids are detectable with anisaldehyde reagent, which produces distinctive colour reactions, typically yellow, pink, or violet/purple, following heating and observation under white light. A total of 11 bands were resolved on the HPTLC plate, and these occurred across the three Oncosiphon species (Figure 1A), with observable differences in the colour intensity. The majority of the compounds between Rf 0.10–0.80 occurred at low levels in O. suffruticosus, except for the compounds at Rf 0.28 (yellow) (kaempferide) and 0.70 (purple) (unknown), which occurred in higher amounts in this species. A distinct marker compound for O. suffruticosus was observed at Rf 0.42 (light purple), which was identified as eupalitin. Oncosiphon grandiflorus and O. africanus showed similar profiles, with the majority of the compounds occurring at higher levels in O. grandiflorus. Some of the compounds shared between the two species include 5,6,4′–trihydroxy–7,8,3′–trimethoxyflavone (Rf 0.16), tetrahydroxy–methoxyflavone (methyl quercetin) (Rf 0.20), and tricin–glucuronoside (Rf 0.35), while others remain unknown. A marker compound (unknown) for O. africanus was observed at Rf 0.43 (yellow), while O. grandiflorus did not show any distinct bands from the other two species (Figure 1A, Table 1).
Representative HPTLC profiles developed using solvent system II and derivatised with NP reagent are presented in Figure 1B. The plate shows yellow, red, and blue fluorescent bands, which indicate the presence of phenolic compounds and flavonoids. Wagner and Bladt [16] reported that phenolic compounds and flavonoids commonly display characteristic blue, yellow, and red fluorescence under 366 nm, following derivatisation with the NP reagent. Eleven common bands (compounds) at varying concentrations are shared among the three species (Rf 0.22, 0.30, 0.32, 0.37, 0.42, 0.58, 0.70, 0.72, 0.82, 0.85, and 0.97) (Figure 1B, Table 1). The profile for O. suffruticosus is more distinct, with characteristic bands of unknown compounds at Rf 0.19 (yellow), 0.62 (light blue), and 0.68 (light blue), which were absent in the other two species. Oncosiphon grandiflorus and O. africanus displayed unique bands at Rf 0.90 (red) and 0.80 (light blue), respectively. The results therefore demonstrate that the flowers of O. suffruticosus have a distinct profile, consisting of higher levels of phenolics and flavonoids. However, the chromatographic pattern within each species is generally conserved between samples with some quantitative variation.

2.1.2. The HPTLC Chemical Profiles of the Stems and Leaves

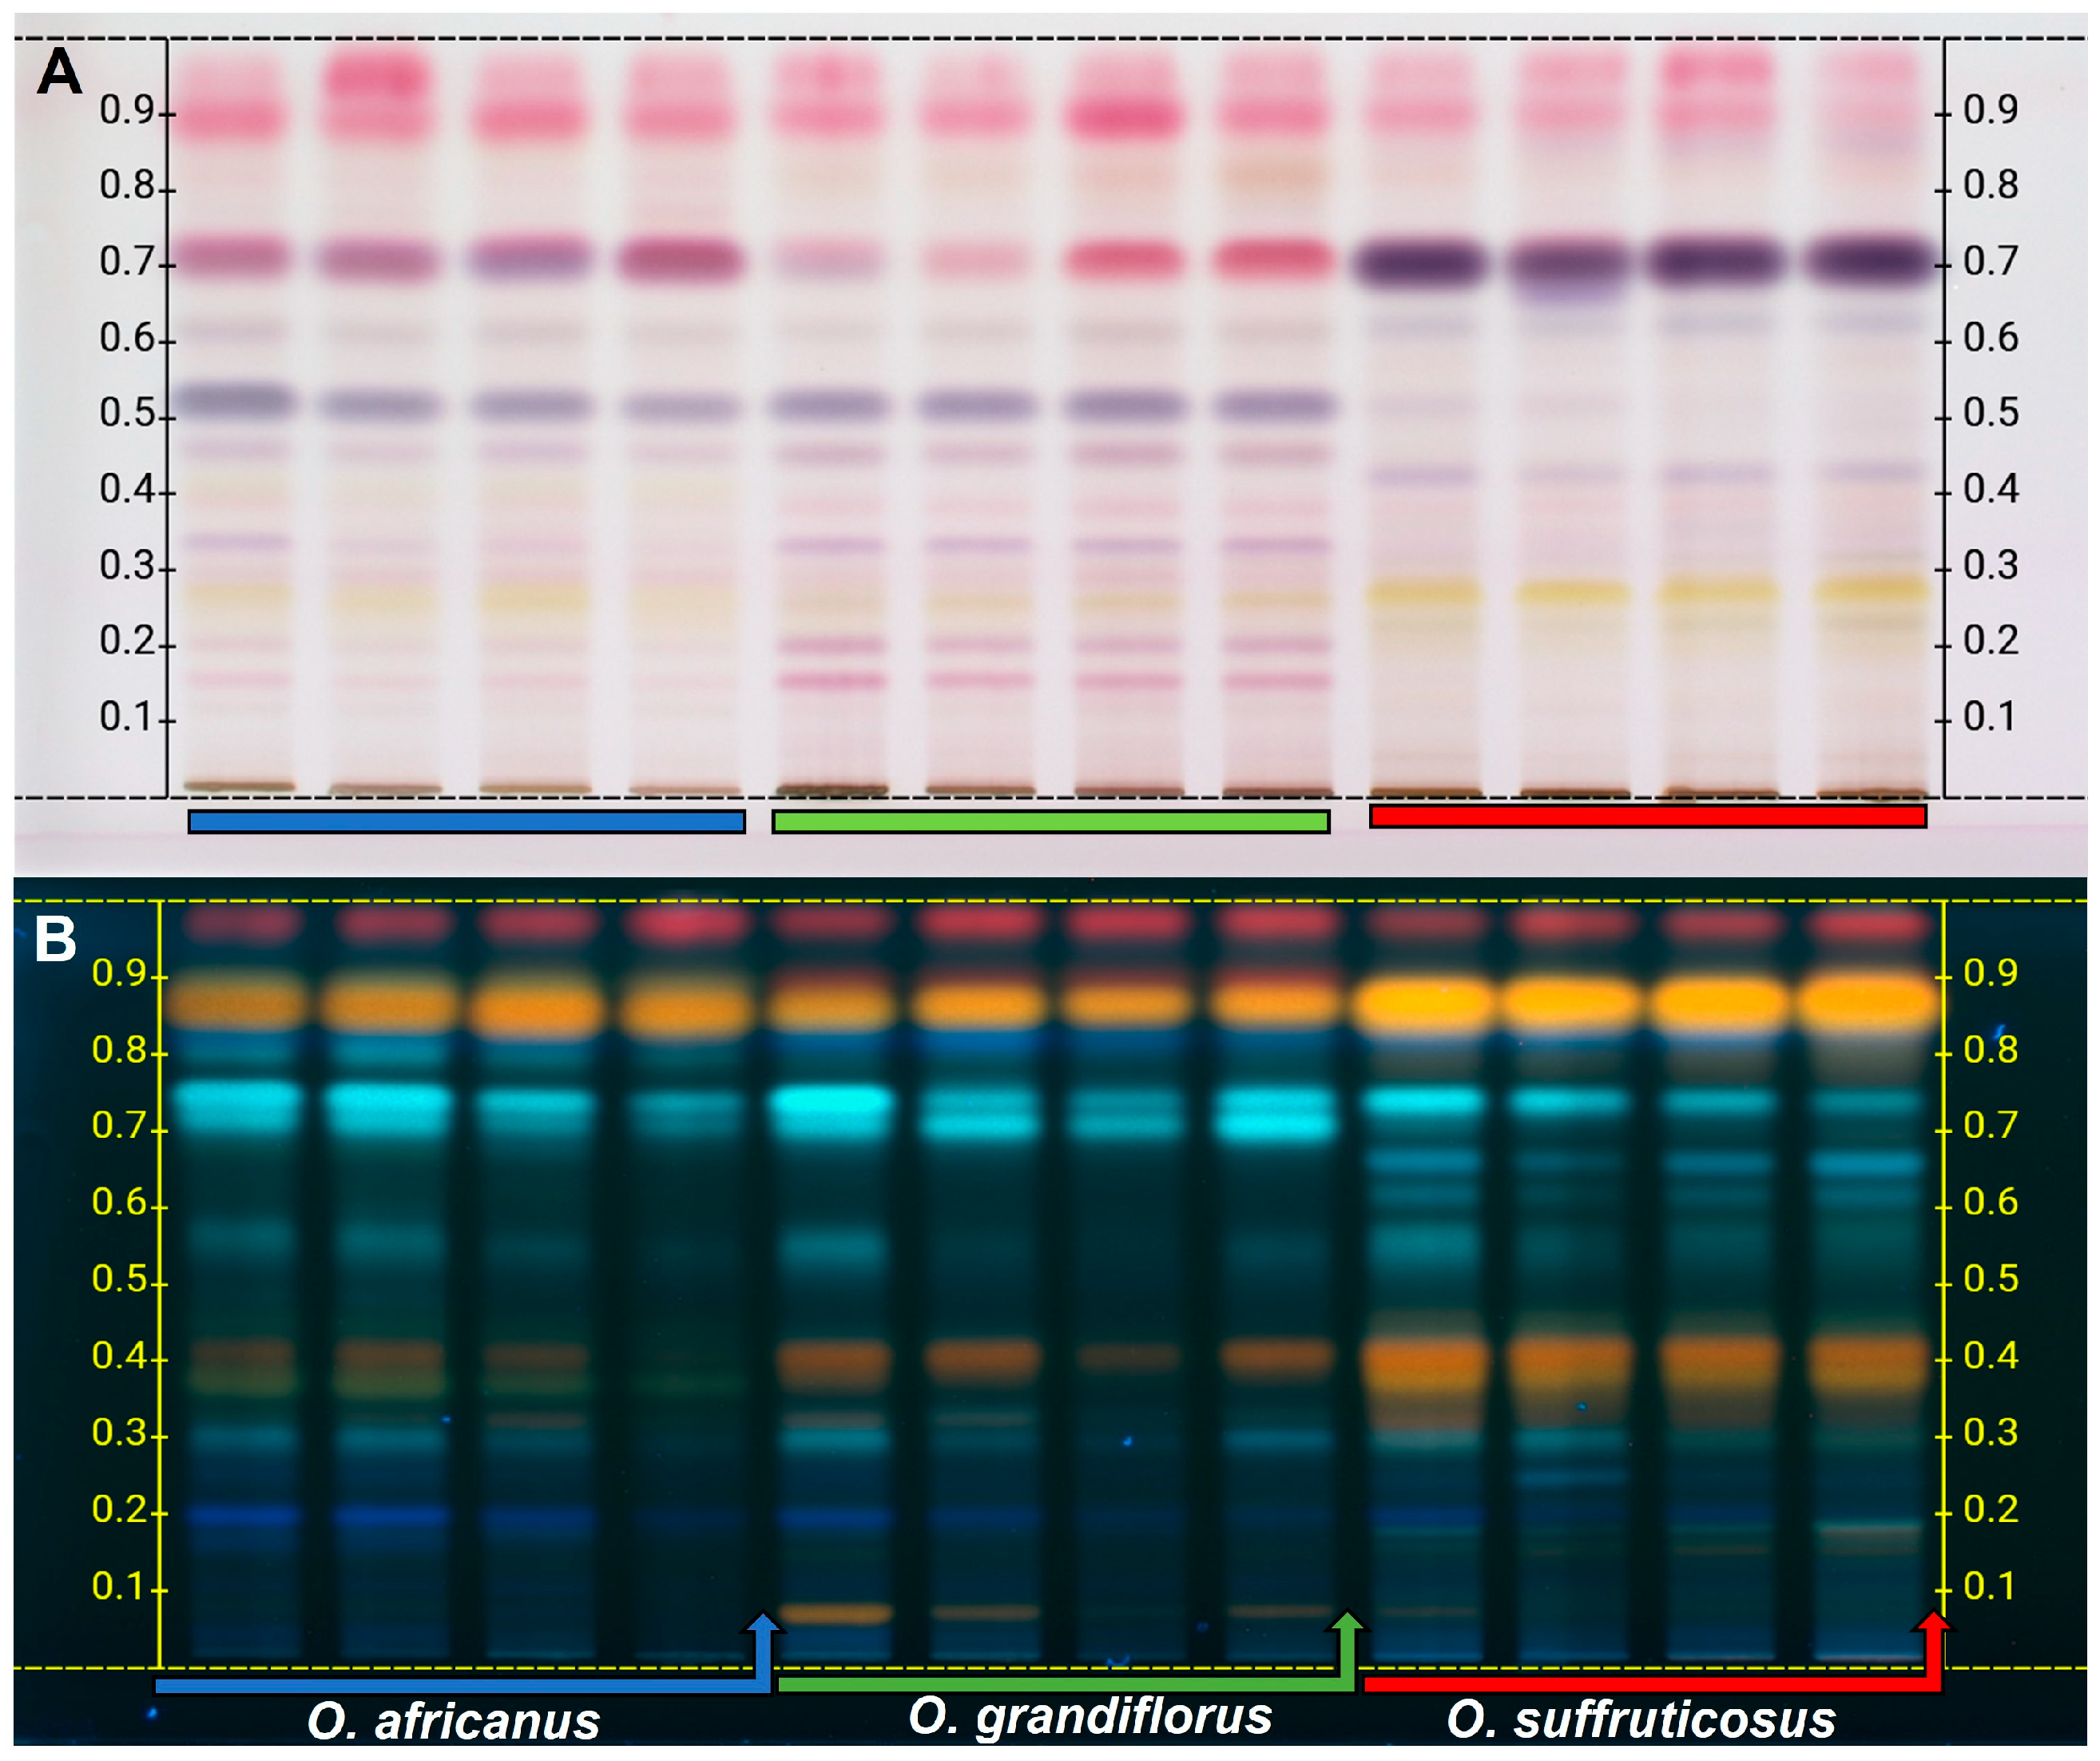
Under white light, the stems and leaves exhibited quantitative differences across the three species within the Rf range from 0.60 to 0.95 (Figure 2A). Kaempferide (Rf 0.28) was present in all the species, while distinct, unidentified bands were observed at Rf 0.45 (light purple) in O. suffruticosus and at Rf 0.84 (yellow) in O. grandiflorus (Table 2). Generally, the stems and leaves produced low-intensity bands following derivatisation with anisaldehyde, indicating that the flavonoid composition is lower compared to the flowers. After derivatisation of the stems and leaves with NP reagent and visualisation under 366 nm UV light (Figure 2B), the HPTLC plate revealed common bands of varying intensities between Rf 0.19–0.39 and 0.70–0.95, as listed in Table 2. The qualitative differences were observed at Rf 0.37 (light yellow) and Rf 0.42 (light yellow) for O. africanus and O. suffruticosus, at Rf 0.48 (light blue) and Rf 0.56 (light blue) for O. africanus, and a red band that appeared only in O. grandiflorus and O. suffruticosus at Rf 0.86. The majority of these compounds were observed in O. africanus, which displayed the highest number of bands. Dicaffeoylquinic acid (Rf = 0.72), as well as several flavonoids detected at Rf 0.35, including dihydroxy–dimethoxyflavone, an isomer of isorhamnetin, syringetin or spinacetin, and kaempferide, were common to all three species. Like the HPTLC profiles of the flowers, the stems and leaves of all three species showed minimal intraspecies variation.

2.2. LC–DAD-QToF–MS Characterisation and Chemotaxonomic Differentiation of Oncosiphon Species

Structural assignments were accomplished through a comprehensive interpretation of high-resolution LC–QToF–MS data acquired in both positive and negative ionisation modes (Table 3). Accurate mass measurements were obtained with mass errors generally within ±5 ppm, providing high confidence in elemental composition determination. Experimental m/z values were systematically compared with theoretical exact masses, and the calculated values are presented in parentheses in Table 3 to demonstrate the close agreement between observed and predicted ions. In addition to accurate mass confirmation, compound identification relied on characteristic MS/MS fragmentation pathways, including diagnostic neutral losses (e.g., H2O, CO2, CO, CH3, and sugar moieties) and structurally informative product ions. These fragmentation patterns were interpreted in accordance with previously reported literature data for related compounds. Whenever authentic standards were available, chromatographic retention behaviour and MS/MS spectra were directly compared to confirm identity.
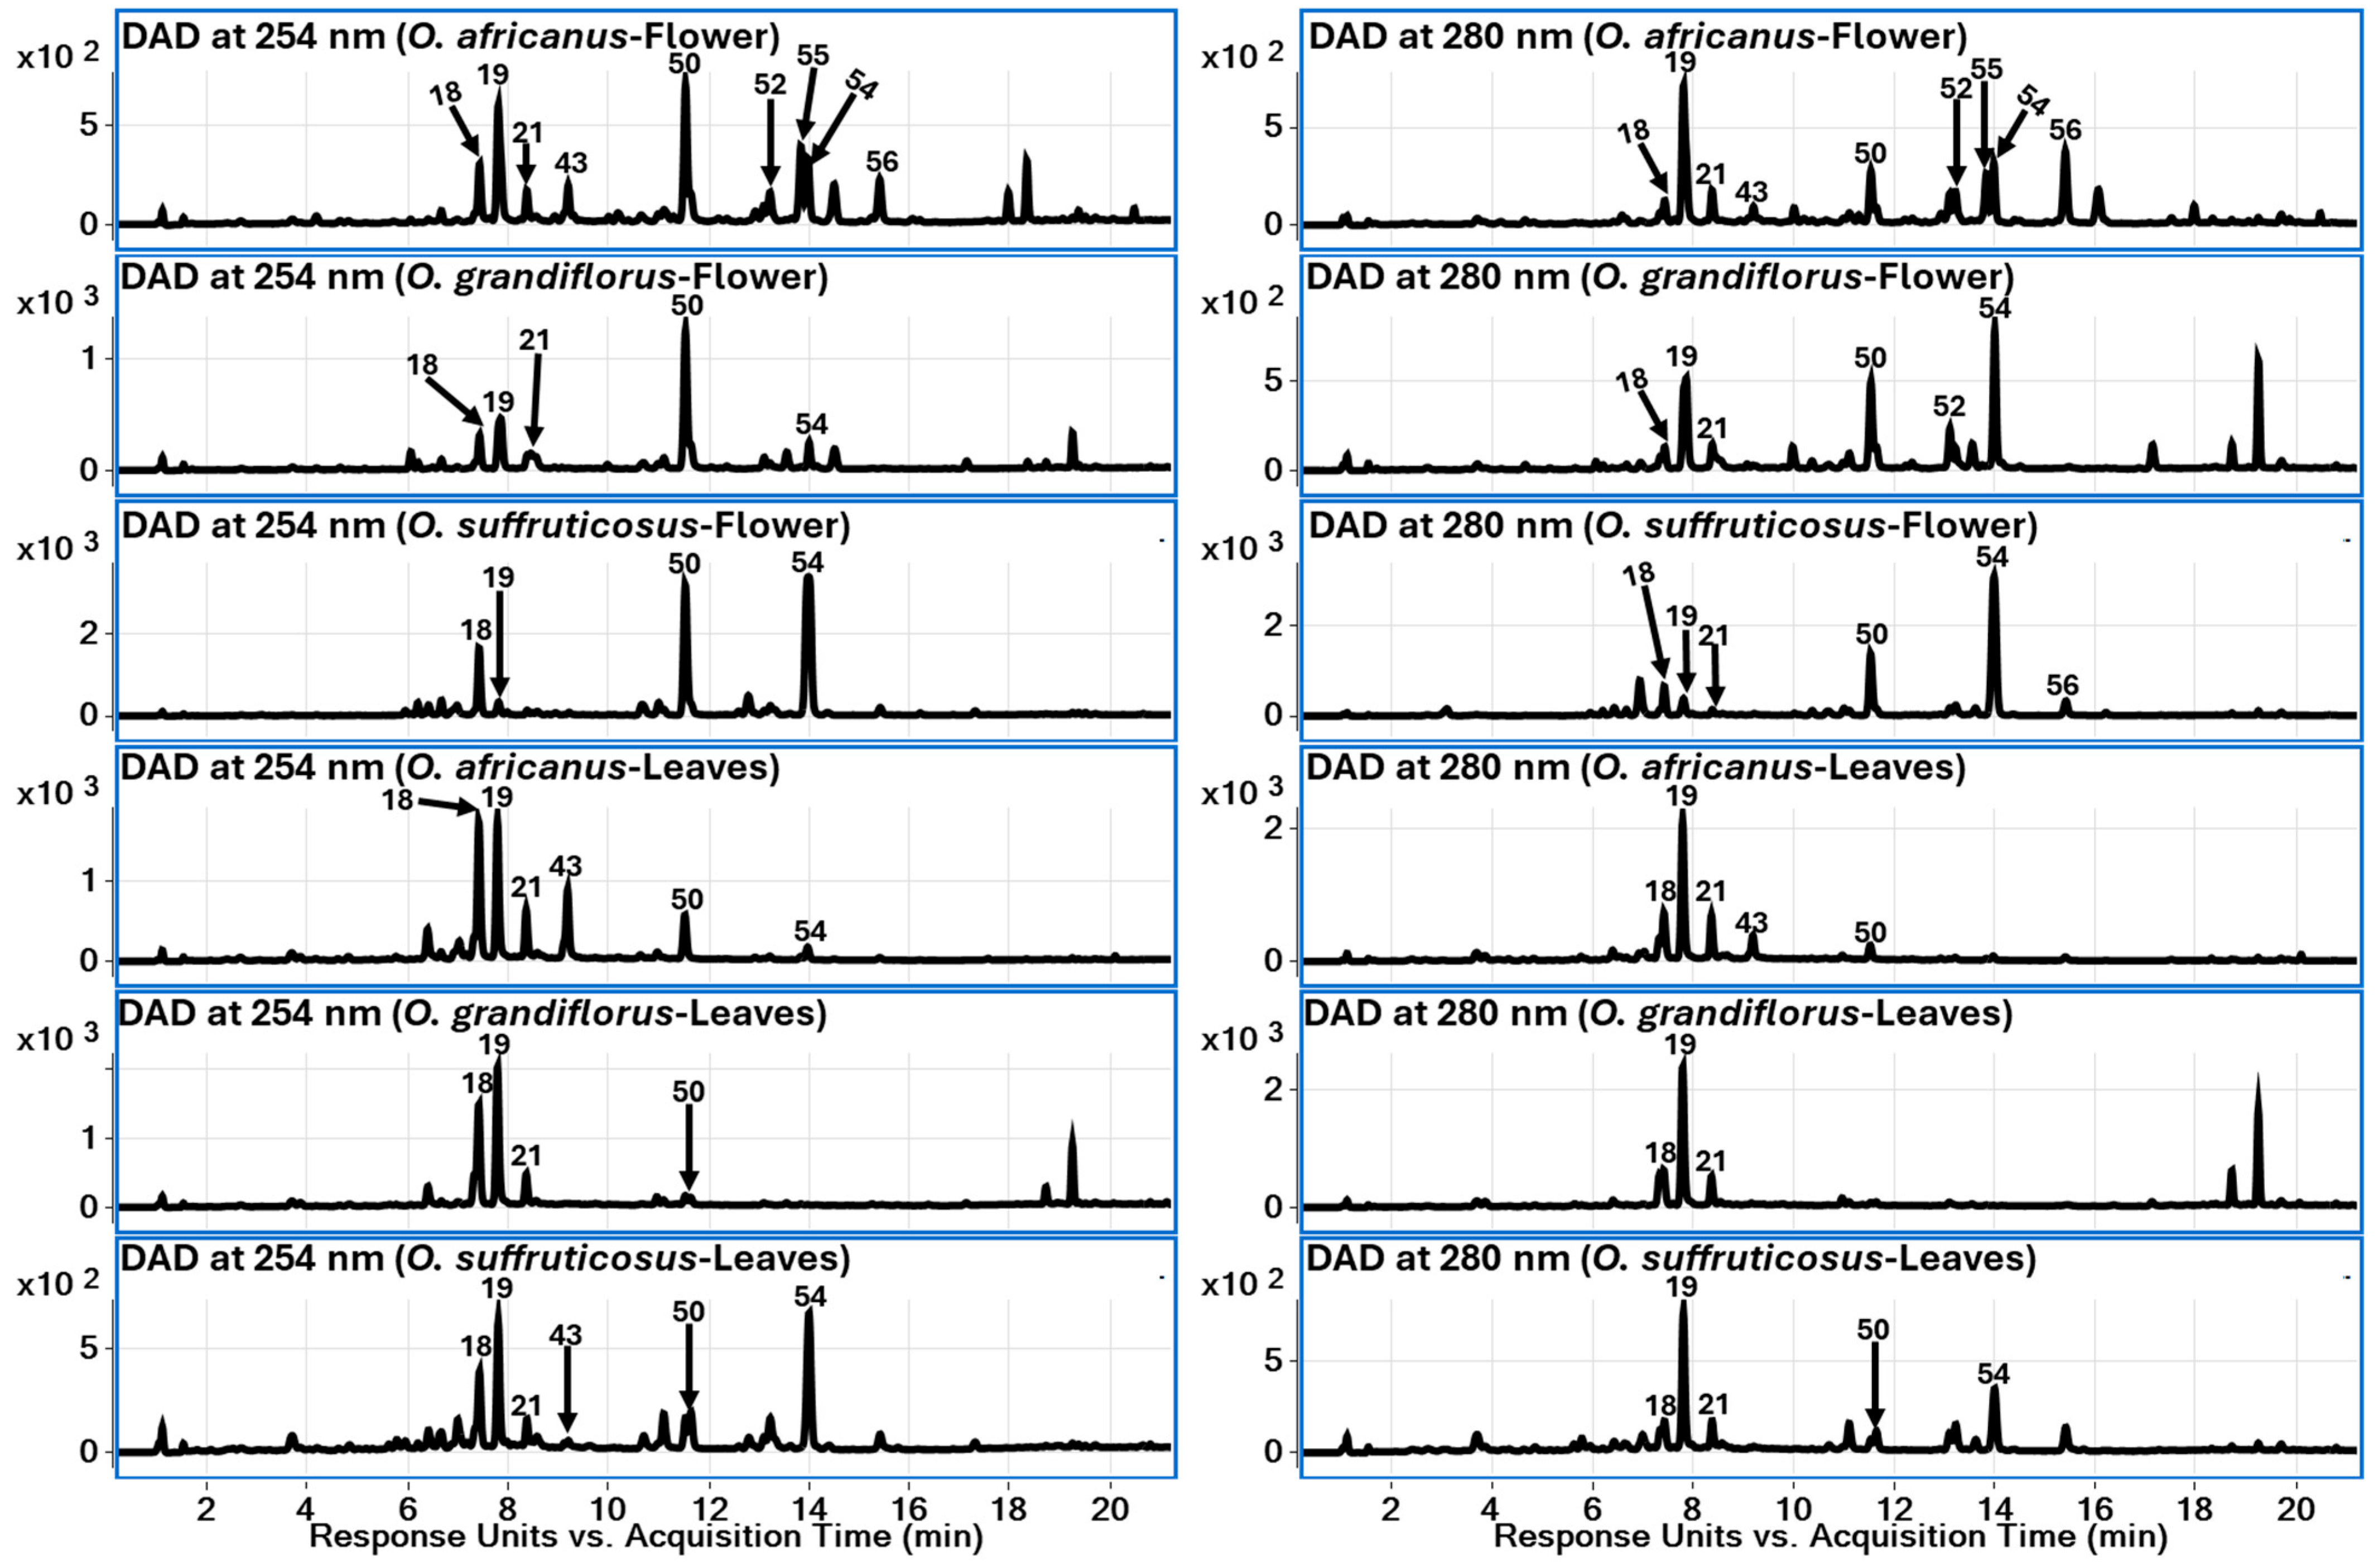
LC–QToF–MS profiling enabled the putative identification of 83 metabolites in flower and leaf extracts of O. africanus, O. grandiflorus, and O. suffruticosus. These metabolites were classified into five major chemical groups: amino acids (110), phenolic acids (1122), flavonoids (2356), sesquiterpene lactones (5774), and fatty acid derivatives (7583). The detected compounds covered a wide polarity range, reflecting the metabolic diversity of the species investigated. The LC-DAD chromatographic profiles (comparative) of three Oncosiphon species (flower and leaf) at 254 nm and 280 nm are provided in Figure 3.

2.2.1. Amino Acids (Compounds 110)

Amino acids constituted the earliest eluting metabolites in the chromatographic profile (RT 1.17–2.87 min), consistent with their high polarity and low hydrophobicity. All amino acids were detected predominantly in positive ionisation mode as protonated molecular ions [M+H]+, whereas no significant signals were observed in negative mode under the applied conditions. Accurate mass measurements showed excellent agreement between experimental and theoretical values (≤5 ppm), supporting confident elemental composition assignment.
Serine (1) displayed a protonated molecular ion at m/z 106.0507 and characteristic dehydration fragments at m/z 88.0392 [M+H-H2O]+ and 70.0289 [M+H-2H2O]+, reflecting the presence of a hydroxyl group prone to water loss. Threonine (7), another hydroxylated amino acid, showed similar dehydration behaviour with a base fragment at m/z 102.0541 [M+H-H2O]+, followed by further loss of CO to yield m/z 74.0603. Proline (2) exhibited m/z 116.0701 with a dominant fragment at m/z 70.0659, corresponding to sequential loss of H2O and CO. This fragmentation is typical of cyclic imino acids, where ring-cleavage and decarboxylation generate stable product ions. Valine (3) and isoleucine/leucine (56) showed protonated molecular ions at m/z 118.0857 and 132.1023, respectively, with characteristic neutral losses of H2O and CO to yield fragments at m/z 72.0818 and 86.0961. These fragmentation pathways are consistent with α-amino acid decarboxylation and side-chain cleavage mechanisms commonly reported for branched-chain amino acids [17].
Aromatic amino acids exhibited more diagnostic fragmentation patterns due to the stability of aromatic cations. Tyrosine (4) generated m/z 182.0810 and prominent fragments at m/z 165.0541 [M+H-NH3]+ and 147.0433 [M+H–NH3-H2O]+, indicating sequential loss of ammonia and water. Additional fragments at m/z 136.0752 and 123.0435 further supported cleavage adjacent to the phenolic ring. Phenylalanine (9) showed a protonated ion at m/z 166.0865 and produced a characteristic benzyl-type fragment at m/z 91.0547, along with m/z 120.0824 arising from combined loss of H2O and CO. The formation of m/z 91.0547 (C7H7+) is particularly indicative of a substituted phenyl group. Tryptophan (10), containing an indole moiety, displayed m/z 205.0971 (calcd m/z 205.0972) and sequential fragmentation involving loss of NH3 (m/z 188.0702) and CH2CO (m/z 146.0589), consistent with cleavage adjacent to the indole side chain. The presence of fragments at m/z 118.0638 and 91.0527 further confirmed indole ring-related fragmentation pathways [17].
Pipecolic acid (8), a non-proteinogenic cyclic amino acid, showed m/z 130.0869 [M+H]+ and characteristic dehydration and decarbonylation fragments at m/z 112.0761 and 84.0814, consistent with ring cleavage [18].
From a distribution perspective, all identified amino acids were detected in both flower and leaf extracts of O. africanus, O. grandiflorus, and O. suffruticosus. Their ubiquitous occurrence across species and tissues indicates that these metabolites represent conserved primary metabolic components rather than chemotaxonomic markers.

2.2.2. Phenolic Acids (Compounds 1122)

Phenolic acids constituted a prominent group of secondary metabolites in the investigated species, mainly represented by hydroxycinnamic acid derivatives and quinic acid conjugates. These compounds were preferentially detected in negative ionisation mode as deprotonated molecular ions [M-H], which provided enhanced sensitivity and structurally informative fragmentation patterns typical of phenolic acids.
Quinic acid (11) exhibited a characteristic [M-H] ion at m/z 191.0557 and diagnostic fragments at m/z 173.0459 [M-H-H2O], 111.0468, and 93.0352, consistent with sequential dehydration and ring-cleavage pathways commonly reported for cyclitol structures [19]. Chlorogenic acid isomers (1214), corresponding to caffeoylquinic acids (C16H18O9), showed [M-H] at m/z 353.0873 and produced prominent fragment ions at m/z 191.0558 (quinic acid moiety) and 179.0348 (caffeic acid moiety) [20,21]. Additional fragments at m/z 161.0246 and 135.0452 arose from dehydration and decarboxylation of the caffeoyl unit. The relative intensities of m/z 191 and 179 are diagnostic for distinguishing positional isomers of chlorogenic acids (3-O-, 4-O-, and 5-O-caffeoylquinic acids), as described in established LC–MS fragmentation rules for hydroxycinnamoylquinic acids [20,21]. The presence of the sodium adduct [M+Na]+ at m/z 377.0844 in positive mode further supported structural assignment.
Di-caffeoylquinic acid (DCQA) isomers (1821) displayed [M-H] at m/z 515.1191 and characteristic product ions at m/z 353.0876 (loss of one caffeoyl residue), 191.0559 (quinic acid), and 179.0347 (caffeic acid), confirming the presence of two caffeoyl substituents [20,21]. Coumaroylquinic acid (16) showed a deprotonated ion at m/z 337.0929 with diagnostic fragments at m/z 191.0555 (quinic acid), 173.0461 [quinic acid-H2O], and 163.0412 (coumaric acid anion) [20,21]. Similarly, feruloylquinic acid (17) produced [M-H] at m/z 367.1039 and characteristic fragment ions at m/z 193.0531 (ferulic acid), 191.0559 (quinic acid), and 149.0581 [ferulic acid-CO2]. The presence of m/z 134.0362 further supported methoxy-substituted hydroxycinnamic acid fragmentation, which typically involves demethylation and decarboxylation pathways [20,21].
Free hydroxycinnamic acids were also identified. Caffeic acid (15) exhibited [M-H] at m/z 179.0347 and a prominent fragment at m/z 135.0450 corresponding to decarboxylation (−44 Da), a well-known fragmentation pathway for cinnamic acid derivatives. Ferulic acid (22) showed [M-H] at m/z 193.0510 and diagnostic fragments at m/z 178.0261 (loss of CH3), 149.0611 (loss of CO2), and 134.0379, consistent with methoxy-substituted cinnamic acid fragmentation mechanisms reported in the literature [19].
From a distribution perspective, phenolic acids were detected across flower and leaf tissues of O. africanus, O. grandiflorus, and O. suffruticosus. Mono- and di-caffeoylquinic acids were widely distributed and represented major phenolic constituents. However, certain compounds, such as ferulic acid and feruloylquinic acid derivatives, were more prevalent in leaf extracts, suggesting tissue-dependent biosynthetic regulation. Although phenolic acids were not exclusively species-specific, subtle qualitative and relative abundance differences contributed to the overall metabolic fingerprint of each species.
Overall, the phenolic acid profile was characterised by a predominance of hydroxycinnamoylquinic acid derivatives, whose fragmentation patterns closely matched established LC–MS diagnostic rules for this class. The combination of accurate mass data and structurally informative MS/MS spectra enabled reliable annotation and supported their role as key phenolic constituents in Oncosiphon species.

2.2.3. Flavonoids (Compounds 2356)

Flavonoids constituted one of the most structurally diverse and chemotaxonomically informative classes detected in the investigated taxa, comprising flavan-3-ols, flavonols, flavones, methoxylated derivatives, and a wide array of glycosylated conjugates. These compounds were detected in both ionisation modes; however, the negative ion mode generally yielded more abundant, structurally diagnostic product ions for flavonol and flavone derivatives. Structural assignments were supported by accurate mass measurements (≤5 ppm error), characteristic neutral losses of sugar moieties, and well-established Retro-Diels–Alder (RDA) fragmentation pathways of the flavonoid C-ring [20,21,22,23,24,25,26,27].
Flavan-3-ols
Gallocatechin/epigallocatechin (2324) type flavan-3-ol was identified based on the deprotonated molecular ion at m/z 305.0671. Their MS/MS spectra exhibited characteristic fragment ions at m/z 221.0462, 179.0371, 137.0249, and 125.0221, which arise from RDA cleavage and heterocyclic ring fission of the flavan-3-ol skeleton [22]. These fragmentation pathways are consistent with previously reported LC–MS/MS behaviour of catechin-type compounds [22]. The presence of diagnostic A-ring fragments further confirmed the trihydroxylated B-ring substitution pattern.
Flavonol Glycosides
Flavonol glycosides were prominently represented by quercetin, kaempferol, and isorhamnetin derivatives. Quercetin–3–O–rutinoside (rutin, 25) exhibited a deprotonated molecular ion at m/z 609.1455. MS/MS analysis showed sequential neutral losses of rhamnose (−146 Da) and glucose (−162 Da), yielding the quercetin aglycone ion at m/z 301.0345. In positive mode, the protonated molecular ion at m/z 611.1604 generated fragments at m/z 465.1025 [M+H-Rha]+ and 303.0499, confirming the rutinoside substitution. Such stepwise sugar losses are well established for O-glycosylated flavonols [20].
Monohexoside derivatives of quercetin (27) showed [M-H] at m/z 463.0881 and produced a dominant fragment at m/z 301.0351 corresponding to the aglycone, confirming hexose conjugation (−162 Da) [20]. Similarly, isorhamnetin 3–O–hexosides (40, 41) exhibited [M-H] at m/z 477.1035 and yielded m/z 315.0502 (isorhamnetin aglycone), along with m/z 300.0248 reflecting loss of a methyl group (−15 Da). The additional fragments at m/z 151 and 107 arose from RDA cleavage of the aglycone and are characteristic of flavonol structures [21].
Isorhamnetin dihexoside isomers (3031) displayed [M-H] at m/z 639.1563 and sequential sugar losses, generating m/z 477.1050 and 315.0507, confirming the presence of two hexose units. The fragmentation patterns were consistent with previously reported behaviour of di-O-glycosylated flavonols [21].
Flavone Glycosides and Glucuronides
Flavone glycosides, including luteolin and kaempferol derivatives, were widely distributed. Luteolin/kaempferol–O–rutinoside (3233) produced [M-H] at m/z 593.1509 and fragments at m/z 447.0941 [M-H-Rha] and 285.0395 (aglycone), confirming disaccharide substitution [21]. Monohexosides (37, 38) exhibited [M-H] at m/z 447.0929 and a diagnostic aglycone ion at m/z 285.0401. These fragmentation pathways correspond to typical O-glycosidic bond cleavage [20]. Luteolin glucuronide (39) showed [M-H] at m/z 461.0723 and produced m/z 285.0403 following loss of glucuronic acid (−176 Da), a neutral loss widely recognised as indicative of glucuronidation [21,24,25]. Tricin–glucuronoside (43) generated m/z 329.0666 (aglycone) and m/z 314.0426 [aglycone–CH3], supporting both methylation and glucuronide substitution [25].
Aglycones and Methoxylated Flavonoids
Aglycone flavonoids such as quercetin (46), luteolin (47), kaempferol (48), taxifolin (34), eriodictyol (45), and apigenin (51) were identified based on characteristic [M-H] ions and RDA fragmentation patterns. Quercetin (46) exhibited [M-H] at m/z 301.0362 and diagnostic RDA fragments at m/z 179.0350 and 151.0039. Luteolin/kaempferol (47, 48) showed m/z 285.0401 with fragments at m/z 151.0035 and 133.0290, consistent with A- and B-ring cleavages. Apigenin (51) produced [M-H] at m/z 269.0455 and fragments at m/z 151.0037 and 117.0343, typical of flavone fragmentation. Compounds 4548 and 51 were identified using reference standards.
Methoxylated flavones, including eupalitin (5253) and trimethoxyflavone derivatives (55), were characterised by sequential losses of methyl radicals (–15 Da) and demethylated fragments, a well-documented behaviour for O-methylated flavonoids [27]. For example, eupalitin exhibited [M-H] at m/z 329.0666 and fragments at m/z 314.0420 [M-H-CH3] and 299.0192 [M-H-2CH3], along with RDA fragments at m/z 151.0036. These patterns clearly supported methoxy substitution on the flavone backbone [27].
Flavonoids were detected in both flower and leaf extracts of O. africanus, O. grandiflorus, and O. suffruticosus. While many compounds were shared among species, qualitative differences in glycosylation type (rutinoside, hexoside, glucuronide) and degree of methoxylation were observed. Flower tissues generally exhibited greater diversity in methoxylated flavones and complex glycosides, whereas leaves showed comparatively simpler glycosylation patterns.
Overall, flavonoid identification was strongly supported by accurate mass measurements, diagnostic neutral losses of sugar moieties, and characteristic RDA fragmentation pathways. Although flavonoids contributed to tissue-level and interspecific metabolic variation, their chemotaxonomic significance was secondary to that of sesquiterpene lactones, which exhibited more pronounced qualitative differences among the three Oncosiphon species.

2.2.4. Sesquiterpene Lactones (Compounds 5774)

The Oncosiphon species analysed (O. africanus, O. grandiflorus, and O. suffruticosus) contain a chemically diverse array of sesquiterpene lactones (SL’s), predominantly of the germacranolide and guaianolide types, as identified by LC-QToF-MS. These compounds are characterised by neutral losses of water (H2O), carbon dioxide (CO2), carbon monoxide (CO), and acetate (Ac) groups, which are diagnostic in positive ionisation mode [28,29,30,31].
Compounds 5762 (C15H20O4), assigned as hydroxylated germacranolide isomers, exhibited a protonated ion at m/z 265.1431 and an ammonium adduct at m/z 282.1700. Their fragmentation pattern showed successive dehydration to m/z 247.1332 [M+H-H2O]+ and m/z 229.1225 [M+H-2H2O]+, followed by decarboxylation to m/z 221.1535 [M+H-CO2]+ and combined losses to m/z 203.1433 [M+H-H2O-CO2]+. Characteristic low-mass fragments at m/z 149.0965 (C10H13O+) and 121.1014 (C9H13+) supported cleavage of the germacrane skeleton [28,29,30,31]. These metabolites were consistently detected in flowers and leaves of O. africanus and O. grandiflorus, indicating close chemotaxonomic similarity between these two species. In negative mode, the deprotonated precursor at m/z 263.1289 produced a major fragment at m/z 219.1387 corresponding to the loss of CO2 [M-H-CO2]. Compound 63 (C15H18O4), tentatively identified as isoepoxyestafiatin or an isomer, showed [M+H]+ at m/z 263.1280 and [M+Na]+ at m/z 285.1101. MS/MS fragmentation included dehydration to m/z 245.1179 and decarboxylation to m/z 219.1388, followed by further loss to m/z 201.1272 [28,29,30,31]. The compound was observed in both organs of O. africanus and O. grandiflorus and in trace amounts in O. suffruticosus. Compound 65 (C15H20O5), assigned as 4,5-epoxy-8,13-dihydroxy-1(10),7(11)-germacradien-12,6-olide, exhibited a protonated molecular ion at m/z 281.1358. Its MS/MS spectrum was dominated by sequential water losses to m/z 263.1277 and 245.1142, followed by decarboxylation to m/z 237.1501 and combined dehydration/decarboxylation to m/z 201.1271 [28,29,30,31]. This metabolite was characteristic of O. grandiflorus. The eudesmanolide derivative santamarin or reynosin (Compound 66, C15H20O3) showed [M+H]+ at m/z 249.1488 and [M+Na]+ at m/z 271.1305. Fragmentation involved dehydration to m/z 231.1382 and decarboxylation to m/z 205.1589, typical of eudesmanolide frameworks [28,29]. This compound was primarily detected in O. suffruticosus. Dehydrocostunolide or germacranolide derivative (Compound 68/69, C15H18O2) displayed [M+H]+ at m/z 231.1381 with dehydration to m/z 213.1276 and further fragmentation to m/z 187.1481 [28,29,30]. Compound 70 (C15H16O3), representing guaianolide derivatives, showed [M+H]+ at m/z 245.1171 and characteristic fragments at m/z 227.1071 [M+H-H2O]+ and 201.1277 [M+H-CO2]+ [28,29,30,31]. Matricarin (Compound 72, C17H20O5) exhibited [M+H]+ at m/z 305.1386 and fragmentation consistent with acetyl cleavage and lactone rearrangements [31]. These guaianolides were predominantly associated with O. suffruticosus, suggesting species-level differentiation. A saturated analog, 1α,6α-dihydroxy-4E,10(14)-germacradien-12,8α-olide (73), was also identified at a deprotonated mass of m/z 265.1451 [28,29,30,31]. Its fragmentation pattern confirmed the expected losses of water and CO2, producing fragments at m/z 247.1344 and 221.1547, consistent with hydroxylated germacranolide structures. Costunolide or germacranolide derivative (Compound 74, C15H20O2) was observed with [M+H]+ at m/z 233.1538. Diagnostic ions at m/z 215.1432 [M+H-H2O]+ and 189.1642 [M+H-CO2]+, along with hydrocarbon fragments at m/z 145.1013 and 131.0856, confirmed the germacranolide structure [28,30]. Costunolide (or germacranolide derivative) was high in O. suffruticosus and present in trace amounts in the other species, supporting its potential as a chemotaxonomic marker.
Overall, sesquiterpene lactones exhibited species-dependent distribution, with O. africanus and O. grandiflorus enriched in hydroxylated germacranolides, whereas O. suffruticosus showed greater abundance of guaianolides and costunolide-type derivatives.

2.2.5. Fatty Acid Derivatives (Compounds 7583)

Fatty acid derivatives were primarily detected in negative ion mode as deprotonated molecules [M-H]. Trihydroxy-octadecadienoic acid (Compound 75, C18H32O5) showed [M-H] at m/z 327.2177, undergoing sequential dehydration to m/z 309.2070, 291.1977, and 273.1839 [32]. The saturated analogue (Compound 76, C18H34O5) exhibited [M-H] at m/z 329.2323 with similar fragmentation behaviour [32]. These trihydroxy fatty acids were broadly distributed across all species and organs. Hydroxy-octadecadienoic acid (Compounds 7779, C18H32O3) presented [M-H] at m/z 295.2278 and fragments at m/z 277.2171 [M-H-H2O], 251.2361 [M-H-CO2], and 233.2275, consistent with hydroxyl group rearrangements and neutral losses along the C-18 chain [33]. The oxo-octadecadienoic acid isomers (Compounds 8183, C18H30O3) showed [M-H] at m/z 293.2122 with diagnostic losses to m/z 275.2016, 249.2199, 205.1594, and 167.1063, reflecting the oxo substitution and unsaturation within the fatty acid chain [33]. The dicarboxylic fatty acid 9-octadecenedioic acid (Compound 80, C18H32O4) exhibited [M-H] at m/z 311.2224 and decarboxylation to m/z 267.2330 [34]. Overall, these fatty acid derivatives were consistently found across leaves and flowersof all three Oncosiphon species.

2.2.6. Chemotaxonomic Implications

While amino acids and fatty acid derivatives were ubiquitously distributed and largely conserved, interspecific differentiation among the three Oncosiphon species was primarily driven by variations in sesquiterpene lactone composition and, to a lesser extent, flavonoid substitution patterns. Flowers exhibited particularly distinct sesquiterpene lactone profiles, highlighting tissue-specific metabolic specialisation. The integrated evaluation of accurate mass data and diagnostic MS/MS fragmentation patterns provided robust structural annotation and revealed clear metabolic signatures that support chemotaxonomic discrimination within the genus Oncosiphon.

2.3. Untargeted Chemometrics Analysis of the UPLC–MS Data

2.3.1. Interspecies Chemical Variation Based on Flowers

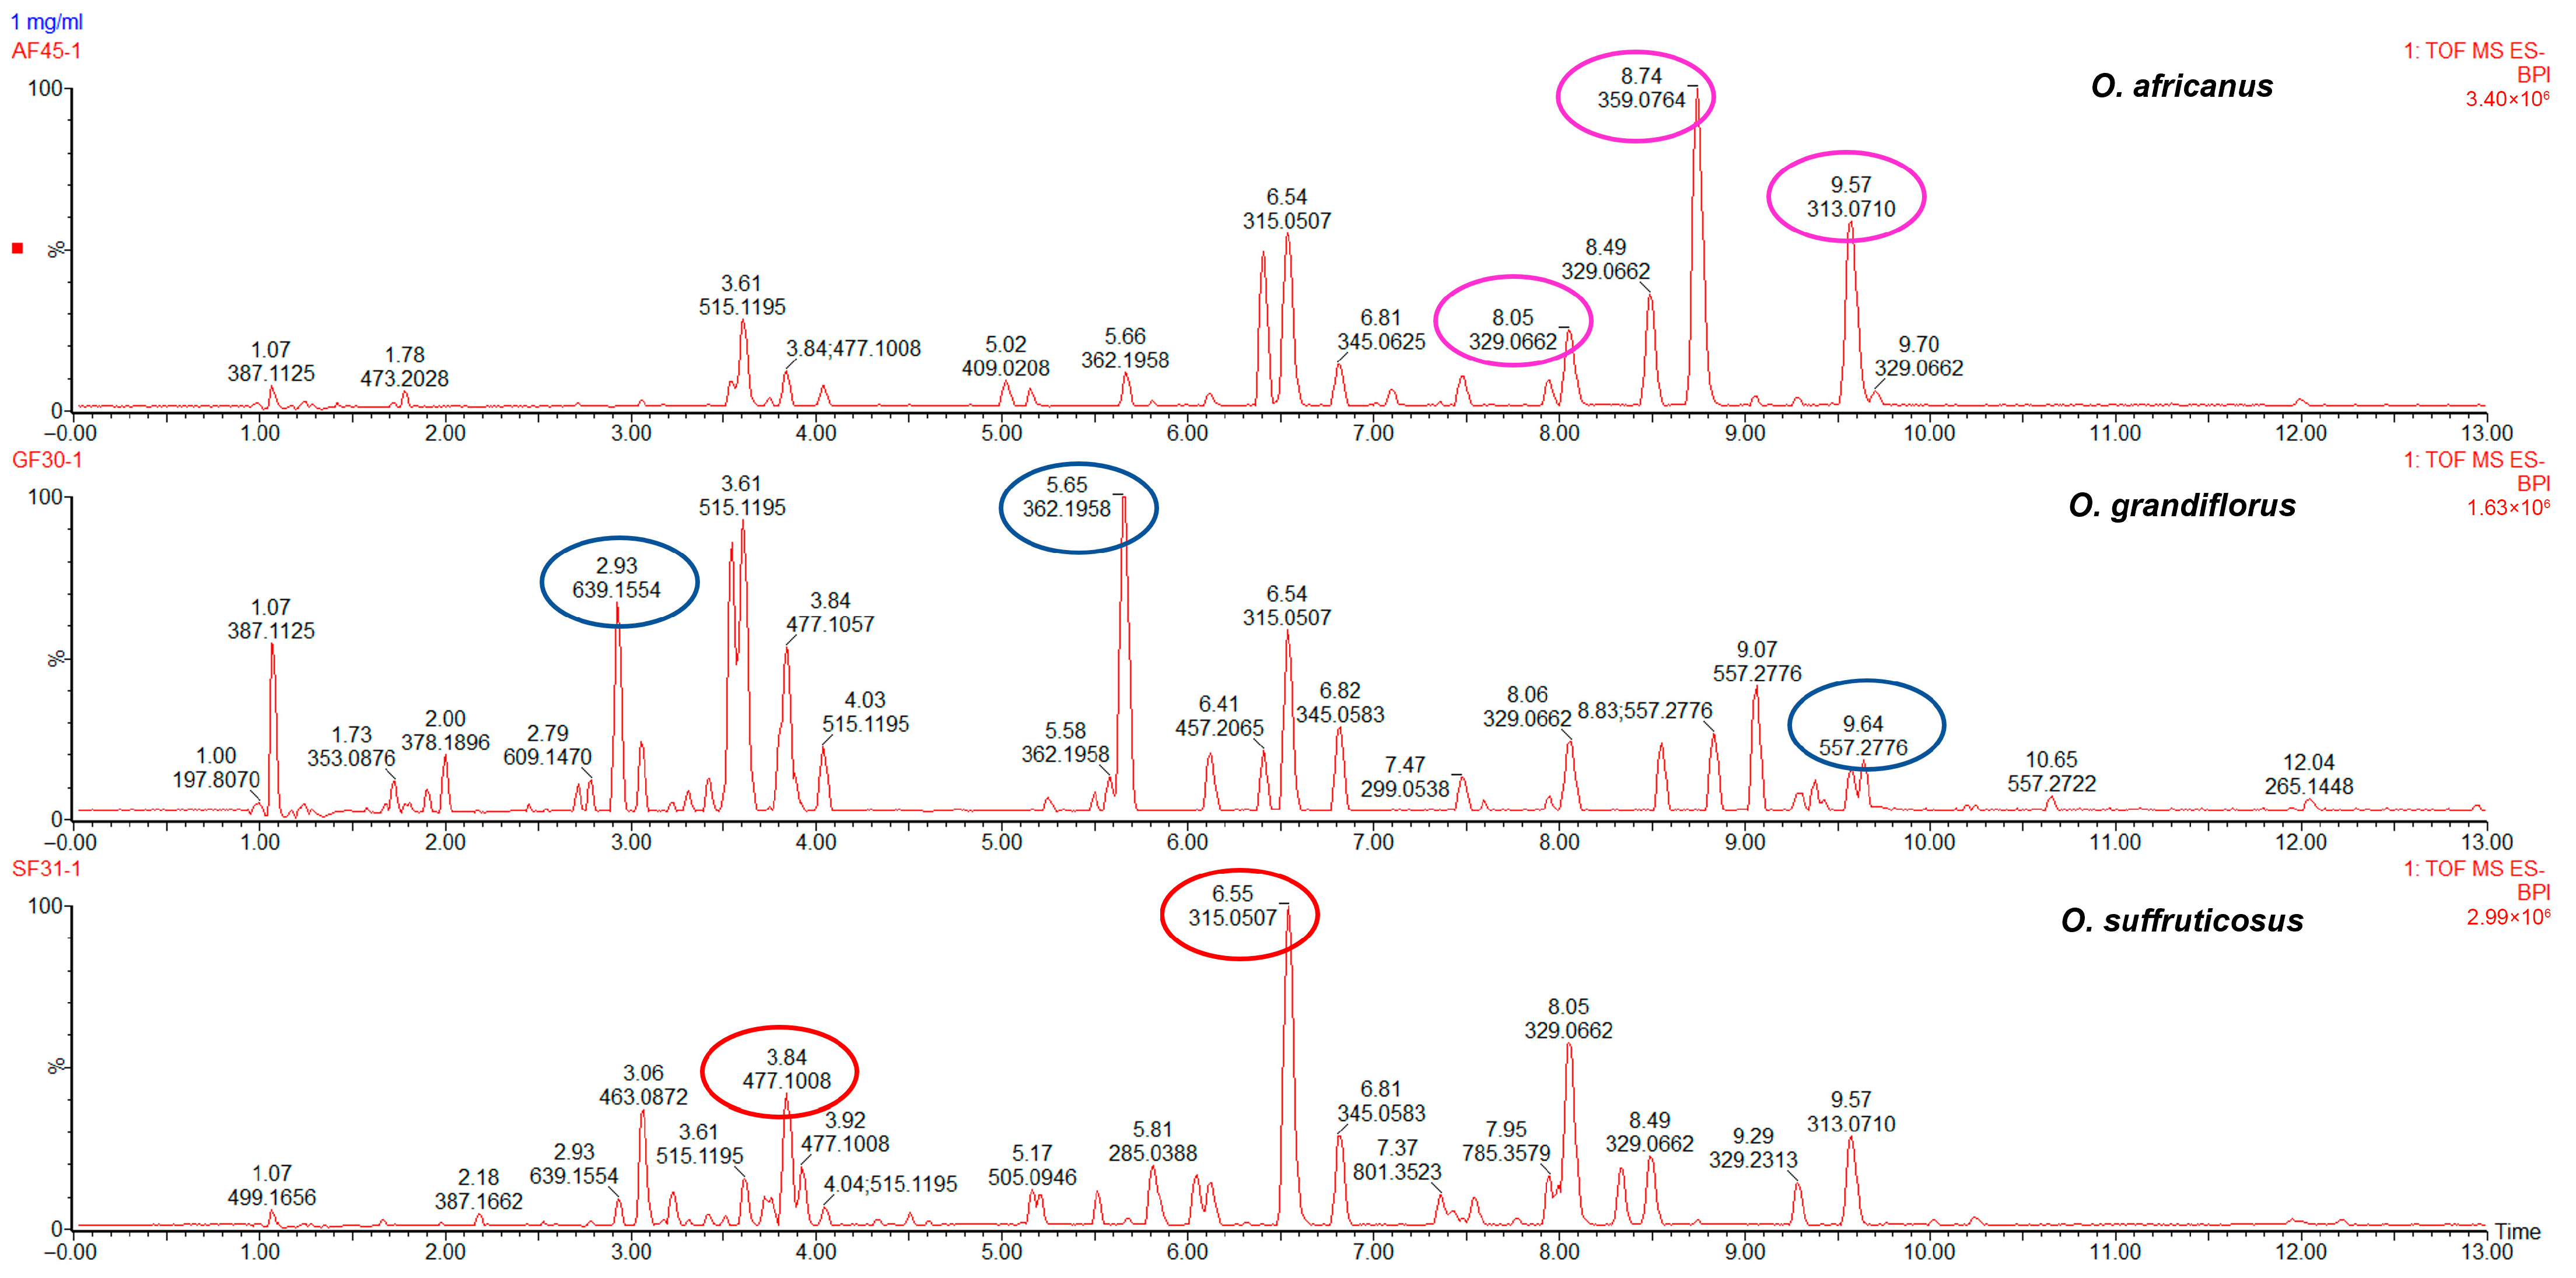
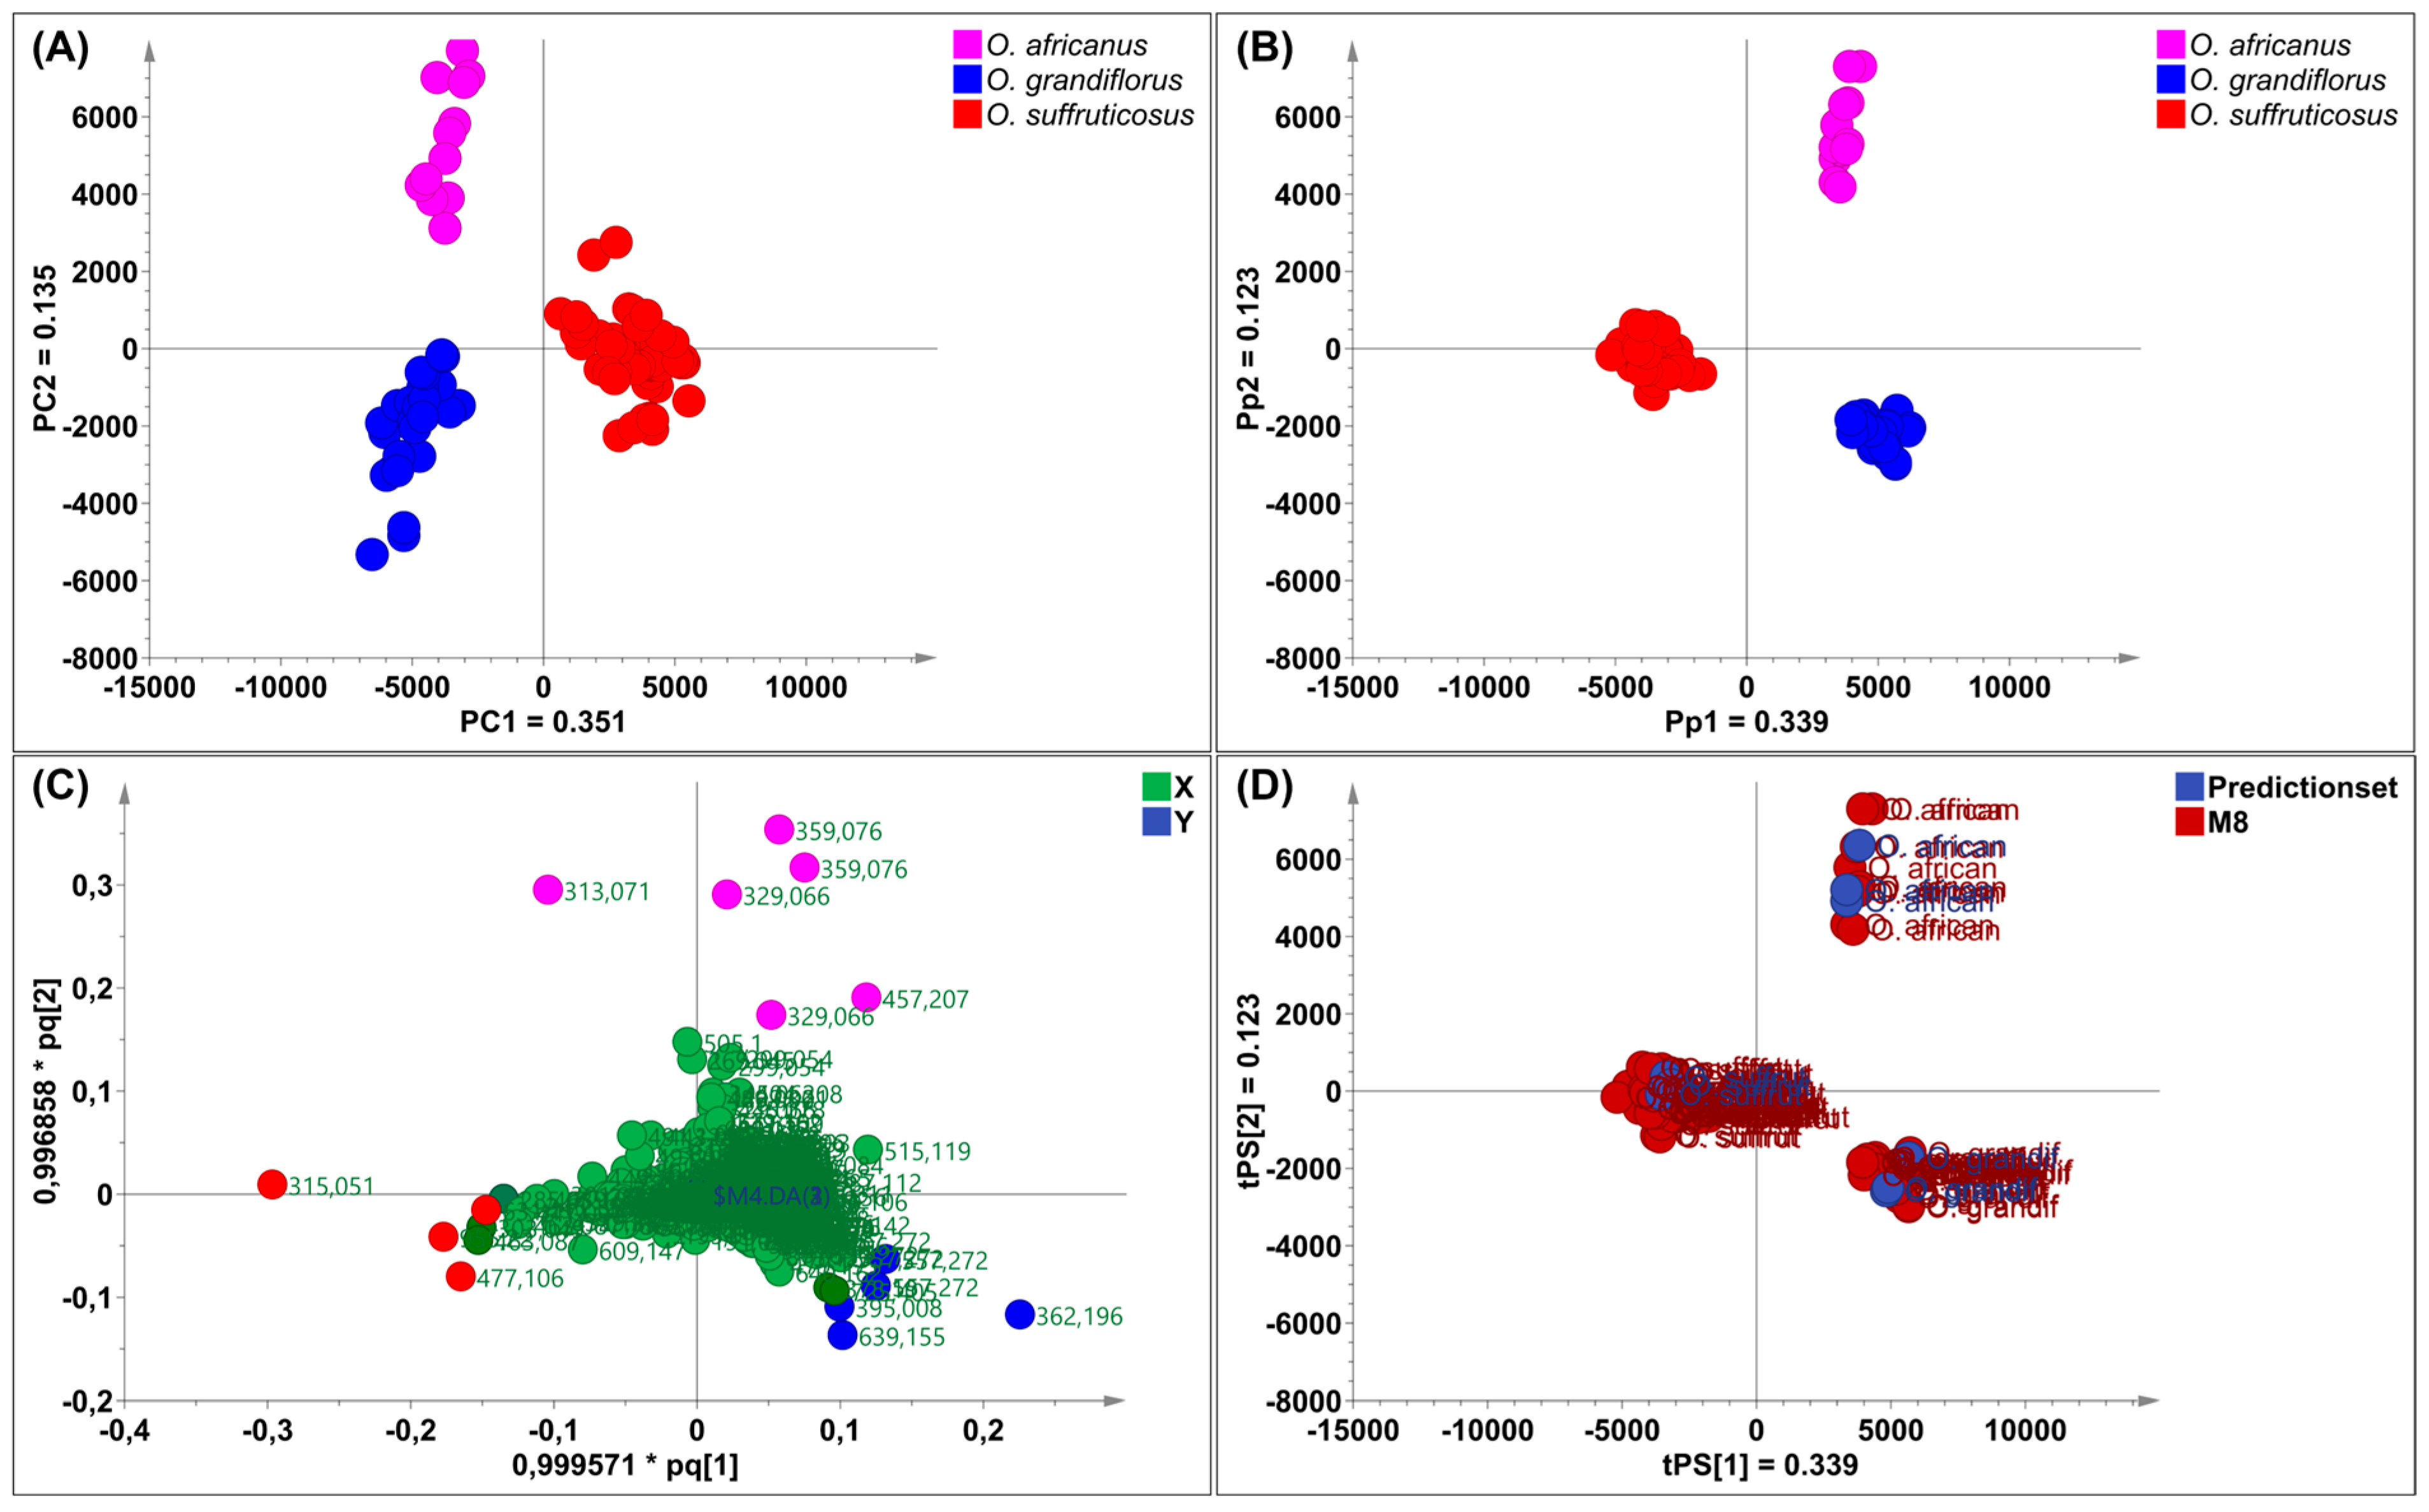
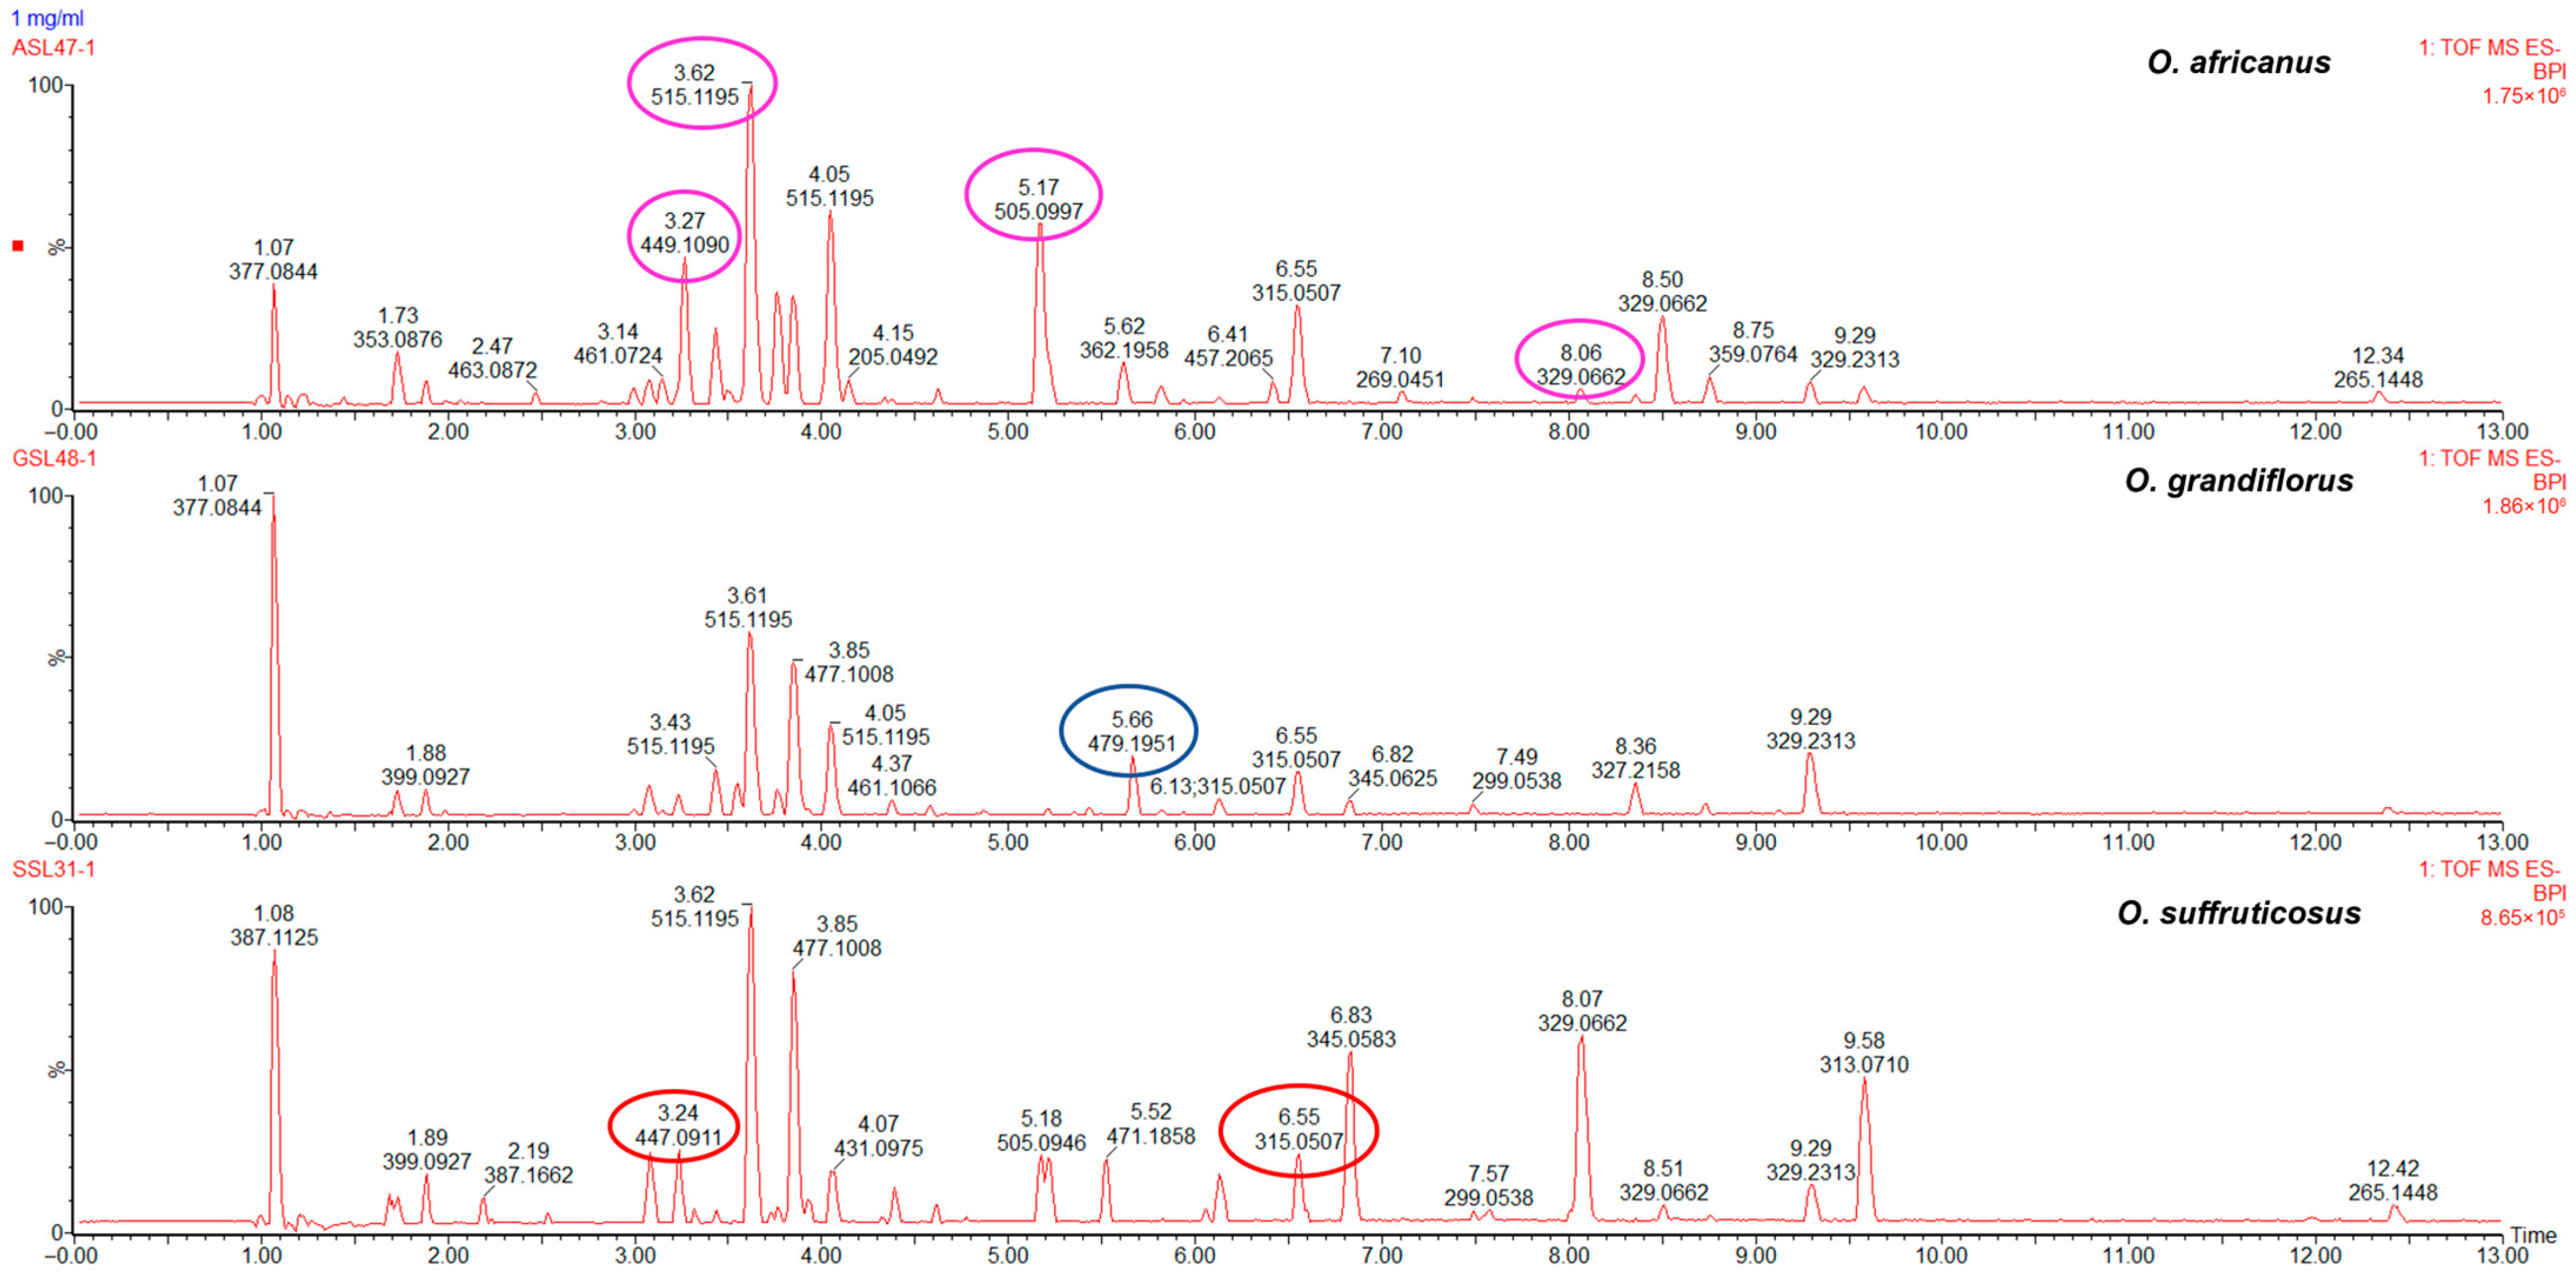
Principal component analysis was applied to reveal chemical variation between the Oncosiphon flowers. The UPLC–MS data matrix comprised 88 observations (N) and 3174 X–variables. The PCA model, characterised by six principal components, explained 70.3% of the total variation in the X–matrix (R2cum 0.703) and demonstrated a 59.6% predictive ability (Q2cum 0.596). The scores scatter plot of PC1 vs. PC2 (Figure 4A) revealed three distinct clusters that correspond to the three species. Samples of O. suffruticosus (red) clustered on the positive PC1, while O. africanus (pink) and O. grandiflorus (blue) clustered distinctly on the negative PC1. The chemical variation modelled along PC1 was 35.1%, while O. africanus and O. grandiflorus, separated along PC2, had a chemical variation of 13.5%. Following PCA modelling, a supervised OPLS–DA model was constructed. The scores plot (Figure 4B), coloured according to the three classes (species), indicates that O. africanus and O. grandiflorus separated and occupied positive PC1, while O. suffruticosus occupied a quadrant in negative PC1 (Figure 4B). The variation along the first predictive component (Pp1) was 33.9%, and further separation between the O. africanus and O. grandiflorus samples along Pp2 was modelled by 12.3%. The OPLS–DA model displayed a good predictive ability of 96.8% (Q2cum 0.968). The clustering pattern confirms the HPTLC findings that the chemistry of O. suffruticosus flowers is more distinct compared to the other two species. The corresponding loadings plot revealed variables (marker compounds) responsible for the observed differences between the three species (Figure 4C). Variables located on the extreme ends of the loadings plot and colour-coded pink (O. africanus), blue (O. grandiflorus), and red (O. suffruticosus) are associated with their respective species, occupying the corresponding position in the OPLS-DA scored plot (Figure 4B). External validation of the model using test samples (blue) confirmed model reliability in accurately predicting the identities of the test samples (Figure 4D). The marker compounds identified on the loadings plot were identified through retention time/mass-to-charge ratio pairs (Rt/m/z) and are listed in Table 4. For O. africanus, three compounds were indicated as markers, and tentatively identified as eupalitin, 5,6,4′–trihydroxy–7,8,3′–trimethoxyflavone, and dihydroxy–dimethoxyflavone. Three marker compounds were indicated for O. grandiflorus, namely rhamnetin sophoroside and two other unidentified compounds. For O. suffruticosus, isorhamnetin 3–O–glucoside and methyl quercetin were revealed as distinguishing markers. Some of these markers correspond to the results obtained in the HPTLC analysis; the sensitivity of UHPLC–MS enabled the identification of more compounds. The UHPLC–MS profiles of the flower samples confirmed that the marker compounds vary quantitatively, as displayed in Figure 5.

2.3.2. Interspecies Chemical Variation Based on Stems and Leaves

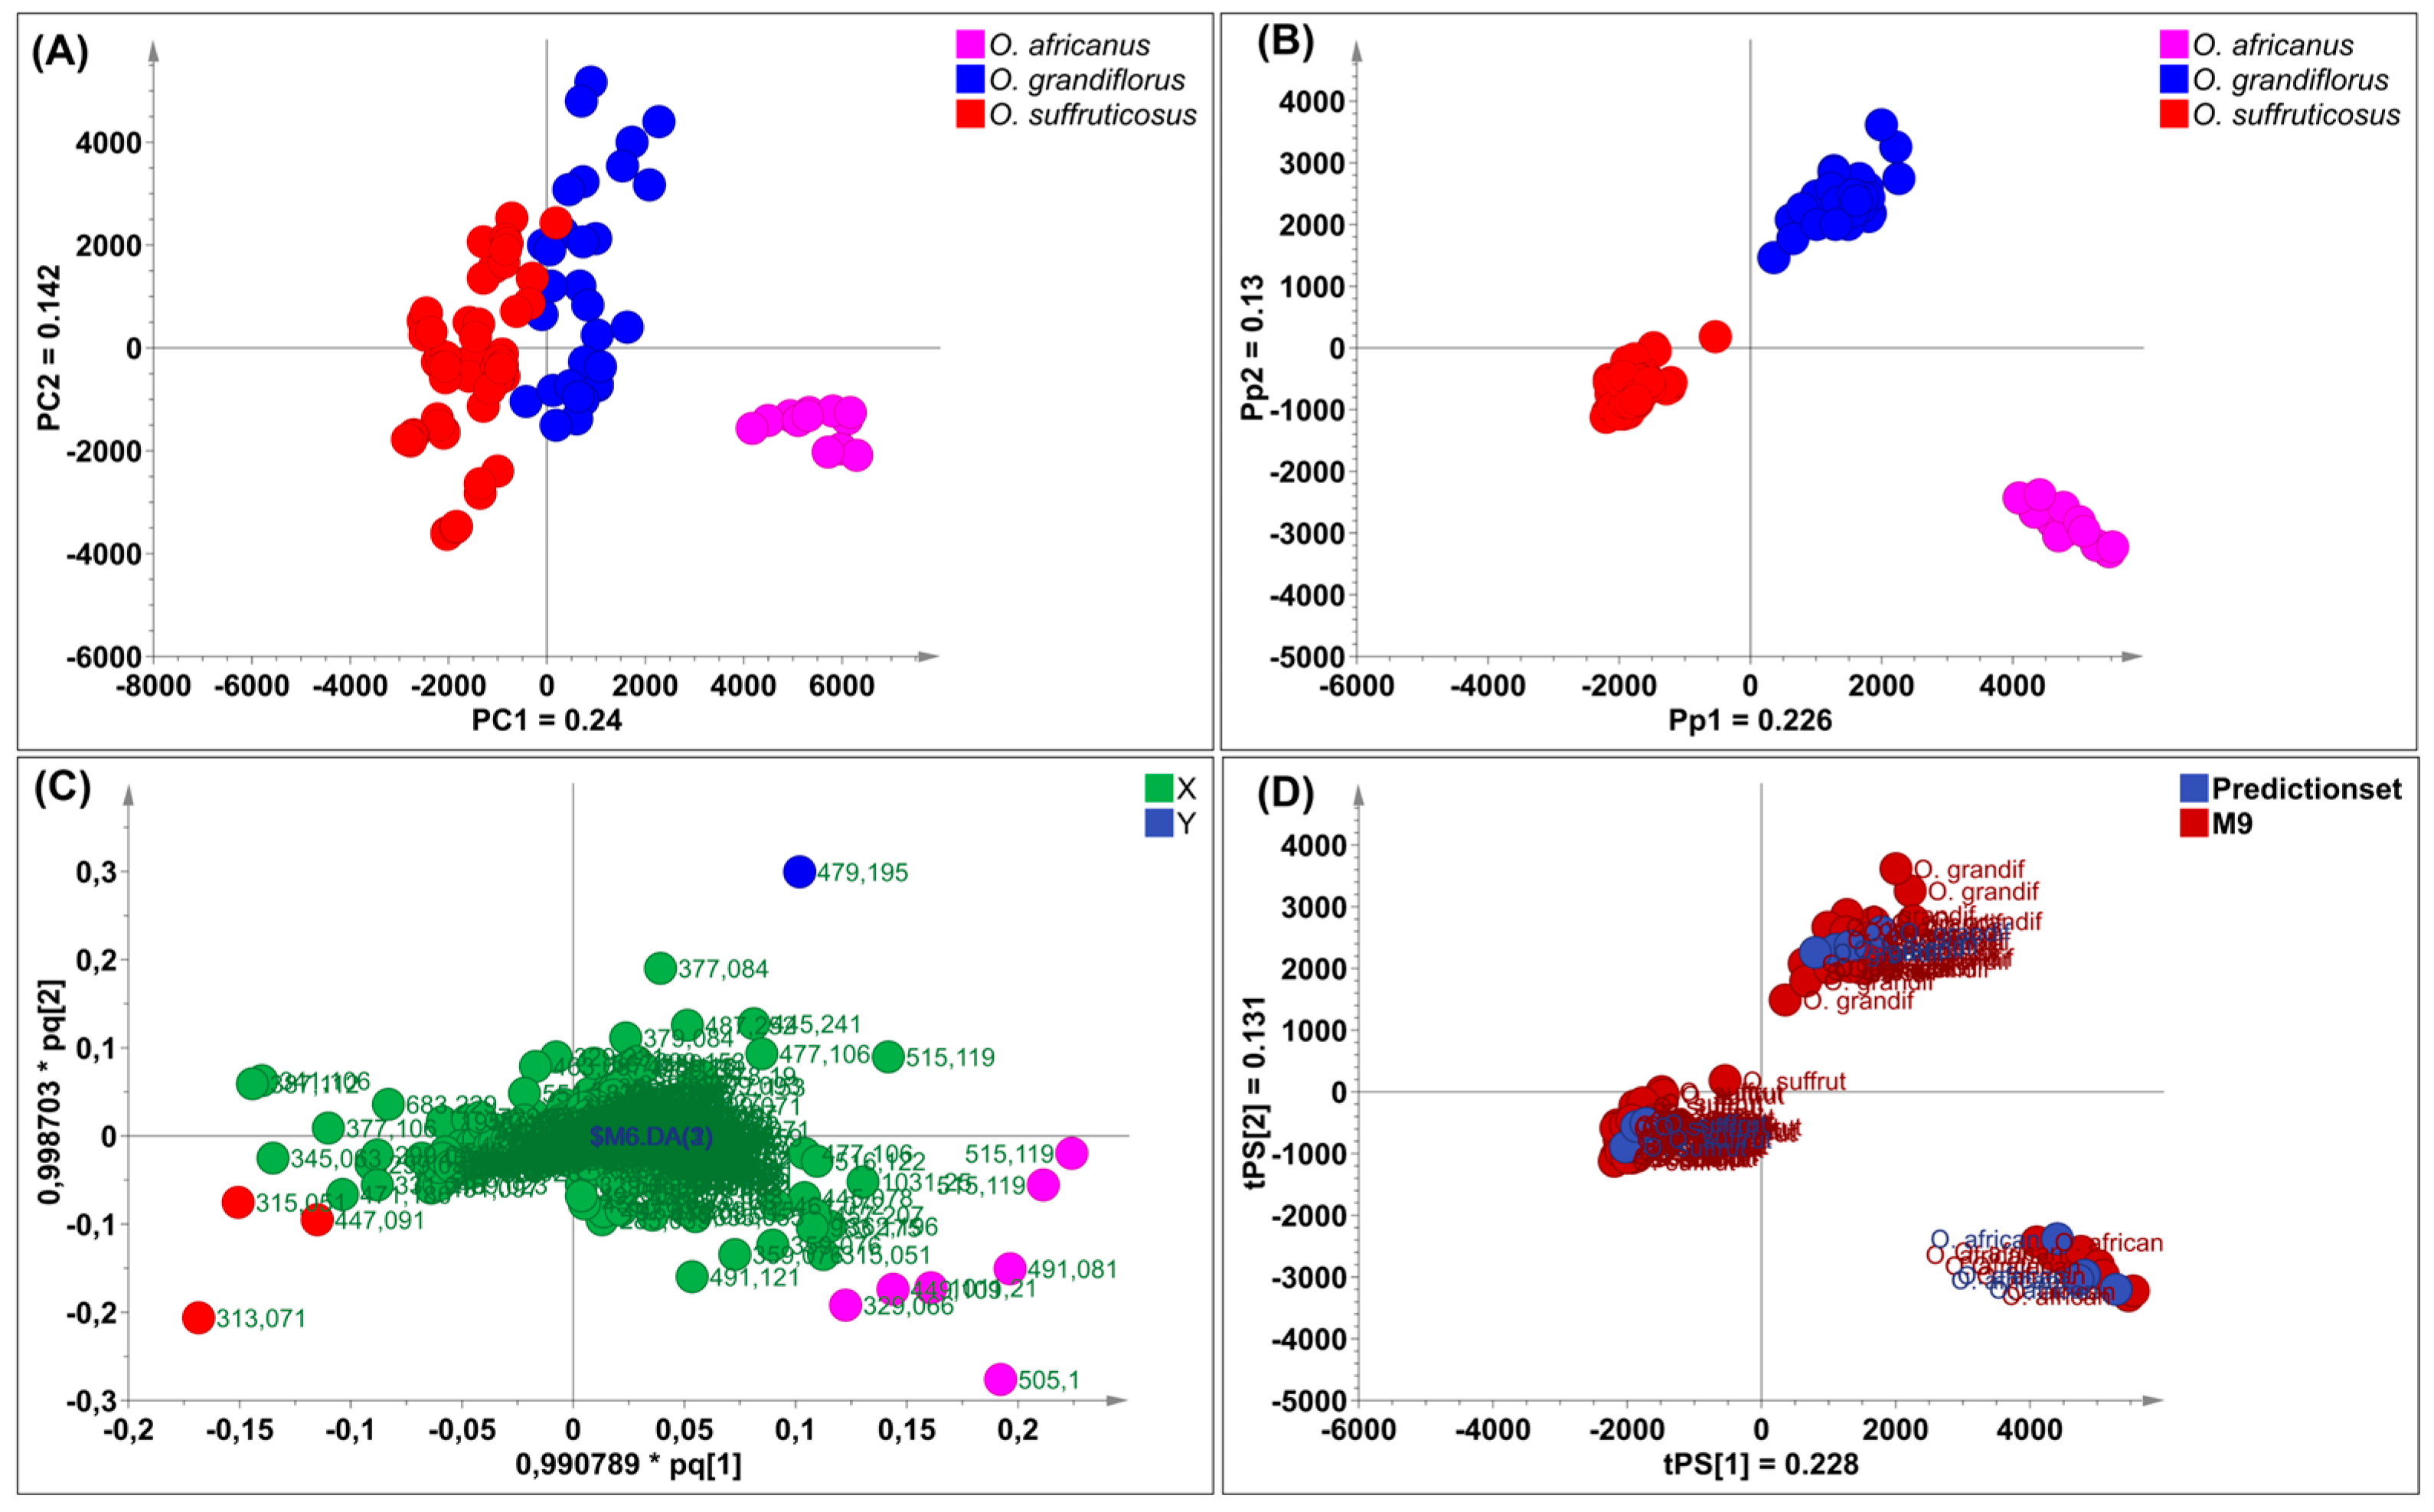
The PCA model built on a data matrix comprising 98 observations (N) and 3174 X–variables, was characterised by seven principal components, which explained 71.6% of the total variation in the X–matrix (R2cum 0.716) and 57.7% predictive ability (Q2cum 0.577). The largest variation modelled along PC1 (24.0%) separated O. africanus from the other two species, while 14.2% variation was observed along PC2 (Figure 6A). The observed clustering pattern suggests that the stems and leaves profiles of O. grandiflorus and O. suffruticosus are closely related. Applying the supervised OPLS–DA, the model revealed a cumulative 52.3% variation in X (R2Xcum = 0.523), 95.7% (R2Ycum = 0.957) in Y, and a good predictive ability of 96.7% (Q2cum = 0.967). The 22.6% variation modelled along Pp1 was responsible for chemical differences between O. africanus and the other two species, while 13% of the variation in the chemical data was explained by Pp2, which separated O. grandiflorus and O. suffruticosus (Figure 6B). The corresponding loadings plot (Figure 6C) constructed from the OPLS–DA model revealed distinguishing markers for each of the three species. The Rt/m/z pairs and tentative identities of these markers are listed in Table 5. External validation showed that the OPLS–DA model accurately predicted the test samples into the correct species cluster (Figure 6D). The chemical markers for O. africanus were tentatively identified as dicaffeoylquinic acid, tricin–glucuronoside, eupalitin, and two unknown compounds. In O. grandiflorus, one unknown distinguishing marker was revealed, while three markers for O. suffruticosus were tentatively identified as kaempferol glucoside, methyl quercetin, and dihydroxy–dimethoxyflavone. These distinguishing chemical markers confirmed that the three species differ predominantly quantitatively rather than qualitatively, with O. suffruticosus showing significant quantitative differences when compared to O. africanus and O. grandiflorus. Figure 7 shows the chromatographic profiles of the species with the marker compounds highlighted.

2.4. The GCxGC–ToF–MS and Headspace Analysis

2.4.1. Headspace Profiles of the Volatile Compounds in the Flowers

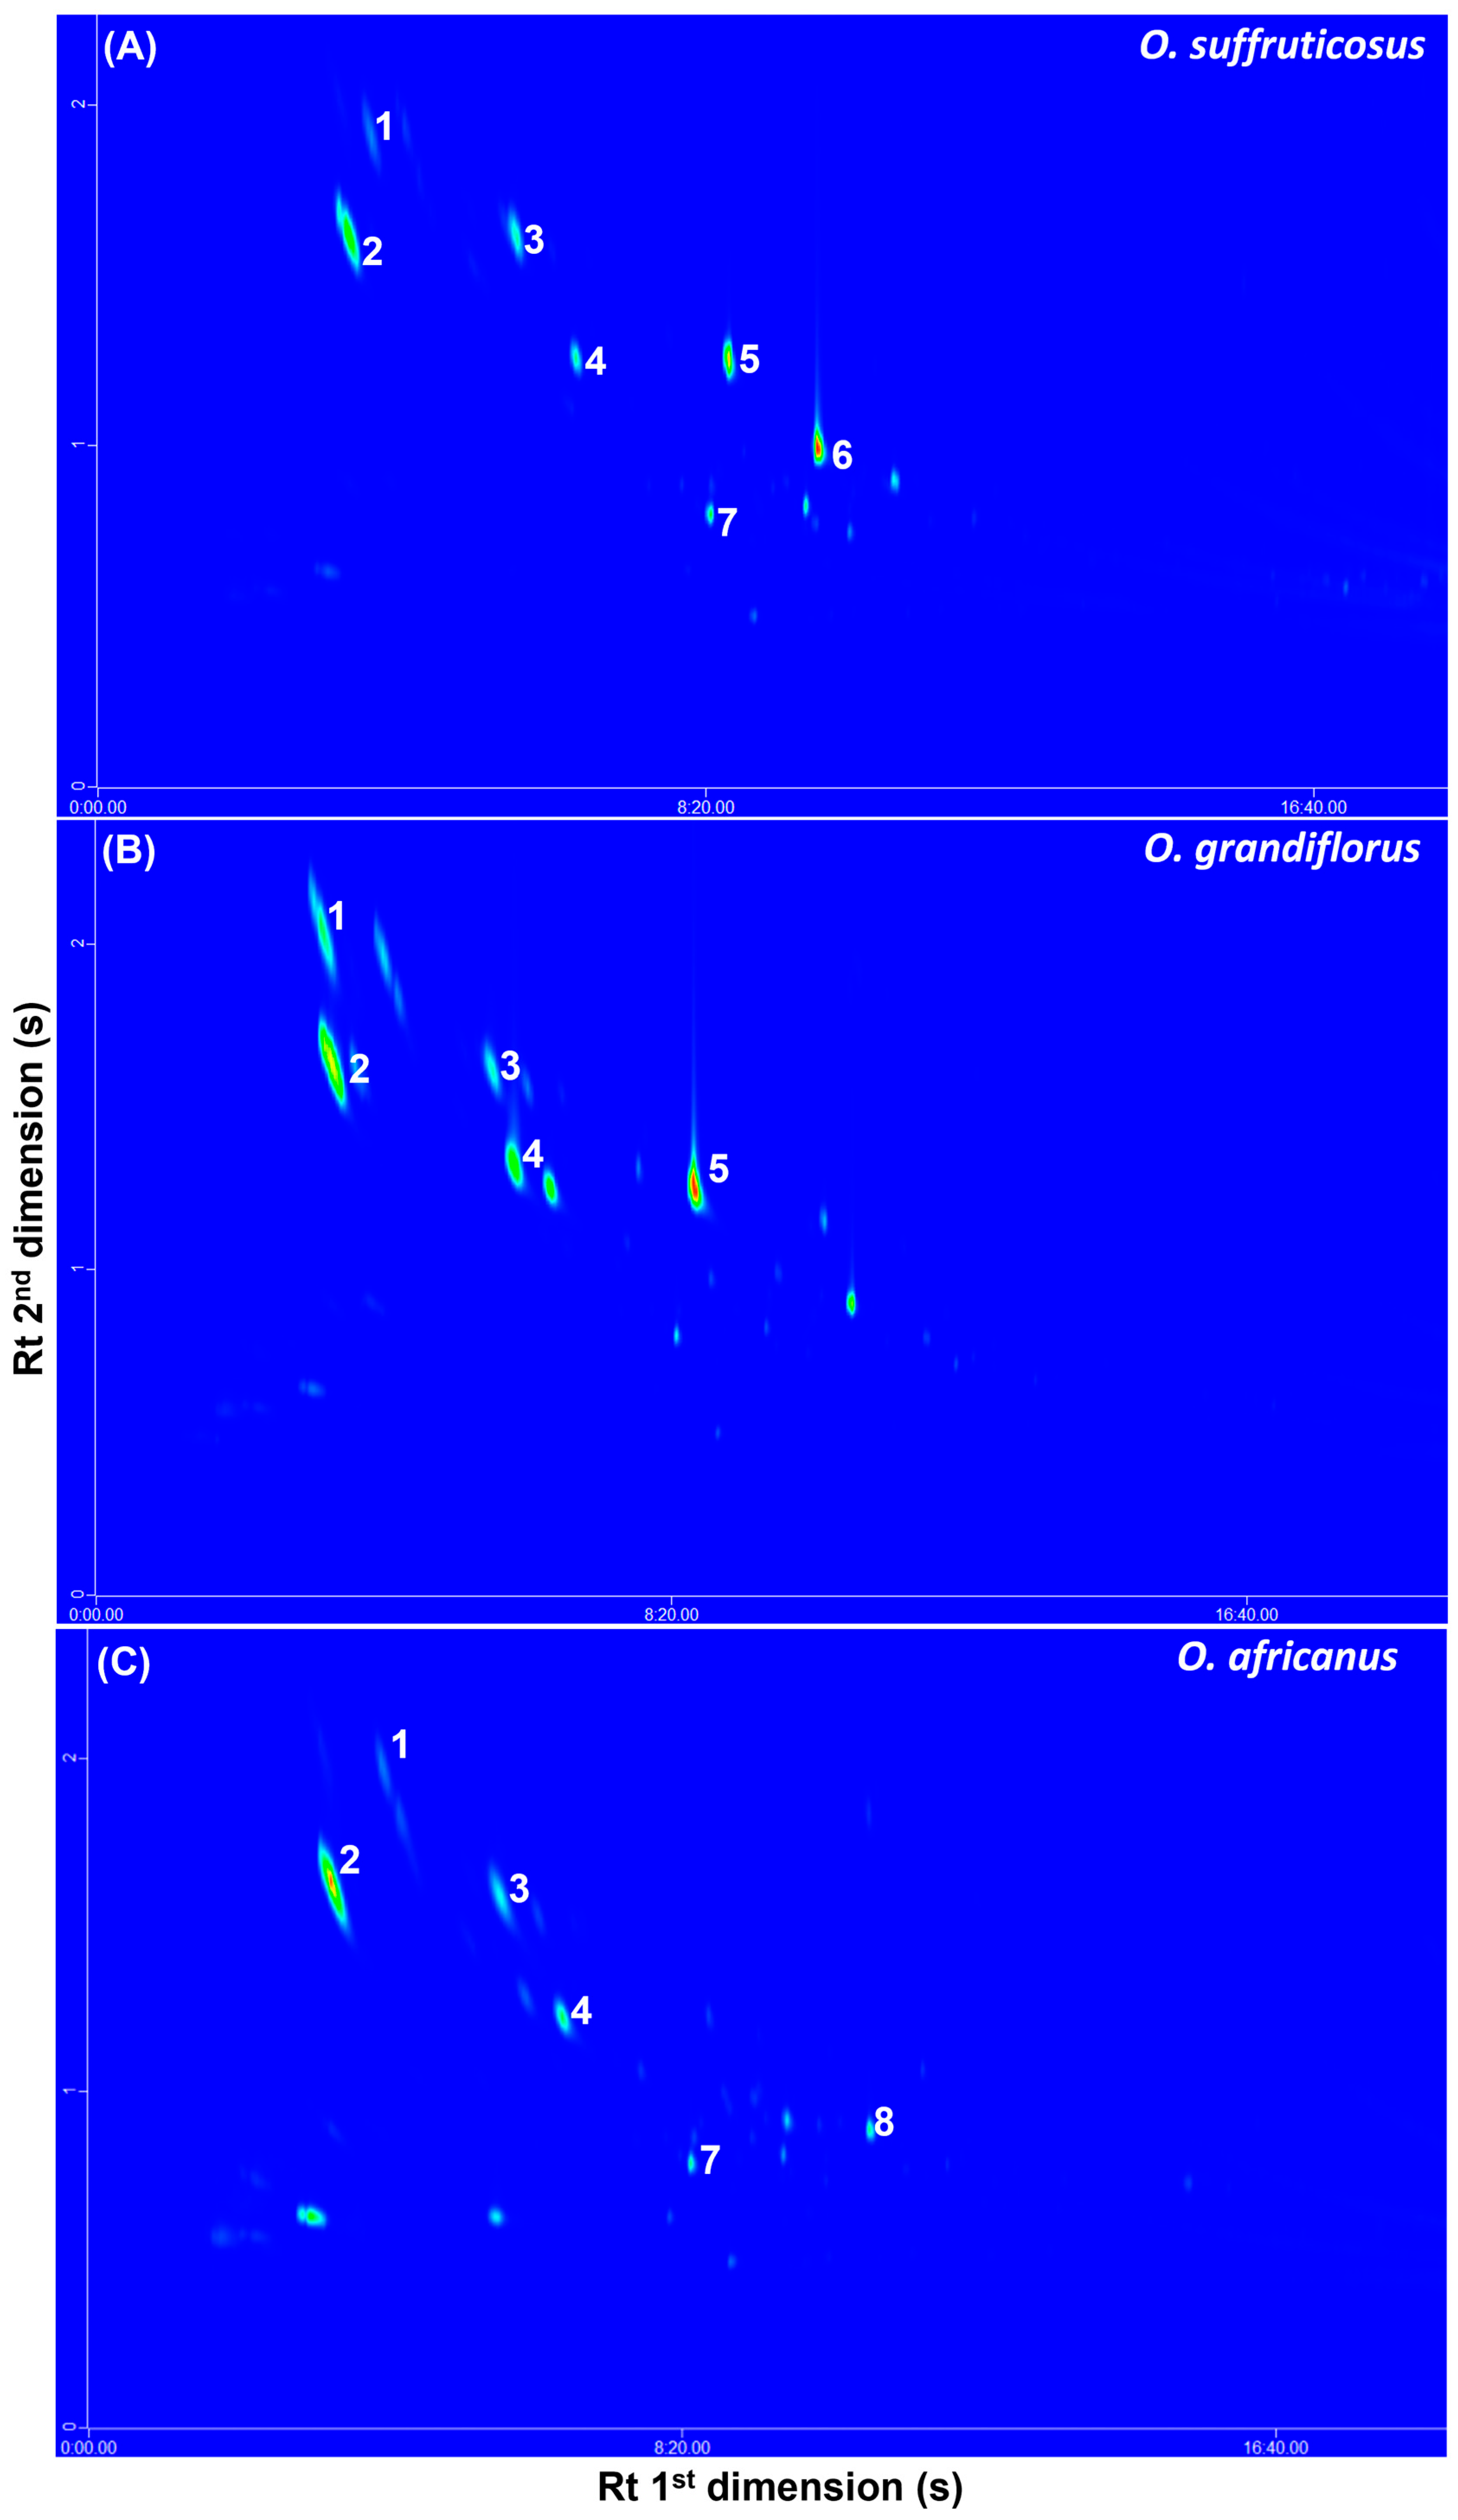
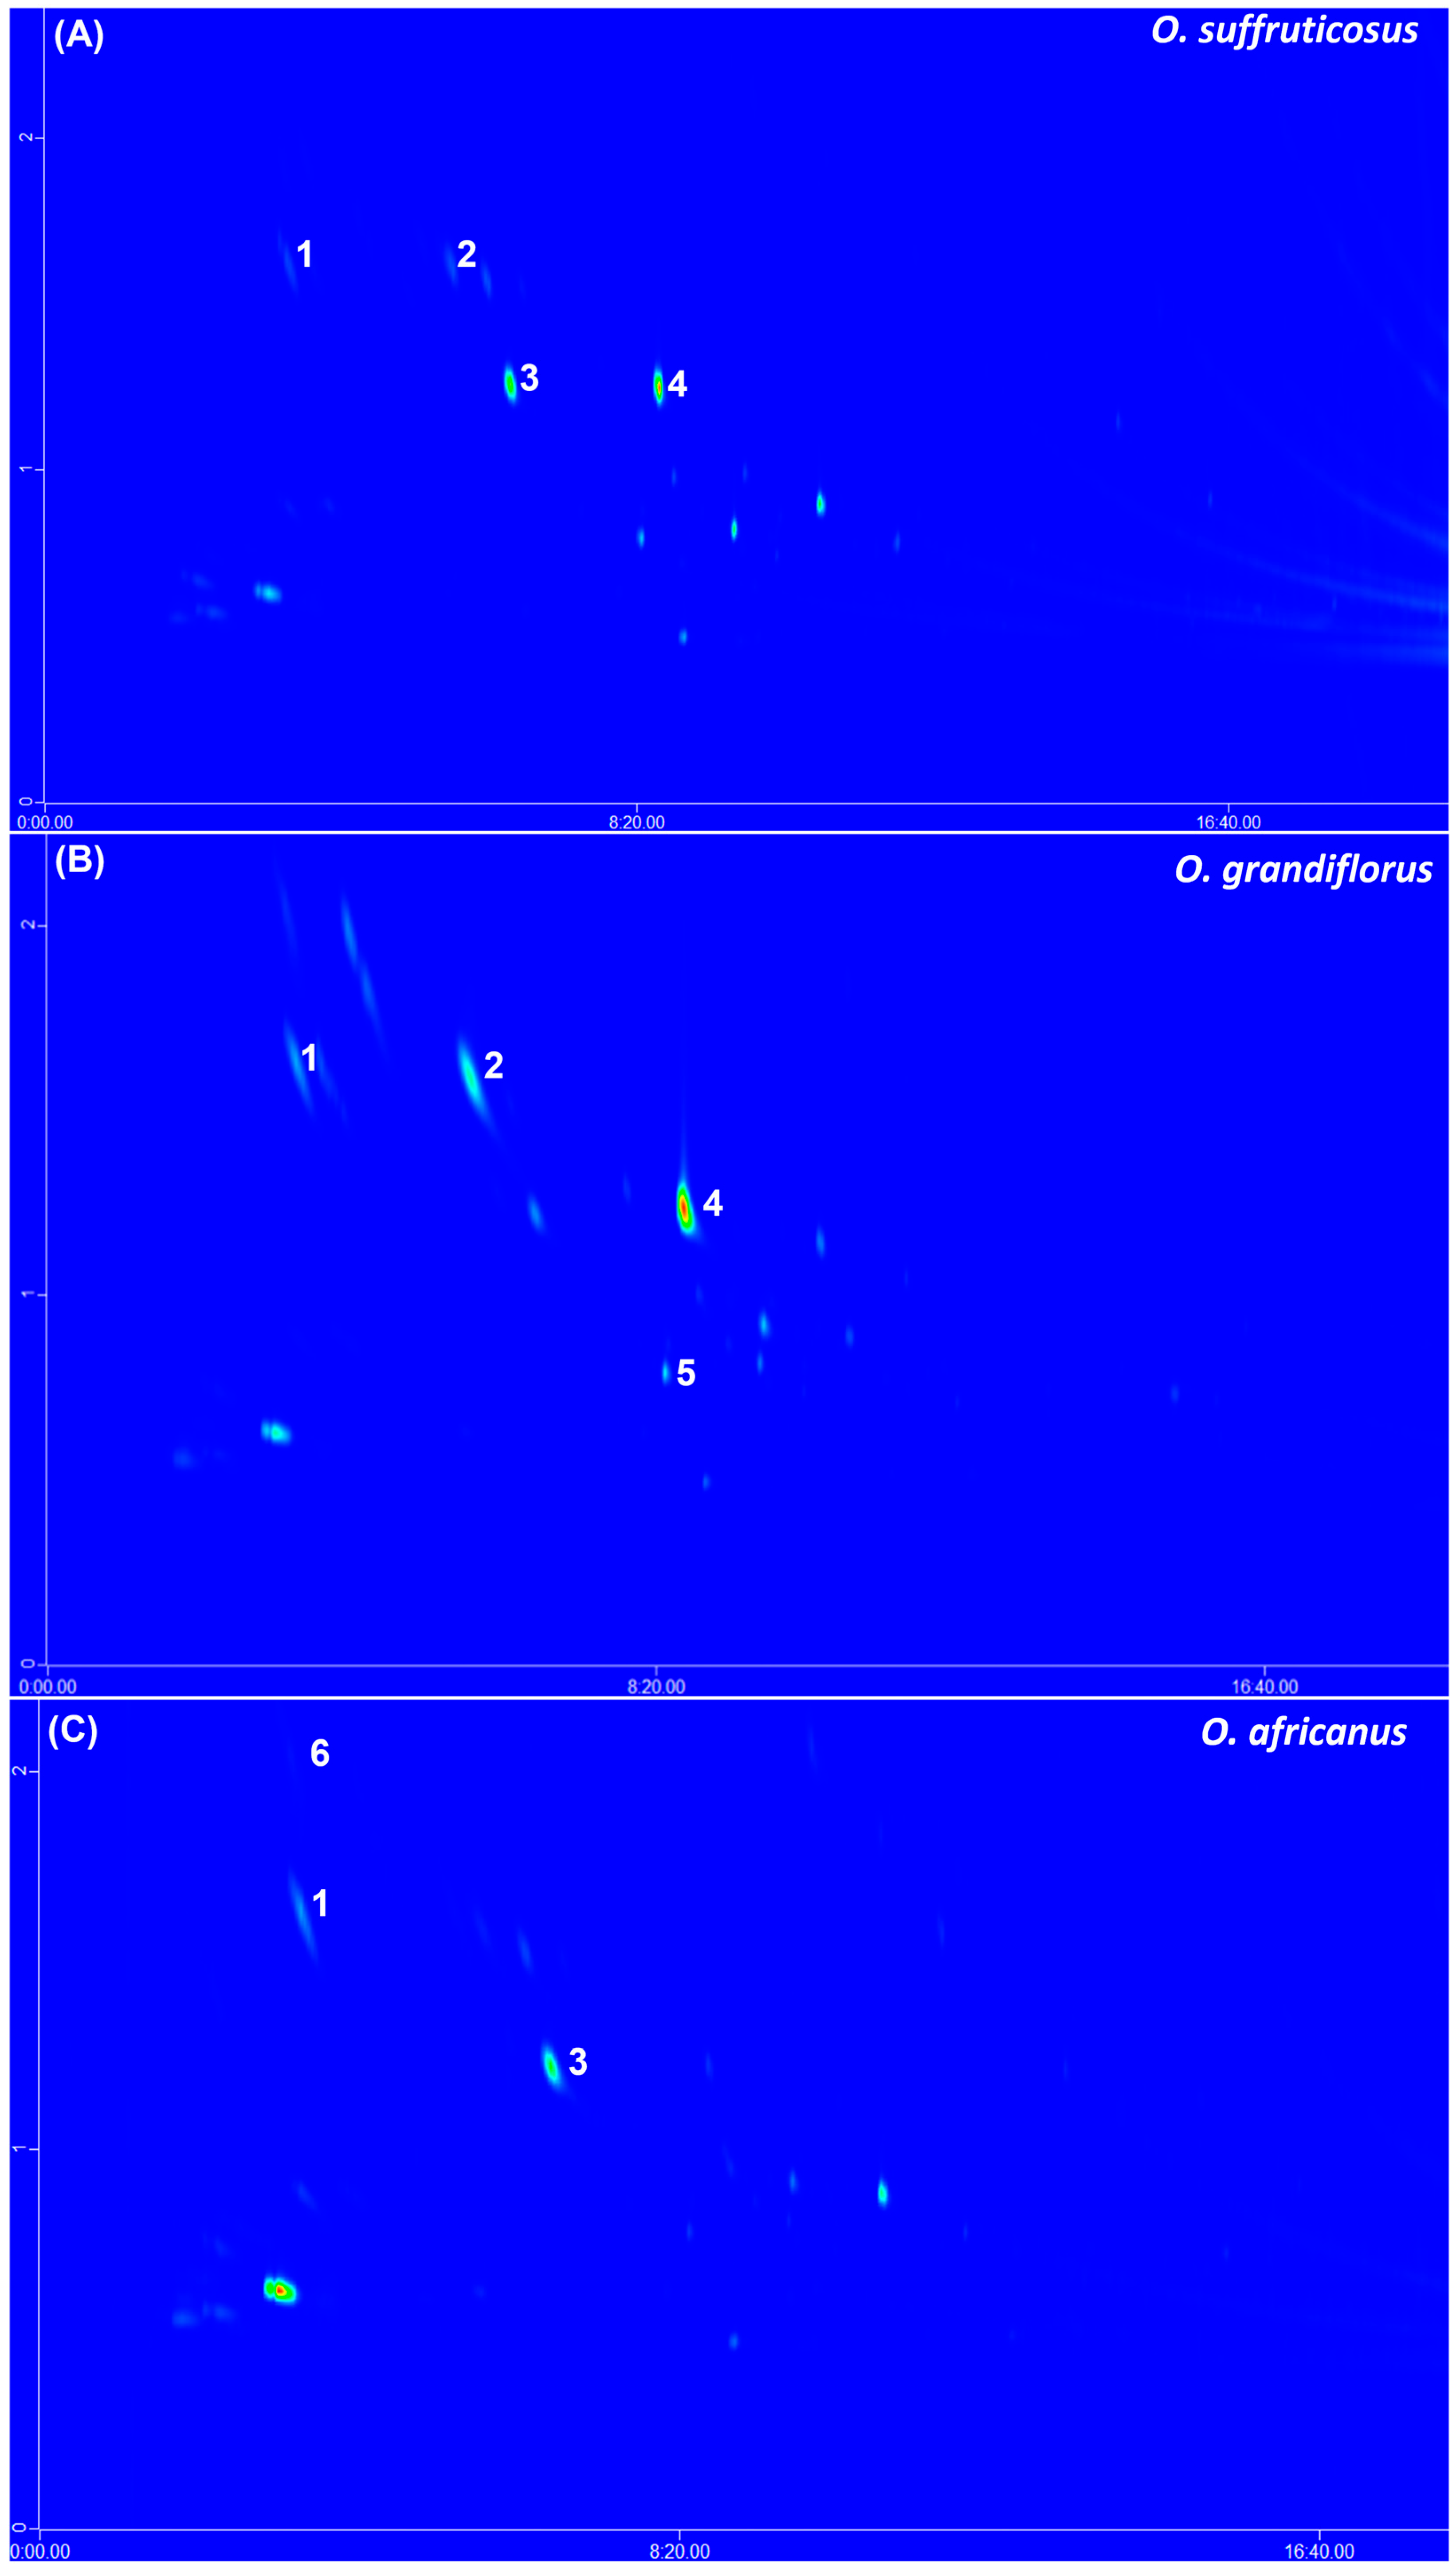
The GCxGC–ToF–MS detected approximately 56 volatile compounds in the three Oncosiphon species. The identified compounds belong to various classes, such as esters, aldehydes, aliphatic alcohols, monoterpene alcohols, monoterpene ketones, monoterpenes, and sesquiterpenes. Typical GCxGC–MS contour plots of the flower volatiles of the three species are indicated in Figure 8. Some of the major compounds such as α-pinene (1), α-ocimene (2), eucalyptol (1,8–cineole) (3), o-cymene (4), artemisia alcohol (5), and terpinen–4–ol (8) occurred across the three species, although variation in the band intensities could be observed. The percentage peak areas of all the compounds in the flowers (≥0.2%) were determined and are listed in Table 6. The major compounds in the flower volatiles of O. africanus were identified as α-ocimene (42.1%) and eucalyptol (10.1%), each representing >10% of the total composition. These compounds were also present in other species and none of the identified compounds were found to be unique to O. africanus. The O. grandiflorus profile showed major compounds, including 2–methyl–2–octen–4–ol (26.3%), artemisia triene (20.3%), artemisia alcohol (15.3%) and α-ocimene (15.9%), and the marker compounds unique to this species were verbenyl acetate, cis–verbenol, chrysanthenone and α–farnesene. Oncosiphon suffruticosus consisted of 2,4,6–trimethyl–1,3,6–heptatriene (25.1%), artemisia triene (14.6%), linalyl o–aminobenzoate (13.6%) and artemisia alcohol (11.9%) as the major compounds; however, the unique compounds were identified as methacrolein (2.9%), sabinene (4.7%), santolina triene (3.2%), camphene (5.0%), hexanal (2.7%), 1–octen–3–ol (0.3%), bicyclo [2.2.2] octa–2,5–diene, 1,2,3,6–tetramethyl (7.9%), linalool (4.6%), transγ–caryophyllene (0.9%), lavender lactone (0.4%), endo–borneol (0.9%), p–cymen–8–ol (0.4%) and 8–hydroxycarvotanacetone (1.4%).

2.4.2. The Headspace Profiles of the Volatile Compounds in Stems and Leaves

The headspace volatiles of the stems and leaves displayed a similar pattern to that observed for the flowers. The representative contour plots show the major compounds to be α-ocimene (1), eucalyptol (2), o-cymene (3), artemisia alcohol (4), and yomogi alcohol (5), which quantitatively varied between the three species (Figure 9). A comparison of the percentage peak areas of all 50 compounds detected in the stems and leaves is provided in Table 7. The major compound constituting at least 10% of the total composition in O. africanus was o-cymene (10.3%). This is different from the flowers, where α-ocimene (42.1%) and eucalyptol (10.1%) occurred in relatively higher concentrations (Table 6). In O. grandiflorus, the main components in the stems and leaves included artemisia triene (20.2%), tetraethylene glycol (17.3%), and α-ocimene (10.1%). Artemisia triene (20.3%) and α-ocimene (15.9%) were also reported as major constituents of the flower volatiles of O. grandiflorus, although the flowers were composed of other compounds in higher quantities (Table 6). The stems and leaves of O. suffruticosus contained artemisia triene (25.9%), camphor (10.4%), and linalyl o–aminobenzoate (11.8%) as major constituents. Similarly, the flowers exhibited artemisia triene (14.6%) and linalyl o–aminobenzoate (13.6%) as dominant components. In addition, the flowers contained two other prominent compounds, 2,4,6–trimethyl–1,3,6–heptatriene (25.1%) and artemisia alcohol (11.9%), which were present only in trace amounts in the stems and leaves (Table 6).

3. Discussion

A few studies have reported on the phytochemical profiles of Oncosiphon species, with existing reports focusing primarily on O. piluliferus and O. suffruticosus [8,9]. The present study provides the first comprehensive phytochemical profiles of the non-volatile and volatile constituents of O. africanus, O. grandiflorus, and O. suffruticosus. The HPTLC flower profiles revealed significant interspecies differences, while intraspecies variation was minimal, suggesting that the chemical composition within each species remains largely conserved. A visual inspection of the HPTLC profiles indicated that these differences were predominantly quantitative rather than qualitative; the species shared similar compounds such as kaempferide but in varying quantities. The HPTLC fingerprinting analysis also provided an initial visual comparison of the non-volatile constituents, indicating that O. grandiflorus and O. africanus share relatively similar chemical profiles. Among the three species, O. suffruticosus exhibited a distinct chemical profile, particularly in the flowers. The presence of more intense bands for phenolic and flavonoid compounds in O. suffruticosus suggests that these compounds may be present in higher levels compared to the other two species. Similarly, the HPTLC profiles of stems and leaves revealed quantitative differences in phenolic and terpenoid compounds, with minimal qualitative variation observed within or between species. The use of HPTLC as a complementary tool has proven to be an effective approach for species identification, authentication, and quality control in medicinal plant research. Several studies have successfully used HPTLC as a complementary tool to UPLC–MS to differentiate closely related species. Rubegeta et al. [35] employed HPTLC in combination with UPLC–MS to successfully distinguish Prunus africanus samples collected from Cameroon, the Democratic Republic of Congo (DRC), and Zimbabwe.
The LC–MS results revealed that the flowers, stems, and leaves of O. africanus, O. grandiflorus, and O. suffruticosus have several compounds in common; however, these differed quantitatively. In this study, LC–MS served as the primary technique for metabolite annotation and enabled the tentative identification of several classes of non-volatile constituents. Several identified compounds, including amino acids, phenolic acids, flavonoids, sesquiterpene lactones, and fatty acid derivatives, have not been previously documented in the literature, making this study the first to report on the non-volatile compounds present in these three Oncosiphon species. Chemometric analysis of the UPLC–MS dataset revealed that the flowers of O. suffruticosus exhibited distinct chemical differences compared to O. grandiflorus and O. africanus. Conversely, some overlap was observed between stems and leaves of O. suffruticosus and O. grandiflorus, suggesting a degree of chemical similarity in these plant parts. The analysis also identified unique marker compounds responsible for species differentiation, including eupalitin, methyl quercetin, and isorhamnetin-3-O-glucoside, which could be used to authenticate Oncosiphon species and prevent misidentification. Overall, the variation studies confirmed chemical differences among O. africanus, O. grandiflorus, and O. suffruticosus, indicating that these species cannot be used interchangeably for medicinal applications. The integration of UPLC–MS and chemometric techniques has proven to be a powerful approach for species identification, authentication, and quality control in medicinal plant research.
Headspace volatiles of the three species were found to have several compounds in common, with quantitative differences being more evident. Analysis of the headspace fraction using GC–MS demonstrated that the floral volatiles are dominated by α-pinene, α-ocimene, eucalyptol, o-cymene, and artemisia alcohol, while stems and leaves are primarily characterised by α-ocimene, eucalyptol, and yomogi alcohol. Visual inspection of the 2D–GC contour plots of the species also revealed the presence of quantitative variation within each species. The major compounds (>10%) identified in the plant parts of the three species were mostly terpenes and terpenoids, including o-cymene, α-ocimene, artemisia triene, artemisia alcohol, eucalyptol, and camphor. Terpenes and terpenoids are known for their biological activities, such as antimicrobial, anti-inflammatory, anticancer, and analgesic effects [36]. It is interesting to note that the majority of compounds were detected in the headspace of O. suffruticosus (46), followed by O. grandiflorus (32), while the lowest number was detected in O. africanus headspace (21). More detailed analysis using GC×GC–MS further showed that O. suffruticosus possesses a more complex headspace profile containing additional monoterpenes such as sabinene and camphene. The flowers of O. suffruticosus also showed additional major constituents that were absent in the stems and leaves.
Oncosiphon suffruticosus is the only species where the volatile constituents have been previously reported. Adewinogo et al. [9] used GC–MS to investigate the essential oil composition of O. suffruticosus, and identified 16 constituents, in which camphor (31.2%), filifolone (14.0%), chrysanthenone (8.7%), eucalyptol (7.9%), and terpinen–4–ol (7.4%) were reported as major compounds. Their results also highlighted that hydrocarbons and oxygenated monoterpenes were major constituents accounting for 84.64% total composition, with oxygenated monoterpenes being the most abundant at 76.49%. The findings of Adewinogo et al. [9] closely align with the present study, which also identified hydrocarbons and oxygenated monoterpenes as the predominant compounds in the volatile profiles of the three Oncosiphon species. Additionally, their study reported eucalyptol and camphor as major constituents in O. suffruticosus, which is consistent with our results to some extent, where eucalyptol and camphor were also among the key volatiles identified through headspace analysis. Although one cannot directly compare the headspace data and the essential oil profiles, the headspace technique provides a better representation of the volatiles present in a sample.
While the three species exhibited similar volatile profiles in varying concentrations, the profile of O. suffruticosus was notably more complex, with 46 compounds identified. This complexity was further confirmed by complementary techniques such as HPTLC and LC–MS, which also highlighted significant quantitative differences among the species, particularly in the flowers of O. suffruticosus. Although these analytical techniques target different chemical fractions and rely on distinct separation and detection principles, their combined interpretation provides consistent evidence of species differentiation. Specifically, the HPTLC fingerprinting together with UPLC–MS chemometric analysis supports closer chemical relatedness between O. grandiflorus and O. africanus, while LC–MS and GC–MS analyses demonstrate that the phytochemical distinction of O. suffruticosus is reflected in both non-volatile and volatile metabolite profiles, indicating that chemical variation among these species occurs across multiple phytochemical classes.

4. Materials and Methods

4.1. Plant Material Collection

The three Oncosiphon species (O. suffruticosus n = 28, O. grandiflorus n = 16, and O. africanus n = 4) were collected during October and November in 2020, from various locations in the Western Cape Province of South Africa (Table 8). A plant collection permit was issued by Cape Nature under permit number CN35–28–17308, and taxonomic verification of the plants was done by a botanist (Prof. John Manning, SANBI). The plants were delivered to the Department of Pharmaceutical Sciences at the Tshwane University of Technology (TUT), where voucher specimens and retention samples are kept.

4.2. Plant Material Preparation

The aerial parts of the plants were air-dried at room temperature. Stems and leaves (SL) were separated from the flowers (F) and ground separately into fine powders using a household blender. Randomly selected powdered samples (SL and F) were extracted with methanol: chloroform (1:1, v/v) (Merck (Pty) Ltd., Johannesburg, South Africa). Each sample (1.00 g) was weighed into a conical flask and extracted with a 10.0 mL volume of the solvent. The flasks were sealed with parafilm and sonicated in an ultrasonic bath (LIBM8, Labcon®, Krugersdorp, South Africa) for 20 min. The sonicated samples were filtered through Whatman No. 1 filter paper into pre-weighed conical flasks. The remaining residue was re-suspended in fresh solvent, and the extraction procedure was repeated twice. The filtrates from the three extractions were pooled and evaporated to dryness using a rotary evaporator at 40 °C (Büchi® Rotavapor R–215, Flawil, Switzerland). The samples were further dried using a Genevac® centrifugal evaporator (Genevac®, Ipswich, United Kingdom) and stored at 4 °C until further analysis.

4.3. High-Performance Thin Layer Chromatography Analysis

The crude extracts were dissolved in UHPLC-grade methanol (ROMIL–UpSTM, Johannesburg, South Africa) to a concentration of 10 mg/mL and analysed on a semi-automated high-performance thin layer chromatography system (CAMAG, Muttenz, Switzerland). The system comprised an automatic TLC sampler 4 (ATS4) attached to a nitrogen line, an automatic developing chamber (ADC 2), derivatiser, TLC plate heater (III), visualiser, and documentation device (visualiser 2). Each extract (10.0 mg/mL) was applied in 4 μL volume as 6 mm bands onto HPTLC silica gel 60 F254 (20 × 10 cm) plates (Merck (Pty) Ltd., Johannesburg, South Africa) using an autosampler. The bands were positioned at a 10 mm distance from the bottom edge of the plate. Two mobile phases were used for optimum separation on two different plates: solvent system I—toluene: ethyl acetate: formic acid (60:40:1, v/v/v) and solvent system II—ethyl acetate: formic acid: water (100:10:10, v/v/v). The plates were then developed separately in a chamber pre-saturated with each mobile phase for 20 min at 23 ± 2 °C and 40% relative humidity, allowing the solvent to migrate up to 80 mm. The plates were air-dried for 5 min, and then evenly sprayed with derivatising reagents. The anisaldehyde reagent was sprayed on the plate developed using solvent system I, and the natural product (NP) reagent was sprayed on the plate developed using solvent system II. Anisaldehyde reagent was prepared by mixing 85 mL methanol, 10 mL acetic acid, 5 mL sulfuric acid, and 0.5 mL p–anisaldehyde (Merck (Pty) Ltd., Johannesburg, South Africa), and the NP reagent was prepared by dissolving 1 g of diphenylboric acid–β–ethylamino ester (Sigma– Aldrich®, Johannesburg, South Africa) in 200 mL of ethyl acetate (Merck (Pty) Ltd., Johannesburg, South Africa), and mixing in equal parts with a polyethylene glycol solution prepared by dissolving 1 g of polyethylene glycol–6000 (Sigma–Aldrich®, Johannesburg, South Africa) in 200 mL of dichloromethane. VisionCATS 2.5 software was used to operate the instrument, visualise the data, and capture the images [37].
To identify the bands, a separate set of HPTLC plates was developed and visualised. Omitting the derivatisation step, the most intense bands were marked with circles using a pencil, and bands of the same Rf values were scraped off the silica gel plates using a spatula, pooled into a test tube, and dissolved in UHPLC-grade methanol. The mixtures were filtered through a 0.2 μm syringe filter and injected into UHPLC–MS for analysis as described in Section 4.5. Tentative identification of the compounds was carried out using mass spectral fragmentation patterns, molecular formula based on accurate mass, and the PubChem database (https://pubchem.ncbi.nlm.nih.gov, accessed on 22 January 2025).

4.4. Liquid Chromatography Quadrupole Time-of-Flight Mass Spectrometry (LC–QToF–MS) for Tentative Identification

The crude extracts (20 mg) were dissolved in 1.0 mL of methanol (Millipore, Bedford, MA, USA), sonicated for 10 min, and then centrifuged for 15 min at 5000 rpm. The supernatant was collected, filtered through a 0.22 µm syringe filter, and then injected (2 µL) into an Agilent liquid chromatographic system (Agilent 1290 series) coupled to 6530 Agilent Accurate–Mass Q–TOF LC/MS with an electrospray ionisation (ESI) interface. The chromatographic separation was achieved on an Agilent SB C8 column (2.1 × 100 mm, 1.8 µm) maintained at 40 °C. The mobile phase consisted of water with 0.1% formic acid (solvent A) and acetonitrile with 0.1% formic acid (solvent B), at a flow rate of 0.23 mL/min. The gradient elution of 10% B to 45% B for 15 min, and in the next 5 min to 100% B was used. The mass spectrometry analysis was performed using the following parameters: drying gas (N2) flow rate at 11.0 L/min, temperature at 325 °C, nebulizer at 30 psig, sheath gas temperature at 300 °C, sheath gas flow at 11 L/min, capillary voltage of 3500 V, skimmer at 65 V, Oct RF voltage at 750 V and fragmentor voltage of 125 V. The sample collision energy was set at 40 eV. Agilent MassHunter Acquisition Software controlled the operations, acquisition, and analysis of the data. All data analysis was performed using MassHunter Qualitative Analysis Software Ver. B.07.00 in the mass range of 50–1700 Da. Each sample was analysed in both positive and negative ionisation modes. Accurate mass measurements were obtained using ion correction techniques with reference masses at m/z 121.0509 (protonated purine) and 922.0098 [protonated hexakis (1H, 1H, 3H–tetrafluoropropoxy) phosphazine or HP–921] in positive ion mode, while m/z 112.9856 (deprotonated trifluoroacetic acid–TFA) and 1033.9881 (TFA adducted HP–921) were used in the negative ion mode. The compounds were confirmed in each spectrum. For this purpose, the reference solution was introduced into the ESI source via a T–junction using an Agilent Series 1200 isocratic pump (Agilent Technologies, Santa Clara, CA, USA) with a 100:1 splitter set at a flow rate of 20 µL/min. DAD spectra were acquired over a scan range of 190–400 nm.

4.5. Ultra-Performance Liquid Chromatography–Mass Spectrometry Analysis for Chemometric Modelling

The crude extracts were dissolved in UPLC-grade methanol (ROMIL–UpSTM, Johannesburg, South Africa) to a concentration of 5.0 mg/mL, filtered through 0.22 µm filters, and injected (1.0 μL) into a Waters Acquity I-class UPLC system equipped with a PDA detector (Waters, Milford, MA, USA), in tandem with a mass spectrometer ( Xevo® G3 QToF) (Waters, Milford, MA, USA). The chromatographic conditions were optimised to achieve the best peak separation in the shortest run time. Separation was achieved on an Acquity UPLC BEH C18 column (150 mm × 2.1 mm, 1.7 μm particle size; Waters, Milford, MA, USA) maintained at 50 °C. The mobile phase consisted of 0.1% formic acid in water (Solvent A) and 0.1% formic acid in acetonitrile (Solvent B) at a flow rate of 0.3 mL/min. Gradient elution was executed as follows: the initial ratio was 85% A: 15% B, changed to 50% A: 50% B in 12.0 min, then to 5% A: 95% B in 1.0 min, and back to the initial ratio in 0.5 min. The system was equilibrated for 1.5 min, and the total run time was 15 min. The results obtained in negative electrospray ionisation mode were evaluated. Nitrogen was used as the desolvation gas at a flow rate of 600 L/h. The capillary voltage was set to 2450 V, and the sampling cone voltage was 36 V. A desolvation temperature of 450 °C and a source temperature of 100 °C were applied. Spectral scanning was carried out between 100 and 1500 m/z. The chromatographic software Masslynx v4.2 was used to capture and process all the chromatographic data. Tentative identification of the compounds was carried out using mass spectral fragmentation patterns, molecular formula based on accurate mass, and the PubChem database.

4.6. Two-Dimensional Gas Chromatography Coupled to Time-of-Flight and Mass Spectrometry Analysis

A fixed mass (0.50 g) of each powdered sample (SL and F) was weighed into a 20 mL headspace vial (Restek, Bellefonte, PA, USA) and directly analysed in duplicate using GCxGC–ToF–MS system. The analysis was performed on a Leco Pegasus 4D multidimensional GC system (Leco Africa (Pty) Ltd., Kempton Park, South Africa), equipped with a multi-purpose sampler (Gerstel, Mülheim an der Ruhr, Germany), which was operated in the headspace mode. The system comprised an Agilent 7890 gas chromatograph with a cryogenic thermal modulator and a secondary oven. A 30 m × 0.25 mm × 0.25 µm film thickness Stabilwax® polyethylene (Restek, Bellefonte, PA, USA) column served as the primary column, while the secondary column was a 0.790 m × 0.25 mm × 0.25 µm film thickness, Rxi®–5Sil MS capillary column (Restek, Bellefonte, PA, USA). The GCxGC–ToF–MS system was equipped with a 1000 µL gas syringe and a sampling tray with a 32-headspace vial capacity (20 mL; Restek, Bellefonte, PA, USA). After placing the powders in the vials, heat was applied at 50 °C with agitation for 15 min in a pre-heating module. A 1000 μL headspace volume was then collected from each vial and introduced into the GCxGC system, applying a 5:1 split ratio, with a front inlet septum purge flow of 3.0 mL/min, and a purge valve time of 60 s following the start of the run. The inlet temperature was maintained at 200 °C. Helium was used as the carrier gas at a constant flow rate of 1.5 mL/min. The primary column was programmed with an initial oven temperature of 40 °C held for 1 min, which was increased at 10 °C/min to 220 °C and held for 2 min. The secondary column temperature was initially held at 60 °C for 0.50 min, and then ramped at 10 °C/min to 240 °C and held for 2 min. The initial temperature of the thermal modulator was set at 80 °C for 1 min, then increased at 10 °C/min to 260 °C and held for 2 min. The total analysis time was 25 min. Both the front MS inlet and transfer line temperatures were held constant at 200 °C and 225 °C, respectively, while the ion source chamber was maintained at 200 °C. The mass spectrometer mass range was 45–550 m/z, with an acquisition rate of 100 spectra/s. Tentative identification of the compounds was performed by comparing MS spectra with the NIST 11 spectral library. Library similarity factors were determined for both forward and reverse searches. A match of ≥800 was required before the identification was assigned. A minimum signal-to-noise ratio (S/N) cut off >100 was used for data processing.

4.7. Chemometrics Data Analysis

The UPLC–MS data were pre-processed in MS–DIAL v4.9 software, which enables the analysis of the entire chromatographic peaks and mass spectra. The aligned data were then exported to SIMCA®–P+ 14.0 (Umetrics AB, Umeå, Sweden) software for chemometrics analysis. Principal component analysis (PCA) was applied to the pre-processed data to investigate possible clusters, groups, and trends as determined by the chemical composition of the samples in the principal component space (Granato et al. [38]). The PCA was constructed using the Pareto-scaling method, and a scores plot was evaluated for chemical relationships between the samples. Following PCA, orthogonal projections to latent structures–discriminant analysis (OPLS–DA) was applied to assess chemical variation between the three species, and to identify the chemical information related to these differences [11]. The samples were grouped into three classes according to species identity to generate a Y-variable representing the classification categories [39]. The OPLS–DA model was then constructed on Pareto-scaling data, separating the predictive X-data from variation in X that is not related to differentiating the species. The model was evaluated according to the number of principal components (A) (predictive + orthogonal), cumulative X-variation modelled from A components (R2Xcum), cumulative Y-variation modelled from A components (R2Ycum), and cumulative variation in X or Y that can be predicted by A components. The loadings plot was used to identify marker compounds responsible for the differences between the three species. To validate the predictive ability of the OPLS–DA model, external validation was carried out by predicting the identity of a new set of samples.

5. Conclusions

This study presents the first in-depth phytochemical profiling of three medicinally important Oncosiphon species, revealing distinct chemical differences in both the volatile and non-volatile constituents across the species and plant parts. Notably, O. suffruticosus exhibited the most chemically distinct profile, particularly the flowers, indicating its potential for greater medicinal value. These findings support the importance of species-specific phytochemical profiling for accurate identification, authentication, and quality control in medicinal plant research.

Author Contributions

Conceptualization, A.M.V.; methodology, T.R.M., W.C., G.P.P.K., M.S., E.N., B.A., K.K. and I.A.K.; software, T.R.M., M.S. and E.N.; validation, W.C., B.A., K.K. and I.A.K.; resources, A.M.V. and I.A.K.; data curation, T.R.M., M.S. G.P.P.K. and E.N.; writing—original draft preparation, T.R.M.; writing—review and editing, W.C., G.P.P.K., B.A., K.K., I.A.K., M.S. E.N. and A.M.V.; supervision, M.S., G.P.P.K. and A.M.V. project administration, A.M.V.; funding acquisition, A.M.V. All authors have read and agreed to the published version of the manuscript.

Funding

This research was funded by the National Research Foundation, grant number 86923, South African Medical Research Council, grant number 23015 and the Tshwane University of Technology.

Data Availability Statement

The raw data supporting the conclusions of this article will be made available by the authors on request.

Conflicts of Interest

The authors declare no conflicts of interest.

Abbreviations

The following abbreviations are used in this manuscript:
ESIElectrospray ionisation
GCxGC–ToF–MSTwo-dimensional gas chromatography coupled to time-of-flight and mass spectrometry
HCAHierarchical cluster analysis
HPTLCHigh-performance thin layer chromatography
MSMass spectrometry
OPLS-DAOrthogonal projection to latent structures-discriminant analysis
PCAPrincipal component analysis
PDAPhotodiode-array detector
QToFQuadrupole Time-of-Flight
R2XcumCumulative X-variation
R2YcumCumulative Y-variation
RfRetardation factor
SDStandard deviation
TUTTshwane University of Technology
UPLCUltra-performance liquid chromatography
v/vVolume per volume

References

  1. Mulholland, D.A. The future of ethnopharmacology: A southern African perspective. J. Ethnopharmacol. 2005, 100, 124–126. [Google Scholar] [CrossRef]
  2. Kolokoto, R.; Magee, A.R. Cape stinkweeds: Taxonomy of Oncosiphon (Anthemideae, Asteraceae). S. Afr. J. Bot. 2018, 117, 57–70. [Google Scholar] [CrossRef]
  3. Källersjö, M. A generic re-classification of Pentzia Thunb. (Compositae—Anthemideae) from southern Africa. Bot. J. Linn. Soc. 1988, 96, 299–322. [Google Scholar] [CrossRef]
  4. Watt, J.M.; Breyer–Brandwijk, M.G. The Medicinal and Poisonous Plants of Southern and Eastern Africa Being an Account of Their Medicinal and Other Uses, Chemical Composition, Pharmacological Effects and Toxicology in Man and Animal; E. & S. Linvingstone Ltd.: Edinburgh, UK, 1962; Volume 2. [Google Scholar]
  5. Van Wyk, B.E.; Oudtshoorn, B.V.; Gericke, N. Medicinal Plants of South Africa; Briza Publications: Pretoria, South Africa, 2009. [Google Scholar]
  6. Van Wyk, B.E.; Gericke, N. People’s Plants: A Guide to Useful Plants of Southern Africa; Briza Publications: Pretoria, South Africa, 2018. [Google Scholar]
  7. Van Wyk, B.E. A review of Khoi–San and Cape Dutch medical ethnobotany. J. Ethnopharmacol. 2008, 119, 331–341. [Google Scholar] [CrossRef]
  8. Pillay, P.; Vleggaar, R.; Maharaj, V.J.; Smith, P.J.; Lategan, C.A. Isolation and identification of antiplasmodial sesquiterpene lactones from Oncosiphon piluliferum. J. Ethnopharmacol. 2007, 112, 71–76. [Google Scholar] [CrossRef]
  9. Adewinogo, S.E.O.; Sharma, R.; Africa, C.W.; Marnewick, J.L.; Hussein, A.A. Chemical composition and cosmeceutical potential of the essential oil of Oncosiphon suffruticosum (L.) Källersjö. Plants 2021, 10, 1315. [Google Scholar] [CrossRef]
  10. Gad, H.A.; El-Ahmady, S.H.; Abou-Shoer, M.I.; Al-Azizi, M.M. Application of chemometrics in authentication of herbal medicines: A review. Phytochem. Anal. 2013, 24, 1–24. [Google Scholar] [CrossRef]
  11. Acharya, D.; Enslin, G.; Chen, W.; Sandasi, M.; Mavimbela, T.; Viljoen, A. A chemometric approach to the quality control of Sutherlandia (cancer bush). Biochem. Syst. Ecol. 2014, 56, 221–230. [Google Scholar] [CrossRef]
  12. Maree, J.E.; Viljoen, A.M. Phytochemical distinction between Pelargonium sidoides and Pelargonium reniforme—A quality control perspective. S. Afr. J. Bot. 2012, 82, 83–91. [Google Scholar] [CrossRef]
  13. Lim Ah Tock, M.; Chen, W.; Combrinck, S.; Sandasi, M.; Kamatou, G.P.P.; Viljoen, A.M. Exploring the phytochemical variation of non–volatile metabolites within three South African Salvia species using UPLC–MS fingerprinting and chemometric analysis. Fitoterapia 2021, 152, 104–940. [Google Scholar] [CrossRef] [PubMed]
  14. Mavimbela, T.; Viljoen, A.; Vermaak, I. Differentiating between Agathosma betulina and Agathosma crenulata–A quality control perspective. J. Appl. Res. Med. Aromat. Plants 2014, 1, e8–e14. [Google Scholar] [CrossRef]
  15. Mncwangi, N.P.; Viljoen, A.M.; Zhao, J.; Vermaak, I.; Chen, W.; Khan, I. What the devil is in your phytomedicine? Exploring species substitution in Harpagophytum through chemometric modeling of 1H-NMR and UHPLC-MS datasets. Phytochemistry 2014, 106, 104–115. [Google Scholar] [CrossRef]
  16. Wagner, H.; Bladt, S. Plant Drug Analysis: A Thin Layer Chromatography Atlas; Springer: Berlin/Heidelberg, Germany; New York, NY, USA, 1996. [Google Scholar]
  17. Zhang, P.; Chan, W.; Ang, I.L.; Wei, R.; Lam, M.M.T.; Lei, K.M.K.; Poon, T.C.W. Revisiting Fragmentation Reactions of Protonated α-Amino Acids by High-Resolution Electrospray Ionization Tandem Mass Spectrometry with Collision-Induced Dissociation. Sci. Rep. 2019, 9, 6453. [Google Scholar] [CrossRef]
  18. Avula, B.; Katragunta, K.; Parveen, I.; Tatapudi, K.K.; Chittiboyina, A.G.; Wang, Y.-H.; Khan, I.A. Comprehensive Profiling of Free Proteinogenic and Non-Proteinogenic Amino Acids in Common Legumes Using LC-QToF: Targeted and Non-Targeted Approaches. Foods 2025, 14, 611. [Google Scholar] [CrossRef]
  19. Avula, B.; Katragunta, K.; Tatapudi, K.K.; Wang, Y.-H.; Ali, Z.; Chittiboyina, A.G.; Khan, I.A. Phytochemical analysis of phenolics and diterpene lactones in Andrographis paniculata plant samples and dietary supplements. J. Pharm. Biomed. Anal. 2025, 262, 116866. [Google Scholar] [CrossRef]
  20. Jaiswal, R.; Müller, H.; Müller, A.; Karar, M.G.E.; Kuhnert, N. Identification and characterization of chlorogenic acids, chlorogenic acid glycosides and flavonoids from Lonicera henryi L. (Caprifoliaceae) leaves by LC–MSn. Phytochemistry 2014, 108, 252–263. [Google Scholar] [CrossRef] [PubMed]
  21. Parejo, I.; Jauregui, O.; Sánchez-Rabaneda, F.; Viladomat, F.; Bastida, J.; Codina, C. Separation and Characterization of Phenolic Compounds in Fennel (Foeniculum vulgare) Using Liquid Chromatography−Negative Electrospray Ionization Tandem Mass Spectrometry. J. Agric. Food Chem. 2004, 52, 3679–3687. [Google Scholar] [CrossRef] [PubMed]
  22. Jiang, C.; Gates, P.J. Systematic Characterisation of the Fragmentation of Flavonoids Using High-Resolution Accurate Mass Electrospray Tandem Mass Spectrometry. Molecules 2024, 29, 5246. [Google Scholar] [CrossRef] [PubMed]
  23. Yang, P.; Xu, F.; Li, H.-F.; Wang, Y.; Li, F.-C.; Shang, M.-Y.; Liu, G.-X.; Wang, X.; Cai, S.-Q. Detection of 191 Taxifolin Metabolites and Their Distribution in Rats Using HPLC-ESI-IT-TOF-MSn. Molecules 2016, 21, 1209. [Google Scholar] [CrossRef]
  24. Avula, B.; Bae, J.-Y.; Chittiboyina, A.G.; Wang, Y.-H.; Wang, M.; Srivedavyasasri, R.; Ali, Z.; Li, J.; Wu, C.; Khan, I.A. Comparative analysis of five Salvia species using LC-DAD-QToF. J. Pharm. Biomed. Anal. 2022, 209, 114520. [Google Scholar] [CrossRef]
  25. Fu, F.; Wang, H.L. Metabolomics reveals consistency of the shoot system in Medicago truncatula by HPLC-UV-ESI-MS/MS. Int. J. Food Sci. Technol. 2015, 50, 2183–2192. [Google Scholar] [CrossRef]
  26. Rösch, D.; Krumbein, A.; Mügge, C.; Kroh, L.W. Structural Investigations of Flavonol Glycosides from Sea Buckthorn (Hippophaë rhamnoides) Pomace by NMR Spectroscopy and HPLC-ESI-MSn. J. Agric. Food Chem. 2004, 52, 4039–4046. [Google Scholar] [CrossRef] [PubMed]
  27. Kumar, S.; Singh, A.; Singh, B.; Maurya, R.; Kumar, B. Structural characterization and quantitative determination of bioactive compounds in ethanolic extracts of Boerhaavia diffusa L. by liquid chromatography with tandem mass spectrometry. Sep. Sci. Plus 2018, 1, 588–596. [Google Scholar] [CrossRef]
  28. Bicchi, C.; Rubiolo, P. High-performance liquid chromatographic-particle beam mass spectrometric analysis of sesquiterpene lactones with different carbon skeletons. J. Chromatogr. A 1996, 727, 211–221. [Google Scholar] [CrossRef]
  29. Avula, B.; Katragunta, K.; Wang, Y.-H.; Ali, Z.; Khan, I.A. Simultaneous determination and characterization of flavonoids, sesquiterpene lactone, and other phenolics from Centaurea benedicta and dietary supplements using UHPLC-PDA-MS and LC-DAD-QToF. J. Pharm. Biomed. Anal. 2022, 216, 114806. [Google Scholar] [CrossRef]
  30. Peng, Z.; Wang, Y.; Gu, X.; Guo, X.; Yan, C. Study on the pharmacokinetics and metabolism of costunolide and dehydrocostus lactone in rats by HPLC-UV and UPLC-Q-TOF/MS. Biomed. Chromatogr. 2014, 28, 1325–1334. [Google Scholar] [CrossRef]
  31. Reznicek, G.; Kastner, U.; Glasl, S. Electron Impact- and Chemical Ionization-Mass Spectrometry of Naturally Occurring Sesquiterpene Lactones from Achillea spp. Phytochem. Anal. 1997, 8, 9–13. [Google Scholar]
  32. Fang, C.; Zhuang, X.; Li, Z.; Zou, Y.; Pu, J.; Wang, D.; Xu, Y. LC-MS/MS-Based Determination and Optimization of Linoleic Acid Oxides in Baijiu and Their Variation with Storage Time. Metabolites 2025, 15, 246. [Google Scholar] [CrossRef]
  33. Yuan, Z.-X.; Rapoport, S.I.; Soldin, S.J.; Remaley, A.T.; Taha, A.Y.; Kellom, M.; Gu, J.; Sampson, M.; Ramsden, C.E. Identification and profiling of targeted oxidized linoleic acid metabolites in rat plasma by quadrupole time-of-flight mass spectrometry. Biomed. Chromatogr. 2013, 27, 422–432. [Google Scholar] [CrossRef]
  34. Lohani, H.; Kumar, A.; Bidarakundi, V.; Agrawal, L.; Haider, S.Z.; Chauhan, N.K. Identification of Fatty Acids, Amides and Cinnamic Acid Derivatives in Supercritical-CO2 Extracts of Cinnamomum tamala Leaves Using UPLC-Q-TOF-MSE Combined with Chemometrics. Molecules 2024, 29, 3760. [Google Scholar] [CrossRef] [PubMed]
  35. Rubegeta, E.; Makolo, F.; Kamatou, G.; Chen, W.; Tankeu, S.; Anokwuru, C.; Saroja, S.G.; Zhao, J.; Khan, I.A.; Tock, M.L.A.; et al. Exploring the chemogeographical variation of a commercially important medicinal tree (Prunus africana (Hook. f.) Kalkman) using a metabolomics approach. J. Appl. Res. Med. Aromat. Plants 2024, 42, 100568. [Google Scholar] [CrossRef]
  36. Masyita, A.; Sari, R.M.; Astuti, A.D.; Yasir, B.; Rumata, N.R.; Emran, T.B.; Nainu, F.; Simal–Gandara, J. Terpenes and terpenoids as main bioactive compounds of essential oils, their roles in human health and potential application as natural food preservatives. Food Chem. 2022, 13, 100217. [Google Scholar] [CrossRef]
  37. Vermaak, I.; Hamman, J.H.; Viljoen, A.M. A rapid spectroscopic method for quantification of P57 in Hoodia gordonii raw material. Food Chem. 2010, 120, 940–944. [Google Scholar] [CrossRef]
  38. Granato, D.; Santos, J.S.; Escher, G.B.; Ferreira, B.L.; Maggio, R.M. Use of principal component analysis (PCA) and hierarchical cluster analysis (HCA) for multivariate association between bioactive compounds and functional properties in foods: A critical perspective. Trends Food Sci. Technol. 2018, 72, 83–90. [Google Scholar] [CrossRef]
  39. Zhao, J.; Khan, I.A.; Combrinck, S.; Sandasi, M.; Chen, W.; Viljoen, A.M. 1H-NMR and UPLC-MS metabolomics: Functional tools for exploring chemotypic variation in Sceletium tortuosum from two provinces in South Africa. Phytochemistry. 2018, 152, 191–203. [Google Scholar] [CrossRef] [PubMed]
Figure 1. The HPTLC fingerprints of Oncosiphon flowers after derivatisation with (A) anisaldehyde and viewed under white light and (B) natural products reagent and viewed at 366 nm.
Plants 15 01047 g001
Figure 2. The HPTLC fingerprints of Oncosiphon stems and leaves after derivatisation with (A) anisaldehyde and viewed under white light and (B) natural products reagent and viewed at 366 nm.
Plants 15 01047 g002
Figure 3. LC-DAD chromatograms of Oncosiphon species (flower and leaf extracts) at 254 nm and 280 nm (high-intensity peaks were labelled).
Plants 15 01047 g003
Figure 4. (A) PCA scores scatter plot of Oncosiphon flowers (B) an OPLS–DA scores plot indicating three separate clusters corresponding to the three Oncosiphon species, (C) the loadings plot derived from OPLS–DA analysis, indicating variables (marker compounds) corresponding to each species and (D) a prediction scores scatter plot showing correct identification of validation samples.
Plants 15 01047 g004
Figure 5. Representative UPLC–MS chromatograms of Oncosiphon flowers indicating the presence of chemical markers that distinguish the three species: O. africanus (pink), O. grandiflorus (blue), and O. suffruticosus (red) as revealed in the OPLS–DA loadings plot.
Plants 15 01047 g005
Figure 6. (A) PCA scores scatter plot of Oncosiphon stems and leaves (B) an OPLS–DA scores plot indicating three separate clusters corresponding to the three Oncosiphon species, (C) the loadings plot derived from OPLS–DA analysis, indicating variables (marker compounds) corresponding to each species and (D) a prediction scores scatter plot showing correct identification of validation samples.
Plants 15 01047 g006
Figure 7. Representative UPLC-MS chromatograms of Oncosiphon stems and leaves indicating the presence of chemical markers that distinguish the three species: O. africanus (pink), O. grandiflorus (blue), and O. suffruticosus (red) as revealed in the OPLS-DA loadings plot.
Plants 15 01047 g007
Figure 8. Typical headspace GCxGC-MS contour plots of O. suffruticosus (A), O. grandiflorus (B), and O. africanus (C), indicating the major co-occurring volatile constituents in flowers, namely, (1) α-pinene, (2) α-ocimene, (3) eucalyptol, (4) o-cymene, (5) artemisia alcohol, (6) camphor, (7) yomogi alcohol and (8) terpinene-4-ol.
Plants 15 01047 g008
Figure 9. Typical headspace GCxGC-MS contour plots of O. suffruticosus (A), O. grandiflorus (B), and O. africanus (C), indicating major volatile constituents present in stems and leaves, namely, (1) α-ocimene, (2) eucalyptol, (3) o-cymene, (4) artemisia alcohol, (5) yomogi alcohol, and (6) α-pinene.
Plants 15 01047 g009
Table 1. The HPTLC bands and compounds identified in Oncosiphon flowers.
Rf ValueBand Colour[M-H] m/zIdentificationOccurrence
Anisaldehyde (under white light)
0.16Light purple
359.07755,6,4′–trihydroxy–7,8,3′–trimethoxyflavoneO. africanus
O. grandiflorus
0.20Light purple315.0506Isorhamnetin isomerO. africanus
O. grandiflorus
0.28Yellow299.0547KaempferideAll three species
0.35Light purple329.0760Tricin–glucuronosideO. africanus
O. grandiflorus
0.42Light purple329.0682EupalitinO. suffruticosus
0.45Light purpleUnknownO. suffruticosus
0.52Purple
UnknownO. africanus
O. grandiflorus
0.63Light purpleUnknownAll three species
0.70PurpleUnknownAll three species
0.90PinkUnknownAll three species
0.95PinkUnknownAll three species
Natural product reagent (at 366 nm)
0.08YellowUnknownO. grandiflorus
O. suffruticosus
0.19YellowUnknownO. suffruticosus
0.22Dark blueUnknownAll three species
0.30Light blueUnknownAll three species
0.32Yellow477.1028Rhamnetin sophorosideAll three species
0.37Yellow/GreenUnknownAll three species
0.42Dark YellowUnknownAll three species
0.58Light blueUnknownAll three species
0.62BlueUnknownO. suffruticosus
0.68BlueUnknownO. suffruticosus
0.70BlueUnknownAll three species
0.72Blue515.1194Dicaffeoylquinic acidAll three species
0.80Light blueUnknownO. africanus
0.82BlueUnknownAll three species
0.85Yellow315.0506Isorhamnetin isomerAll three species
345.0600Syringetin or spinacetinAll three species
299.0547KaempferideAll three species
359.07625,6,4′–Trihydroxy–7,8,3′–trimethoxyflavoneAll three species
0.90RedUnknownO. grandiflorus
0.97RedUnknownAll three species
Table 2. The HPTLC bands and compounds identified in Oncosiphon stems and leaves.
Rf ValueBand Colour[M-H] m/zIdentificationOccurrence
Anisaldehyde (under white light)
0.12Light purpleUnknownAll three species
0.16Light purple359.07755,6,4′–trihydroxy–7,8,3′–trimethoxyflavoneO. africanus
O. grandiflorus
0.24Light purpleUnknownO. africanus
O. grandiflorus
0.28Yellow299.0547KaempferideAll three species
0.35Light purple329.0760UnknownO. grandiflorus
O. suffruticosus
0.45Light purpleUnknownO. suffruticosus
0.49Light purpleUnknownO. africanus
O. grandiflorus
0.52Light purpleUnknownO. africanus
O. grandiflorus
0.63PurpleUnknownAll three species
0.73Purple/PinkUnknownAll three species
0.84YellowUnknownO. grandiflorus
0.90PinkUnknownAll three species
0.95PinkUnknownAll three species
Natural product reagent (at 366 nm)
0.19BlueUnknownAll three species
0.28Light blue/YellowUnknownAll three species
0.30YellowUnknownAll three species
0.37Light yellowUnknownO. africanus
O. suffruticosus
0.39YellowUnknownAll three species
0.40Light yellowUnknownAll three species
0.42Light yellowUnknownO. africanus
O. suffruticosus
0.48Light blueUnknownO. africanus
0.53Light blueUnknownAll three species
0.56Light blueUnknownO. africanus
0.72Blue515.1194Dicaffeoylquinic acidAll three species
0.81Light blueUnknownAll three species
0.83Yellow313.0712Dihydroxy–dimethoxyflavoneAll three species
315.0506Isorhamnetin isomerAll three species
345.0600Syringetin or SpinacetinAll three species
299.0547KaempferideAll three species
0.86RedUnknownO. africanus
O. grandiflorus
0.90Light blue/BlueUnknownAll three species
0.95RedUnknownAll three species
Table 3. Putative identification of compounds in leaves (L) and flower (F) extracts of O. africanus, O. grandiflorus, and O. suffruticosus using LC–QToF–MS in positive and negative ionisation modes.
#RT
(min)
Compound NameMolecular FormulaMass[M+H]+Fragment Ions
(Positive Mode)
[M-H]Fragment Ions
(Negative Mode)
Source
Amino acids
11.17Serine a [17]C3H7NO3105.0426106.0501
(106.0499) *
88.0392 [M+H-H2O]+, 70.0289 [M+H-2H2O]+OAF, OAL, OGF, OGL, OSF, OSL
21.19Proline a [17]C5H9NO2115.0633116.0701
(116.0706)
70.0659 [M+H-H2O-CO]+OAF, OAL, OGF, OGL, OSF, OSL
31.21Valine a [17]C5H11NO2117.079118.0857
(118.0863)
72.0818 [M+H-H2O-CO]+, 55.0559 [M+H-H2O-CO-NH3]+OAF, OAL, OGF, OGL, OSF, OSL
41.22Tyrosine a [17]C9H11NO3181.0739182.0810
(182.0812)
165.0541 [M+H-NH3]+, 147.0433 [M+H-NH3-H2O]+, 136.0752 [M+H-H2O-CO]+, 123.0435 [M+H-NH3-H2O-CH2CO]+, 119.0493 [M+H-H2O-CO-NH3]+, 95.0491 [M+H-NH3-H2O-CH2CO-CO]+OAF, OAL, OGF, OGL, OSF, OSL
51.22Isoleucine/leucine a [17]C6H13NO2131.0946132.1023
(132.1019)
86.0961 [M+H-H2O-CO]+, 69.0688 [M+H-H2O-CO-NH3]+OAF, OAL, OGF, OGL, OSF, OSL
61.66
71.31Threonine a [17]C4H9NO3119.0582120.0659
(120.0655)
102.0541 [M+H-H2O]+, 74.0603 [M+H-H2O-CO]+OAF, OAL, OGF, OGL, OSF, OSL
81.45Pipecolic acid a [18]C6H11NO2129.0790130.0869
(130.0863)
112.0761 [M+H-H2O]+, 84.0814 (C4H6NO) [M+H-H2O-CO]+, 56.0497 [C2H2NO+H]+OAF, OAL, OGF, OGL, OSF, OSL
91.96Phenylalanine a [17]C9H11NO2165.0790166.0865
(166.0863)
120.0824 [M+H-H2O-CO]+, 103.0548 [M+H-H2O-CO-NH3]+, 93.0691, 91.0547OAF, OAL, OGF, OGL, OSF, OSL
102.87Tryptophan a [17]C11H12N2O2204.0899205.0971
(205.0972)
188.0702 [M+H-NH3]+, 170.0622 [M+H-NH3-H2O]+, 146.0589 [M+H-CH2CO]+, 143.0728 [M+H-NH3-H2O-CO2]+, 118.0638 [M+H-CH2CO-CO]+,
91.0527 [M+H-CH2CO-CO-HCN]+
OAF, OAL, OGF, OGL, OSF, OSL
Phenolic acids
111.15Quinic acid [19]C7H12O6192.0634-191.0559
(191.0561)
173.0459 [M-H-H2O], 129.0571 [M-H-H2O-CO2], 111.0468 [M-H-2H2O-CO2], 93.0352, 87.0094OAF, OAL, OGF, OGL, OSF, OSL
122.50Neochlorogenic acid/
Chlorogenic acid a/
Cryptochlorogenic acid [20,21]
C16H18O9354.0951355.1027
(355.1024)
377.0844
(377.0843)
[M+Na]+
163.0385 [caffeoyl-H2O+H]+, 145.0288 [caffeoyl-2H2O+H]+, 135.0453 [caffeoyl+H-CO2]+, 117.0347 [caffeoyl+H-H2O-CO2]+353.0875
(353.0878)
191.0558 [quinic acid-H], 179.0348 [caffeic acid-H], 173.0447 [quinic acid-H-H2O], 161.0246 [caffeic acid-H-H2O], 135.0452 [caffeoyl-H-CO2]OAF, OAL, OGF, OGL, OSF, OSL
133.58
143.80
154.74Caffeic acid a [19]C9H8O4180.0423181.0491
(181.0495)
163.0386 [M+H-H2O]+179.0347
(179.0350)
161.0251 [M-H-H2O], 135.0449 [M-H-CO2], 117.0350 [M-H-H2O-CO2], 107.0503 (side chain cleavage)OAF, OAL, OGF, OGL, OSF, OSL
165.22Coumaroylquinic acid [20,21]C16H18O8338.1002337.0928
(337.0929)
191.0555 [quinic acid-H], 173.0461 [quinic acid-H-H2O], 163.0412 [coumaric acid-H], 119.0505 [coumaric acid-H-CO2]OAF, OAL, OGF, OGL, OSF (tr), OSL (tr)
175.68Feruloylquinic acid [20,21]C17H20O9368.1107-367.1039
(367.1035)
193.0531 [ferulic acid-H], 191.0559 [quinic acid-H], 173.0450 [quinic acid-H-H2O], 149.0581 [ferulic acid-H-CO2], 134.0362 [ferulic acid-H-CO2-CH3]OAF (tr), OAL, OGF (tr), OGL, OSF (tr), OSL
187.423,4/3,5/4,5–Di–O– caffeoylquinic acid a [20,21]/
DCQA isomer
C25H24O12516.1268517.1340
(517.1341)/
539.1155
(539.1160)
[M+Na]+
355.1027 [caffeoylquinic acid+H]+, 163.0385 [2caffeoyl+H-H2O]+, 135.0446 [2caffeoyl+H-CO2]+, 117.0320 [2caffeoyl+H-H2O-CO2]+515.1193
(515.1195)
353.0876 [caffeoylquinic acid-H], 335.0764 [caffeoylquinic acid-H-H2O], 191.0559 [quinic acid-H], 179.0347 [caffeic acid-H], 173.0452 [quinic acid-H-H2O], 135.0448 [caffeic acid-H-CO2]OAF, OAL, OGF, OGL, OSF, OSL
197.89
208.11
218.46
229.49Ferulic acid a [19]C10H10O4194.0579-193.0510
(193.0506)
178.0261 [M-H-CH3], 149.0611 [M-H-CO2], 134.0379 [M-H-CO2-CH3], 117.0345 [M-H-CO2-CH2-H2O]OAL, OGL, OSL
Flavonoids
233.80Gallocatechin [22]/
Epigallocatechin type flavan-3-ol compounds
C15H14O7306.0740305.0670
(305.0667)
221.0462, 179.0371, 151.0037 (RDA), 137.0249, 125.0221, 123.0099, 109.0291OAF, OAL, OGF, OGL, OSF, OSL
243.94
255.73Quercetin–3–O–rutinoside (rutin) a, [20]/Quercetin–rhamnosyl–hexoside [20]C27H30O16610.1534611.1604
(611.1607)
465.1025 [M+H-Rha]+, 449.1076 [M+H-Glc]+, 303.0499 [quercetin+H]+, 151.0027, 178.9984609.1459
(609.1461)
301.0345 (aglycone)
[M-H-Rha-Glc]
OAF, OAL, OGL, OSL
266.30OAF, OAL, OGF, OGL, OSF, OSL
275.86Quercetin–3-O-galactoside (Hyperoside)/Isoquercetin/Quercetin–hexoside [20]C21H20O12464.0955465.1025
(465.1028)
303.0505 (aglycone)463.0881
(463.0882)
301.0351, 300.0270 (aglycone) [M-H-Glc]OAF, OAL, OGL, OSL
286.49OAF, OAL, OGL, OSF, OSL
296.76OAF, OAL, OGF, OGL, OSF, OSL
306.15Isorhamnetin–dihexoside isomers [21]C28H32O17640.1639641.1709
(641.1712)
479.1198 [M+H-Glc]+, 317.0651 [M+H-2Glc]+639.1563
(639.1567)
477.105035 [M-H-Glc], 315.0507 [M-H-2Glc],300.0271 [M-H-2Glc-CH3]OAF, OAL (tr)
OGF, OGL (tr)
OSF, OSL
316.40OAF (tr), OAL, OGL,
OSF, OSL
326.72Luteolin–O–rutinoside/Kaempferol–O–rutinoside [21]C27H30O15594.1585595.1660
(595.1657)
449.1083 [M+H-Rha]+, 287.0555 [M+H-Rha-Glc]+593.1509
(593.1512)
447.0941 [M-H-Rha],
285.0395 [M-H-Rha-Glc], 151.0042, 133.0288
OAL (tr), OSF, OSL
337.25OSF, OSL (tr)
347.00Taxifolin (Dihydroquercetin) a [23]C15H12O7304.0583305.0651
(305.0656)
303.0513
(303.0510)
285.0402 [M-H-H2O], 175.0390, 151.0026, 153.0186, 125.0246, 109.0290OAF, OAL (tr), OGF, OGL (tr), OSF, OSL
357.01Isorhamnetin-rhamnosyl galactoside [20]C28H32O16624.1690625.1760
(625.1763)
317.0655 (aglycone), 153.0151 (RDA A-ring fragment)623.1619
(623.1618)
477.1048 [M-H-Rha], 315.0506 [M-H-Rha-Glc] (aglycone), 300.0268 [M-H-Rha-Glc-CH3], 287.0550 [M-H-Rha-Glc-CO],
271.0257 [aglycone-H-CO2], 151.0038 (RDA), 107.0130
OAF, OAL, OGF (tr), OSF, OSL
367.37Isorhamnetin 3–O-rutinoside (Narcissin) a [20]OAF (tr), OGF, OGL, OSF, OSL
377.04Luteolin (or Kaempferol)–O–glucoside/Luteolin–O–galactoside [20]C21H20O11448.1006449.1073
(449.1078)
287.0565 (aglycone), 153.0164 447.0930
(447.0933)
285.0401 (aglycone), 257.0428 [M-H-kaempferol-CO], 229.0470 [M-H-kaempferol-2CO], 151.0035, 117.0336OAF, OAL, OGF, OGL, OSF, OSL
387.72OAF, OAL (tr)
397.11Luteolin–O–glucuronide [21,24,25]C21H18O12462.0798463.0869
(463.0871)
287.0543 (aglycone), 153.0175461.0723
(461.0725)
285.0403 [M-H-GlcA], 257.0428 [M-H-GlcA-CO], 229.0450 [M-H-GlcA-2CO], 151.0050, 117.0339OAF, OAL, OGF, OGL, OSF, OSL
407.23Isorhamnetin 3–O–glucoside/Isorhamnetin 3–O–galactoside [21]C22H22O12478.1111479.1188
(479.1184)
317.0664 (aglycone), 153.0153477.1035
(477.1038)
315.0507 (aglycone), 300.0278 [M-H-hexose-CH3], 287.0530 [M-H-hexose-CO], 151.0040, 107.0145 (RDA fragment)OAF (tr), OAL, OSF (tr), OSL (tr)
417.50OAF, OAL (tr), OGF, OGL, OSF, OSL
428.69Isorhamnetin 3-O-rhamnoside [26]C22H22O11462.1162463.1231
(463.1235)
317.0661 (aglycone)461.1091
(461.1089)
315.0517 [M-H-Rha]
(aglycone), 300.0283 [M-H-Rha-CH3], 151.0040 (RDA)
OAF (tr), OAL, OGL, OSL (tr), OSF (tr)
439.29Tricin–glucuronoside [25]C23H22O13506.1060507.1137
(507.1133)
331.0812 (aglycone)505.0985
(505.0988)
329.0666 (aglycone), 314.0426 [M-H-GlcA-CH3], 299.0246, 151.0037 (RDA), 121.0301OAF, OAL, OSF (tr), OSL
449.83Quercetin–feruloylglucosideC31H28O15640.1428641.1497
(641.1501)
639.1351
(639.1355)
463.0886 [quercetin glucoside-H], 300.0267 (aglycone), 301.0358 [M-H-feruloyl-Glc], 273.0391 [aglycone-H-CO], 193.0516 [ferulic acid-H], 151.0037 (RDA)OAF (tr), OAL, OGL, OSF, OSL
4510.44Eriodictyol a C15H12O6288.0634289.0710
(289.0707)
271.0605, 153.0179, 135.0422, 119.0432287.0558
(287.0561)
269.0452 [M-H-H2O], 151.0037 (RDA), 135.0452, 119.0451OAF (tr), OAL, OGF, OGL, OSF, OSL
4610.74Quercetin aC15H10O7302.0427303.0500
(303.0499)
285.0369 [M+H-H2O]+, 275.0540 [M+H-CO]+, 257.0443 [M+H-H2O-CO]+, 149.0233, 153.0181 (RDA)301.0352
(301.0354)
273.0405 [M-H-CO], 257.0455 [M-H-CO2], 179.0350, 151.0039, 149.0244, 107.0139 OAF, OAL, OGF, OGL, OSF, OSL
4711.04
Luteolin aC15H10O6
286.0477
287.0553
(287.0550)
269.0468 [M+H-H2O]+, 259.0644 [M+H-CO]+, 229.0478 [M+H-H2O-2CO]+, 153.0178 (RDA), 149.0214, 121.0291
285.0401
(285.0405)
257.0432 [M-H-CO], 241.0500 [M-H-CO2], 227.0327, 151.0035, 149.0233. 133.0290 (RDA)
OAF, OAL, OGF, OGL, OSF, OSL
4812.89Kaempferol aOAF, OAL (tr), OSF, OSL (tr)
4911.20Tetrahydroxy–methoxy flavone (methyl quercetin) [21,22]C16H12O7316.0583317.0661
(317.0656)
302.0399 [M+H-CH3]+, 274.0483 [M+H-CH3-CO]+
315.0509
(315.0510)
300.0275 [M-H-CH3], 272.0325 [M-H-CH3-CO], 244.0333 [M-H-CH3-2CO], 179.0349, 151.0036 (RDA)OAF, OAL, OGF, OGL, OSF, OSL
5011.64
5113.035,7,4′–Trihydroxy flavone (apigenin) aC15H10O5270.0528271.0605
(271.0601)
253.0498 [M+H-H2O]+, 243.0623 [M+H-CO]+, 153.0185, 133.0285 (C8H5O2+), 121.0283 (C7H5O+) (RDA)269.0455
(269.0455)
241.0517 [M-H-CO], 225.0557 [M-H-CO2], 151.0037 (C7H3O4), 133.0292 (C8H5O2), 117.0343 (C8H6O)OAF, OAL, OGL (tr), OSF, OSL
5213.29Trihydroxy–dimethoxyflavone isomers (Eupalitin) [27]C17H14O7330.074331.0815
(331.0812)
316.0581 [M+H-CH3]+,
301.0337 [M+H-2CH3]+, 299.0565 [M+H-CH3-OH]+, 285.0363 [M+H-CH3-H2O-CO]+, 183.0293, 153.0180 (RDA), 121.0281
329.0666
(329.0667)
314.0420 [M-H-CH3],
299.0192 [M-H-2CH3], 286.0426 [M-H-CH3-CO],
271.0240 [M-H-2CH3-CO], 151.0036 (RDA), 149.0239
OAF, OAL, OGF, OGL, OSF, OSL
5313.66OAF, OAL, OGF, OGL, OSF, OSL
5414.07OAF, OAL,
OSF, OSL(tr)
5513.90trihydroxy–trimethoxyflavoneC18H16O8360.0845361.0919
(361.0918)
346.0681 [M+H-CH3]+, 331.0506 [M+H-2CH3]+, 329.0626 [M+H-CH3OH]+, 153.0175 (RDA)359.0775
(359.0772)
344.0529 [M-H-CH3],
329.0301 [M-H-2CH3],
314.0065 [M-H-3CH3], 211.0243, 151.0035 (RDA)
OAF, OAL, OGF, OGL (tr), OSF, OSL
5615.51Dihydroxy–dimethoxyflavone (Pectolinarigenin/ Cirsimaritin) [24]C17H14O6314.0790315.0860
(315.0863)
300.0640 [M+H-CH3]+, 153.0181 (RDA), 121.0284 313.0715
(313.0718)
298.0470 [M-H-CH3], 283.0254 [M-H-2CH3], 255.0292 [M-H-2CH3-CO], 227.0341 [M-H-2CH3-2CO], 163.0035 [C8H4O4-H], 151.0036, 133.0296OAF, OAL, OGF (tr), OGL, OSF, OSL
Sesquiterpene Lactones
576.14Isomers of
Tatridin A(Tavulin, Tabulin)/Tanachin/Deacetyl–Cyclopyrethrosin/Isospiciformin/ Sivasinolide
(hydroxylated germacranolides) [28,29,30,31]
C15H20O4264.1362265.1431
(265.1434)
282.1699
(282.1700)
[M+NH4]+
287.1253
(287.1254)
[M+Na]+
247.1332 [M+H-H2O]+, 229.1225 [M+H-2H2O]+, 221.1535 [M+H-CO2]+, 219.1382 [M+H-H2O-CO]+, 203.1433 [M+H-H2O-CO2]+, 201.1278 [M+H-2H2O-CO]+, 185.1328 [M+H-2H2O-CO2]+, 183.1145 [M+H-3H2O-CO]+,177.0915 [M+H-C4H8O]+, 159.0805 [M+H-C4H8O-H2O]+, 149.0965 (C10H13O+), 121.1014 (C9H13+),
105.0699 (C8H9+), 93.0700 (C7H9+)
263.1289
(263.1289)
219.1387 [M-H-CO2]OAF, OAL, OGF, OGL
586.62OAF, OAL, OGF, OGL
596.98OAF, OAL, OGF, OGL
608.32OAF (tr), OAL (tr), OGF (tr), OGL (tr)
6110.64OAF (tr), OAL (tr), OGF (tr), OGL (tr)
6212.51OAF, OAL, OGL, OGF
638.90Isoepoxyestafiatin and its isomer [28,29,30,31]C15H18O4262.1205263.1280
(263.1278)
285.1101
(285.1097)
[M+Na]+
245.1179 [M+H-H2O]+, 219.1388 [M+H-CO2]+, 201.1272 [M+H-H2O-CO2]+, 173.0964 [M+H-H2O-CO2-CO]+,
145.1016 (C11H13+)
--OAF, OAL, OGF, OGL, OSF (tr), OSL (tr)
649.10OSF(tr), OSL
6510.144,5-Epoxy-8,13-dihydroxy-1(10),7(11)-germacradien-12,6-olide [28,29,30,31]C15H20O5280.1311281.1379
(281.1384)
263.1277 [M+H-H2O]+, 245.1142 [M+H-2H2O]+, 237.1501 [M+H-CO2]+, 227.1057 (C15H15O2+), 201.1271 [M+H-2H2O-CO2]+, 183.1136 [M+H-3H2O-CO2]+, 149.0944 (C10H13O+), 121.1026 (C9H13+), 93.0710 (C7H9+), 91.0530 (C7H7+)--OGF, OGL
6612.57Santamarin or its
isomer Reynosin
(eudesmanolide
derivatives) [28,29]
C15H20O3248.1412249.1488
(249.1485)
271.1305
(271.1305)
[M+Na]+
231.1382 [M+H-H2O]+, 213.1277 [M+H-2H2O]+, 205.1589 [M+H-CO2]+, 187.1484 [M+H-H2O-CO2]+,
159.1170 [M+H-H2O-CO2-CO]+, 145.1013 (C11H13+)
--OSF, OSL
6714.58OAF, OAL, OGF, OGL (tr)
6814.04Dehydrocostunolide [28,29,30]C15H18O2230.1307231.1381
(231.1380)
213.1276 [M+H-H2O]+, 187.1481 [M+H-CO-H2O]+, 185.1326 [M+H-H2O-CO-H2]+, 159.1167 (C12H15+), 145.1009 (C11H13+), 105.0696 (C8H9+), 91.0539 (C7H7+)--OAF (tr), OAL (tr), OGF (tr), OGL (tr)
6914.21OAF, OAL, OGF, OGL (tr)
7014.142-Oxo-1(10),3,11(13)-guaiatrien-12,6-olide/Dehydroleucodin/Lidbeckialactone/Mesatlantin E
(guaianolides) [28,29,30,31]
C15H16O3244.1099245.1171
(245.1172)
267.0994
(267.0992)
[M+Na]+
227.1071 [M+H-H2O]+, 201.1277 [M+H-CO2]+, 183.1168 [M+H-H2O-CO2]+, 155.0852, 141.0698 (C11H9+)
OSF, OSL,
OAL(tr), OAF (tr)
7114.50OSF, OSL,
OAL(tr), OAF (tr)
7214.54Matricarin [31] (guaianolide)C17H20O5304.1311305.1386
(305.1384)
287.1253 [M+H-H2O]+, 245.1175 [M+H–Ac]+, 227.1072 [M+H-Ac-H2O]+, 201.1278 [M+H-Ac-CO2]+, 183.1166 [M+H-Ac-H2O-CO2]+, 173.0958 (C12H13O+), 145.1013 (C11H13+), 119.0855 (C9H11+), 105.0699 (C8H9+), 91.0540 (C7H7+)--OSF, OSL
7317.191α, 6α-Dihydroxy-4E,10(14)-germacradien-12,8α-olide [28,29,30,31]C15H22O4266.1518--265.1441
(265.1445)
247.1344 [M-H-H2O], 237.1496 [M-H-CO], 221.1547 [M-H-CO2], 203.1434 [M-H-H2O-CO2], 115.0399 (C5H7O3)OAF, OAL, OGF, OGL, OSF, OSL
7418.61Costunolide [28,30]
(germacranolide)
C15H20O2232.1463233.1538
(233.1536)
215.1432 [M+H-H2O]+, 189.1642 [M+H-CO2]+, 187.1482 [M+H-H2O-CO]+, 159.1173 (C12H15+), 145.1013 (C11H13+), 131.0856 (C10H11+), 119.0855 (C9H11+), 105.0698 (C8H9+), 91.0540 (C7H7+)--OSF, OSL, OAF (tr), OAL (tr), OGF
Fatty acid derivatives
7512.73Trihydroxy octadecadienoic acid [32]
(TriHODE)
C18H32O5328.2250351.2138
(351.2142)
[M+Na]+
-327.2177
(327.2177)
309.2070 [M-H-H2O], 291.1977 [M-H-2H2O], 273.1839 [M-H-3H2O], 211.1343 (C12H19O3), 171.1024 (C9H15O3)OAF, OAL, OGF, OGL, OSF, OSL
7613.73Trihydroxy octadecenoic acid [32](TriHOME)C18H34O5330.2406353.2295
(353.2298)
[M+Na]+
-329.2334
(329.2333)
311.2239 [M-H-H2O], 293.2129 [M-H-2H2O], 275.2016 [M-H-3H2O], 229.1442 (C12H21O4), 211.340 (C13H23O2), 171.1026 (C9H15O3) OAF, OAL, OGF, OGL, OSF, OSL
7719.31Hydroxy-octradecadienoic acid (HODE) [33]C18H32O3296.2351--295.2278
(295.2279)
277.2171 [M-H-H2O], 251.2361 [M-H-CO2], 233.2275 [M-H-H2O-CO2], 195.1389, 171.1034OAF (tr), OGF (tr), OSF (tr)
7819.49OAF, OAL, OGF, OGL, OSF, OSL
7919.99OAF (tr), OAL (tr), OGF (tr), OGL (tr)
8019.619-Octadecenedioic acid [34]C18H32O4312.2301--311.2224
(311.2228)
293.2123 [M-H-H2O], 267.2330 [M-H-CO2], 249.2224 [M-H-H2O-CO2], 223.2431 [M-H-2CO2], 233.1555 [M-H-H2O-C3H8O], 155.0714OAF, OAL (tr), OGF, OGL (tr), OSF, OSL (tr)
8119.6313/9-oxo-octadecadienoic acid [33]
(oxoODE)
C18H30O3294.2195295.2267
(295.2268)
277.2187 [M+H-H2O]+, 249.2220 [M+H-2H2O]+, 119.0877, 105.0726, 93.0725, 81.0703293.2122
(293.2122)
275.2016 [M-H-H2O], 249.2199 [M-H-CO2], 205.1594, 167.1063, 113.0952OAF, OAL, OGF, OGL, OSF, OSL
8219.78OAF, OAL, OGF, OGL,
OSF, OSL
8319.85OAF (tr), OAL (tr), OGF (tr), OGL (tr), OSF (tr), OSL (tr)
Note: ‘*’ indicates the theoretical value of exact mass; ‘tr’ indicates the presence of compound in trace amounts (CPS intensity < 104); OAF—O. africanus Flower; OAL—O. africanus Leaf; OGF—O. grandiflorus Flower; OGL—O. grandiflorus Leaf; OSF—O. suffruticosus Flower; OSL—O. suffruticosus Leaf; RDA—retro–Diels Alder rearrangement. Glc = 162.0528 Da; Rha = C6H10O4 = 146.0579 Da; GlcA = 176.0321 Da; H2O = 18.0106 Da; CH2 = 14.0157 Da; CO2 = 43.9898 Da; CH3 = 15.0235 Da; CO = 27.9949 Da; 2CH3 = 30.0470 Da; Ac = 60.0211 Da; CH2CO = 42.0106 Da; HCN = 27.0109 Da; NH3 = 17.0265 Da. a Identification based on accurate mass, MS/MS fragmentation pattern, and chromatographic comparison with a reference compound. The superscripts provided with the compound names indicate the reference numbers.
Table 4. Putative chemical markers responsible for variation observed within the flowers of the three Oncosiphon species.
Species[M-H] m/zCompound Name
O. africanus
(pink)
329.066Eupalitin
359.0765,6,4′–trihydroxy–7,8,3′–trimethoxyflavone
313.071Dihydroxy–dimethoxyflavone
O. grandiflorus
(blue)
639.155Rhamnetin sophoroside
362.196Unknown
557.272Unknown
O. suffruticosus
(red)
477.106Isorhamnetin 3–O–glucoside
315.051Methyl quercetin
Table 5. Potential chemical markers responsible for variation existing between the three Oncosiphon species in stem and leaf samples.
Species[M-H] m/zCompound Name
O. africanus
(pink)
449.109Unknown
515.119Dicaffeoylquinic acid
491.081Unknown
505.100Tricin–glucuronoside
329.066Eupalitin
O. grandiflorus
(blue)
479.195Unknown
O. suffruticosus
(red)
447.091Kaempferol glucoside
315.091Methyl quercetin
313.071Dihydroxy–dimethoxyflavone
Table 6. Mean percentage composition (≥0.2% ± SD) of the compounds tentatively identified in the flowers of the three Oncosiphon species.
O. africanusO. grandiflorusO. suffruticosus
NoCompound% Area
± SD (n = 8)
% Area
± SD (n = 32)
% Area
± SD (n = 56)
1Ethyl acetateND1.0 ± 0.52.7 ± 1.0
2Methyl acetate1.2 ± 1.03.2 ± 0.72.1 ± 1.7
33–Amino–1–propanol1.0 ± 0.50.7 ± 0.11.7 ± 1.8
4Methylene chloride1.5 ± 0.31.5 ± 1.01.5 ± 0.6
5MethacroleinNDND2.9 ± 1.1
62–methylbutanalND1.9 ± 0.42.3 ± 0.4
7α-Pinene4.3 ± 2.34.6 ± 3.22.6 ± 0.1
8SabineneNDND4.7 ± 0.6
9Santolina trieneNDND3.2 ± 0.9
101,3,5–Cycloheptatriene0.8 ± 0.31.1 ± 0.81.2 ± 0.5
112,4,6–Trimethyl–1,3,6–heptatrieneND1.9 ± 0.71.8 ± 0.7
12CampheneNDND5.0 ± 2.1
13HexanalNDND2.7 ± 1.4
141–Pentanol2.9 ± 1.1ND1.0 ± 0.4
15Eucalyptol (1,8–cineole)10.1 ± 1.47.4 ± 2.89.5 ± 2.5
16ʎ–Terpinene1.4 ± 0.71.7 ± 1.21.7 ± 0.6
17o-Cymene5.5 ± 3.96.5 ± 6.46.9 ± 4.7
18α-Ocimene42.1 ± 2.315.9 ± 2.212.2 ± 2.5
193–Hexen–1–ol, (Z)–0.6 ± 0.30.3 ± 0.10.5 ± 0.3
20trans–2,7–Dimethyl–4,6–octadien–2–ol0.7 ± 0.3ND1.1 ± 0.5
21Yomogi alcohol2.9 ± 0.71.6 ± 0.64.1 ± 1.6
22Artemisia trieneND20.3 ± 2.114.6 ± 2.3
232,4,6–Trimethyl–1,3,6–heptatrieneND5.3 ± 2.025.1 ± 2.4
24Artemisia alcohol1.3 ± 0.715.3 ± 1.611.9 ± 2.8
25p–CymeneND0.6 ± 0.30.6 ± 0.2
26Acetic acid3.1 ± 2.13.1 ± 2.63.1 ± 2.3
271–Octen–3–olNDND0.3 ± 0.1
284–Methyl–1,6–heptadien–4–olND0.9 ± 0.41.3 ± 1.2
292,7–Dimethyl–2,6–octadien–4–ol 1.2 ± 0.40.8 ± 0.84.1 ± 2.8
301,6–Heptadien–4–ol, 4–methyl–ND0.6 ± 0.31.5 ± 0.3
313,5–Heptadien–2–ol, 2,6–dimethyl–2.6 ± 0.61.6 ± 0.30.8 ± 0.3
32CamphorND4.8 ± 3.77.7 ± 7.0
33Bicyclo [2.2.2] octa–2,5–diene, 1,2,3,6–tetramethyl–NDND7.9 ± 1.6
34LinaloolNDND4.6± 1.3
35trans–γ–CaryophylleneNDND0.9± 0.9
36Linalyl o–aminobenzoateND0.6 ± 0.313.6 ± 1.8
37ChrysanthenoneND3.6 ± 3.0ND
38Verbenyl acetateND3.6 ± 3.0ND
39Terpinen–4–ol2.8 ± 1.83.8 ± 4.43.9 ± 3.2
40α–FarneseneND1.2 ± 0.5ND
41Lavender lactoneNDND0.4 ± 0.2
42endo–BorneolNDND0.9 ± 0.6
43α–TerpineolND0.7 ± 0.31.0 ± 0.4
44cis–VerbenolND2.5 ± 1.4ND
45p–Cymen–8–olNDND0.4 ± 0.1
468–HydroxycarvotanacetoneNDND1.4 ± 0.1
472–Octen–4–ol, 2–methyl–ND26.3 ± 1.3ND
ND: Not detected; Major compounds (>10%) are indicated in bold.
Table 7. Mean percentage area (≥0.2% ± SD) of the compounds tentatively identified in stems and leaves of the three Oncosiphon species.
Species O. africanusO. grandiflorusO. suffruticosus
NoCompound% Area
± SD (n = 8)
% Area
± SD (n = 32)
% Area
± SD (n = 56)
1Ethyl acetateNDND1.8 ± 0.7
2Methyl acetate2.5 ± 1.4ND2.4 ± 1.2
3DimethyldiazeneND2.9 ± 1.21.0 ± 0.4
43–Amino–1–propanol NDND0.9 ± 0.5
5Methylene chloride2.6 ± 1.12.1 ± 1.32.7 ± 1.5
6MethacroleinNDND1.8 ± 1.1
7Butanal, 2–methyl–1.7 ± 0.31.0 ± 0.11.2 ± 0.4
8α-Pinene1.6 ± 0.1NDND
9Santolina triene0.6 ± 0.4ND3.2 ± 0.8
101,3,5–Cycloheptatriene3.2 ± 1.42.6 ± 1.41.2 ± 0.6
112,4,6–Trimethyl–1,3,6 heptatrieneND2.3 ± 0.82.2 ± 0.8
12CampheneNDND1.9 ± 0.9
13Hexanal1.2 ± 0.1ND1.2 ± 0.3
141–PentanolNDND0.9 ± 0.3
15Eucalyptol (1,8–cineole)ND4.3 ± 1.06.9 ± 3.6
16Butyl methyl ketoneNDND8.7 ± 0.0
17ʎ–Terpinene2.4 ± 1.32.3 ± 1.11.7 ± 1.0
18o-Cymene10.3± 7.08.6 ± 7.58.7 ± 6.2
19TerpinoleneNDND1.6 ± 0.4
20α-Ocimene5.9 ± 3.410.1 ± 1.12.6 ± 1.1
21ArtemesiaND1.0 ± 1.50.7 ± 0.9
22Yomogi alcoholND1.0 ± 0.81.1 ± 0.5
23Artemisia trieneND20.2 ± 6.325.9± 5.2
24Artemisia alcohol1.9 ± 1.95.7 ± 5.07.7 ± 11.6
25p–cymenene0.8 ± 0.30.8 ± 0.30.7 ± 0.4
26Acetic acid1.8 ± 0.51.2 ± 0.51.2 ± 3.3
271–Octen–3–olNDND0.2 ± 0.1
284–Methyl–1,6–heptadien–4–olND1.0 ± 0.52.5 ± 1.3
292,7–Dimethyl–2,6–octadien–4–ol 0.3 ± 0.10.6 ± 0.42.8 ± 1.8
303,5–Heptadien–2–ol, 2,6–dimethyl–2.2 ± 0.60.6 ± 0.31.7 ± 1.5
31Camphor0.8 ± 0.34.5 ± 3.310.4 ± 7.5
32α–NeocloveneND5.3 ± 4.52.4 ± 1.0
33CadineneNDND2.8 ± 0.7
34α–Gurjunene2.1 ± 0.0ND4.2 ± 3.8
35LinaloolND0.8 ± 0.62.8 ± 3.7
36Limona ketoneNDND1.2 ± 0.3
37Linalyl o–aminobenzoateND4.1 ± 3.911.8 ± 16.7
38ChrysanthenoneND3.3 ± 2.64.7 ± 5.3
39trans–γ–CaryophylleneND1.1± 0.20.2± 0.1
40Verbenyl acetateND3.3 ± 2.64.7 ± 5.3
41Borneol, acetateNDND1.2 ± 1.1
42cis–VerbenolND9.2 ± 3.41.3 ± 0.3
43Terpinen–4–ol4.2 ± 1.85.4 ± 7.84.2 ± 3.5
44CaryophylleneND2.3 ± 1.2ND
45α–Farnesene1.4 ± 0.50.7 ± 0.2ND
46endo–BorneolND0.4 ± 0.21.6 ± 1.8
47α–Terpineol0.4 ± 0.11.1 ± 1.31.0 ± 0.8
48p–Cymen–8–olNDND0.3 ± 0.2
498–HydroxycarvotanacetoneNDND3.0 ± 1.3
50Tetraethylene glycol8.3 ± 9.017.3 ± 2.1ND
ND: Not detected; major compounds (>10%) are indicated in bold.
Table 8. Summary of collection sites, GPS coordinates and voucher specimen numbers of the three Oncosiphon species.
SpeciesVoucher NumberNumber of SamplesLocalityGPS Coordinates
Oncosiphon africanus
(P.J. Bergius) Källersjö
38431Bokbaai33° 33′ 11.4″ S
18° 18′ 41.0″ E
38441Velddrif32° 47′ 28.8″ S
18° 10′ 08.2″ E
38451Laaiplek32° 46′ 14.5″ S
18° 09′ 41.8″ E
38471Cloeteskraal32° 51’ 39.5″ S
18° 12’ 28.7″ E
Oncosiphon grandiflorus
(Thunb.) Källersjö
3830 (A–C)3Ganzekraal turnoff33° 31’ 03.1″ S
18° 20’ 49.4″ E
3832 (A–C)3Melkbosstrand turnoff from N733° 43’ 31.0″ S
18° 32’ 49.6″ E
3838 (A–E)528 km along Hopefield road from N733° 14’ 10.2″ S
18° 33’ 54.1″ E
3848 (A–B)2Berg River Station32° 54’ 27.7″ S
18° 20’ 02.5″ E
3484 (A–C)3Berg River Station32° 54’ 27.7″ S
18° 20’ 02.5″ E
3828 (A–C)3Bokbaai33° 31’ 37.5″ S
18° 20’ 10.7″ E
3829 (A–C)3Bokbaai33° 34′ 15.2″ S
18° 19′ 27.7″ E
3831 (A–C)3Blaauwberg farm entrance33° 43′ 31.2″ S
18° 29′ 25.5″ E
Oncosiphon suffruticosus
(L.) Källersjö
3837 (A–E)510 km along Hopefield road from N733° 23′ 40.0″ S
18° 40′ 26.9″ E
3839 (A–E)526 km from Hopefield from N733° 13′ 53.0″ S
18° 33′ 31.0″ E
3841 (A–C)3Langebaanweg32° 59′ 42.8″ S
18° 10′ 48.1″ E
3842 (A–C)3Hopefield33° 13′ 23.0″ S
18° 20′ 35.3″ E
3846 (A–C)3Laaiplek32° 46′ 14.5” S
18° 09′ 41.8” E
Disclaimer/Publisher’s Note: The statements, opinions and data contained in all publications are solely those of the individual author(s) and contributor(s) and not of MDPI and/or the editor(s). MDPI and/or the editor(s) disclaim responsibility for any injury to people or property resulting from any ideas, methods, instructions or products referred to in the content.