1. Introduction
Rice is a staple food crop in China and many other rice-growing regions. Rice blast, caused by Magnaporthe oryzae, can occur throughout crop development and threaten both plant vigor and yield stability [
1,
2]. Field diagnosis still relies heavily on visual scoring and manual sampling. Although these approaches can be accurate, they are slow, labor-intensive, and spatially limited, reducing their suitability for rapid monitoring across large paddy fields [
3,
4,
5].
UAV remote sensing enables rapid, repeated acquisition of field-scale crop imagery and has become an important tool for disease monitoring. Recent deep-learning studies have addressed fine-grained rice phenotyping, UAV-based rice disease mapping, compact plant-disease detection, and multi-class disease classification [
6,
7,
8,
9]. Related work has also examined green-control practices for rice diseases [
10], multi-scale convolutional detection of rice leaf blast [
11], and the broader use of UAV remote sensing for rice and crop monitoring [
12,
13]. Across other crop systems, hyperspectral and multispectral imagery has supported chlorophyll estimation, yield prediction, and disease detection [
14,
15,
16,
17,
18,
19]. For rice leaf blast specifically, Zhao et al. [
20] integrated UAV remote sensing, a disease-sensitive vegetation index, and machine learning, whereas Liu et al. [
21] combined UAV hyperspectral imagery with a multi-scale attention Transformer. Compared with RGB imagery, multispectral imagery captures green, red, red-edge, and near-infrared responses associated with pigments, moisture, tissue structure, and canopy condition. Compared with hyperspectral data, UAV multispectral data are less computationally demanding and more practical for repeated field deployment.
Paddy UAV images usually contain rice canopies, soil, water, ridges, and weeds in the same scene. If spectral features are extracted directly from mixed pixels, background noise can mask the disease signal and reduce model stability. Ronneberger et al. [
22] introduced U-Net as an encoder–decoder network for pixel-level semantic segmentation. Cao et al. [
23] combined U-Net with SAM-assisted annotation to extract rice fields from remote-sensing images. Ground-truth disease grading followed GB/T 15790-2009, Rules for the Investigation and Forecasting of Rice Blast [
24]. To reduce background interference in the present study, U-Net semantic segmentation was used to isolate rice canopy regions and build disease-grading samples from masked multispectral images.
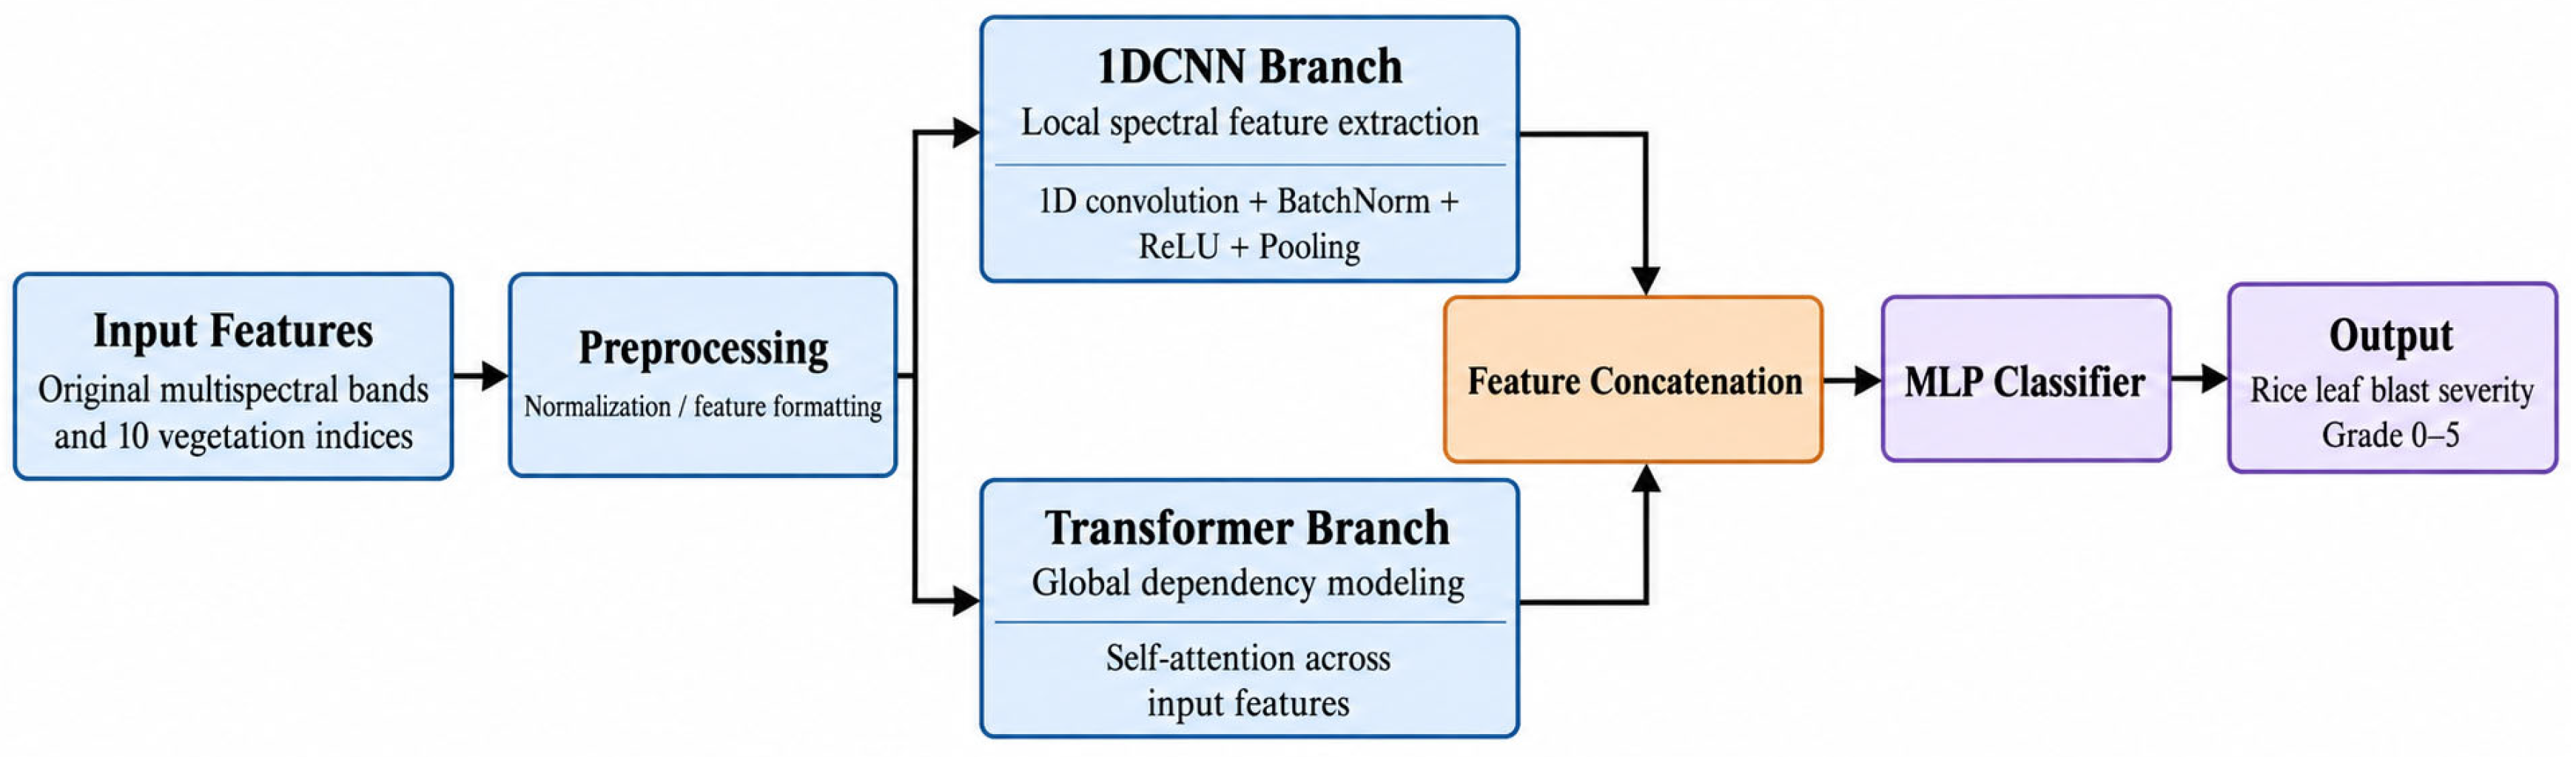
For severity grading, a dual-branch 1DCNN-Transformer structure was used as the baseline. The 1DCNN branch extracts local spectral-combination features, whereas the Transformer branch models global dependencies among bands and vegetation indices. Xue and Su [
25] reviewed the development and applications of remote-sensing vegetation indices. Gitelson et al. [
26] related leaf chlorophyll content to spectral reflectance for non-destructive assessment. Qiao et al. [
27] evaluated vegetation-index responses in UAV-based chlorophyll estimation under different crop coverages. Li et al. [
28] showed the usefulness of red-edge spectral vegetation indices for estimating crop nitrogen status. Considering the low-dimensional and structured nature of the input features, the baseline was further improved by adding multi-scale 1D Inception convolution, SE feature recalibration, Focal Loss, Random Forest (RF), Gradient Boosting Decision Trees (GBDT), and validation-set probability-weighted fusion. Fawaz et al. [
29] proposed InceptionTime for multi-scale convolutional time-series classification. Hu et al. [
30] introduced squeeze-and-excitation networks for adaptive channel recalibration. Lin et al. [
31] proposed Focal Loss to emphasize hard-to-classify samples. Breiman [
32] established Random Forests as an ensemble of randomized decision trees. Friedman [
33] formulated gradient boosting as sequential function approximation. Wolpert [
34] introduced stacked generalization for combining the outputs of multiple models.
Despite recent progress, three gaps remain. First, operational management requires canopy-scale severity classification and spatial mapping rather than leaf-level recognition alone. Second, complex paddy backgrounds can contaminate canopy spectra, requiring segmentation, vegetation-index interpretation, and severity modeling to be integrated within a single workflow. Third, field management requires class predictions to be translated into spatially explicit decision-support products. Accordingly, this study developed and evaluated an integrated UAV multispectral workflow for six-class rice leaf blast severity grading, disease mapping, and prescription-map generation. The four main contributions are summarized below.
- (1)
A two-year canopy-level UAV multispectral dataset was curated from synchronized field ratings, with each modeling sample defined as a 3 × 3-pixel ROI representing a local rice-canopy unit.
- (2)
A U-Net-based masking workflow was integrated with multispectral preprocessing to reduce soil, water, ridge, and weed interference before spectral feature extraction.
- (3)
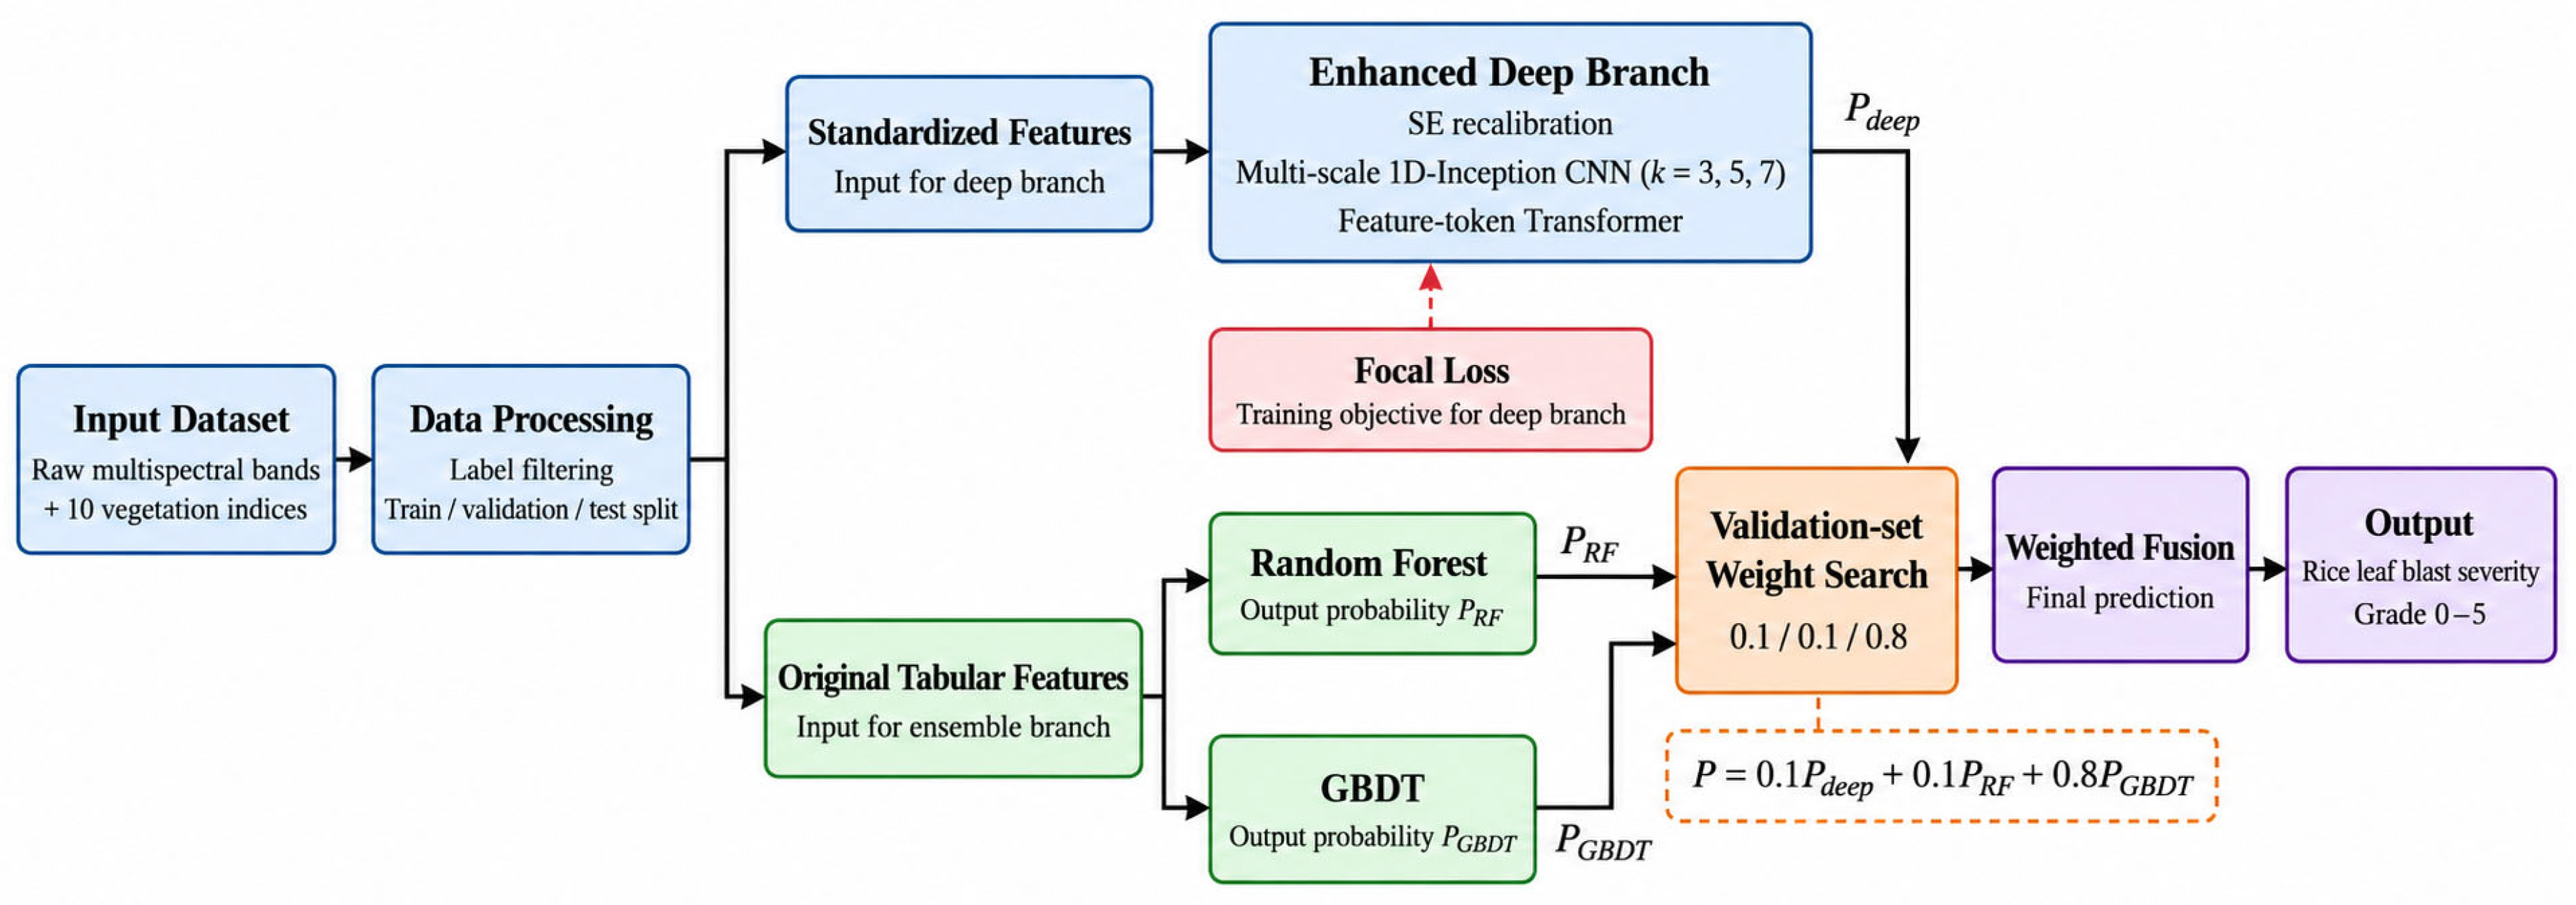
An improved 1DCNN-Transformer deep branch was integrated with RF and GBDT probability outputs, and ablation experiments were conducted to quantify the contributions of the individual model components.
- (4)
Severity predictions were converted into georeferenced disease-severity and prescription maps, establishing a workflow from canopy-level classification to spatial output generation.
3. Results
3.1. Complex Background Removal in Paddy Fields
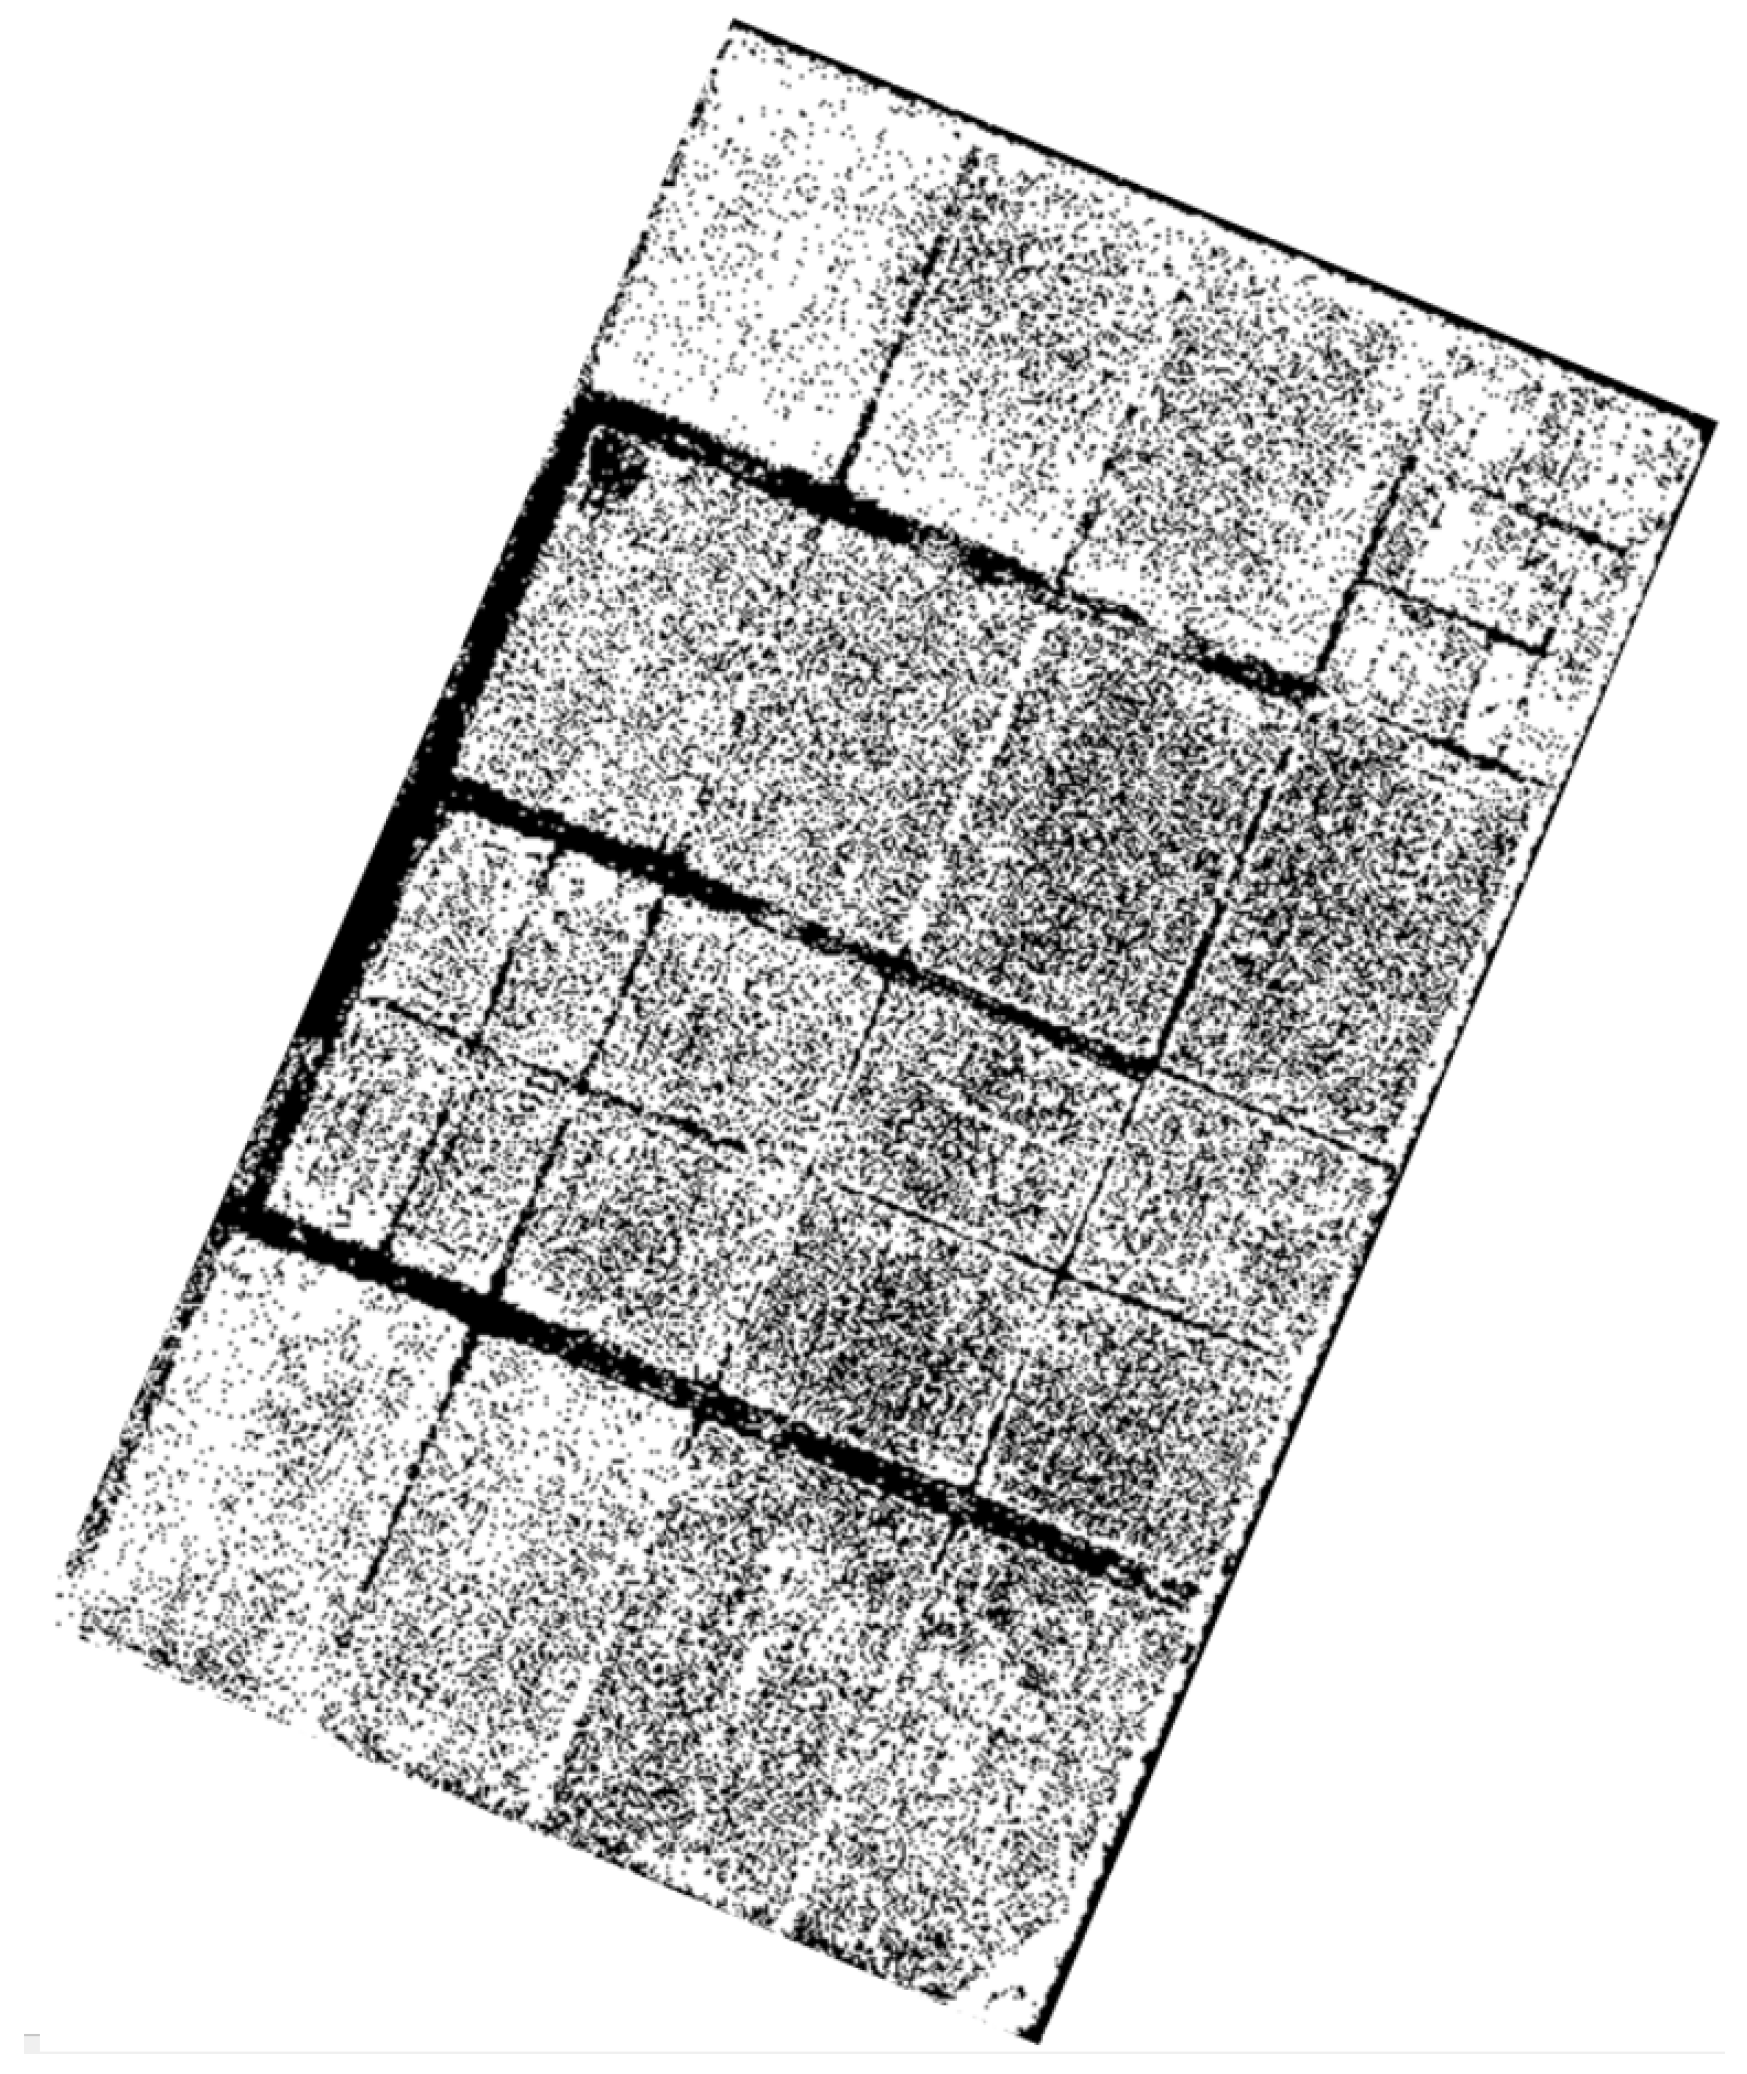
After training, the full-field UAV multispectral image was processed by the U-Net model to extract the rice canopy from the background. The registered composite image was used as input, and the model produced a binary mask of the same dimensions. Black pixels represented the background, and white pixels represented the rice canopy (
Figure 6).
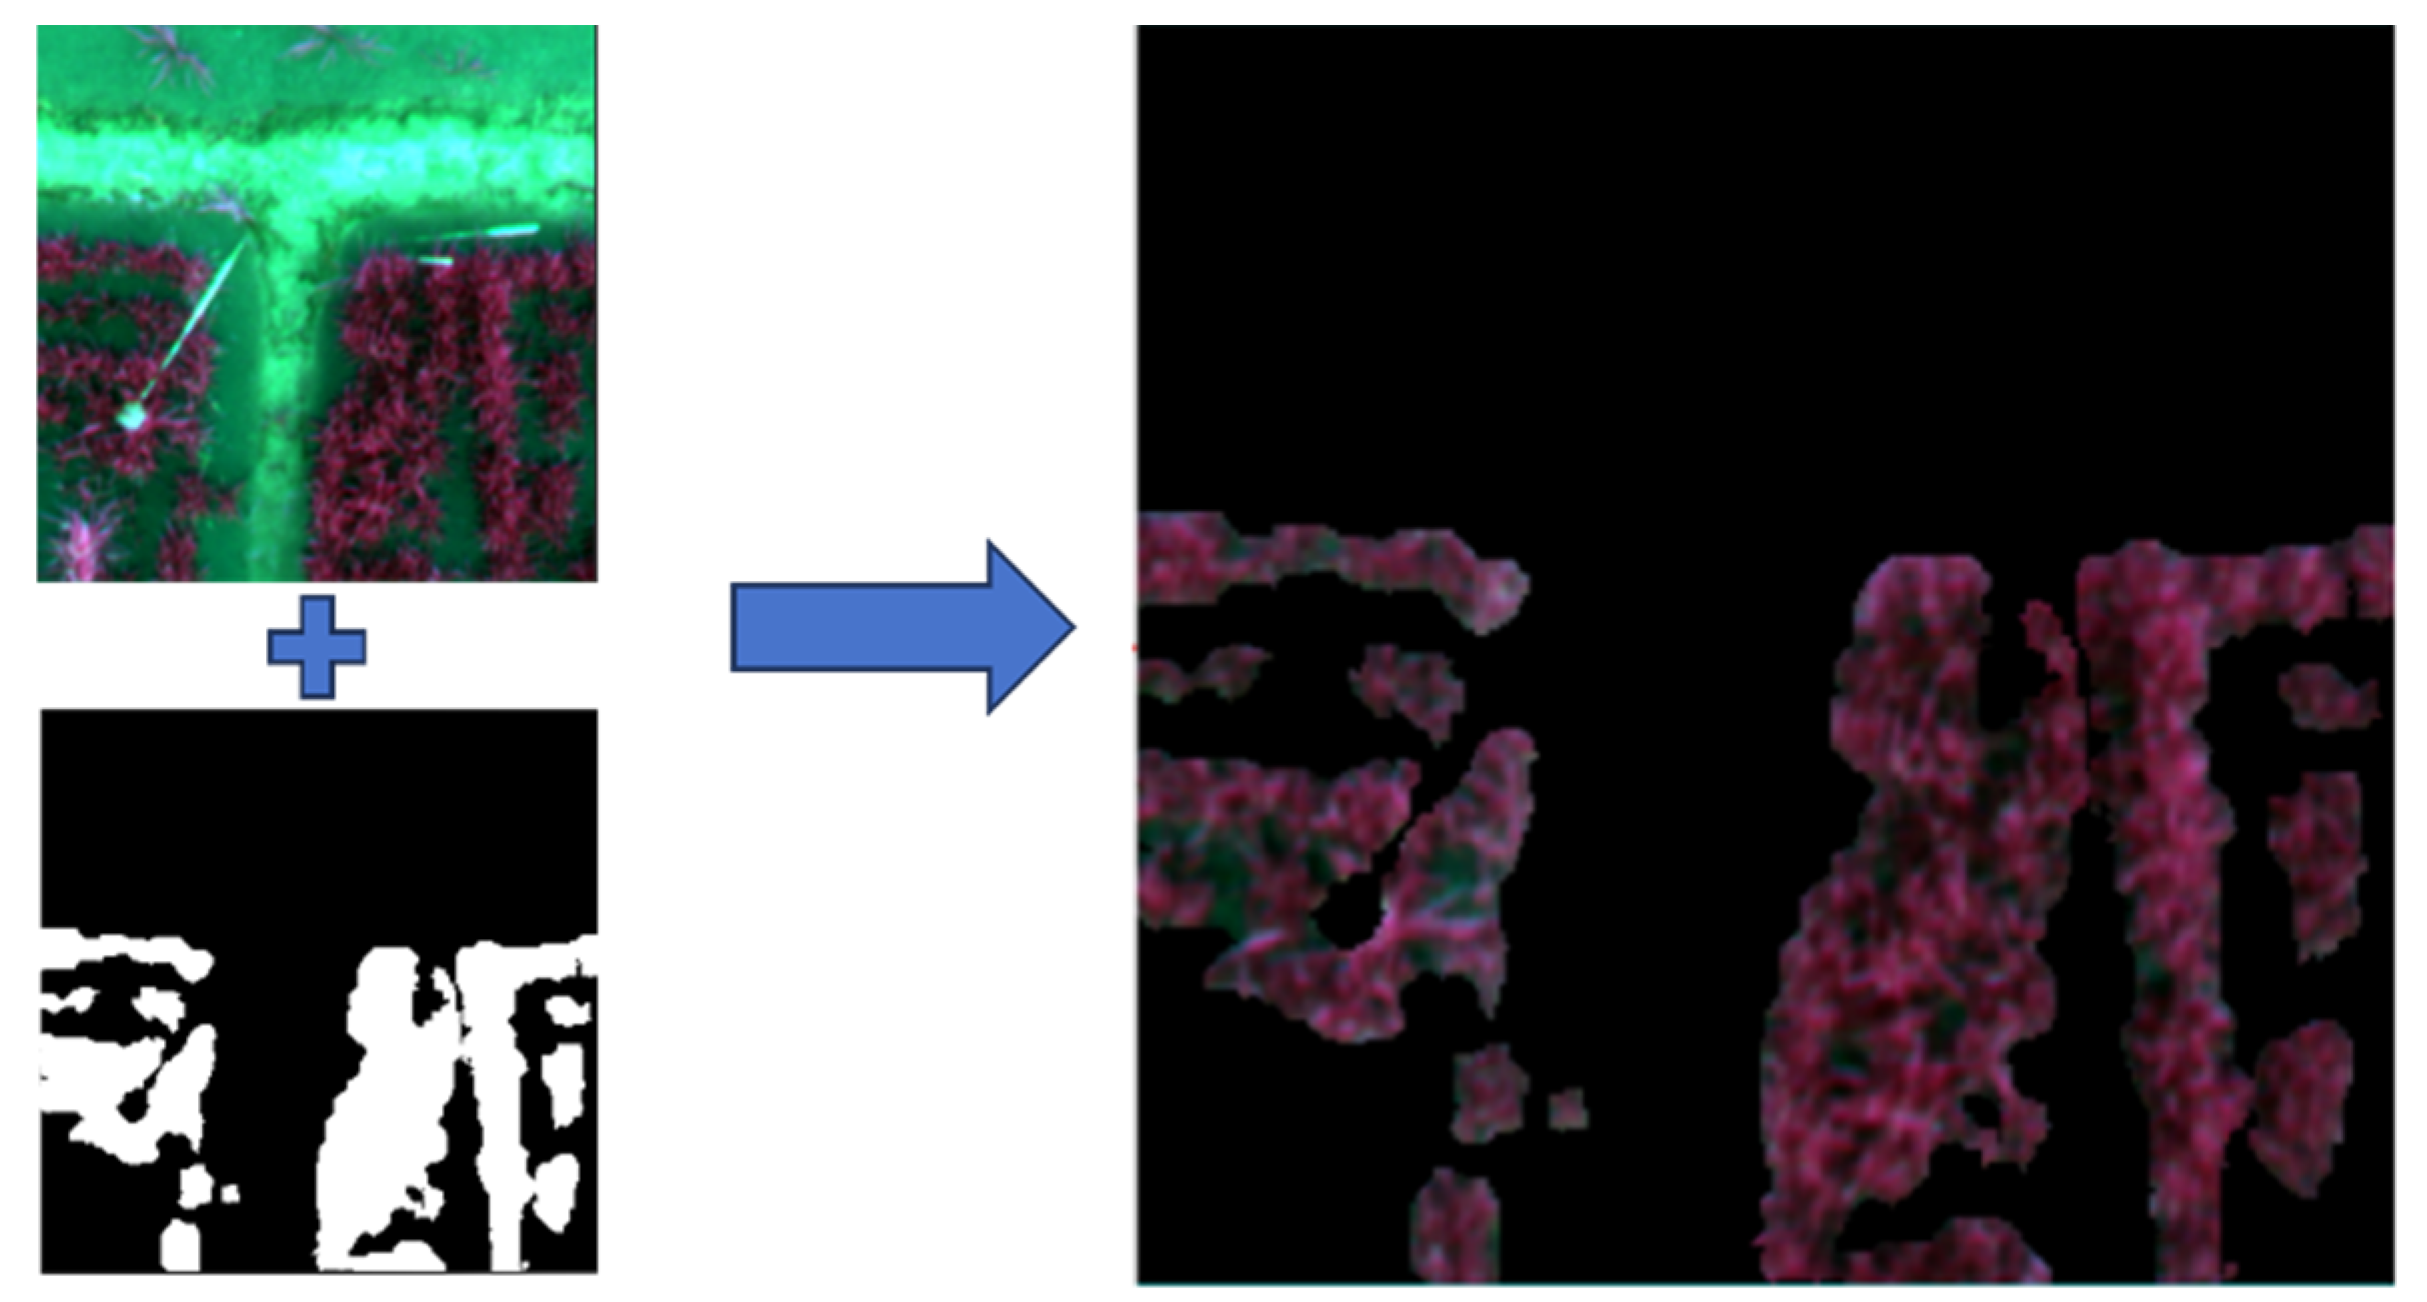
The binary mask was multiplied pixel by pixel with the original UAV multispectral image. This operation retained spectral information from canopy pixels and set background pixels to zero, producing a masked rice-canopy image (
Figure 7). Visual inspection indicated that the masked image preserved canopy boundaries and internal structure; a representative local example is shown in
Figure 8.
3.2. Multispectral Grading Dataset and Vegetation-Index Screening
The field-derived dataset comprised 1801 curated ROI samples, with 300–301 samples per class (16.66–16.71%;
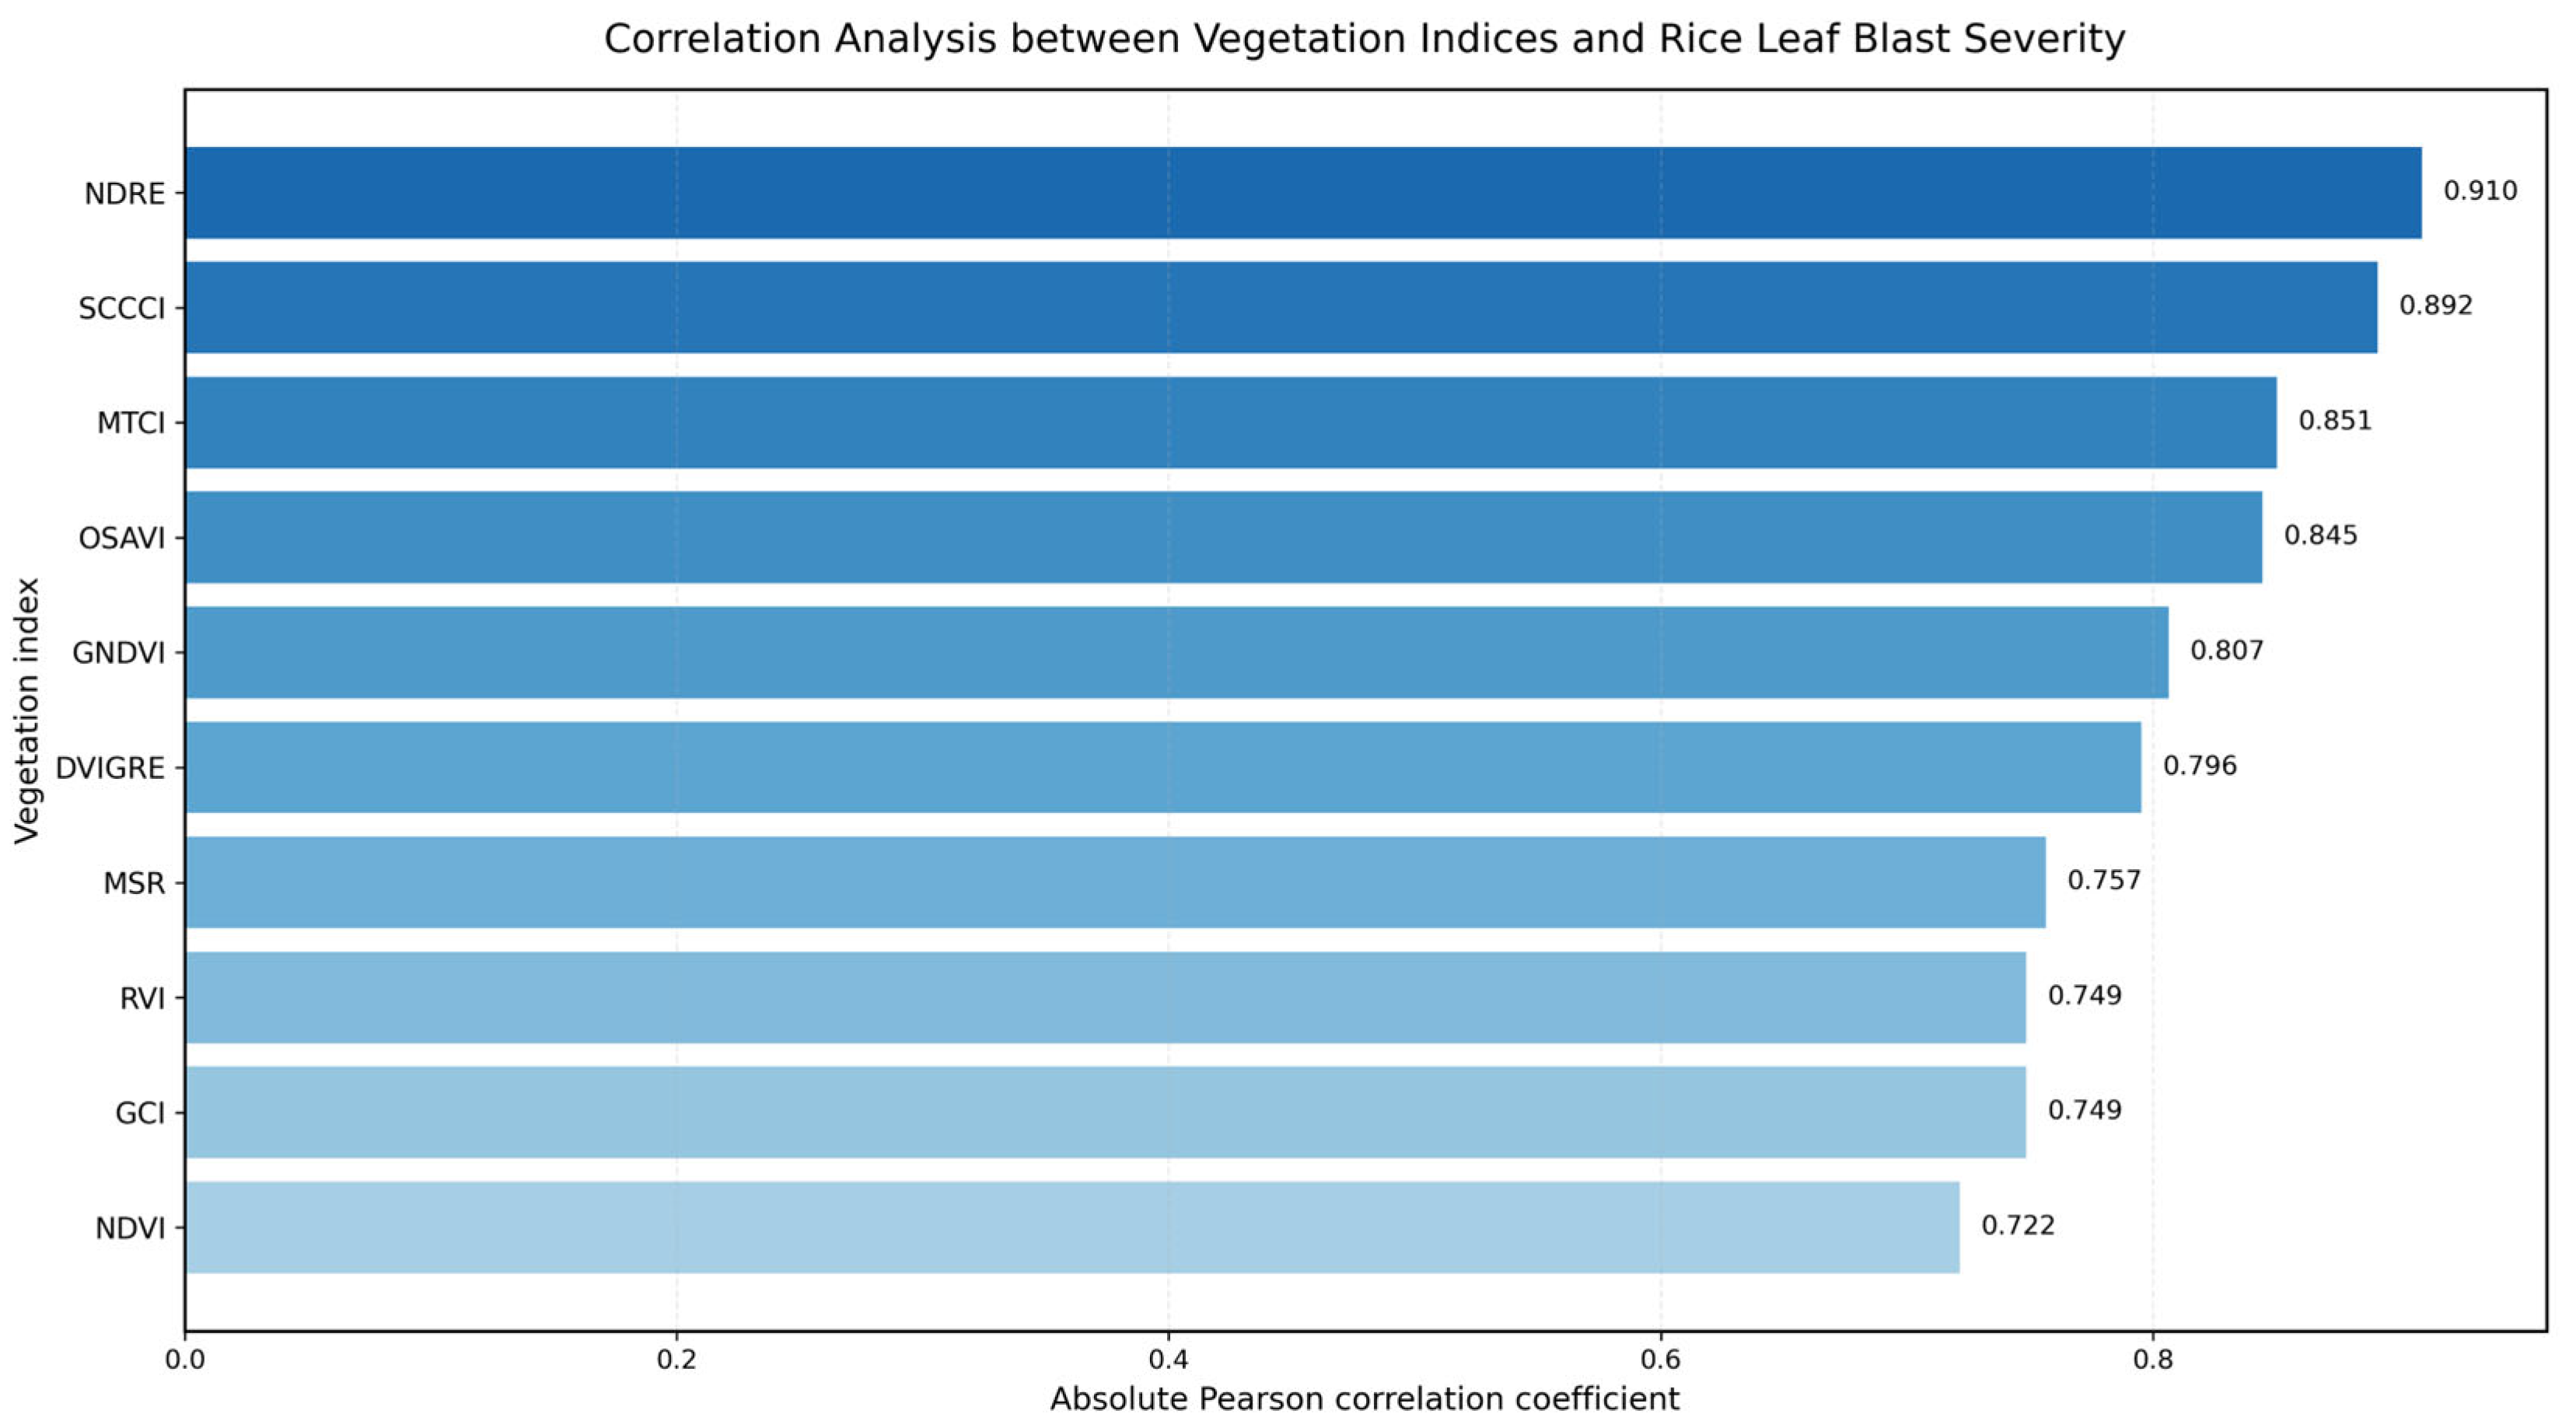
Table 6). This near-balanced distribution resulted from targeted sampling within the predefined disease-index intervals and subsequent quality screening. Twenty candidate vegetation indices were initially calculated, of which 10 indices with |r| > 0.6 were selected and combined with the four spectral bands to yield 14 predictors per ROI. The same 14-predictor feature set was used for model evaluation and spatial mapping. The balanced design enabled all six severity classes to be evaluated without majority-class dominance.
3.3. Model Performance and Ablation Results
As shown in
Table 9, the baseline 1DCNN-Transformer achieved an OA and weighted F1-score of 96.13% on the test set. Adding the improved deep branch produced a modest increase in Precision, while the remaining metrics were nearly unchanged. Thus, improving the deep branch alone provided limited benefit for the structured feature set used here.
As shown in
Table 10, under the hold-out split, the full three-branch model correctly classified 179 of 181 records, corresponding to an OA of 98.90%, weighted Precision of 98.93%, weighted Recall of 98.90%, and weighted F1-score of 98.89%. The descriptive 95% Wilson interval for OA was 96.06–99.70%. RF and GBDT were further evaluated using repeated duplicate-group-aware validation.
Across 25 duplicate-group-aware test folds, RF achieved an OA of 99.63% +/– 0.26% (95% CI: 99.52–99.74%) and a weighted F1-score of 99.63% +/– 0.26%. GBDT achieved 99.29% +/– 0.46% OA and 99.29% +/– 0.46% weighted F1, whereas equal RF-GBDT probability fusion achieved 99.33% +/– 0.43% for both metrics (
Table 11). The fusion did not differ significantly from GBDT in the paired sign test (OA and F1,
p = 0.125) and performed below RF (OA
p = 0.00027; F1
p = 0.00040). All three approaches nevertheless remained above 99% after identical feature records were confined to the same fold, supporting the conclusion that duplicate records alone did not account for the high classification performance.
Table 10.
Component and probability-fusion ablation results under the 1801-record hold-out split. Fusion weights were selected using validation data.
Table 10.
Component and probability-fusion ablation results under the 1801-record hold-out split. Fusion weights were selected using validation data.
| Component | Deep Weight | RF Weight | GBDT Weight | Validation OA | Test OA | Test F1 | Correct Samples |
|---|
| Deep | 1.00 | 0.00 | 0.00 | 98.89% | 96.13% | 96.19% | 174/181 |
| RF | 0.00 | 1.00 | 0.00 | 99.72% | 98.90% | 98.89% | 179/181 |
| GBDT | 0.00 | 0.00 | 1.00 | 99.72% | 98.90% | 98.89% | 179/181 |
| Deep + RF | 0.10 | 0.90 | 0.00 | 99.72% | 98.90% | 98.89% | 179/181 |
| Deep + GBDT | 0.10 | 0.00 | 0.90 | 99.72% | 98.90% | 98.89% | 179/181 |
| RF + GBDT | 0.00 | 0.10 | 0.90 | 99.72% | 98.90% | 98.89% | 179/181 |
| Deep + RF + GBDT | 0.10 | 0.10 | 0.80 | 99.72% | 98.90% | 98.89% | 179/181 |
Table 11.
Repeated duplicate-group-aware validation using five repetitions of five-fold StratifiedGroupKFold. Identical 14-feature vectors were constrained to the same fold; values are mean +/– SD across 25 paired folds.
Table 11.
Repeated duplicate-group-aware validation using five repetitions of five-fold StratifiedGroupKFold. Identical 14-feature vectors were constrained to the same fold; values are mean +/– SD across 25 paired folds.
| Model | OA, % | 95% CI for OA, % | Weighted F1, % |
|---|
| RF | 99.63 +/– 0.26 | 99.52–99.74 | 99.63 +/– 0.26 |
| GBDT | 99.29 +/– 0.46 | 99.10–99.48 | 99.29 +/– 0.46 |
| RF-GBDT equal fusion | 99.33 +/– 0.43 | 99.15–99.51 | 99.33 +/– 0.43 |
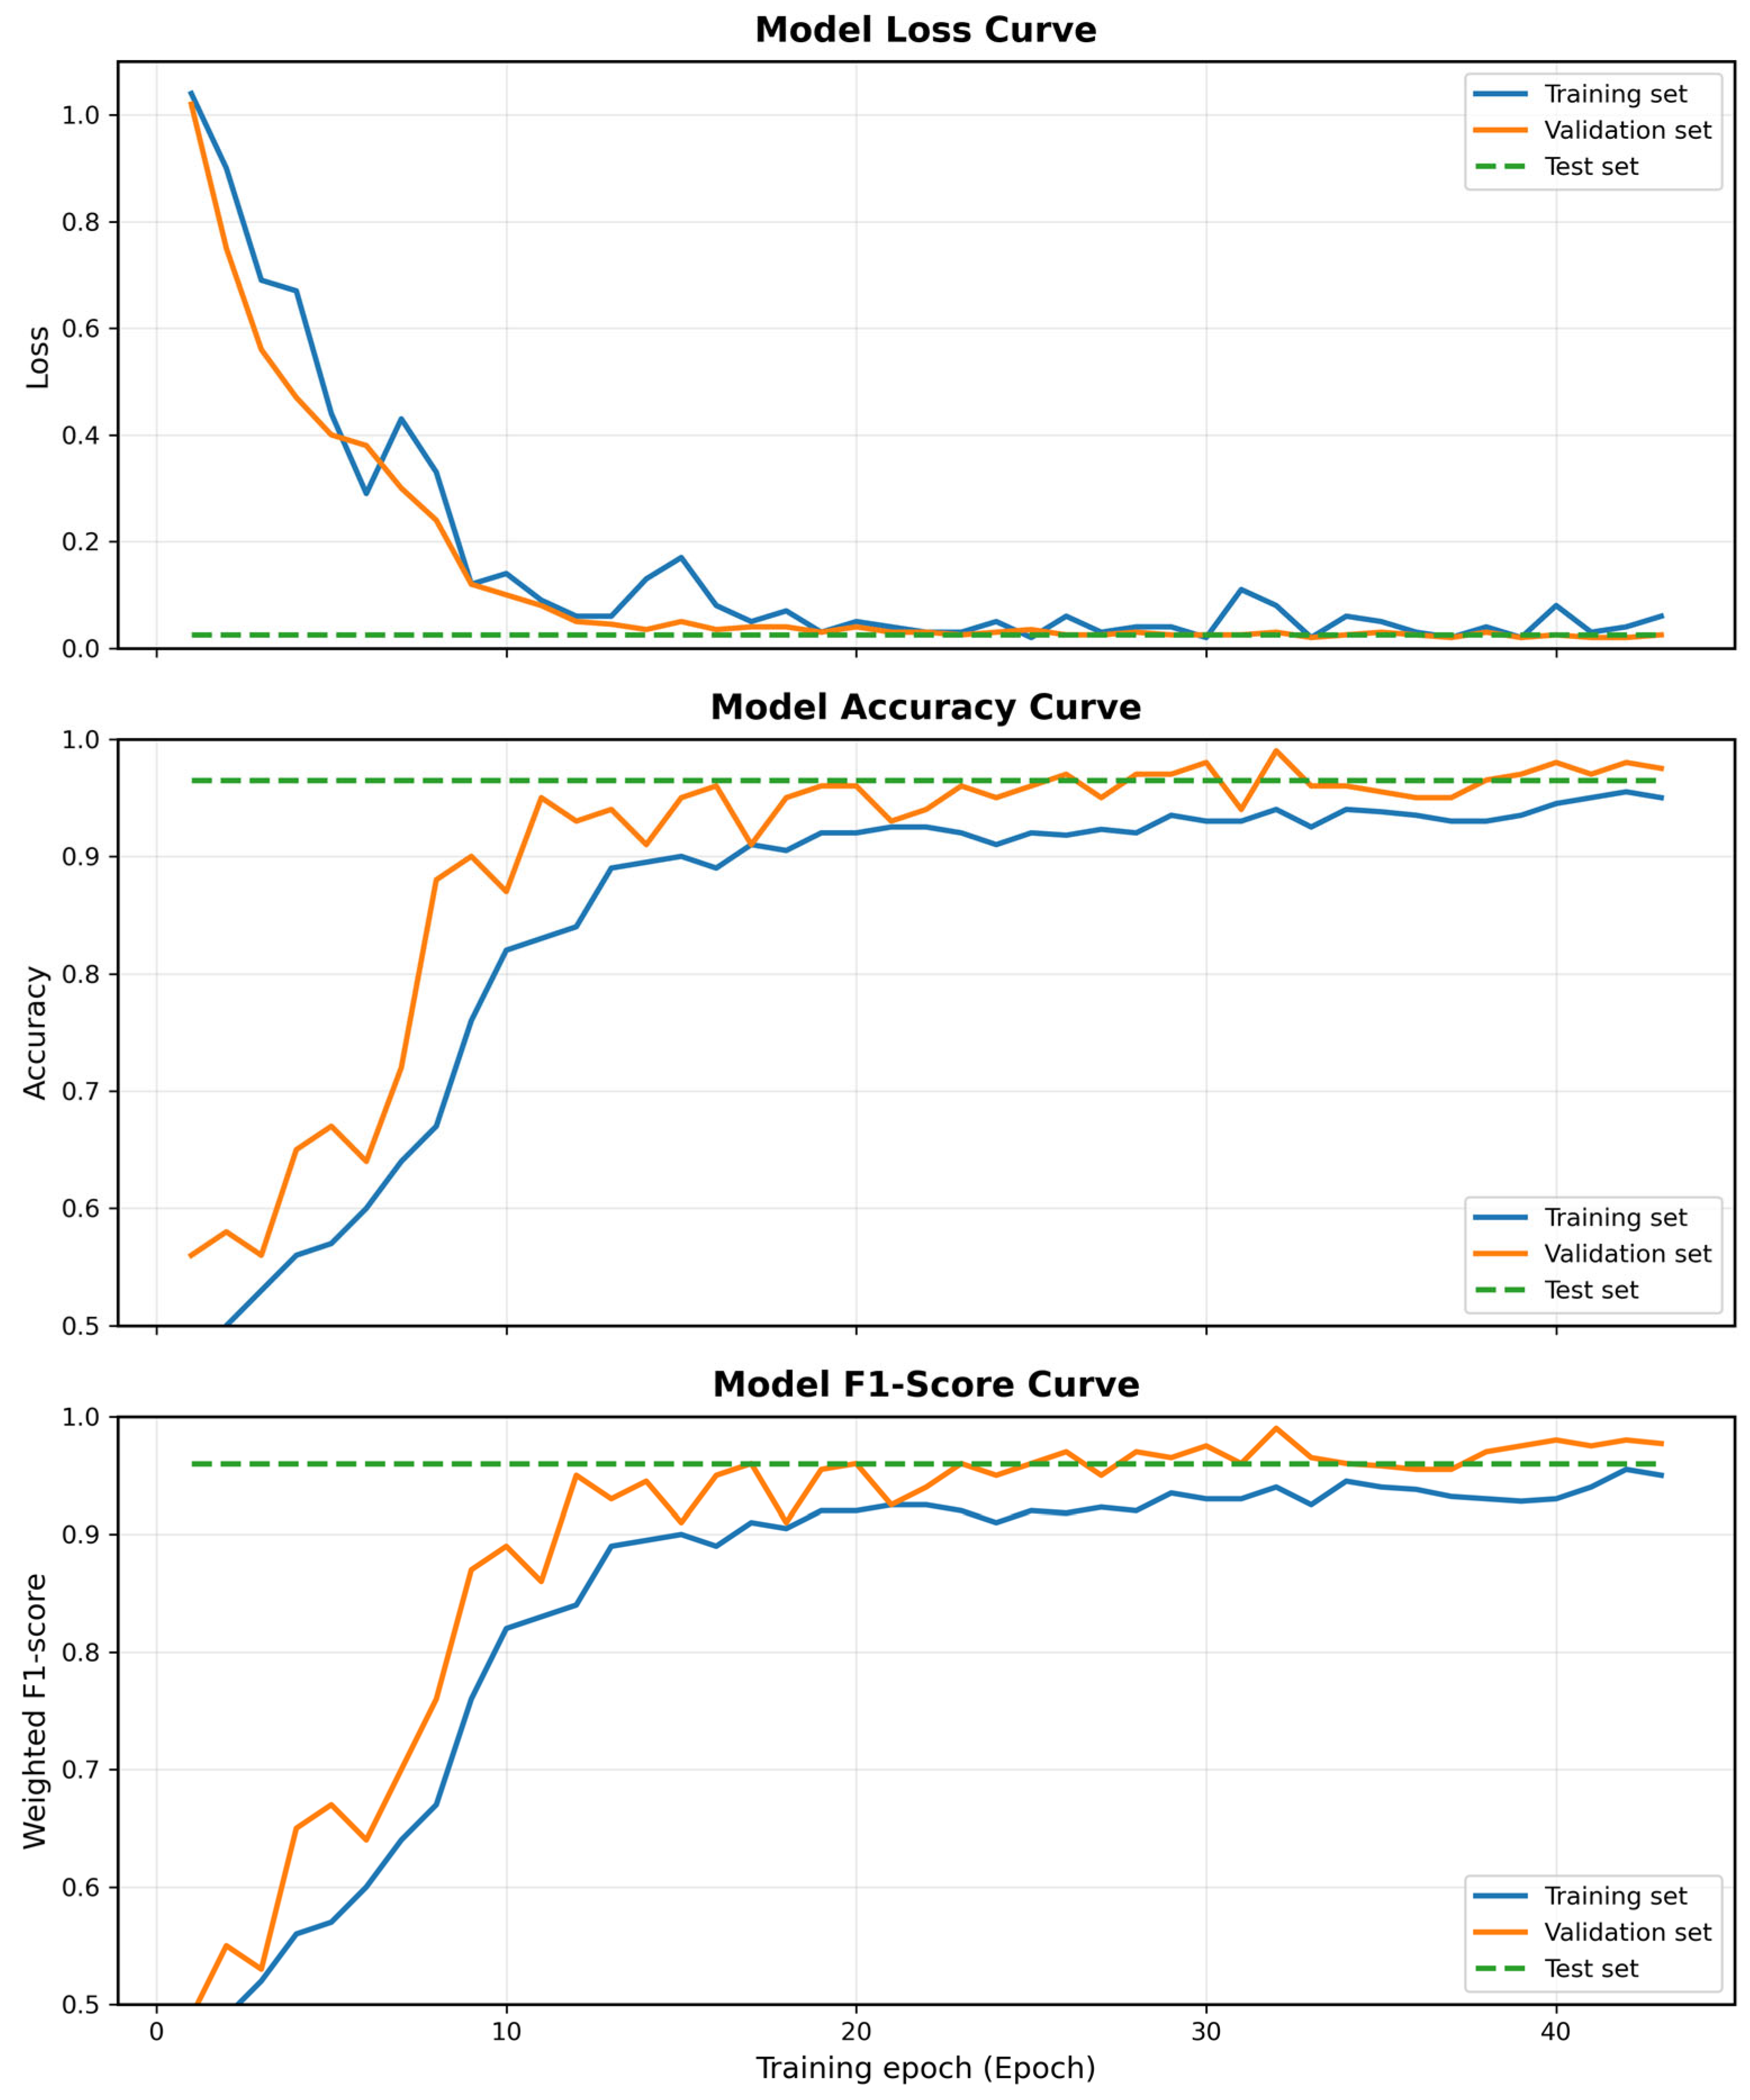
The training curves in
Figure 9 show a smooth decrease in loss and stabilization of both training and validation metrics, indicating stable optimization. The repeated duplicate-group-aware evaluation of the tree branches provided a robustness assessment under stricter record separation.
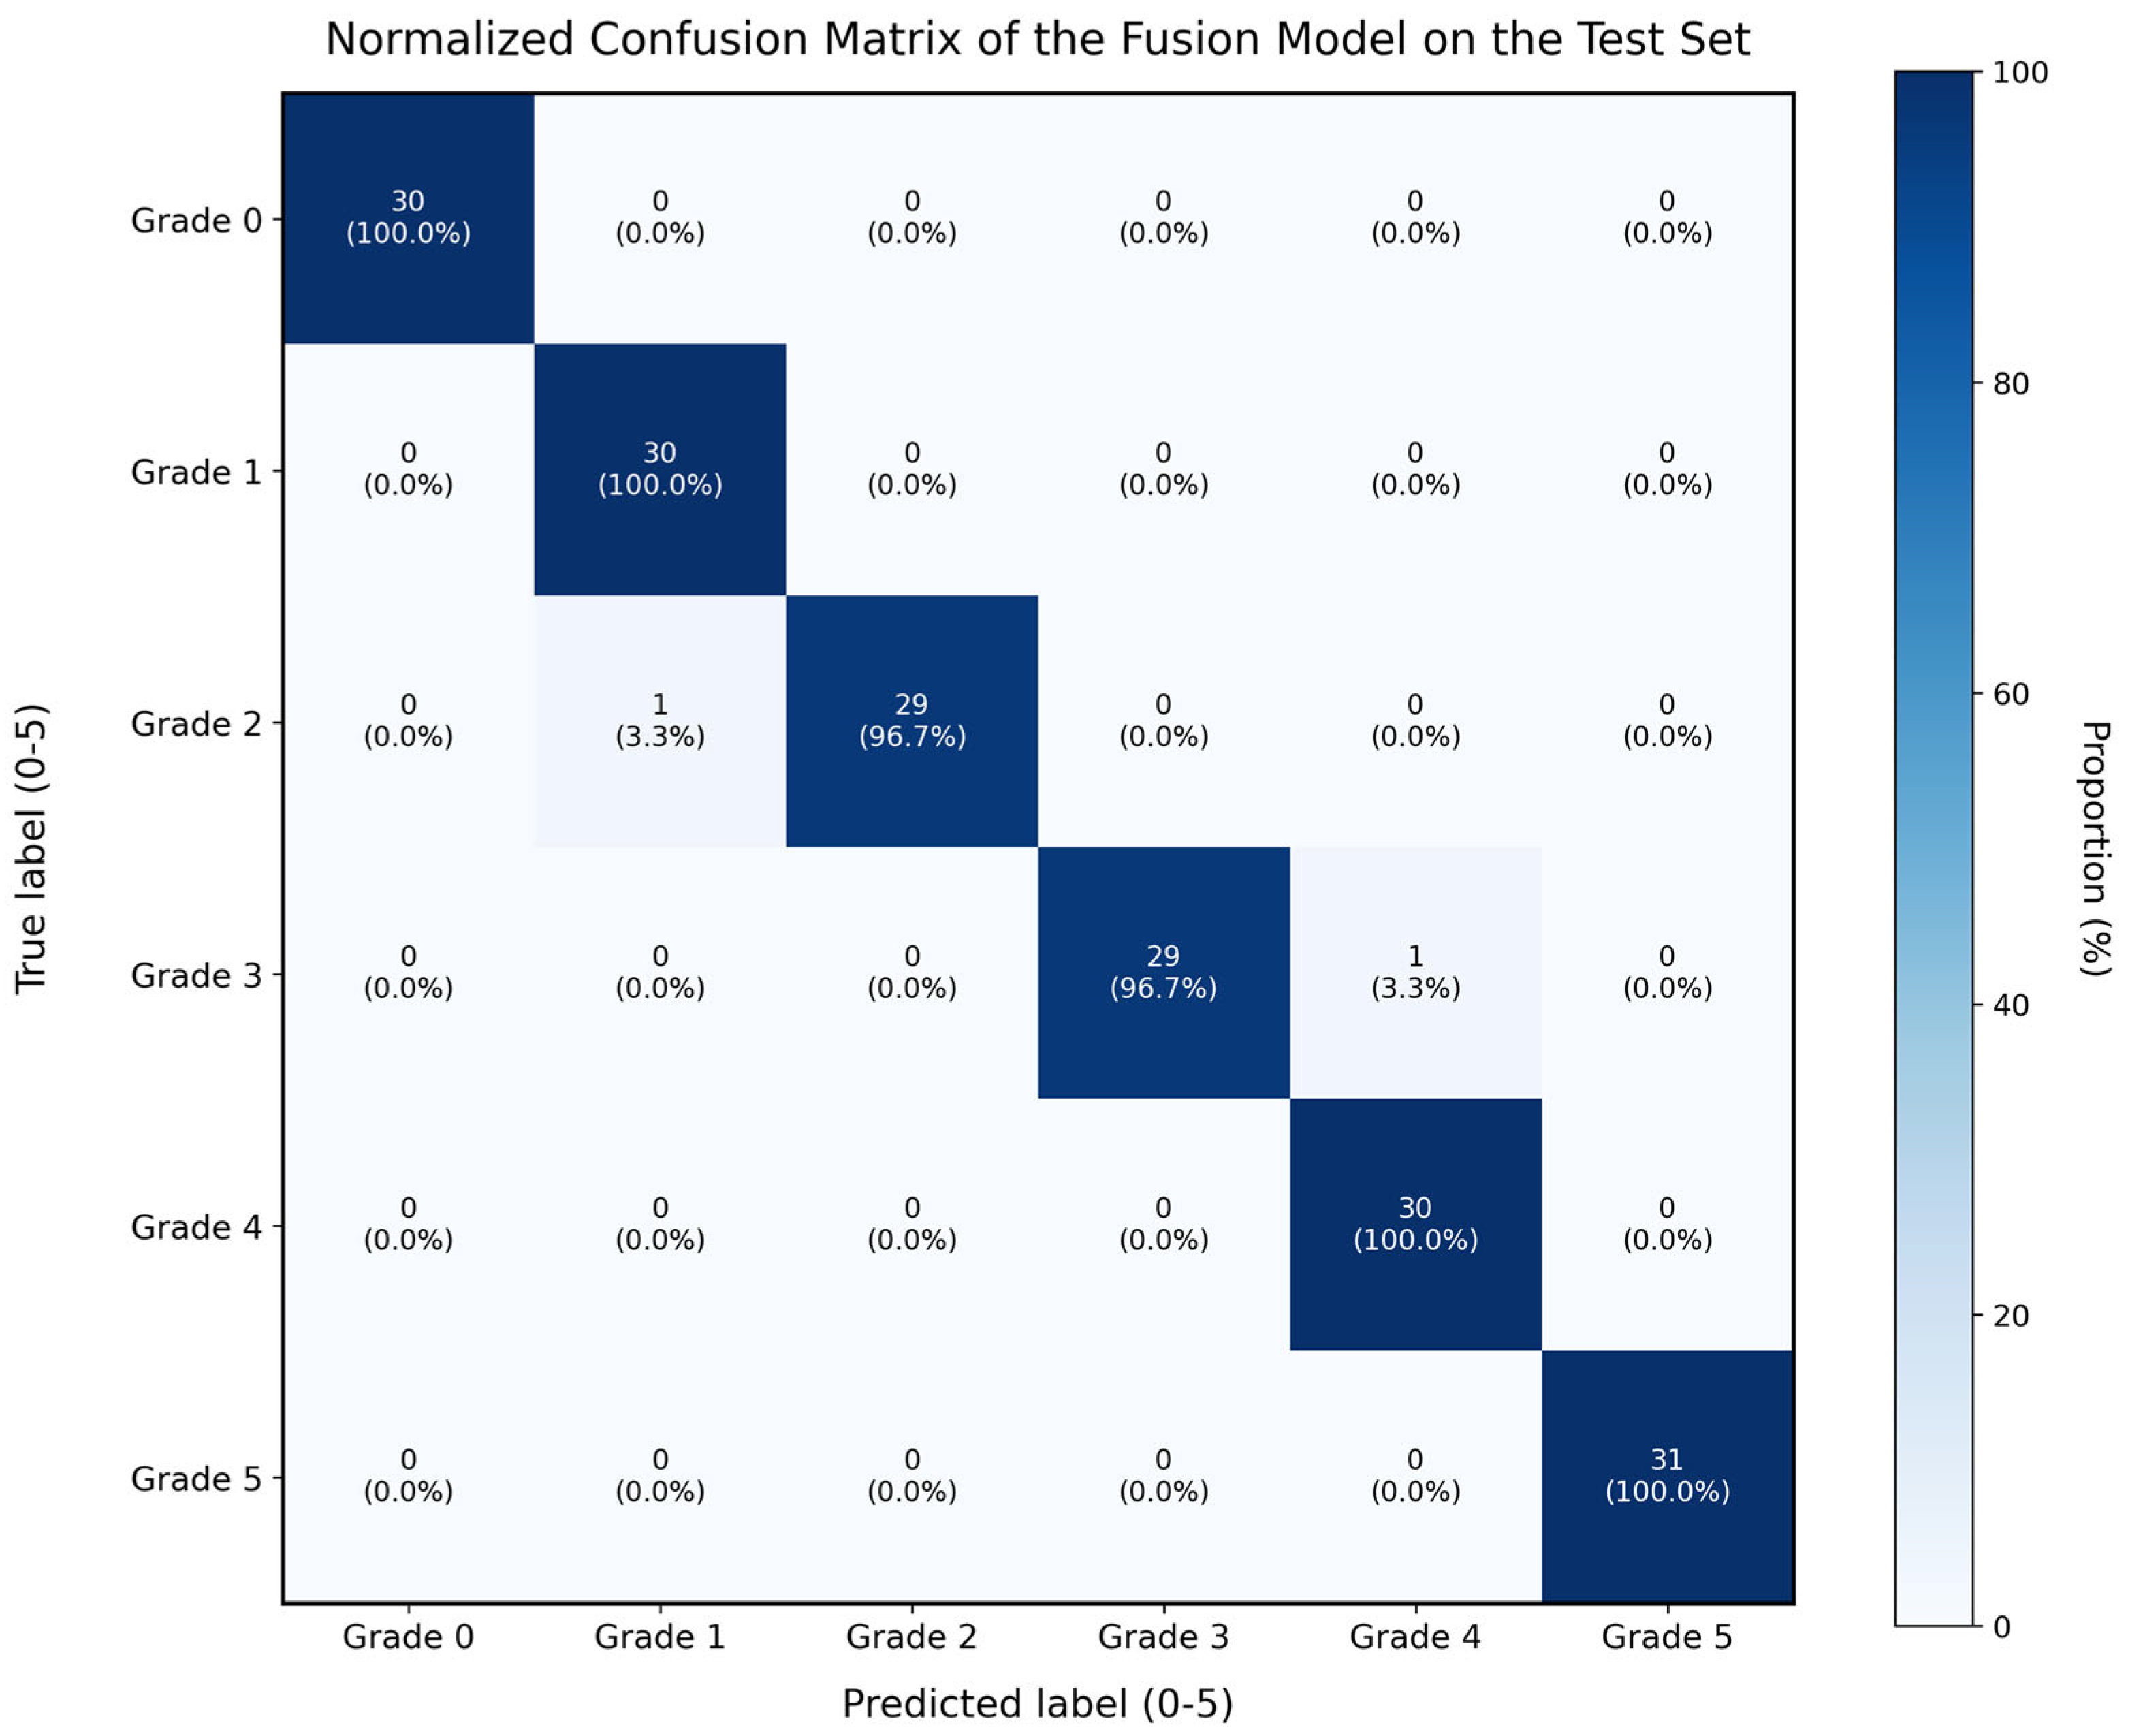
The confusion matrix was strongly concentrated along the diagonal, with 179 of 181 test ROIs correctly classified. The two misclassifications occurred between adjacent severity classes (
Figure 10).
The ablation results indicate that Inception, SE recalibration, and Focal Loss improved the deep branch, whereas RF and GBDT provided strong decision boundaries for the structured tabular inputs. Under repeated duplicate-group-aware validation, the tree-based models remained stable, with RF achieving the highest mean accuracy; RF-GBDT fusion did not statistically outperform RF.
3.4. Spatial Visualization of Rice Leaf Blast
For spatial deployment, the trained model was applied at the pixel level to UAV multispectral TIFF images. The workflow incorporated TIFF reading, pixel-level vegetation-index calculation, batch inference, and visualization while preserving the geographic metadata of the source images. Disease-severity predictions could therefore be mapped back to their field locations.
Spatial products were generated using the same 14-dimensional feature configuration employed for model development. Specifically, four original spectral bands and the 10 vegetation indices selected by Pearson correlation analysis were calculated for each valid canopy pixel. The resulting 14-feature vectors were arranged in the same order as the training data and processed in batches for pixel-level inference. This ensured consistency between ROI-level model development and field-scale spatial prediction.
For pixel-level deployment, image-derived feature vectors were assembled in a fixed order, processed in small batches to control memory use, and mapped to their original geographic coordinates. This procedure preserved image georeferencing while enabling continuous field-scale prediction.
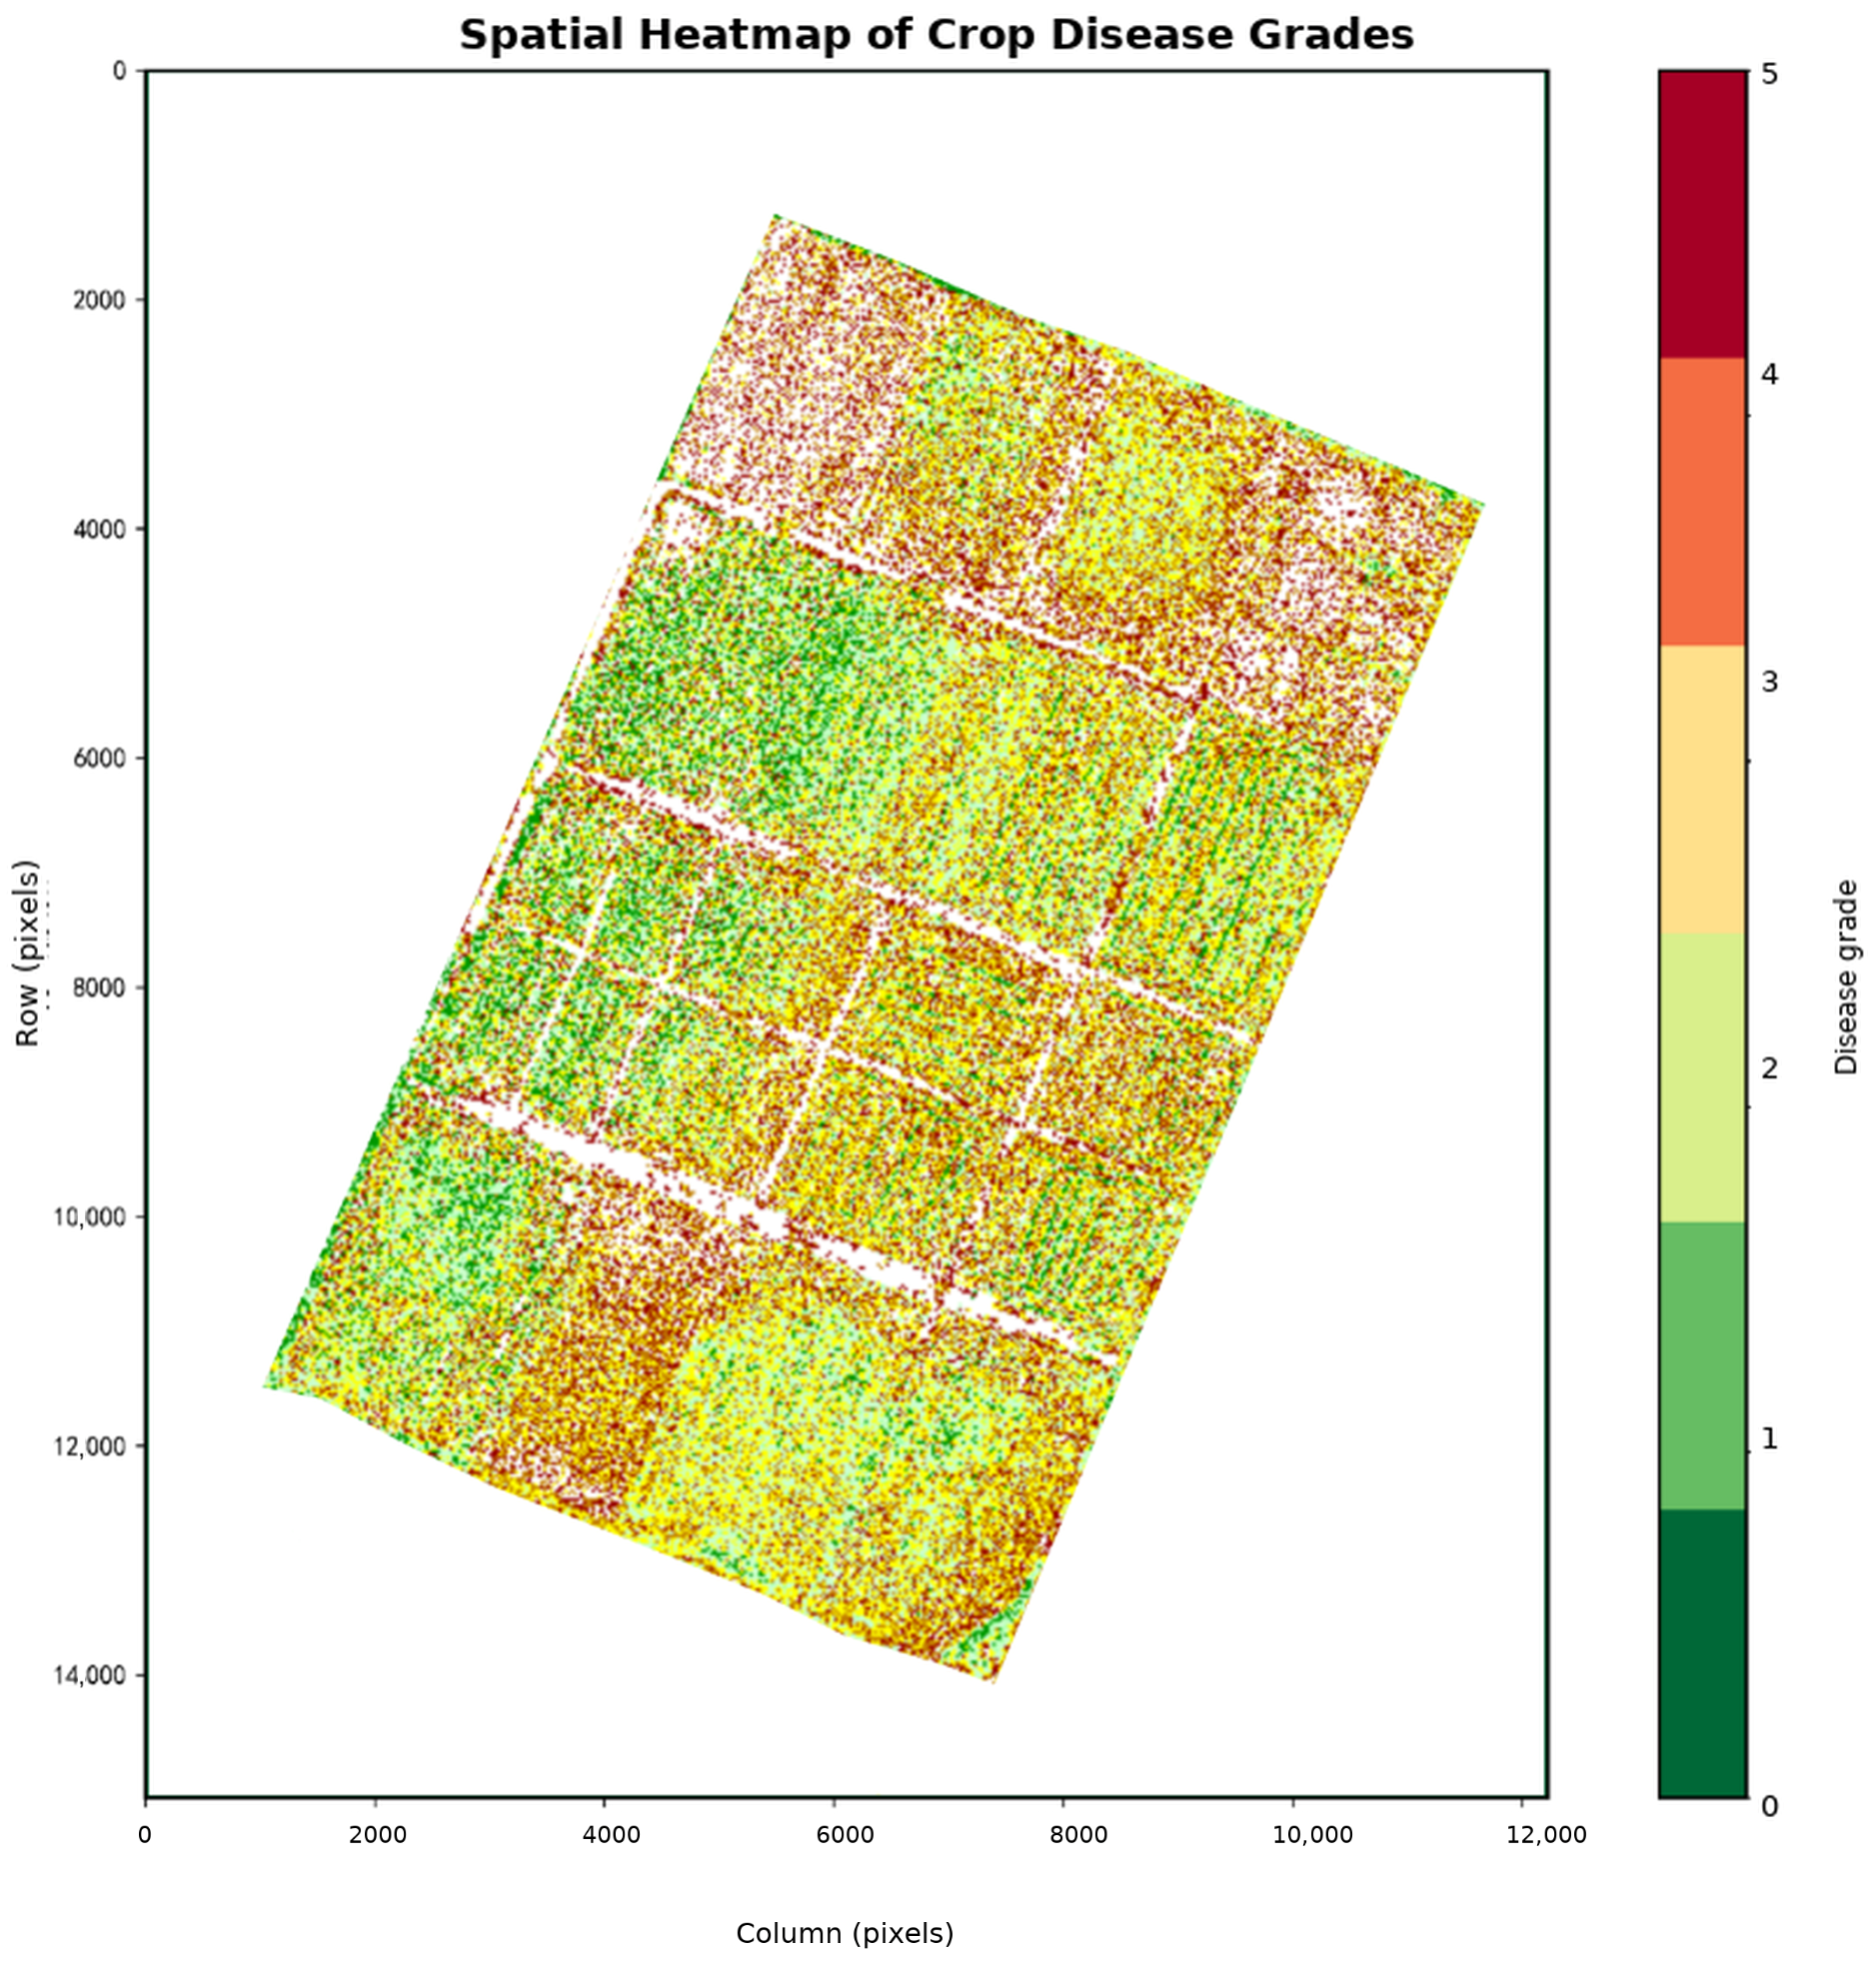
The two-dimensional severity matrix was visualized with a color map and saved as a georeferenced TIFF. Grade 0 was shown in dark green, grades 1–4 progressed from light green through yellow to light red, and grade 5 was shown in dark red (
Figure 11). In this experimental field, predicted healthy areas were concentrated mainly in the central and eastern portions, whereas higher predicted severity occurred more frequently along the western and northern edges. The map provides a spatial summary of classifier outputs under the experimental acquisition conditions.
3.5. Generation of the Variable-Rate Application Prescription Map
The disease-severity map was used to construct a variable-rate prescription map. ArcGIS spatial tools vectorized the class map, extracted grade boundaries, and calculated mapped area proportions. In the experimental field, the mapped proportions for grades 0–5 were 37.84%, 16.20%, 8.92%, 14.32%, 13.24%, and 9.45%, respectively (
Table 12). These proportions provide a compact quantitative summary of the predicted spatial disease pattern.
The prescription rule linked mapped severity classes to pesticide doses using local production practices and green-control recommendations [
10]. Using 75% tricyclazole wettable powder as the reference, the nominal range was 20–30 g/mu with water for UAV spraying: class 0 received no pesticide, class 1 received 20 g/mu, classes 2–3 received 25 g/mu, and classes 4–5 received 30 g/mu (
Table 13). These rule-based dose levels provide the operational input used to generate the prescription map.
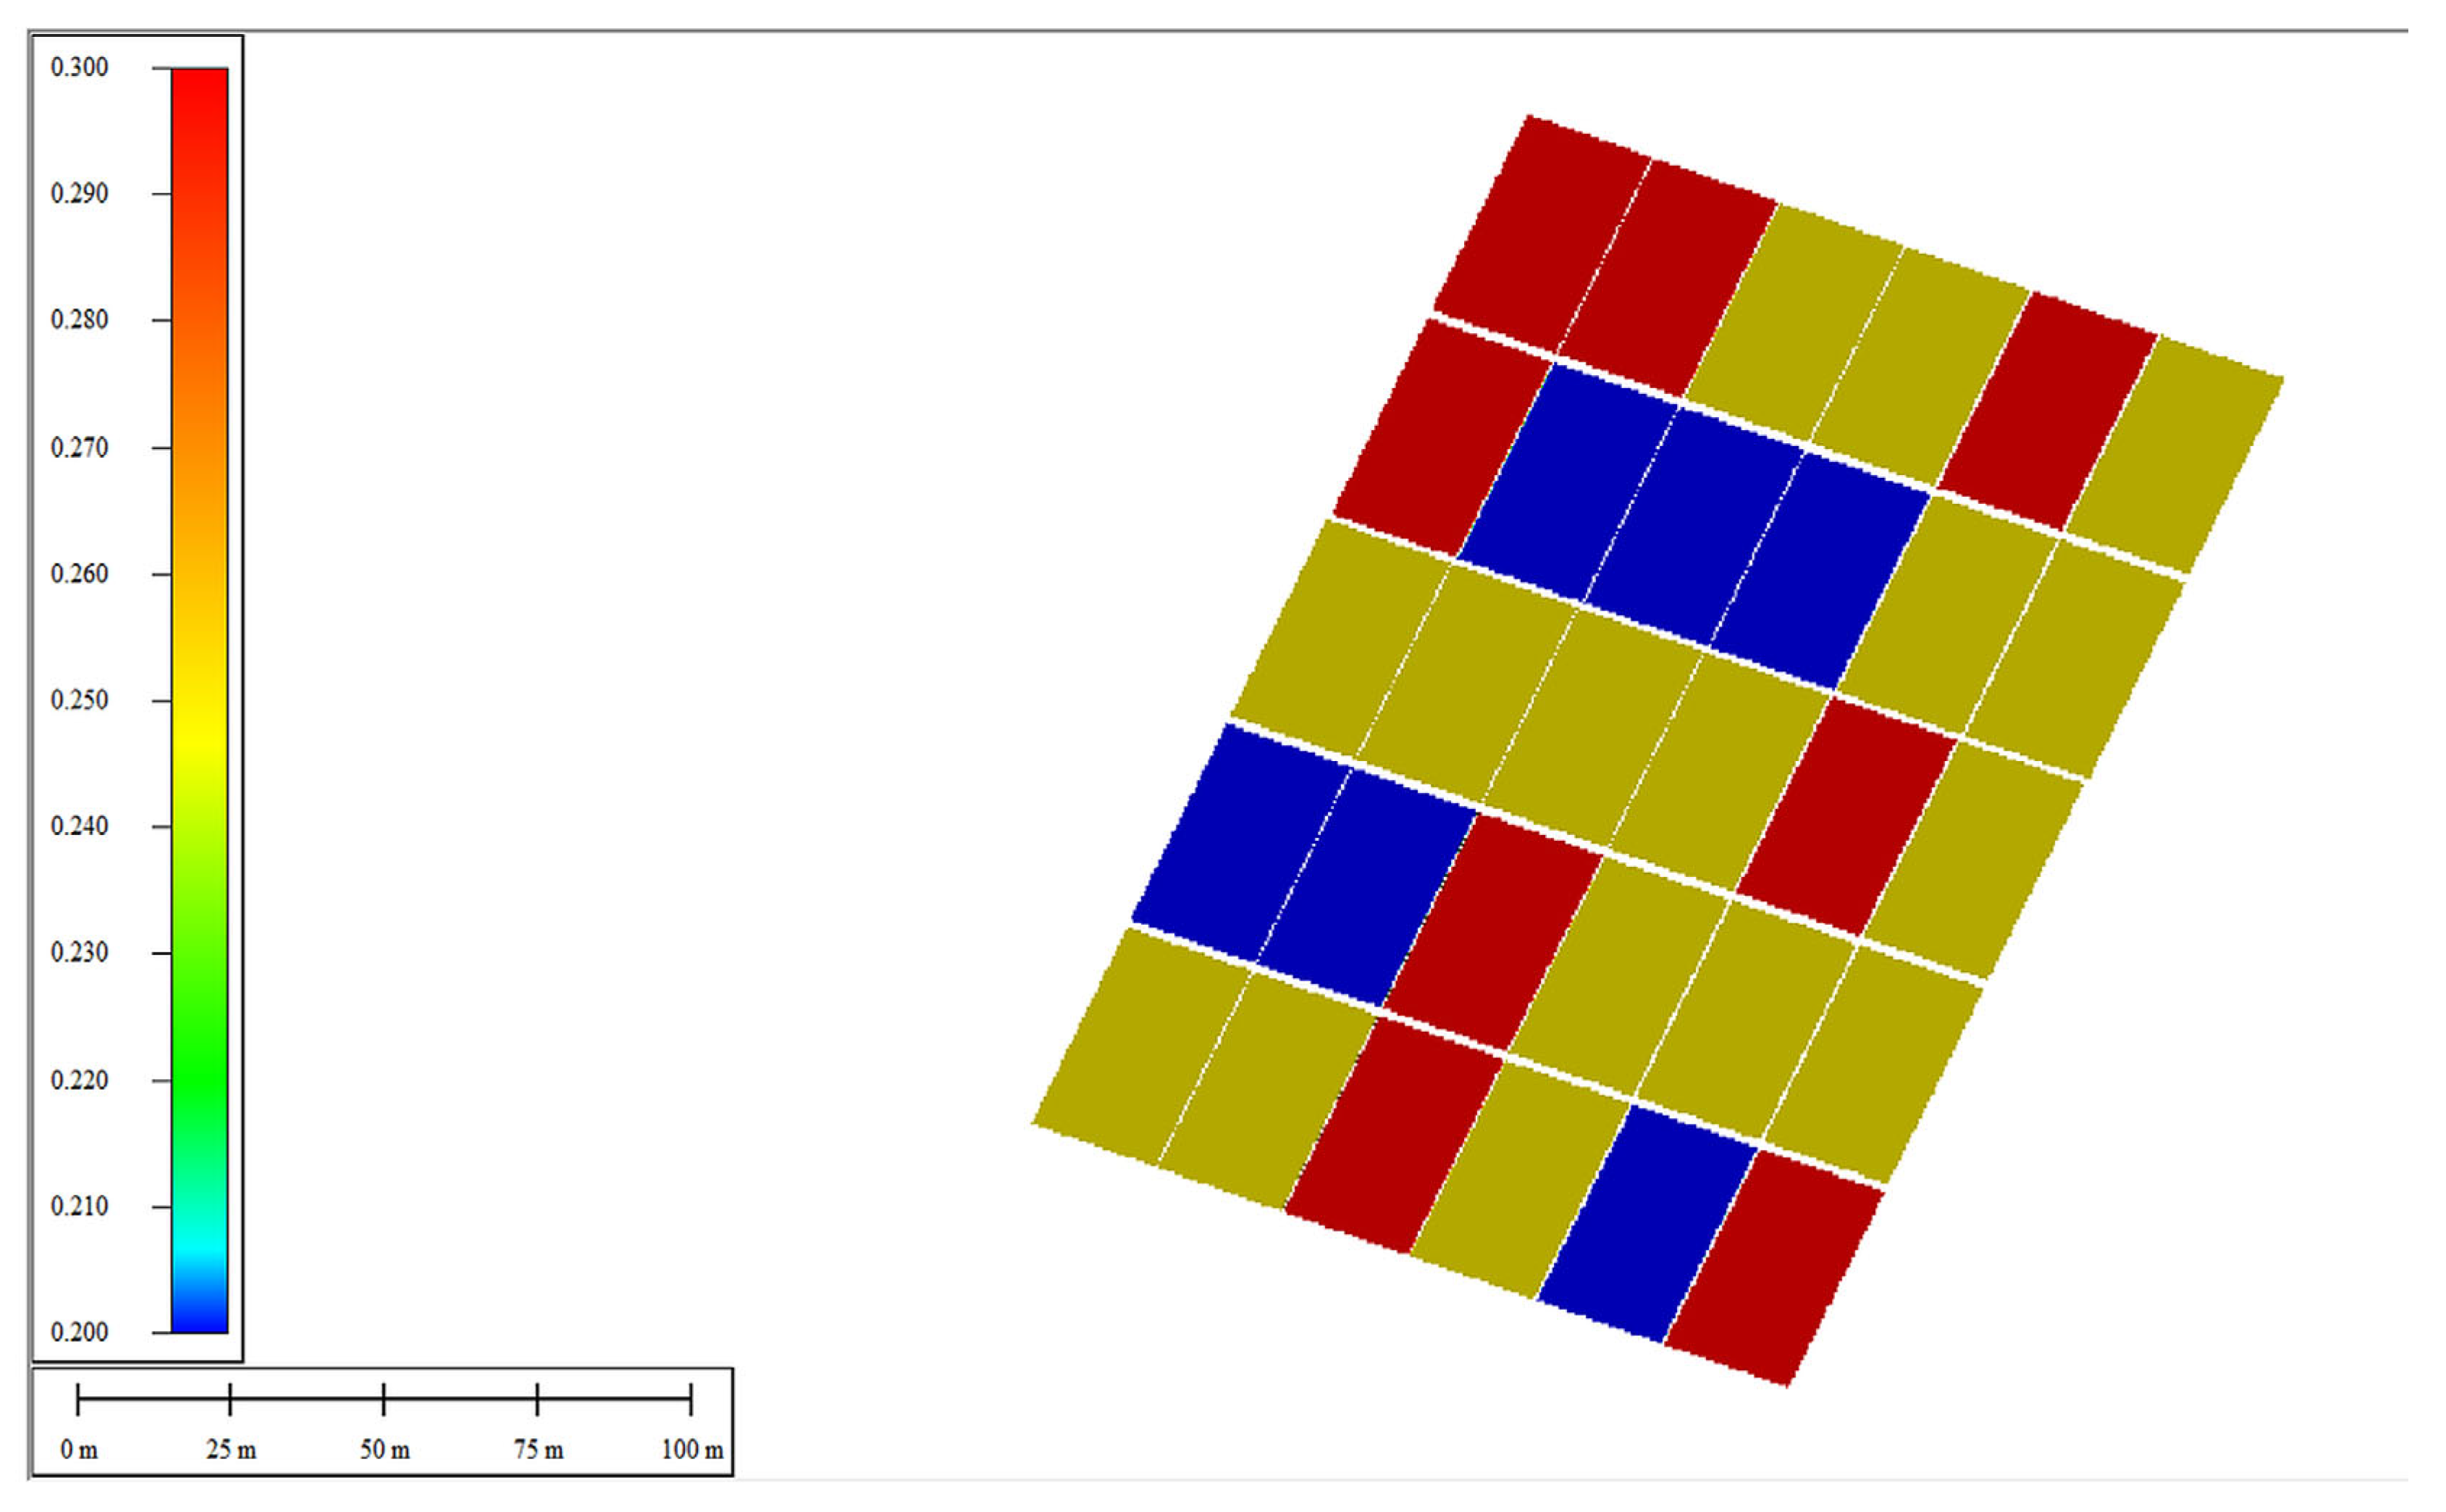
Candidate aggregation grids of 6 m × 10 m, 12 m × 16 m, 12 m × 20 m, 16 m × 32 m, and 24 m × 40 m were compared against the severity map and field layout. Smaller cells retained greater spatial detail but fragmented the operation map, whereas larger cells simplified route execution but smoothed small disease patches. The 16 m × 32 m cell provided an operational compromise that aligned with the field geometry, produced 30 manageable units, and supported swath-by-swath route planning. Flight speed, nozzle configuration, spray width, flow rate, and boundary overlap can be specified according to the operating requirements of the selected UAV platform.
Using the selected grid, the field was divided into 30 operation units, each assigned a nominal dose. Global Mapper converted the application-rate TIF into an elevation-grid format containing dose, geographic coordinates, and elevation. The file can be transferred to a DJI T60 controller through the DJI agricultural service platform or by SD card (
Figure 12). The evaluation was limited to the digital workflow from severity mapping to generation of an operational prescription file; agronomic efficacy and economic performance were outside the scope of this remote-sensing and decision-support study.
5. Conclusions
This study developed an integrated UAV multispectral workflow for grading rice leaf blast severity under controlled field induction. Image registration, band synthesis, U-Net segmentation, and mask processing reduced interference from complex paddy backgrounds, and the U-Net achieved a validation Dice coefficient of 93.36%. The dataset comprised 1801 curated 3 × 3-pixel canopy ROIs, each represented by four spectral bands and 10 selected vegetation indices (14 predictors), and supported model training, evaluation, and spatial mapping.
The improved 1DCNN-Transformer combined multi-scale Inception convolution, SE recalibration, Focal Loss, RF, GBDT, and validation-based probability weighting. The hold-out evaluation yielded OA, Precision, Recall, and weighted F1 values of 98.90%, 98.93%, 98.90%, and 98.89%, respectively. Across five repetitions of five-fold duplicate-group-aware validation, RF, GBDT, and equal RF-GBDT fusion achieved mean accuracies of 99.63%, 99.29%, and 99.33%, respectively. These consistently high grouped-validation results support strong separability among the six severity classes within the experimental acquisition domain.
The classification outputs were translated into a spatial severity map and a 16 m × 32 m prescription map containing 30 operation units. These products establish a practical digital link between UAV-based disease assessment and field-scale decision support. The resulting workflow supports disease-severity classification, spatial mapping, and prescription-file generation; future field experiments are required to evaluate agronomic efficacy and economic benefits.



 ,
,