Article

Identification of the Cinnamyl Alcohol Dehydrogenase Gene Family in Brassica U-Triangle Species and Its Potential Roles in Response to Abiotic Stress and Regulation of Seed Coat Color in Brassica napus L.

1
Integrative Science Center of Germplasm Creation in Western China (Chongqing) Science City, College of Agronomy and Biotechnology, Southwest University, Chongqing 400715, China
2
Academy of Agricultural Sciences, Southwest University, Chongqing 400715, China
3
Engineering Research Center of South Upland Agriculture, Ministry of Education, Chongqing 400715, China
*
Authors to whom correspondence should be addressed.
Plants 2025, 14(8), 1184; https://doi.org/10.3390/plants14081184
Submission received: 10 March 2025 / Revised: 5 April 2025 / Accepted: 8 April 2025 / Published: 10 April 2025
(This article belongs to the Special Issue Bioinformatics and Functional Genomics in Modern Plant Science)

Abstract

Cinnamyl alcohol dehydrogenase (CAD) is essential for lignin precursor synthesis and responses to various abiotic stresses in plants. However, the functions of CAD in Brassica species, especially in Brassica napus, remain poorly characterized. In the present study, we identified a total of 90 CAD genes across the Brassica U-triangle species, including B. rapa, B. nigra, B. oleracea, B. juncea, B. napus, and B. carinata. Comprehensive analyses of phylogenetic relationships, sequence identity, conserved motifs, gene structure, chromosomal distribution, collinearity, and cis-acting elements were performed. Based on phylogenetic analysis, these genes were categorized into four groups, designated as groups I to IV. Most of the CAD genes were implicated in mediating responses to abiotic stresses and phytohormones. Notably, members in group III, containing the bona fide CAD genes, were directly involved in lignin synthesis. Furthermore, the expression profiles of BnaCAD genes exhibited differential responses to drought, osmotic, and ABA treatments. The expression levels of the BnaCAD4a, BnaCAD4b, BnaCAD5b, and BnaCAD5d genes were detected and found to be significantly lower in yellow-seeded B. napus compared to the black-seeded ones. This study provides a comprehensive characterization of CAD genes in Brassica U-triangle species and partially validates their functions in B. napus, thereby contributing to a better understanding of their roles. The insights gained are expected to facilitate the breeding of yellow-seeded B. napus cultivars with enhanced stress tolerance and desirable agronomic traits.

1. Introduction

The Brassica genus is a globally significant crop system, providing essential commodities such as fresh vegetables, livestock fodder, edible oil, and biodiesel feedstock [1]. The U-triangle model, encompassing three diploid ancestors (B. rapa, B. oleracea, and B. nigra) and three allotetraploid species (B. napus, B. carinata, and B. juncea), serves as a conceptual framework for investigating evolutionary trajectories and polyploidization dynamics within the genus [2]. The chromosome-scale genomes of these species have been assembled, and numerous gene families have been identified [3,4,5,6,7,8].
Rapeseed (B. napus, 2n = 38, AACC) is an important allotetraploid species, originating from natural interspecific hybridization between B. rapa (AA, 2n = 20) and B. oleracea (CC, 2n = 18) [2]. As a dual-purpose oilseed crop, B. napus provides both oil and protein resources and constitutes a critical agricultural commodity with significant global economic importance [9]. Therefore, developing B. napus cultivars with high quality and enhanced resistance has become a key breeding objective. Primarily, yellow-seeded B. napus varieties are characterized by higher oil content and lower polyphenolic substances [10]. Within the Brassicaceae family, reduced lignin deposition is closely associated with lighter seed coat pigmentation [11], a relationship exemplified by B. napus, in which lignin has been demonstrated to play a negative role in the development of yellow-seeded phenotypes [12]. Moreover, enhancing stress resistance is pivotal for mitigating the persistent threats to production, since abiotic stresses, particularly drought and osmotic stress, severely impair rapeseed yield and quality by impeding growth, pollination, and seed filling [13]. Some phytohormones are crucial in stimulating plant resistance to adverse environmental conditions [14]. Consequently, elucidating the regulatory mechanisms underlying the responses of B. napus to abiotic stresses and phytohormones holds substantial significance for improving the stress tolerance of this crop.
Lignin synthesis in the seed coat of B. napus is orchestrated by a coordinated enzymatic network, including cinnamyl alcohol dehydrogenase (CAD), p-coumarate-CoA ligase (4CL), and ferulate 5-hydroxylase (F5H), and others [15]. Among these enzymes, CAD catalyzes the last step in the synthesis of precursors of the H (hydroxyphenyl), G (guaiacyl), and S (syringyl) lignin monomer units, thereby modulating both lignin content and composition [16]. CAD genes have been identified and characterized in various plant species, such as Arabidopsis thaliana (thale cress) [17], Morus alba (mulberry) [18], Cucumis melo (melon) [19], Elaeis guineensis (oil palm) [20], Populus przewalskii (poplar) [21], and Oryza sativa (rice) [22]. In angiosperms, CAD genes are categorized into two primary functional types. The first category comprises bona fide CAD genes directly involved in lignin synthesis [23], such as AtCAD4 and AtCAD5 in A. thaliana [17], EgCAD2 in Eucalyptus spp. (eucalyptus) [24], OsCAD2 in rice [25], and ZmCAD2 in Zea mays (maize) [26]. Conversely, the second category includes genes predominantly associated with plant defense mechanisms against abiotic or biotic stresses [17]. For example, the expression of AtCAD7 and AtCAD8 in A. thaliana is induced by elicitor treatments and infection with Pseudomonas syringae [27]; IbCAD1 in Ipomoea batatas (sweet potato) is involved in both jasmonic acid (JA)- and salicylic acid (SA)-mediated damage responses, as well as abscisic acid (ABA)-mediated cold responses [28]. Despite extensive research on CAD genes across various species, the identification and functional analysis of the gene family in the Brassica U-triangle species, particularly in B. napus, have yet to be fully explored.
Here, we identified a total of 90 CAD genes in the Brassica U-triangle species and performed a comprehensive analysis of their phylogenetic relationships, sequence identity, conserved motifs, gene structure, chromosomal distribution, collinearity, and cis-acting elements. Additionally, we first analyzed the expression profiles of BnaCAD genes in Zhongshuang 11 (ZS11, B. napus) under drought, osmotic, and ABA treatments. Subsequently, we analyzed the expression levels of some BnaCAD genes in yellow- and black-seeded B. napus, revealing significant differences in their expression patterns. These findings provide a foundation for the breeding of yellow-seeded B. napus cultivars with enhanced stress tolerance and desirable agronomic traits.

2. Results

2.1. Identification of CAD Family Genes in the Brassica U-Triangle Species

A total of 90 CAD proteins were identified across six species in the Brassica U-triangle model using TBtools, including 15 in B. rapa, 8 in B. nigra, 11 in B. oleracea, 19 in B. juncea, 19 in B. napus, and 18 in B. carinata (Table S1). Reliable phylogenetic comparison of AtCAD3 (AT2G21890.1) homologs within the Brassica U-triangle species was precluded due to two evolutionary constraints, namely the accelerated divergence rates complicating ortholog identification [29] and A. thaliana-specific genomic reorganization resulting in the loss of AtCAD3 via segregation distortion [30]. Consequently, the CAD proteins were classified into eight distinct subgroups (CAD1–2 and CAD4–9) based on their sequence similarity to the remaining AtCAD paralogs (AtCAD1–9, excluding AtCAD3) through BLAST analysis. Within each CAD subgroup, proteins were assigned alphabetical suffixes (a, b, c, etc.) based on the ascending numerical order of chromosomal locations, with lower numerical values corresponding to the earlier alphabetical letters. As shown in Table S1, the number of amino acid residues of the 90 CAD proteins ranged from 263 (BolCAD7b) to 631 (BjuCAD1a). The molecular weights (MWs) of these proteins varied from 28.59 kDa (BolCAD7b) to 68.69 kDa (BjuCAD1a), with an average of 43.00 kDa. The isoelectric point (pI) ranged from 5.23 (BraCAD4b) to 9.27 (BjuCAD1a). Notably, BjuCAD1a is the only member predicted to localize to the cytoplasm or chloroplasts, whereas all other CAD proteins are cytoplasmic.

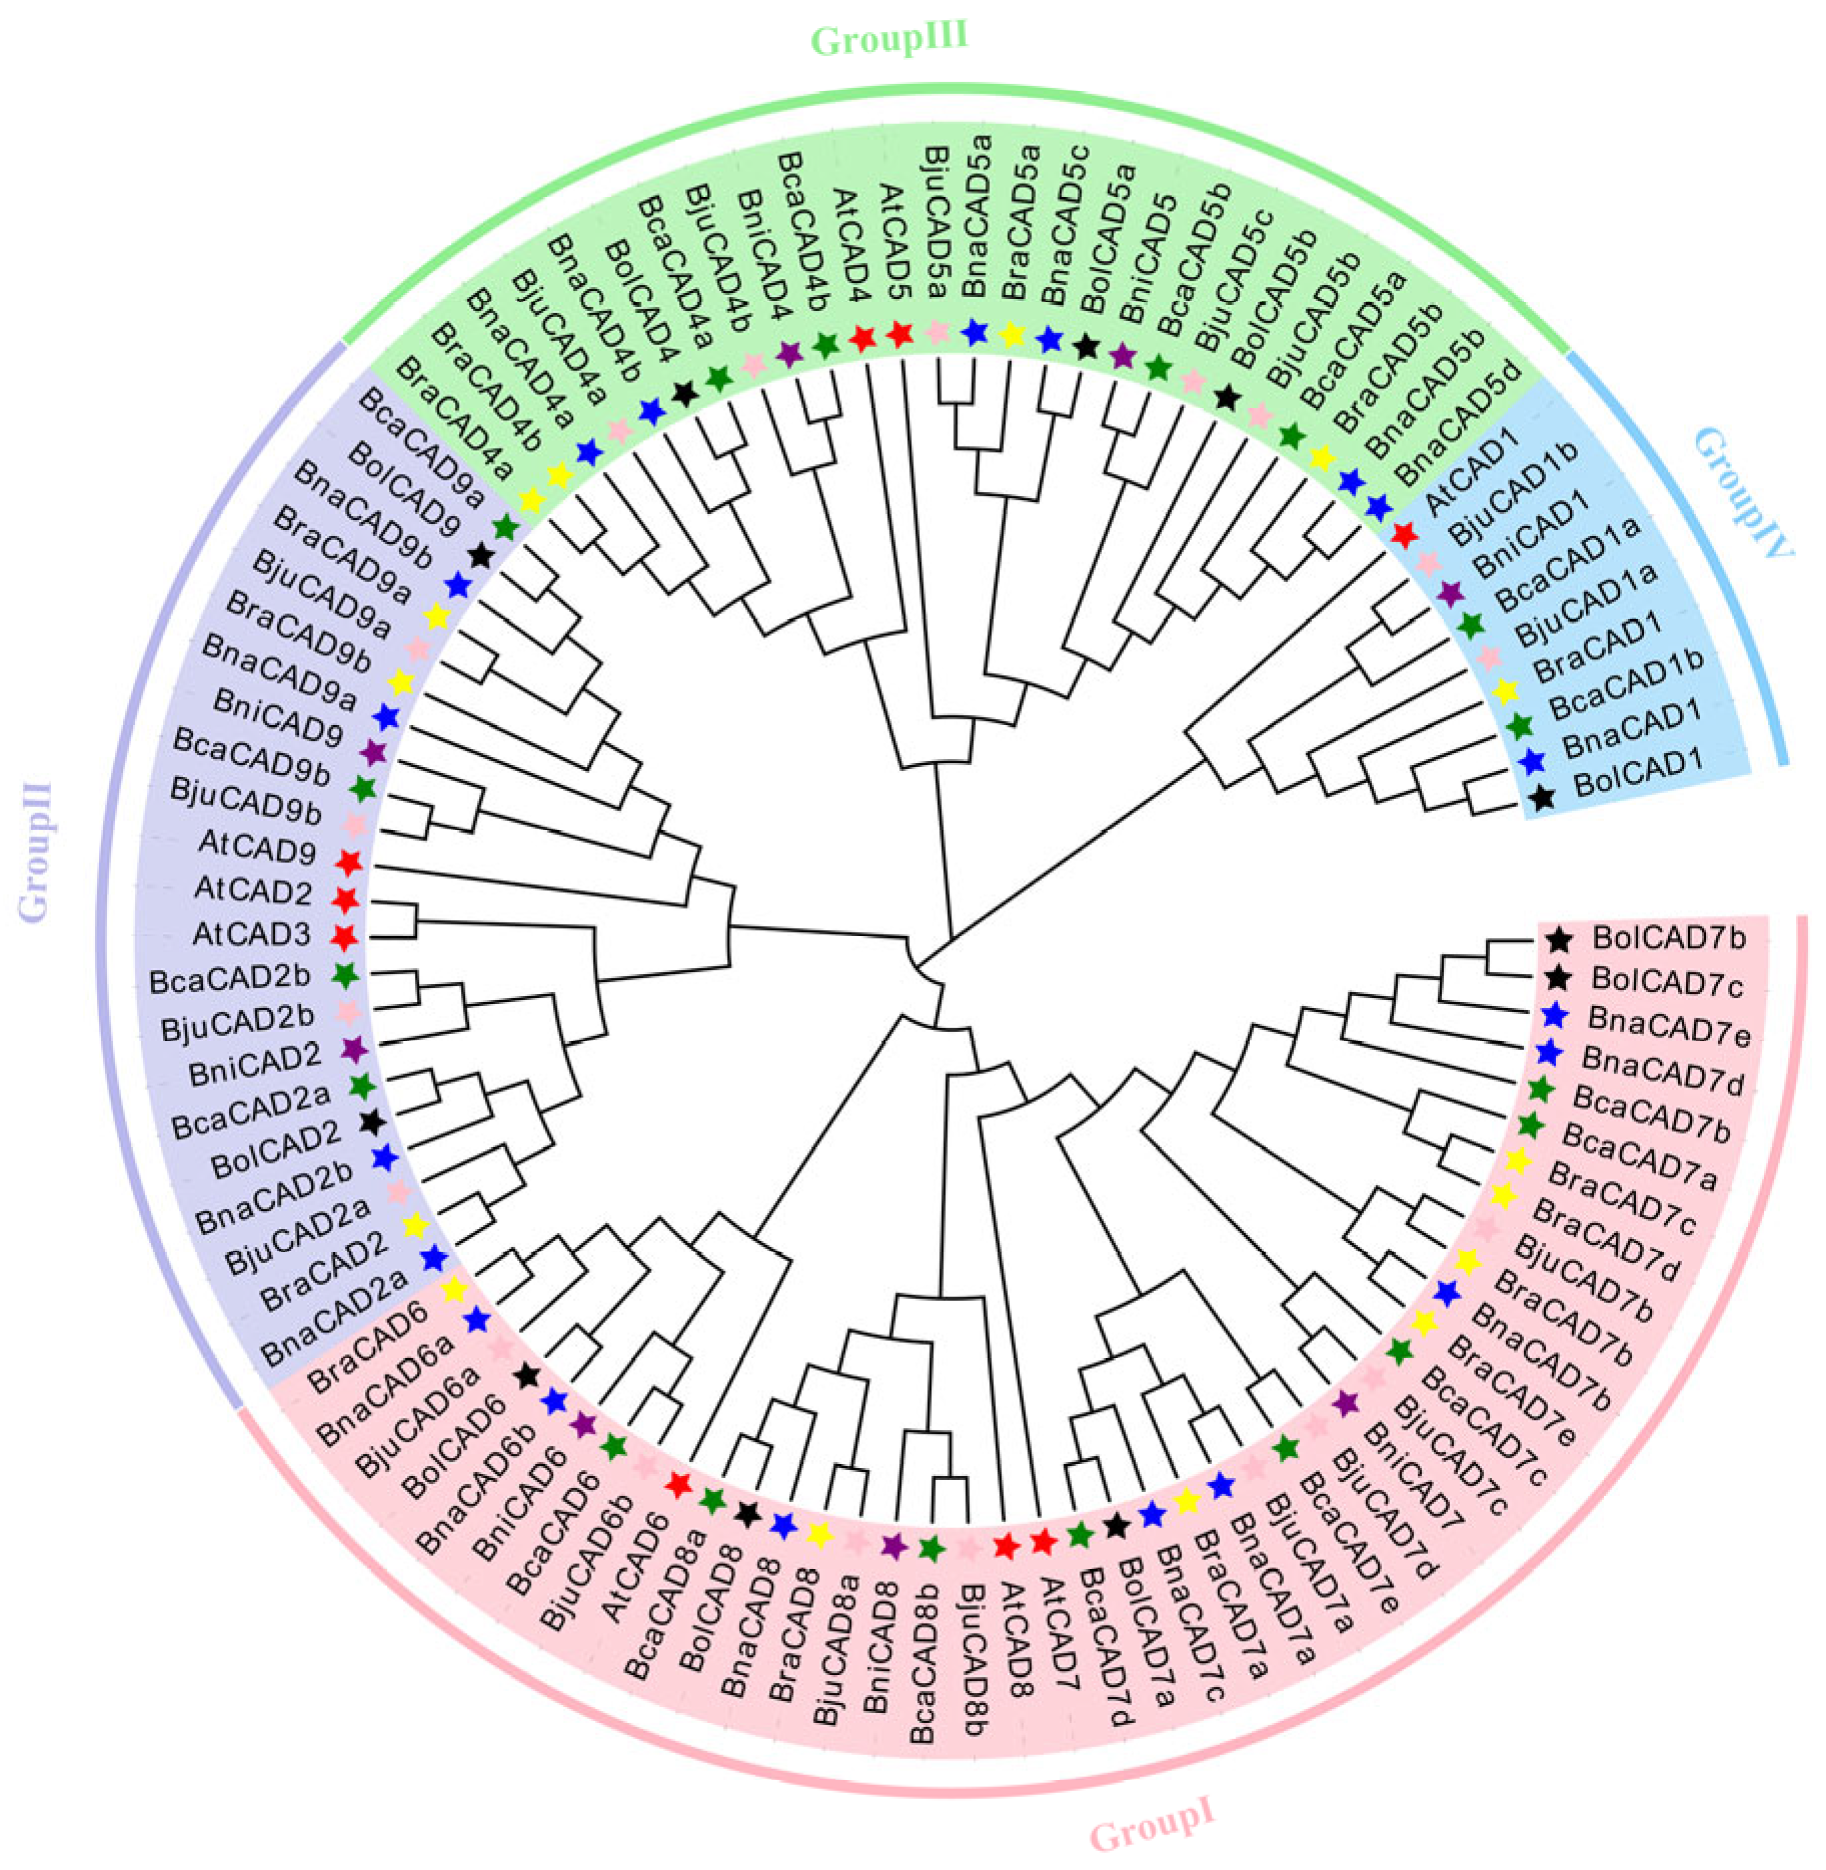
2.2. Phylogenetic Analysis of CAD Proteins in A. thaliana and the Brassica U-Triangle Species

It was revealed that the 99 CAD proteins (9 from A. thaliana and 90 from the U-triangle species) could be classified into four distinct groups, designated as Group I to Group IV (Figure 1). Notably, each group contained representatives from all seven species. Among these groups, the 26 proteins in Group III are most likely involved in lignification, as they are orthologous to AtCAD4 and AtCAD5, which have been well characterized as CADs implicated in lignin synthesis [17]. Group I covered 42 proteins from the CAD6, CAD7, and CAD8 subgroups. Group II contained 22 proteins consisting of two subgroups (CAD2 and CAD9). Group IV included nine proteins from the CAD1 subgroup. Given the conservation of the CAD function across these subgroups, most CAD proteins are likely to participate in responses to abiotic stresses and phytohormones.

2.3. Multiple Sequence Alignment of CAD Proteins in A. thaliana and the Brassica U-Triangle Species

The conserved domains of these 99 CAD proteins are depicted in Figure 2A. To further scrutinize the structure of these domains, we employed WebLogo Version 2.8.2 for visualization (Figure 2B). The results indicated that CAD proteins universally contain three conserved domains: the NADPH-binding domain GXGGXG, Zn1-binding domain GHE(X)2G(X)5G(X)2V, and Zn2-binding domain GDXVGVG(X)5C(X)2C(X)2C(X)7C. Although sequence variations were observed among CAD proteins, those within the same group exhibited highly conserved sequences. Notably, despite the loss of certain sequences (Figure 2A), BolCAD7b retains two key conserved functional domains of the CAD protein family: ADH_N (NADPH-binding domain) and ADH_zinc_N (Zn2-binding domain). Therefore, we still considered it a member of the CAD protein family.

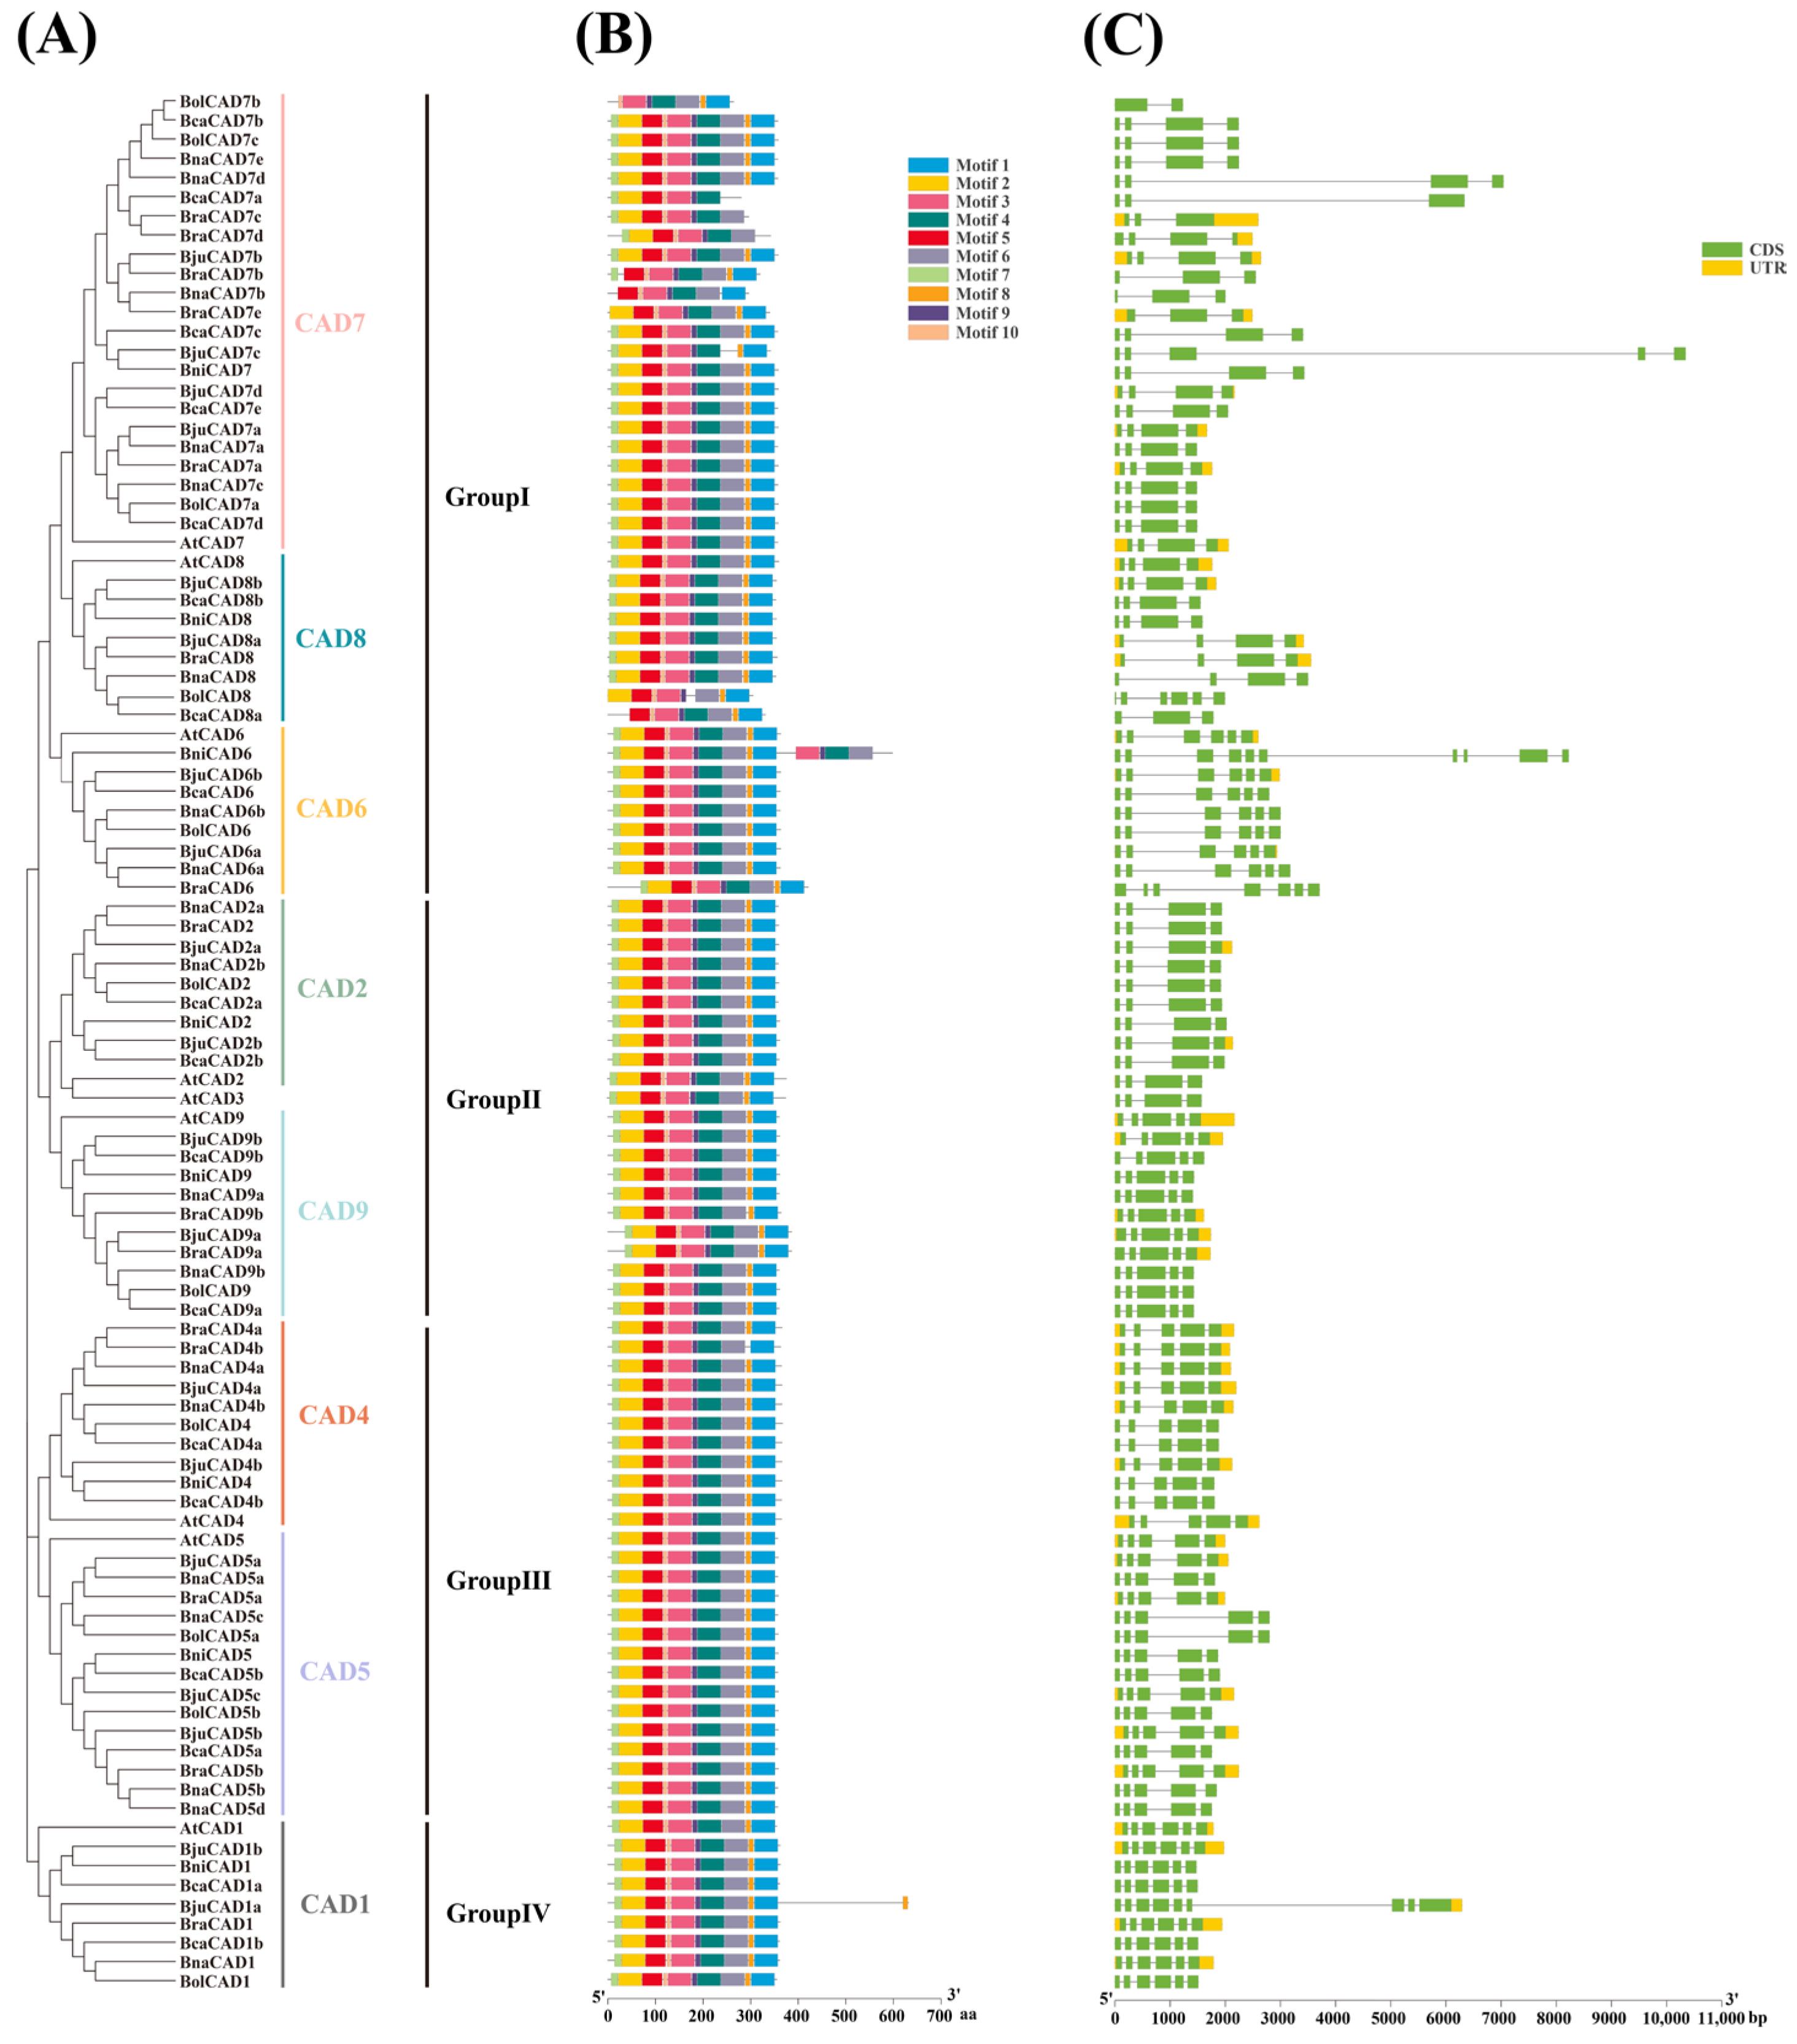
2.4. Conserved Motifs of CAD Proteins and Variations in Gene Structure in A. thaliana and the Brassica U-Triangle Species

Based on the evolutionary relationships depicted in Figure 3A, we identified 10 conserved motifs within 99 CAD proteins using TBtools. The results revealed that 66 CAD proteins, members from subgroups CAD1, CAD2, CAD4, CAD5, CAD6, and CAD9, contained all 10 conserved motifs. In contrast, some proteins from subgroups CAD7 and CAD8 exhibited motifs loss, especially lacking Motif 1, Motif 2, Motif 7, and Motif 8 (Figure 3B). This pattern suggests that subgroups CAD7 and CAD8 have undergone greater evolutionary diversification and may exhibit more varied functions. Notably, Motif 3, Motif 9, and Motif 10 were present in all CAD proteins, indicating that these motifs constitute the core conserved structural domains of the CAD family.
We performed an exon/intron analysis of the 99 CAD genes. The results showed that the number of exons varied from 2 (BolCAD7b) to 10 (BniCAD6) (Figure 3C). Genes within the same subgroup generally had a similar count of exons and introns. Specifically, genes in subgroups CAD4, CAD5, and CAD9 typically contained five exons, whereas most members from subgroups CAD2, CAD7, and CAD8 had four exons, and the majority of members from subgroups CAD1 and CAD6 comprised six exons. Compared with other genes in the same subgroup, the significant deviation in exon number observed in certain genes might be attributed to gene sequence truncation, loss, duplication, or recombination events during evolutionary processes [31]. For example, BolCAD7b contained only two exons, fewer than the three or four exons typically found in other genes in the same subgroup. In contrast, BjuCAD1a had nine exons, exceeding the usual six exons observed in its subgroup counterparts. Similarly, BniCAD6 comprised 10 exons, which was also higher than the typical number of 6 exons in other members of its subgroup.

2.5. Chromosomal Distribution of CAD Genes in the Brassica U-Triangle Species

There was significant diversity in the chromosomal distribution of CAD genes across the six species. Specifically, in B. rapa (AA), CAD genes were located on chromosomes A01, A03, A05, A06, A07, A08, and A09. In B. nigra (BB), CAD genes were found on chromosomes B01, B02, B03, and B05. In B. oleracea (CC), CAD genes were distributed across chromosomes C01, C03, C05, C06, C07, and C08. Among the allotetraploid species, B. juncea (AABB) contained CAD genes on both the A subgenome (chromosomes A01, A03, A05, A06, A07, A08, and A09) and the B subgenome (chromosomes B01, B02, B03, and B05). B. napus (AACC) contained CAD genes on the A subgenome (chromosomes A01, A03, A05, A06, A08, and A09) and the C subgenome (chromosomes C01, C03, C05, C06, C07, and C08). Finally, B. carinata (BBCC) had CAD genes located on the B subgenome (chromosomes B01, B02, B03, and B05) and the C subgenome (chromosomes C01, C03, C05, C06, C07, and C08) (Figure 4). The distribution of CAD genes among the subgenomes A, B, and C was relatively even, with 33, 26, and 31 CAD genes identified in each subgenome, respectively (Figure 4). Notably, genes occupying parallel physical positions within the same subgenome exhibited extensive collinearity across the Brassica U-triangle species. This observation suggests that, despite the distinct distribution patterns of CAD genes among different species, the chromosomal architecture of these subgenomes remains highly conserved.

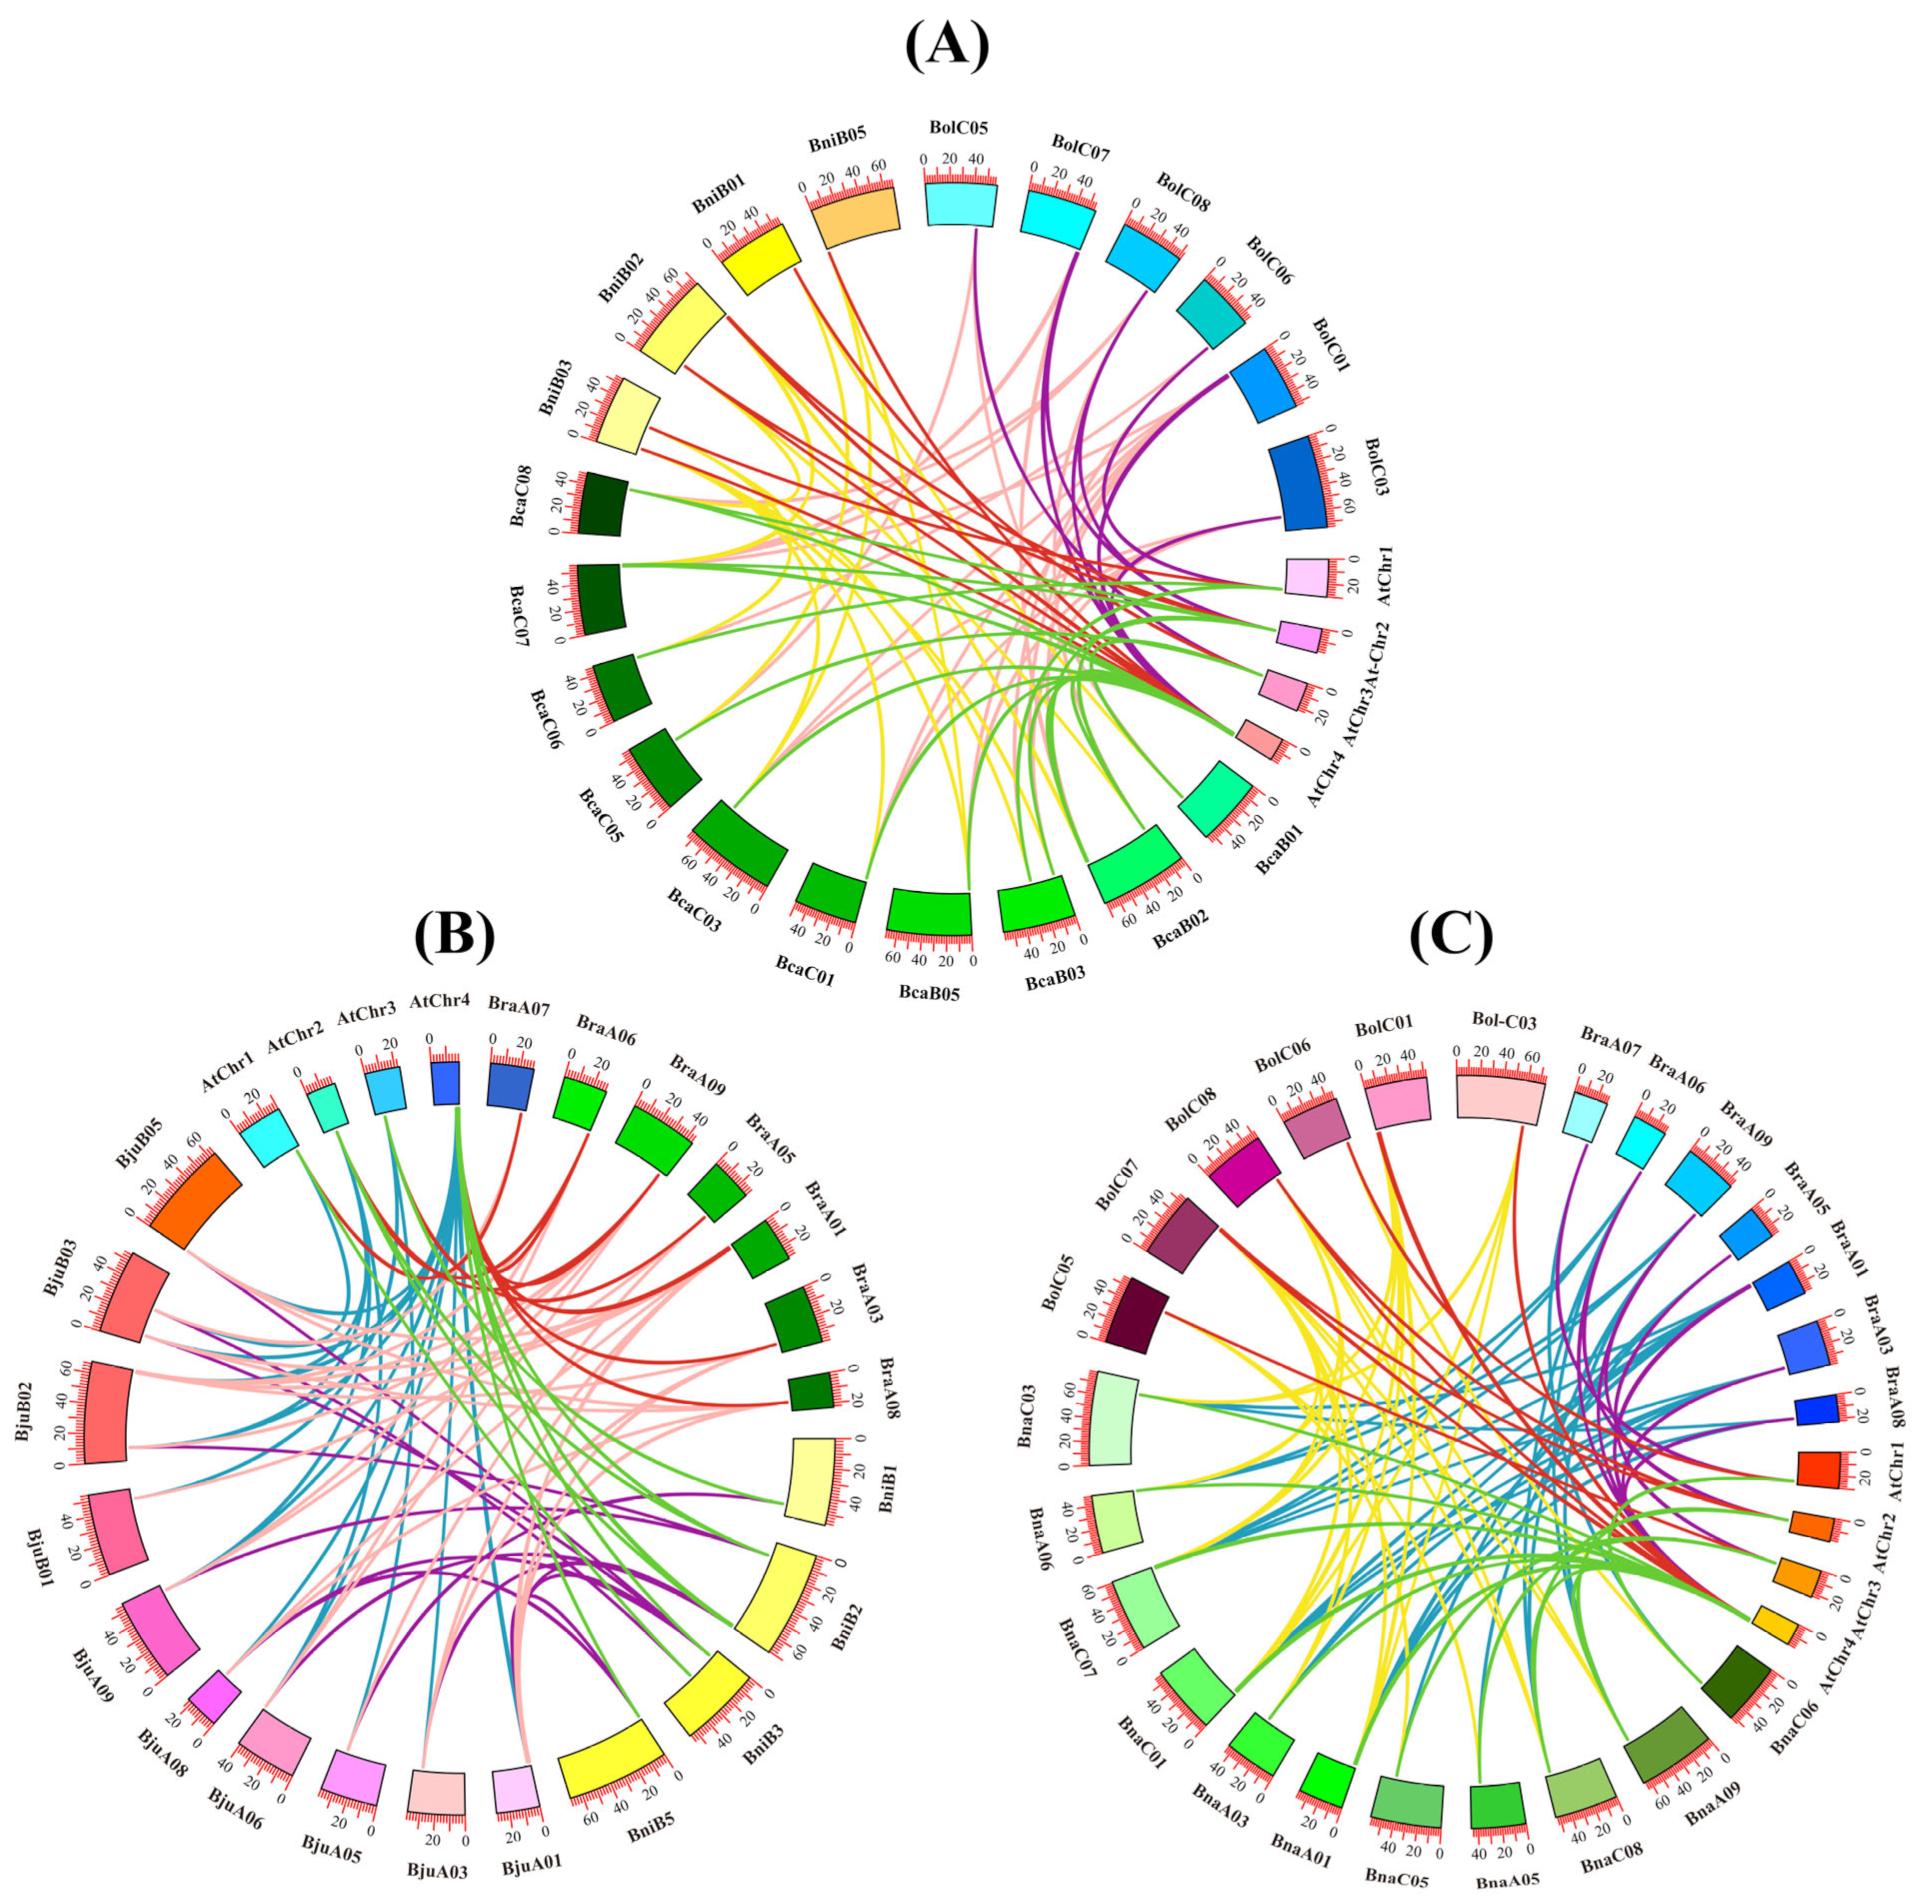
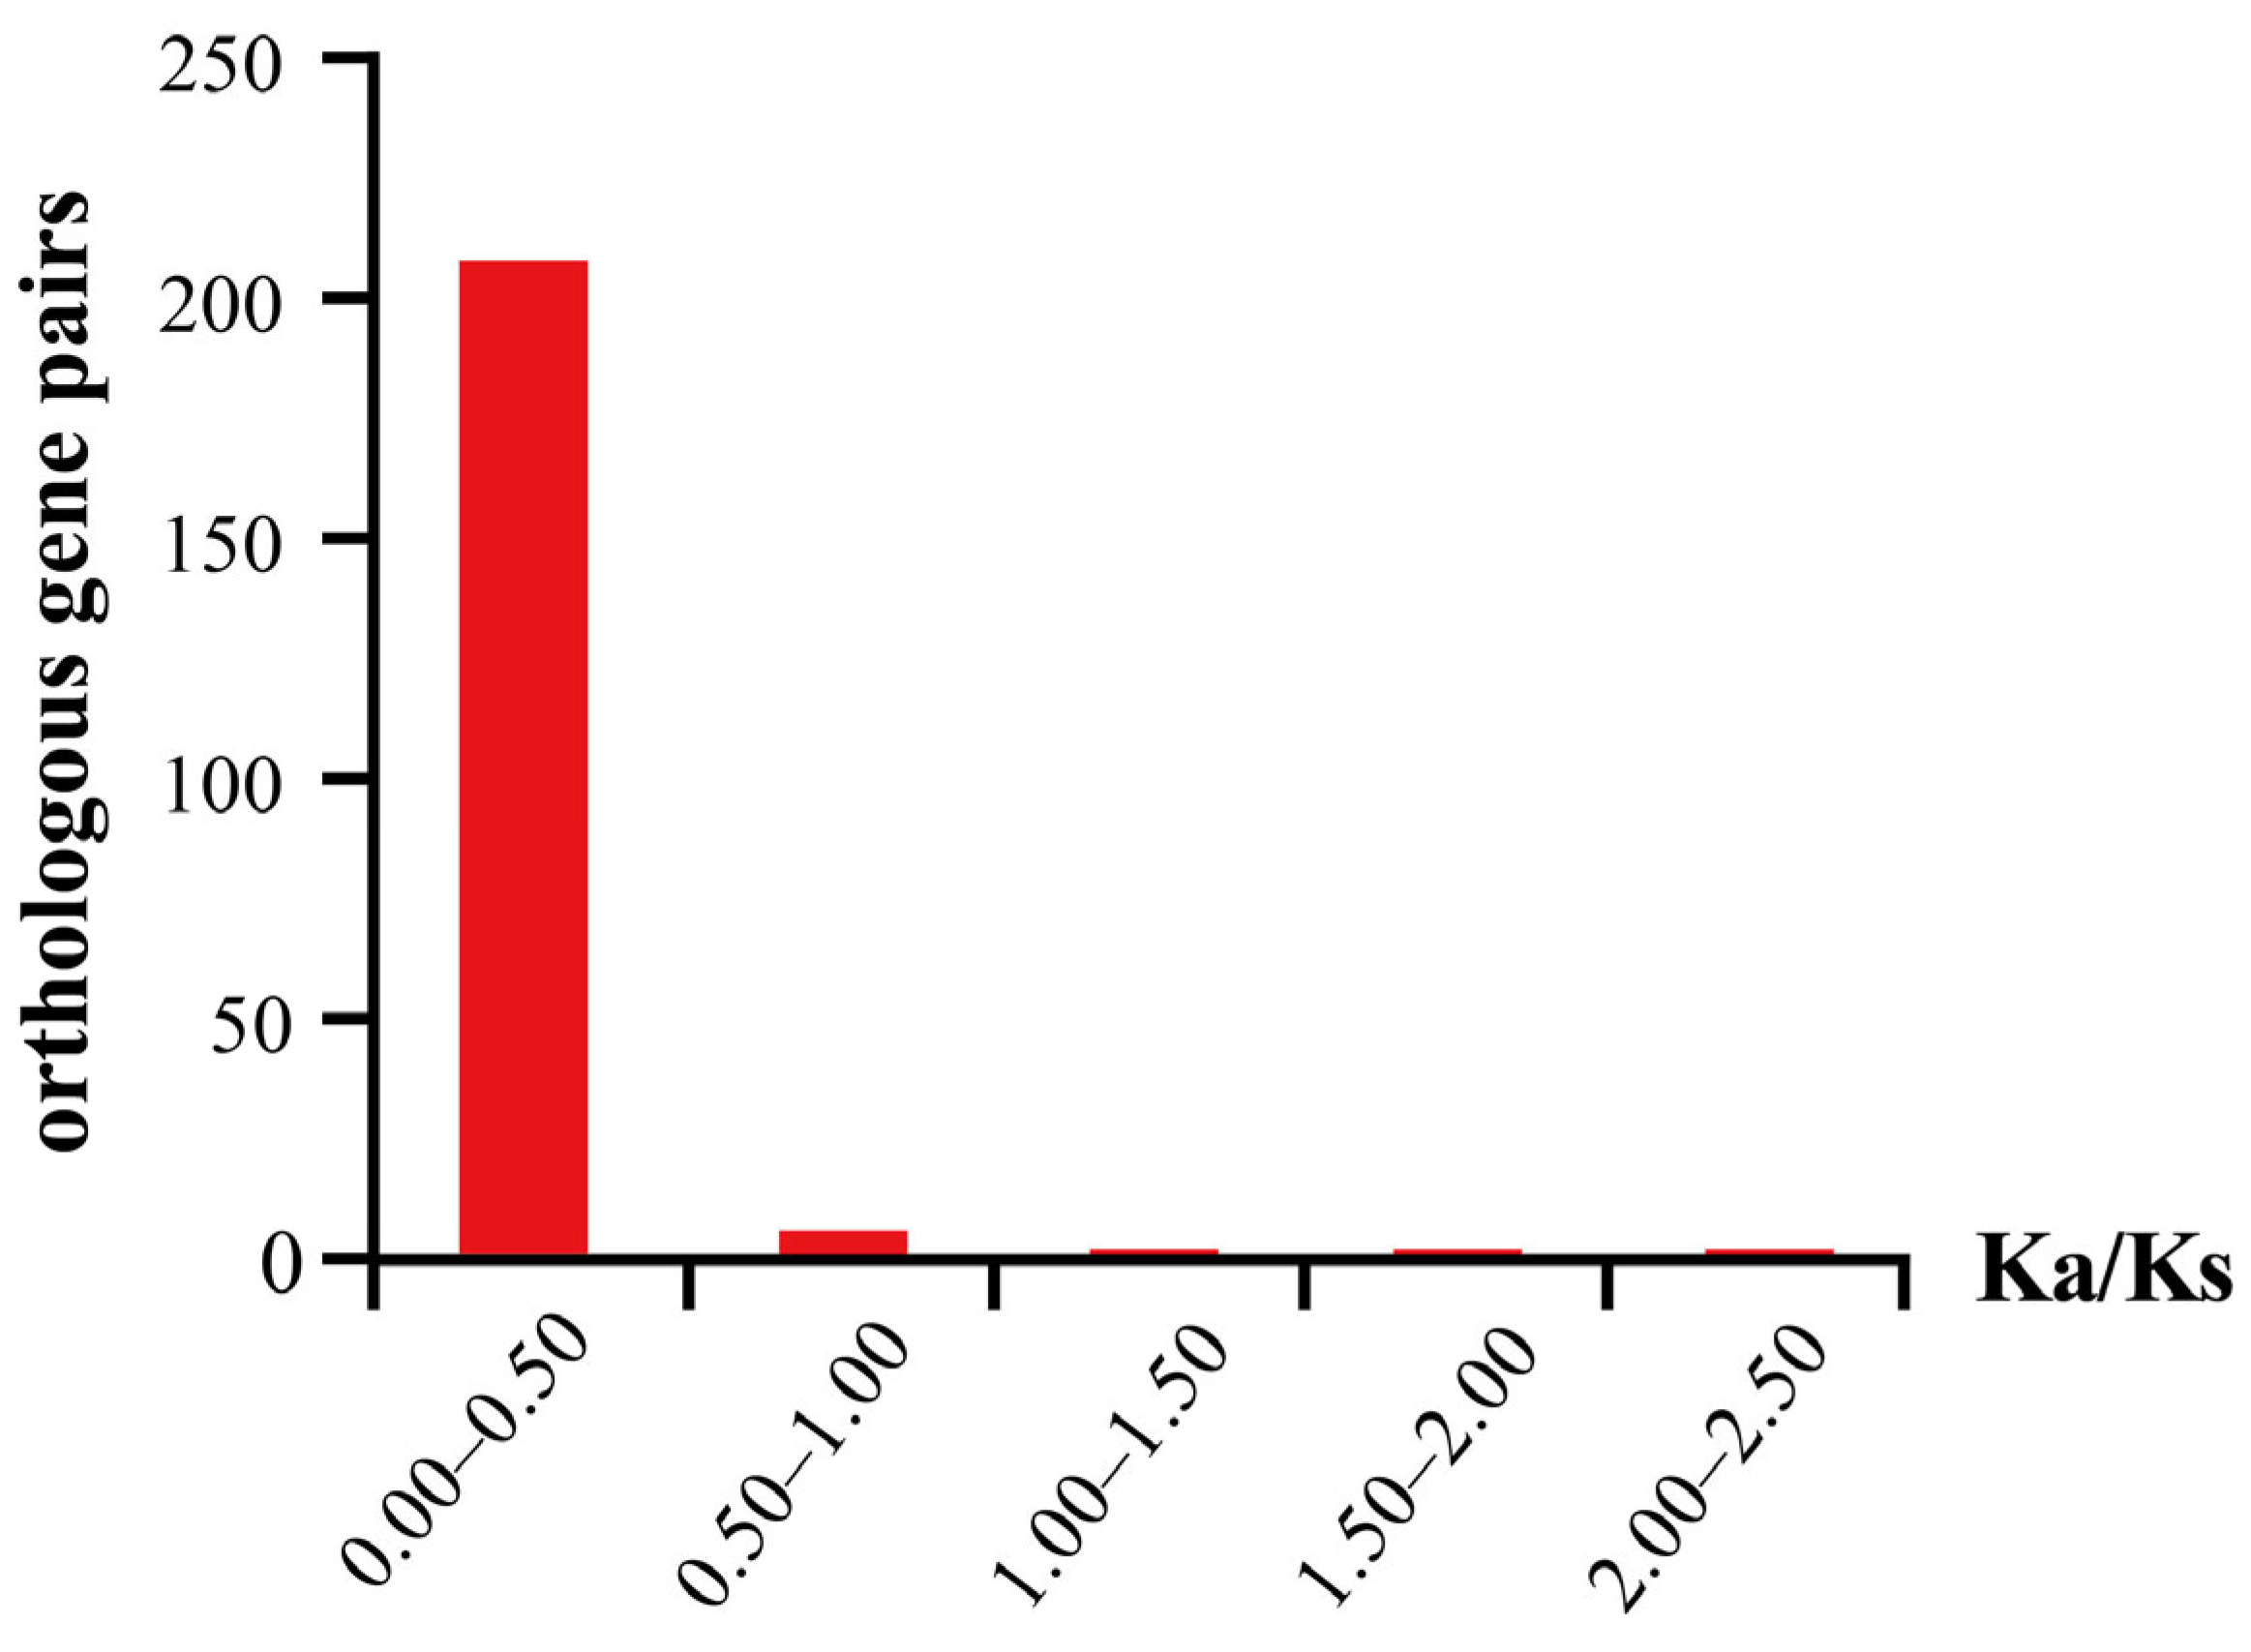
2.6. Collinearity Analysis of CAD Genes in A. thaliana and the Brassica U-Triangle Species

We divided CAD genes into three categories based on their subgenome relationships. Each category included A. thaliana, an allopolyploid species, and its two diploid progenitors. Specifically, Category A comprised A. thaliana, B. carinata, B. nigra, and B. oleracea; Category B included A. thaliana, B. juncea, B. rapa, and B. nigra; Category C consisted of A. thaliana, B. napus, B. rapa, and B. oleracea. In each category, we constructed five pairwise comparisons of syntenic relationships: between A. thaliana and each of the two diploid progenitors, between A. thaliana and the allopolyploid, and between each diploid progenitor and the allopolyploid. The numbers of orthologous gene pairs varied among different species. In Category A, we identified 19 orthologous gene pairs between A. thaliana and B. carinata, 9 pairs between A. thaliana and B. nigra, 11 pairs between A. thaliana and B. oleracea, 17 pairs between B. nigra and B. carinata, and 22 pairs between B. oleracea and B. carinata. In Category B, the orthologous gene pairs included 21 pairs between A. thaliana and B. juncea, 10 pairs between A. thaliana and B. rapa, 9 pairs between A. thaliana and B. nigra, 26 pairs between B. rapa and B. juncea, and 15 pairs between B. nigra and B. juncea. In Category C, we observed 17 pairs between A. thaliana and B. napus, 10 pairs between A. thaliana and B. rapa, 11 pairs between A. thaliana and B. oleracea, 27 pairs between B. rapa and B. napus, and 29 pairs between B. oleracea and B. napus (Figure 5). Overall, we identified 86 genes with syntenic relationships among the 99 genes examined. These syntenic CAD gene pairs were widely distributed across the genomes of A. thaliana and the Brassica U-triangle species. Notably, the collinearity of 13 genes was found to be weak, including BnaCAD7b, BolCAD6, BraCAD4b, BraCAD9b, BraCAD7c, BraCAD7d, BraCAD7e, BraCAD8, BjuCAD1a, BniCAD8, BcaCAD8b, BcaCAD6, and BcaCAD7a.
The Ka/Ks analysis revealed that most gene pairs were under strong purifying selection, with Ka/Ks ratios less than 1 and predominantly ranging from 0 to 0.5 (Figure 6). However, three gene pairs exhibited potential signatures of positive selection, with Ka/Ks ratios exceeding 1: BolCAD-BnaCAD8 (1.14), BraCAD6-BnaCAD6a (1.58), and BolCAD8-BcaCAD6a (2.17).

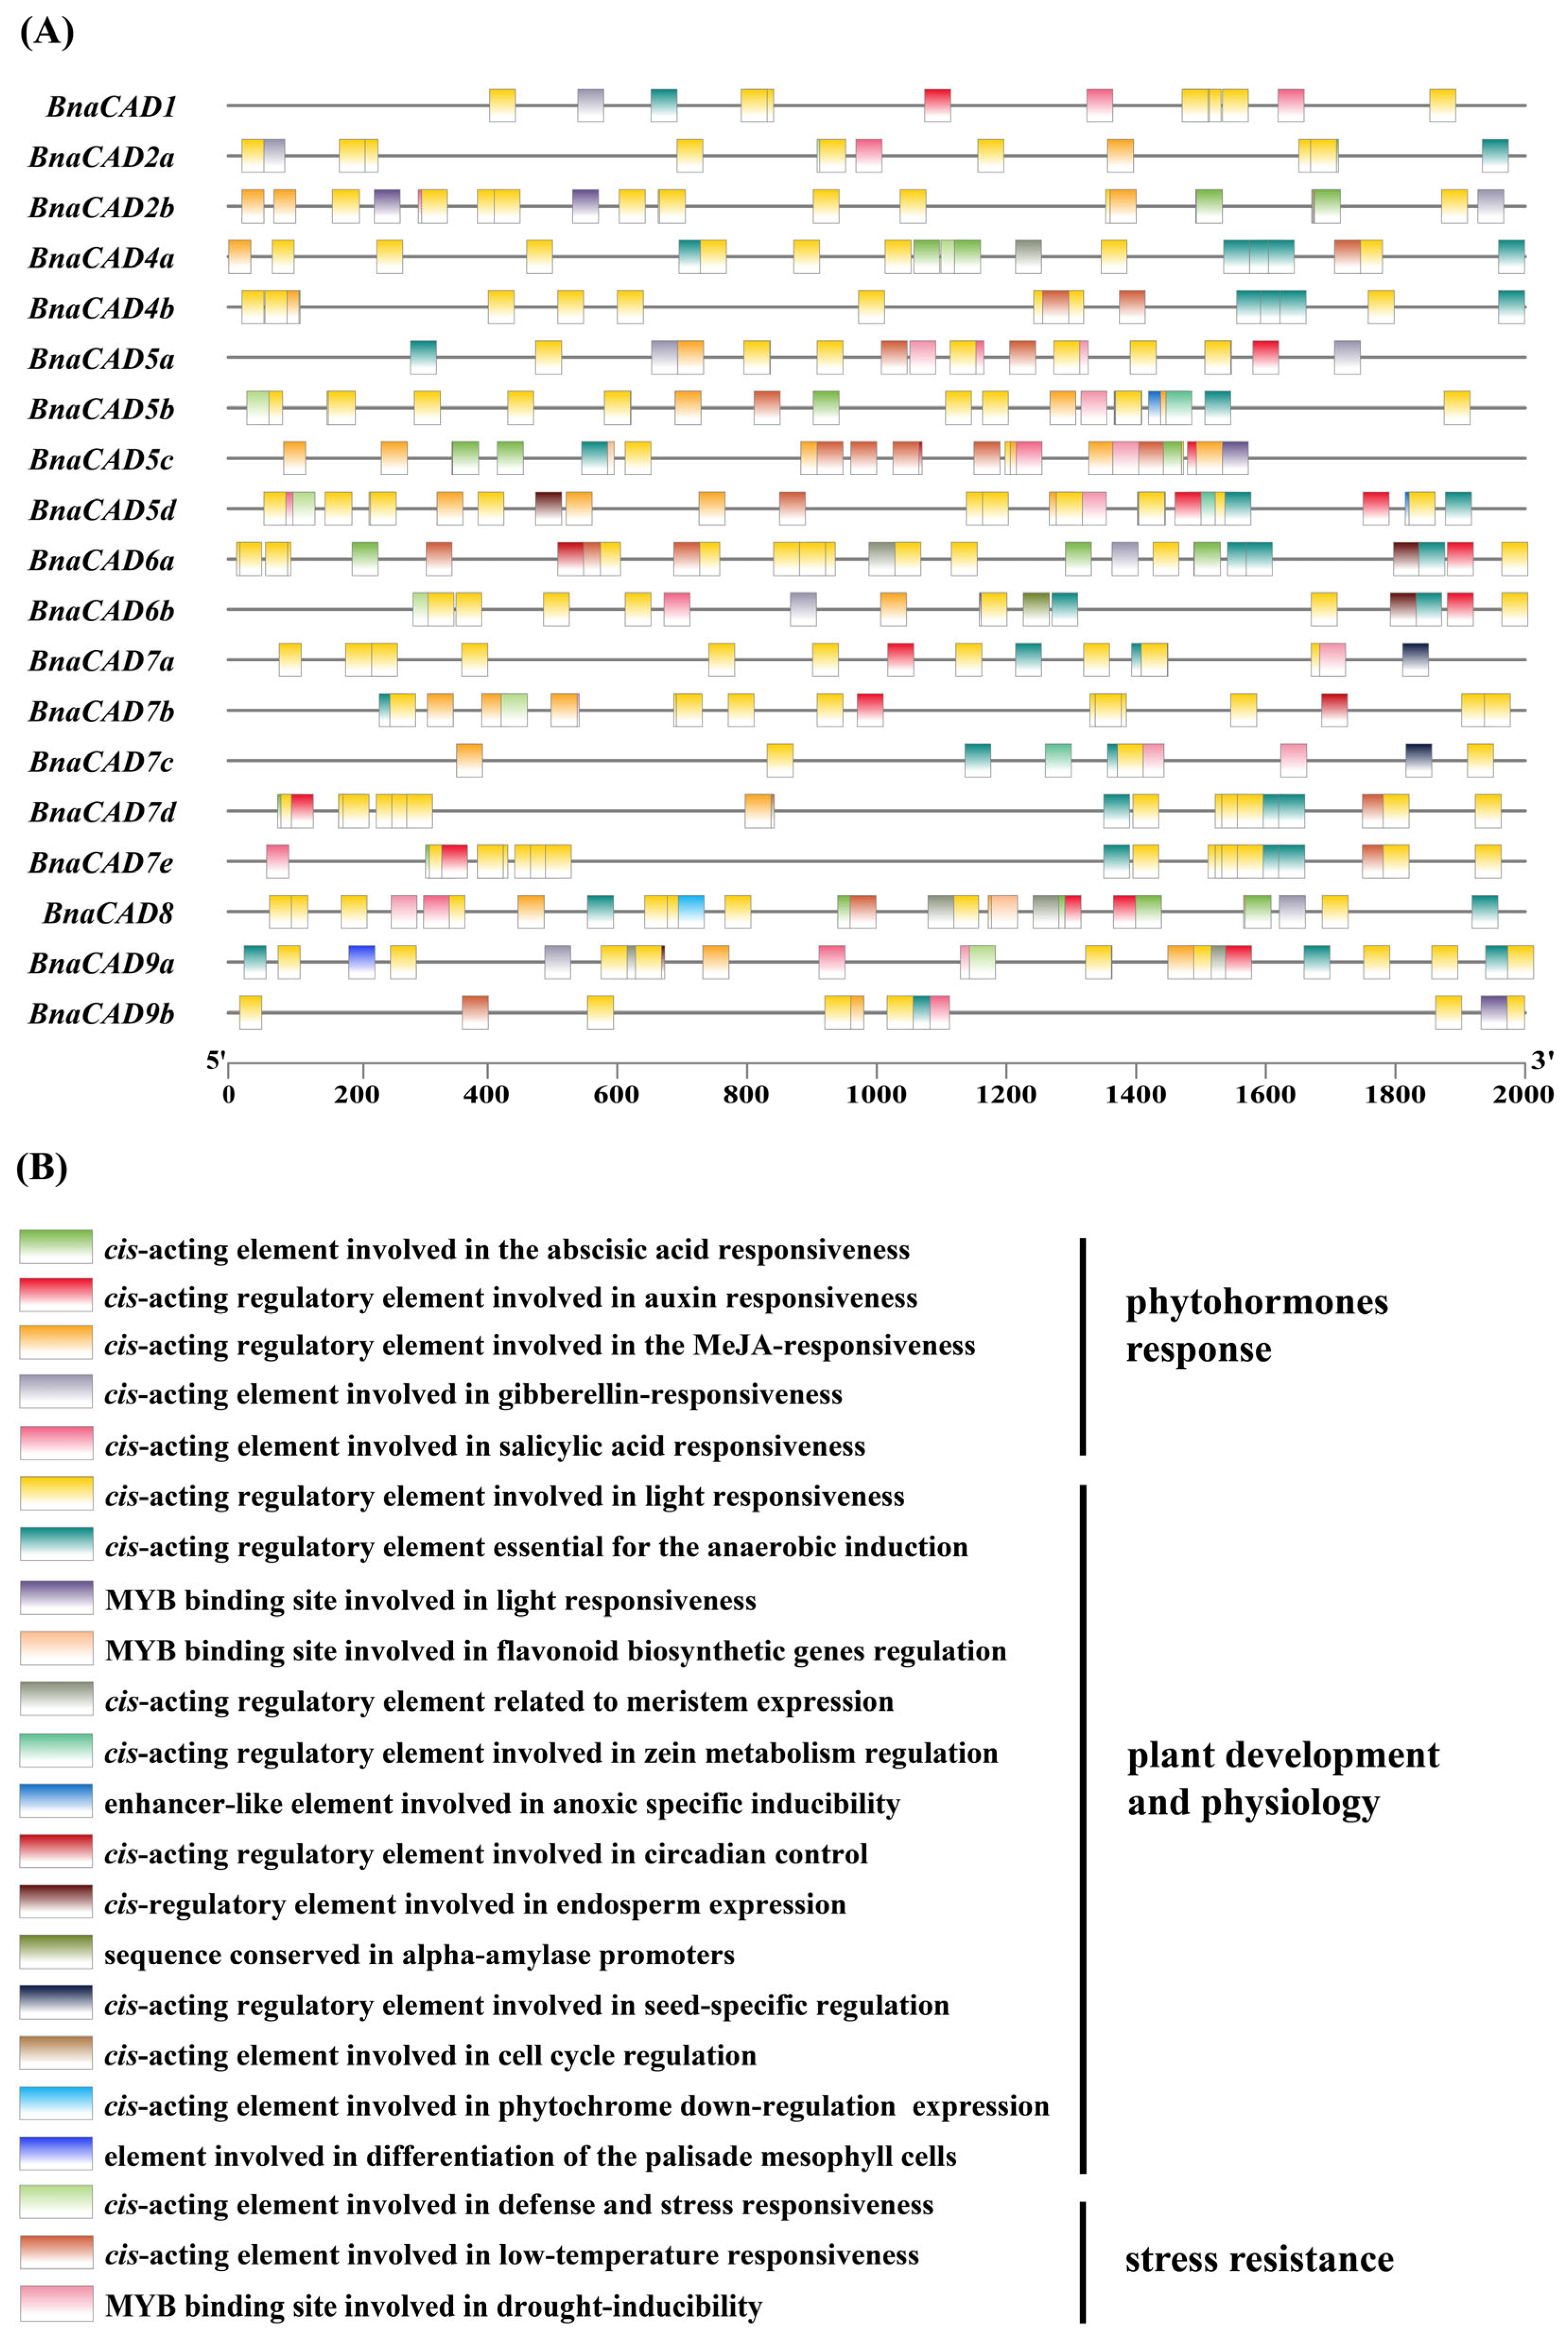
2.7. Cis-Acting Element Analysis of BnaCAD Promoters

Nineteen CAD genes have been identified in B. napus (Table S1), and a comprehensive analysis of cis-acting elements within their promoters was conducted (Figure 7A). A total of 22 distinct cis-acting elements were identified and categorized into three major groups based on their primary functions in transcriptional regulation. These included phytohormone-response elements (5 elements), elements associated with plant physiological and developmental processes (14 elements), and stress-resistance elements (3 elements) (Figure 7B). Furthermore, except for BnaCAD1, BnaCAD6a, BnaCAD7a, and BnaCAD7e, the promoters of the remaining 15 BnaCAD genes contained the MYB binding site involved in the regulation of flavonoid biosynthetic genes (Figure 7A). Flavonoids play crucial roles in pigmentation, disease resistance, and defense against biotic and abiotic stresses [32]. The presence of these regulatory elements further supports the involvement of BnaCAD genes in regulating seed coat color and in responding to abiotic stresses. Our study highlights the pleiotropic regulatory roles of BnaCAD genes in B. napus growth and development, stress responses, and phytohormone signaling. These findings underscore the multifaceted functions of BnaCAD genes in various biological processes and provide insights into their potential regulatory mechanisms.

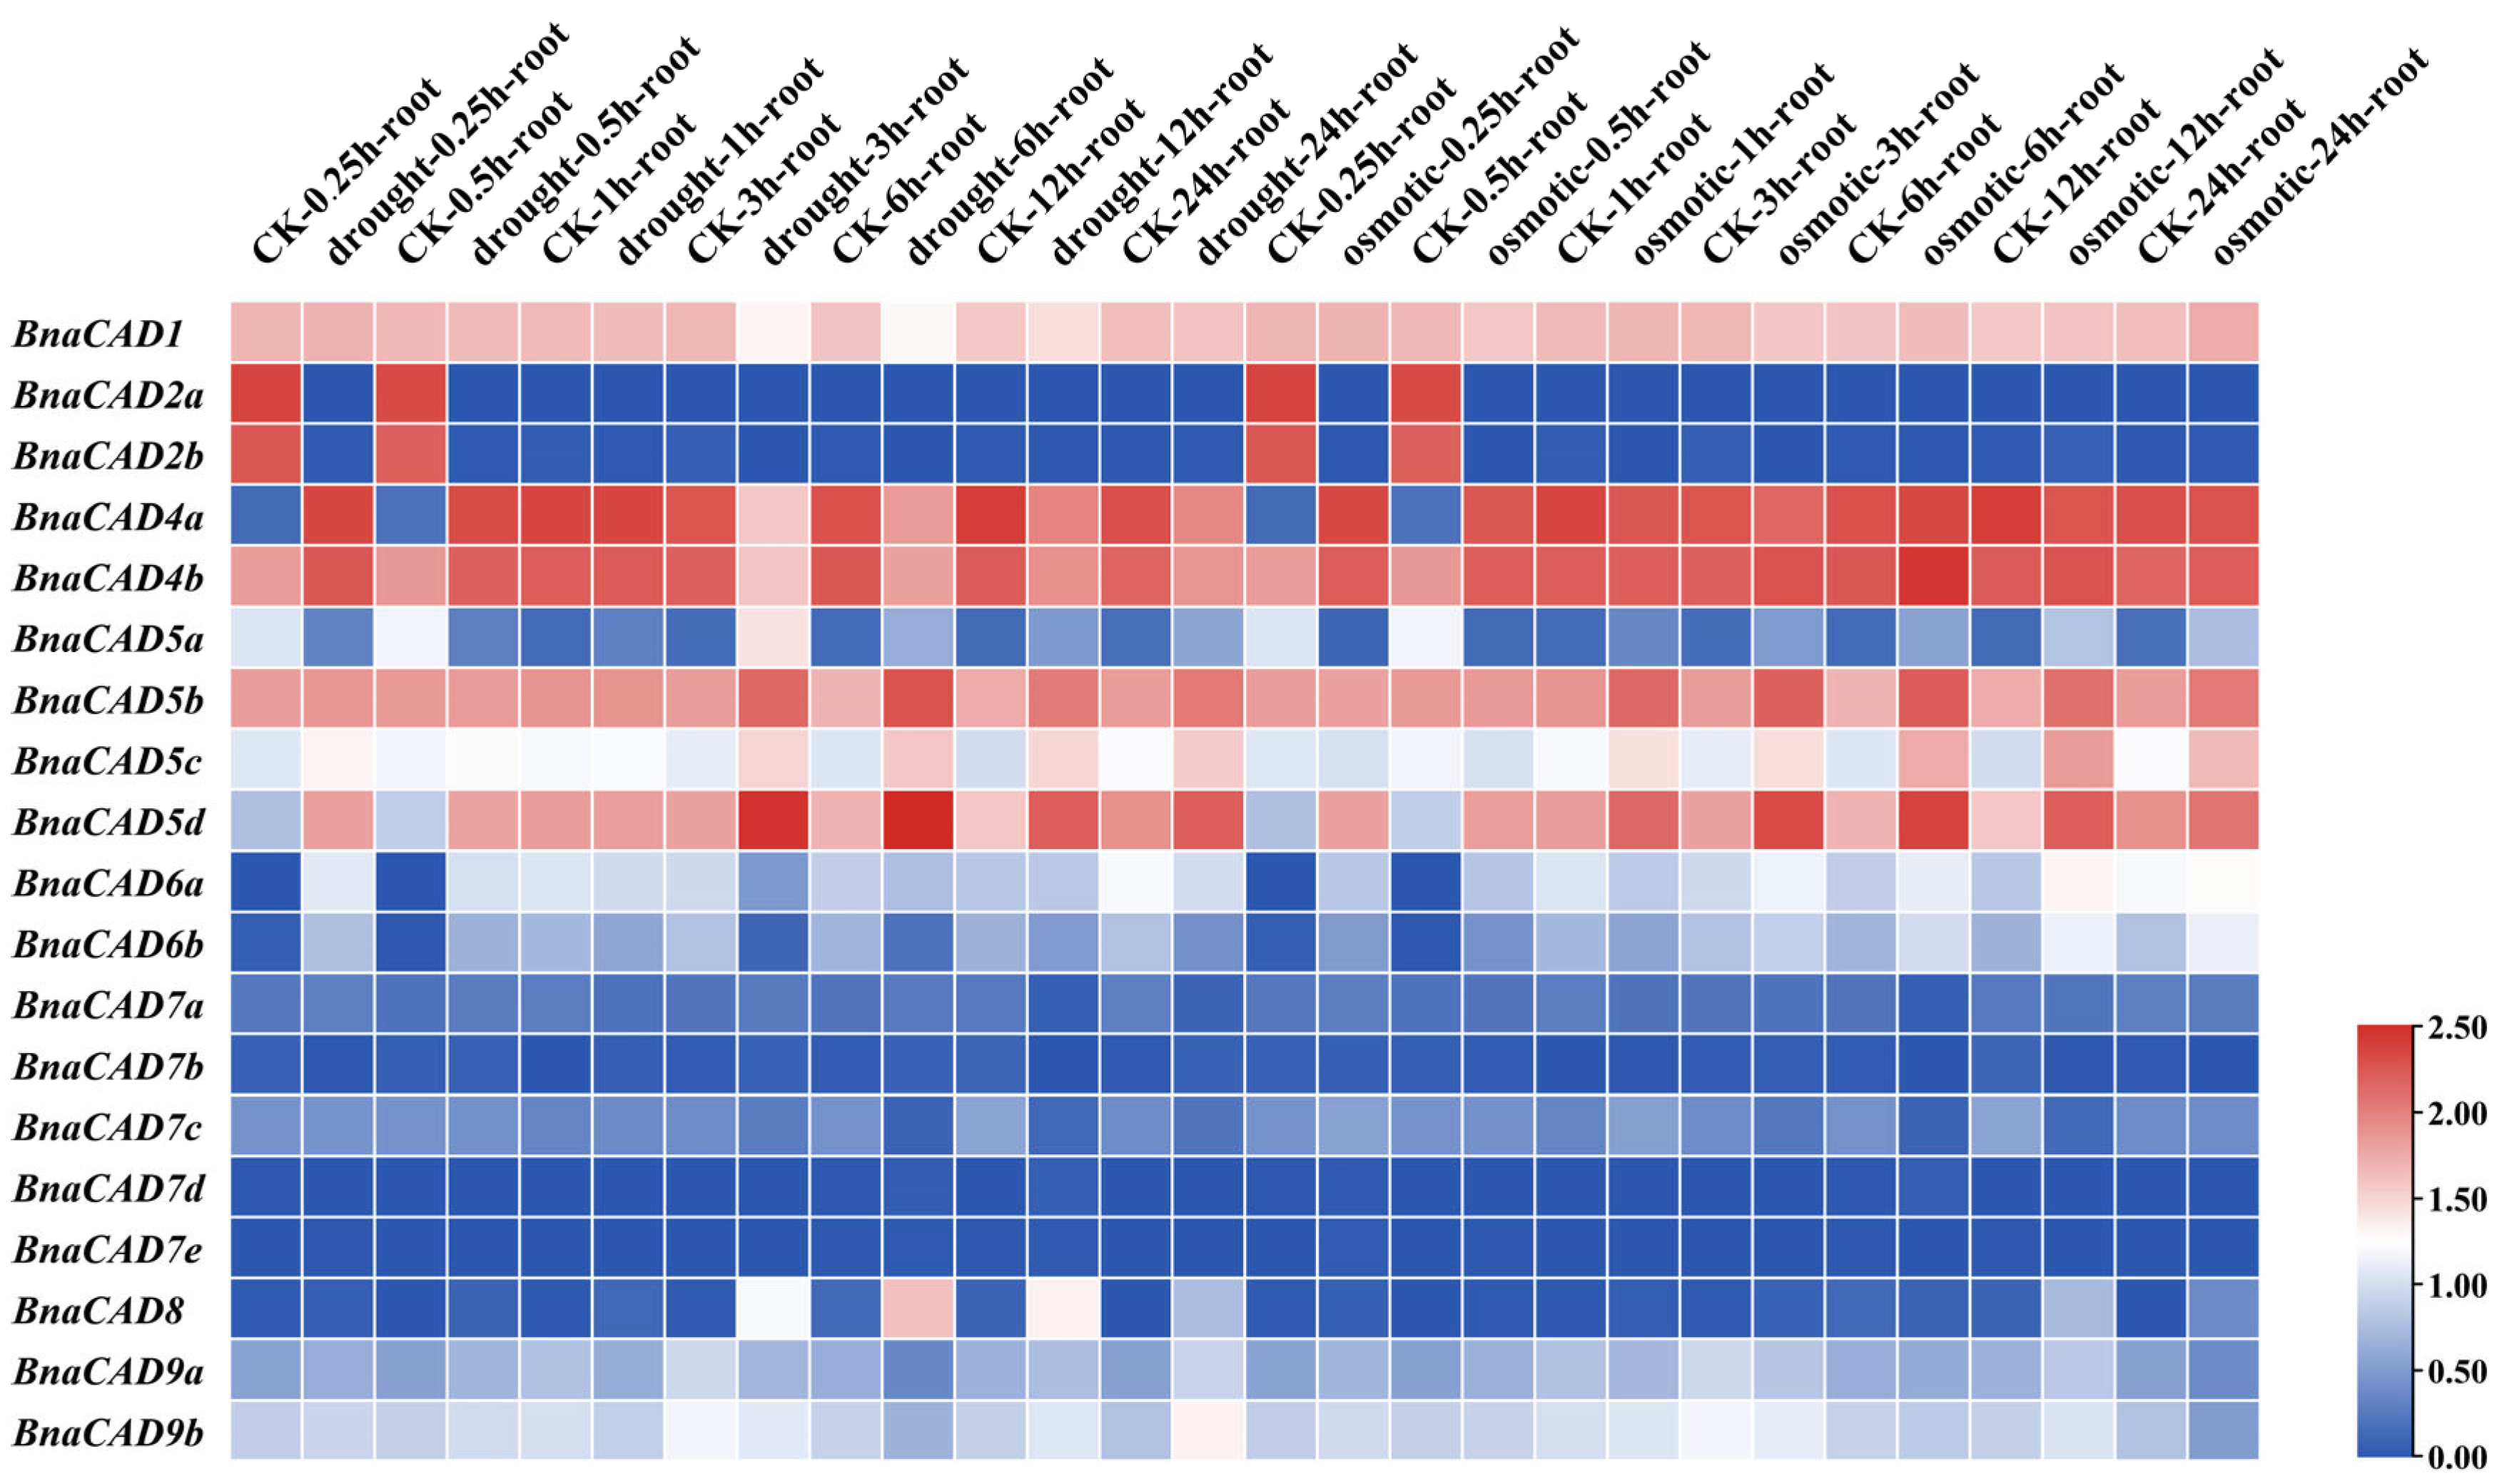
2.8. Expression Profiles of BnaCAD Genes in B. napus Under Drought, Osmotic, and ABA Treatments

We analyzed the expression patterns of 19 BnaCAD genes under drought and osmotic conditions in B. napus cultivar ZS11 using published RNA-Seq datasets from the BnIR database (https://yanglab.hzau.edu.cn/BnIR, accessed on 2 January 2025). Specifically, during the initial phase of treatment (0.25 to 0.5 h), the expression levels of BnaCAD2a, BnaCAD2b, and BnaCAD5a were significantly downregulated, with FPKM (fragments per kilobase of transcript per million mapped reads) values decreasing by 10- to 300-fold. In contrast, BnaCAD4a, BnaCAD4b, BnaCAD5d, BnaCAD6a, and BnaCAD6b showed significant upregulation, with FPKM values increasing by 30- to 300-fold. During the subsequent period (3–24 h), BnaCAD5a, BnaCAD5b, BnaCAD5c, BnaCAD5d, and BnaCAD8 showed noticeable upregulation (FPKM values increased by 10-fold), whereas BnaCAD4a and BnaCAD4b were downregulated (FPKM values decreased by 100-fold) (Figure 8). These results indicate that different BnaCAD genes exhibit distinct temporal expression patterns in response to stress. Overall, 14 of 19 BnaCAD genes in B. napus were found to be sensitive to drought and osmotic stress, while the BnaCAD7 subgroup (BnaCAD7a–7e) showed no significant changes, suggesting that this subgroup may not be involved in abiotic stress responses or may function through alternative mechanisms. Among the responsive genes, the BnaCAD2 subgroup (2a, 2b), BnaCAD4 subgroup (4a, 4b), and BnaCAD5 (5a, 5b, 5c, 5d) subgroup were found to play major roles. BnaCAD2a and BnaCAD2b were stably downregulated throughout the duration of stress. BnaCAD4a and BnaCAD4b exhibited a biphasic pattern, with initial upregulation followed by downregulation. Members of the BnaCAD5 subgroup showed functional differentiation. Some members, such as BnaCAD5b, BnaCAD5c, and BnaCAD5d, were persistently upregulated, while BnaCAD5a was initially downregulated before being upregulated.
Our analysis revealed that the expression levels of BnaCAD genes in ZS11 were significantly upregulated with increasing ABA treatment duration using published RNA-Seq data from BnaGADB v1.0 (Figure 9). However, different BnaCAD genes exhibited distinct response patterns. For instance, BnaCAD2a and BnaCAD7c were highly expressed during the early stages of treatment (1–3 h, 2 < FPKM < 30), whereas BnaCAD1, BnaCAD2b, BnaCAD4a, BnaCAD4b, BnaCAD5a, BnaCAD5b, BnaCAD5c, BnaCAD5d, BnaCAD6a, BnaCAD6b, BnaCAD7a, BnaCAD7b, BnaCAD7d, BnaCAD7e, BnaCAD8, BnaCAD9a, and BnaCAD9b were more highly expressed during the later stages of treatment (6–24 h, 2 < FPKM < 100).

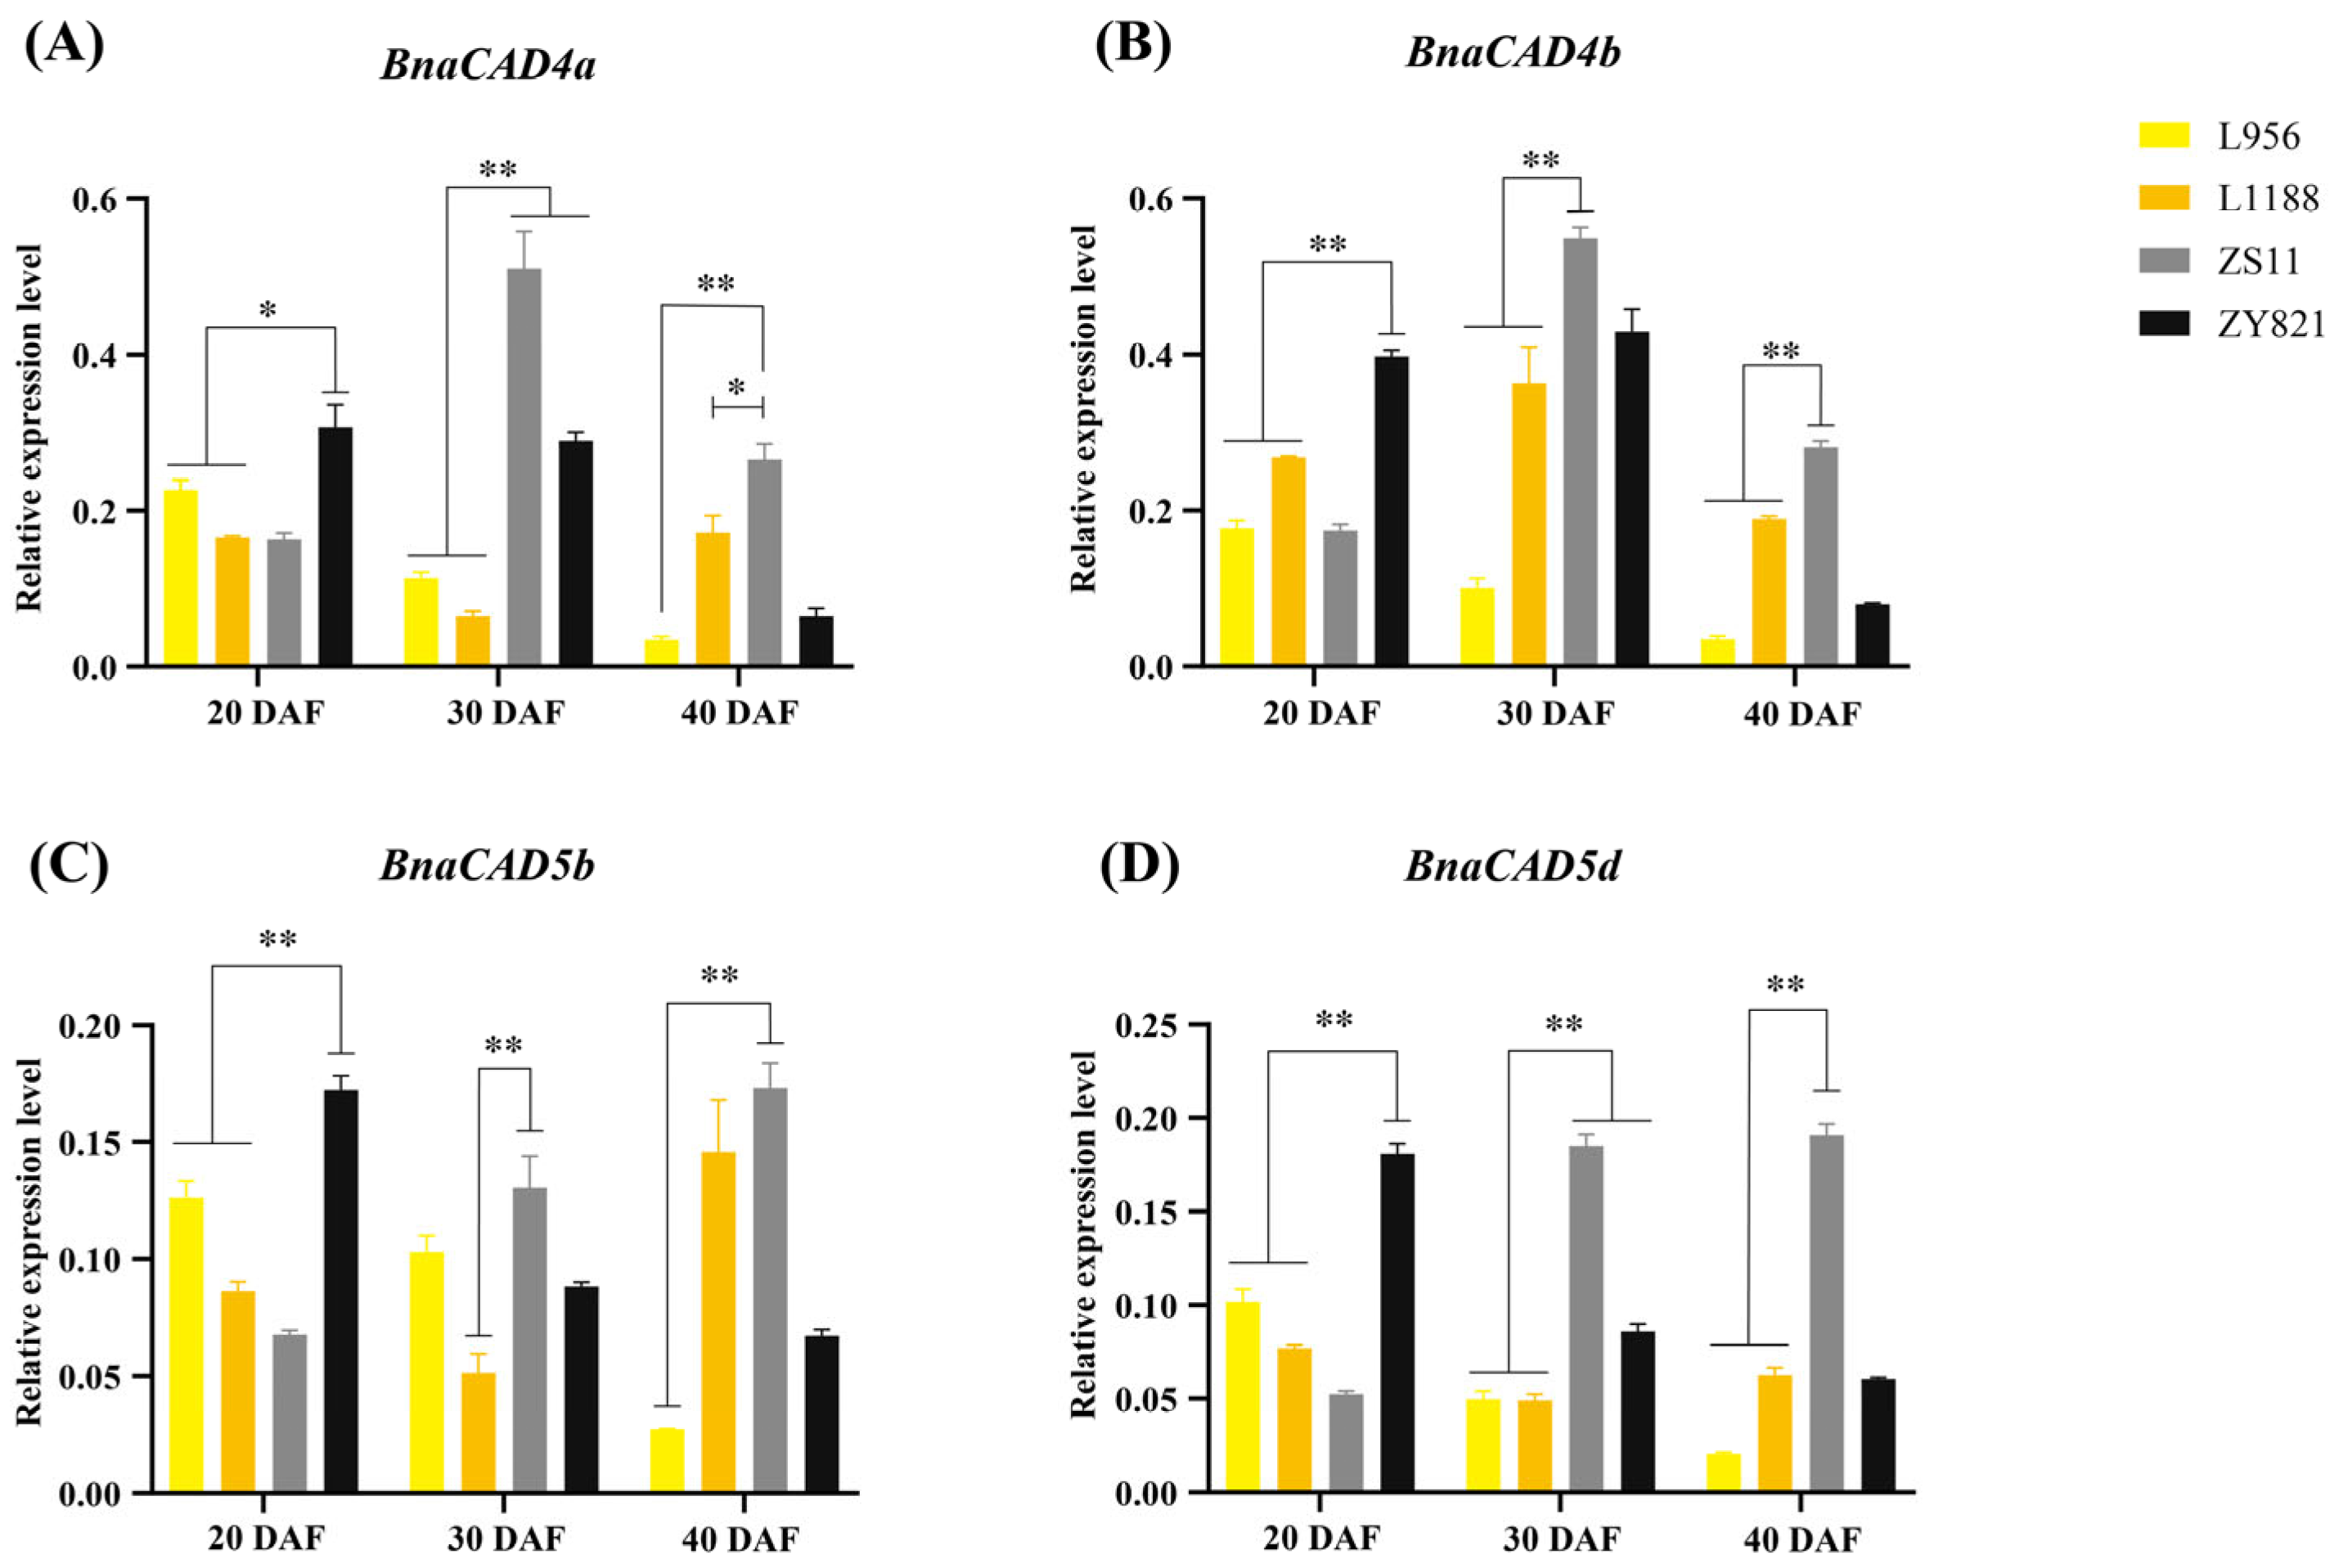
2.9. Expression Pattern of Four BnaCAD Genes in Yellow- and Black-Seeded B. napus

We confirmed that the expression levels of the four genes, including BnaCAD4a, BnaCAD4b, BnaCAD5b, and BnaCAD5d, were generally higher in black-seeded B. napus (ZS11 and ZY821) compared to yellow-seeded ones (L956 and L1188) at all tested developmental stages (20, 30, and 40 DAF, days after flowering). Additionally, the temporal expression patterns of these four CAD genes differed between the two black-seeded materials. Specifically, at 20 DAF, the expression levels of the four CAD genes in ZY821 were significantly higher than those in the two yellow-seeded materials (p < 0.05 or p < 0.01). At 30–40 DAF, the expression levels of these genes in ZS11 were considerably higher than those in the two yellow-seeded materials (p < 0.05 or p < 0.01, Figure 10).

3. Discussion

3.1. Expansion, Loss, and Functional Diversification of the CAD Gene Family in the Brassica U-Triangle Species

The dynamic evolution of gene families, driven by mechanisms such as whole-genome duplication (WGD) and selective gene loss, is a key strategy for plants to adapt to complex environments and shape functional diversity [33]. The evolutionary trajectory of the CAD gene family in the Brassica U-triangle species exemplifies this balance. Although whole-genome triplication (WGT) events theoretically result in a threefold increase in amounts of the gene members [34], our analysis revealed significant deviations. The B. rapa (AA), B. nigra (BB) and B. oleracea (CC) retained only 15, 8, and 11 CAD genes, respectively, far below theoretical amounts, namely threefold of the corresponding ones in A. thaliana (Table S1). This phenomenon of “post-expansion loss” aligns with subgenome dominance and selective pressure following polyploidization [3]. Notably, the number of CAD genes in the allotetraploid species (B. juncea, B. napus, and B. carinata) is not simply equal to the sum of genes in their own diploid progenitors. For instance, B. juncea (AABB) has 19 CAD genes, fewer than the sum of its diploid progenitors B. rapa (15) and B. nigra (8), indicating that redundant copies were pruned to optimize metabolic networks. Crucially, gene loss does not signify functional degradation. Instead, it drives innovation by retaining critical clades and promoting adaptive evolution [35].
The expansion of CAD gene families is a common feature in land plant evolution. For example, green algae possess only one single CAD homolog, whereas A. thaliana and Z. mays retain 9 and 12 members, respectively [17,26,36]. The expansion of CAD genes correlates with the increasing complexity of plant cell walls. They may provide plants with increased enzyme activity, which promotes lignin synthesis and cell wall reinforcement, thereby enabling plants to better adapt to environmental stress [36]. There are only two bona fide CAD genes in A. thaliana [17]. However, the number of bona fide CAD genes in Group III of the Brassica U-triangle species has increased to two to six (Table S1). This suggests a significant amplification of CAD genes in Group III during evolution, indicating that these genes may play a stronger role in lignification in the Brassica U-triangle species, which needs further validation. The Ka/Ks ratio is a crucial indicator for assessing the evolutionary forces acting on genes. A Ka/Ks ratio less than 1 indicates purifying selection (i.e., functional conservation), while a ratio greater than 1 suggests positive selection (i.e., functional innovation) [37]. In this study, we found that 90% of the CAD gene pairs in the U-triangle species are under purifying selection, with Ka/Ks ratios less than 1 and predominantly within the 0–0.5 range. This finding indicates that their core functions, such as lignin synthesis, are highly conserved during evolution. However, three gene pairs (BolCAD8-BcaCAD6a, BraCAD6-BnaCAD6a, and BolCAD-BnaCAD8) exhibited significant signals of positive selection, with Ka/Ks ratios greater than 1.14 and even up to 2.17, implying that they have undergone adaptive evolution in specific habitats (Figure 6). This selective pressure may drive functional innovation, such as some copies shifting toward stress response while others maintain the conserved function of lignin synthesis (Figure 8). These results demonstrate that gene loss and expansion are not opposing processes but rather jointly shape functional diversity through pruning redundancy and strengthening core functions.

3.2. Transcriptional Regulation of BnaCAD Genes in Stress Responses and Seed Coat Color Formation

The cis-acting elements in promoters are fundamental transcriptional regulatory units that play crucial roles in regulating gene expression associated with numerous biological processes and stress responses [38]. For instance, ABA-responsive elements (ABREs) activate downstream stress-responsive genes via the SnRK2-AREB/ABF signaling cascade [39]. In this study, we identified four phytohormone-responsive cis-acting elements (ABA, auxin, MeJA, and gibberellin) and stress-resistance cis-acting elements in the promoters of BnaCAD genes (Figure 7). It suggests that the expression of BnaCAD genes may be regulated by multiple signaling pathways involved in both hormone responses and stress adaptation. It is worth noting that ABREs were widely distributed across 13 BnaCAD genes. During the late phases of drought and osmotic stress, the expression levels of BnaCAD5b, BnaCAD5c, BnaCAD5d, and BnaCAD8 were significantly upregulated (Figure 8), consistent with their differential expression patterns under ABA treatment (Figure 9). This co-regulation suggests that these genes may enhance stress tolerance through ABA-mediated pathways, potentially via SnRK2-AREB/ABF signaling cascades that activate downstream stress-responsive targets, which needs further validation. In contrast, BnaCAD4a and BnaCAD4b exhibited a distinct expression trend under drought and osmotic stress, with initial upregulation followed by downregulation (Figure 8). Such divergence implies that they may regulate stress response through other pathways independent of ABA-mediated pathways. These findings highlight the functional diversification of BnaCAD genes, where specific members adopt distinct transcriptional strategies to optimize adaptive responses under fluctuating environmental conditions. Flavonoids, as secondary metabolites, play crucial roles in plant pigmentation and resistance against biotic and abiotic stresses [32]. For instance, they are involved in the color formation of yellow seed coats in B. napus [40]. Previous studies have reported a strong negative correlation between lignin content and seed coat color, which may be attributed to the fact that the lignin and flavonoid biosynthesis pathways share the same substrate [41,42,43]. In the Brassicaceae family, less lignin deposition is closely associated with lighter seed coat pigmentation [11], with B. napus serving as a prime exemplar where lignin has been shown to play a crucial role in the formation of yellow-seeded phenotypes [12]. In this study, some MYB binding sites known to be associated with flavonoid biosynthesis were identified in the promoters of most BnaCAD genes (Figure 7), suggesting that BnaCAD genes may play a potential role in the flavonoid pathway. Meanwhile, the expression of four bona fide BnaCAD genes (BnaCAD4a, BnaCAD4b, BnaCAD5b, and BnaCAD5d) was significantly lower in yellow-seeded materials compared to black-seeded ones. This suggests that they may influence seed coat color through the regulation of lignin synthesis (Figure 10). Therefore, future research should explore the interaction between lignin and flavonoid metabolism to comprehensively unravel the molecular mechanisms underlying seed coat color formation influenced by BnaCAD genes.
It has been widely reported that some transcription factors modulate the expression of genes in the phenylpropanoid pathway in response to light signals [44,45]. For example, the MYB75/PAP1 transcription factor, which responds to blue and red light, is involved in anthocyanin biosynthesis in A. thaliana [46]. Similarly, the blue-light signal can influence the biosynthesis of lignin by transcription factor in the stone cells of pear fruits [47]. In this study, it was found that the promoter regions of all BnaCAD genes contain light-responsive cis-acting elements. It suggests that light may influence the biosynthesis of lignin or flavonoids by regulating the expression of these genes, thereby modulating the color of the seed coat (Figure 7). Future research could analyze the dynamic changes of lignin and flavonoid metabolites in yellow- and black-seeded materials under different light conditions to decipher the mechanism by which light signals allocate metabolic fluxes.
Although this study has elucidated the evolutionary patterns and functional diversification of the CAD gene family, direct functional validation remains a limitation. Future research will address this gap by confirming the functions of these genes through CRISPR/Cas9 gene-editing technology or other techniques and will further investigate their regulatory networks in seed coat pigmentation and abiotic stress responses in B. napus.

4. Materials and Methods

4.1. Plant Materials and Growth Conditions

The B. napus materials used in this study comprised two black-seeded cultivars, Zhongshuang11 (ZS11) and Zhongyou 821 (ZY821), and two yellow-seeded accessions, L956 and L1188. These materials were cultivated at the experimental base at Southwest University in Chongqing, China. Five healthy and robust plants were randomly selected from each line for experimentation. The flowering time was marked using colored wool threads for collecting the seeds at various developmental stages. Immediately upon collection, the seeds were immersed in liquid nitrogen and stored at −80 °C for subsequent analyses.

4.2. Identification and Annotation of CAD Family Genes

The genome information of five U-triangle species (B. rapa cv. Chiifu V3.5, B. nigra cv. NI100 v2, B. oleracea cv. JZS v2, B. juncea cv. tum V2.0, B. napus cv. ZS11 HZAU V1.0) was obtained from the Brassica Database (BRAD, http://brassicadb.cn, accessed on 8 October 2024) and the B. napus multi-omics information resource database (BnIR, https://yanglab.hzau.edu.cn/BnIR, accessed on 8 October 2024) [48]. The genome data of B. carinata was retrieved from the NCBI Blastp program (https://blast.ncbi.nlm.nih.gov/Blast.cgi?PROGRAM=blastp&PAGE_TYPE=BlastSearch&LINK_LOC=blasthome, accessed on 8 October 2024) [49]. The amino acid sequences of nine CAD proteins from A. thaliana (AT1G72680, AT2G21730, AT2G21890, AT3G19450, AT4G34230, AT4G37970, AT4G37980, AT4G37990, and AT4G39330) were retrieved from the TAIR database (https://www.arabidopsis.org/, accessed on 8 October 2024) and used as queries. TBtools-BLAST (v2.154) [50] and NCBI Blastp program (https://blast.ncbi.nlm.nih.gov/Blast.cgi?PROGRAM=blastp&PAGE_TYPE=BlastSearch&LINK_LOC=blasthome, accessed on 11 October 2024) were employed to identify the CAD family proteins with the default parameters. The Conserved Domain Database (CDD) [51] from the National Center for Biotechnology Information (NCBI, https://www.ncbi.nlm.nih.gov/Structure/cdd, accessed on 11 October 2024) was used to examine conserved domains of CAD proteins. Additionally, TBtools-BatchSMART was used for visualizing domains. Tbtools-Protein Parameter Calc was used to predict the length (number of amino acid residues), molecular weight (MW, in kDa), isoelectric point (pI), and stability index of each CAD protein. The subcellular locations of proteins were predicted using the Plant Cell-PLoc 2.0-mPLoc (http://www.csbio.sjtu.edu.cn/bioinf/plant-multi/, accessed on 18 October 2024) [52].

4.3. Comparative Sequence Alignment and Evolutionary Divergence Assessment of CAD Family Genes

To visualize the conserved domains within CAD protein sequences, Jalview 2 was used for multiple sequence alignment (http://www.jalview.org/, accessed on 27 October 2024) [53]. Subsequently, sequence logos for the three conservative regions were generated using WebLogo Version 2.8.2 (http://weblogo.berkeley.edu/logo.cgi, accessed on 27 October 2024) [54].
The evolutionary relationship and divergence among proteins were inferred through phylogenetic analysis. The phylogenetic tree was constructed using MEGA 11 (Tokyo Metropolitan University, Tokyo, Japan) with the following parameters: MUSCLE alignment, Jones–Taylor–Thornton (JTT) model, Bootstrap method with 1000 replicates, and partial deletion threshold at 80% [55]. The tree was then refined and visualized using Evolview (https://www.evolgenius.info/evolview/#/, accessed on 26 October 2024) [56].

4.4. Functional Domain Conservation and Genomic Architecture Profiling in CAD Family Genes

The Multiple Expectation Maximization for Motif Elucidation (MEME) program (version 5.5.0) was employed to identify conserved motifs present within CAD proteins [57]. The MEME Suite is accessible online at https://meme-suite.org/meme/doc/meme.html (accessed on 29 October 2024). Subsequently, the identified motif structures, gene structures, and evolutionary relationships were visualized using the TBtools software [49], available at https://github.com/CJ-Chen/TBtools (accessed on 29 October 2024).

4.5. Chromosomal Distribution and Colinearity Analysis of CAD Genes

The General Feature Format (GFF) genome files of the U-triangle species were obtained from the Brassica napus multi-omics information resource database (BnIR) (available at https://yanglab.hzau.edu.cn/BnIR, accessed on 2 November 2024) [48]. The chromosomal location information of the CAD family genes was extracted from these files. Subsequently, MapChart V2.32 was employed to map the CAD family genes onto their corresponding chromosomes and to visualize their distribution [58]. To identify gene duplication patterns and perform collinearity analysis, TBtools-One Step MCScanX and TBtools-Amazing Super Circos were utilized. Additionally, the nonsynonymous substitution rate (Ka) and synonymous replacement rate (Ks) were calculated, and the selective pressures on gene evolution were assessed using the Ka/Ks ratio [37].

4.6. Cis-Element Analysis of BnaCAD Promoters

To elucidate the cis-acting elements of the BnaCAD genes, we employed the TBtools-Gtf/GFF3 Sequences Extract tool to retrieve 2000 bp upstream sequences of these genes. Subsequently, these sequences were submitted to the Plant CARE database (http://bioinformatics.psb.ugent.be/webtools/plantcare/html/; accessed on 2 January 2025) for the prediction of putative cis-acting elements [59]. The identified elements were then visualized using the Tbtools-Simple BioSequence Viewer.

4.7. Expression Profile Analysis of BnaCAD Genes

To elucidate the roles of CAD genes in response to abiotic stress and hormone treatment in B. napus, we analyzed public RNA-Seq datasets. Specifically, we obtained RNA-Seq data for drought and osmotic stress treatments from the Brassica napus Integrated Resource (BnIR) database (https://yanglab.hzau.edu.cn/BnIR, accessed on 2 January 2025) [48]. Additionally, we retrieved the RNA-Seq data for ABA treatment of ZS11 from BnaGADB v1.0 (http://www.bnagadb.cn/, accessed on 2 January 2025). The relative expression levels of the genes were normalized using the Log10 (FPKM value + 1) method, and heatmaps were generated with TBtools to visualize the expression patterns of BnaCAD genes [60].
Among the six bona fide CAD genes identified in B. napus (Table S1), four highly expressed CAD genes, including BnaCAD4a, BnaCAD4b, BnaCAD5a, and BnaCAD5b, were selected for further investigation into their roles in regulating seed coat color. These selections were based on published RNA-Seq data from the BnIR database. We used RT-qPCR to analyze the expression profiles of these genes in seeds of two yellow-seeded materials (L956, L1188) and two black-seeded materials (ZS11, ZY821) at 20, 30, and 40 DAF (days after flowering). Total RNA was extracted from the seeds at different developmental stages using an EZ-10 DNAaway RNA Mini-Prep Kit (Sangon, Shanghai, China) according to the manufacturer’s instructions. The extracted RNA was reverse-transcribed into complementary DNA (cDNA) using ExonScript RT Mix (with dsDNase) kit (Baoguang, Chongqing, China). Subsequently, quantitative real-time PCR (qPCR) was performed in triplicate on a Bio-Rad CFX96 Real-Time System (Bio-Rad Laboratories, Hercules, CA, USA) using SYBR Premix Ex Taq II (Takara, Dalian, China). The relative expression levels were calculated using the 2−∆∆CT method [61], with BnaActin7 as the internal standard. The primers used in this study are listed in Table S2.

5. Conclusions

This study provides a comprehensive characterization of the CAD gene family in the Brassica U-triangle species, identifying 90 CAD genes and elucidating their roles in lignin biosynthesis, abiotic stress adaptation, and seed coat pigmentation. The findings offer valuable insights for breeding B. napus cultivars with enhanced oil quality and stress resilience, potentially improving the productivity under environmental constraints. Future work will focus on validating the functions of key CAD genes using CRISPR/Cas9 and exploring the interplay between lignin and flavonoid metabolism to further optimize seed traits and stress responses.

Supplementary Materials

The following supporting information can be downloaded at: https://www.mdpi.com/article/10.3390/plants14081184/s1, Table S1: Characteristics of CADs from the Brassica U-triangle species.; Table S2: Primers used for RT-qPCR analysis of four BnaCAD genes.

Author Contributions

Conceptualization, C.Q. and H.W.; methodology, Y.L. (Yiwei Liu); software, Y.L. (Yiwei Liu), M.Z. and Y.L. (Yuanyuan Liu); validation, Z.W., Y.Y. and M.T.; formal analysis, Y.L. (Yiwei Liu), Y.L. (Yuanyuan Liu) and Z.W.; resources, H.D., N.Y. and H.Z.; data curation, H.Z., M.T. and N.P.; writing—original draft preparation, Y.L. (Yiwei Liu), C.Q. and H.W.; writing—review and editing, H.D., C.Q. and H.W.; supervision, C.Q. and H.W. All authors have read and agreed to the published version of the manuscript.

Funding

This research was funded by National Natural Science Foundation of China (32372189, 32272150), Natural Science Foundation of Chongqing, China (CSTB2024NSCQ-MSX0293, CSTB2022NSCQ-MSX0790), The Earmarked Fund for CARS-12, and Innovation and Entrepreneurship Training Programs for Undergraduates (S202410635204, S202410635206).

Data Availability Statement

All additional datasets supporting the findings of this study are included within the article and Supplementary Materials.

Conflicts of Interest

The authors declare no conflicts of interest.

References

  1. Prakash, S.; Bhat, S.R.; Quiros, C.F.; Kirti, P.B.; Chopra, V.L. Brassica and Its Close Allies: Cytogenetics and Evolution. In Plant Breeding Reviews; John Wiley & Sons: Hoboken, NJ, USA, 2009; pp. 21–187. [Google Scholar] [CrossRef]
  2. Nagaharu, U. Genome Analysis in Brassica with Special Reference to the Experimental Formation of B. napus and Peculiar Mode of Fertilization. Jpn. J. Bot. 1935, 7, 389–452. [Google Scholar]
  3. Chalhoub, B.; Denoeud, F.; Liu, S.; Parkin, I.A.P.; Tang, H.; Wang, X.; Chiquet, J.; Belcram, H.; Tong, C.; Samans, B.; et al. Early Allopolyploid Evolution in the Post-Neolithic Brassica napus Oilseed Genome. Science 2014, 345, 950–953. [Google Scholar] [CrossRef] [PubMed]
  4. Yang, J.; Liu, D.; Wang, X.; Ji, C.; Cheng, F.; Liu, B.; Hu, Z.; Chen, S.; Pental, D.; Ju, Y.; et al. The Genome Sequence of Allopolyploid Brassica juncea and Analysis of Differential Homoeolog Gene Expression Influencing Selection. Nat. Genet. 2016, 48, 1225–1232. [Google Scholar] [CrossRef] [PubMed]
  5. Perumal, S.; Koh, C.S.; Jin, L.; Buchwaldt, M.; Higgins, E.E.; Zheng, C.; Sankoff, D.; Robinson, S.J.; Kagale, S.; Navabi, Z.-K.; et al. A High-Contiguity Brassica nigra Genome Localizes Active Centromeres and Defines the Ancestral Brassica Genome. Nat. Plants 2020, 6, 929–941. [Google Scholar] [CrossRef]
  6. Guo, N.; Wang, S.; Gao, L.; Liu, Y.; Wang, X.; Lai, E.; Duan, M.; Wang, G.; Li, J.; Yang, M.; et al. Genome Sequencing Sheds Light on the Contribution of Structural Variants to Brassica oleracea Diversification. BMC Biol. 2021, 19, 93. [Google Scholar] [CrossRef]
  7. Zhang, L.; Liang, J.; Chen, H.; Zhang, Z.; Wu, J.; Wang, X. A Near-Complete Genome Assembly of Brassica rapa Provides New Insights into the Evolution of Centromeres. Plant Biotechnol. J. 2023, 21, 1022–1032. [Google Scholar] [CrossRef]
  8. Song, X.; Wei, Y.; Xiao, D.; Gong, K.; Sun, P.; Ren, Y.; Yuan, J.; Wu, T.; Yang, Q.; Li, X.; et al. Brassica carinata Genome Characterization Clarifies U’s Triangle Model of Evolution and Polyploidy in Brassica. Plant Physiol. 2021, 186, 388–406. [Google Scholar] [CrossRef]
  9. Li, Y.; Zhang, L.; Hu, S.; Zhang, J.; Wang, L.; Ping, X.; Wang, J.; Li, J.; Lu, K.; Tang, Z.; et al. Transcriptome and Proteome Analyses of the Molecular Mechanisms Underlying Changes in Oil Storage under Drought Stress in Brassica napus L. GCB Bioenergy 2021, 13, 1071–1086. [Google Scholar] [CrossRef]
  10. Qu, C.; Zhao, H.; Fu, F.; Wang, Z.; Zhang, K.; Zhou, Y.; Wang, X.; Wang, R.; Xu, X.; Tang, Z.; et al. Genome-Wide Survey of Flavonoid Biosynthesis Genes and Gene Expression Analysis between Black- and Yellow-Seeded Brassica napus. Front. Plant Sci. 2016, 7, 1755. [Google Scholar] [CrossRef]
  11. Cheng, Y. Molecular Mechanism of Manipulating Seed Coat Coloration in Oilseed Brassica Species. J. Appl. Genet. 2013, 54, 135–145. [Google Scholar] [CrossRef]
  12. Ran, X.; Wan, H.; Li, J.; Liang, Y.; Xu, J. An Investigation of the Relationship between Lignin Content and Seed Coat Traits in Yellow-Seeded Brassica napus L. J. Agric. Res. 2015, 3, 1–8. [Google Scholar] [CrossRef]
  13. Raza, A. Eco-physiological and Biochemical Responses of Rapeseed (Brassica napus L.) to Abiotic Stresses: Consequences and Mitigation Strategies. J. Plant Growth Regul. 2020, 40, 1368–1388. [Google Scholar] [CrossRef]
  14. Iqbal, S.; Wang, X.; Mubeen, I.; Kamran, M.; Kanwal, I.; Díaz, G.A.; Abbas, A.; Parveen, A.; Atiq, M.N.; Alshaya, H.; et al. Phytohormones Trigger Drought Tolerance in Crop Plants: Outlook and Future Perspectives. Front. Plant Sci. 2022, 12, 799318. [Google Scholar] [CrossRef] [PubMed]
  15. Ran, X.; Liang, Y.; Li, J. Analysis of the Lignin Contents and Related Enzymes Activities in Seed Coat Between Black-Seeded and Yellow-Seeded Rapes (Brassica napus L.). Agric. Sci. China 2005, 4, 890–897. [Google Scholar]
  16. Boudet, A.-M.; Hawkins, S.; Rochange, S. The Polymorphism of the Genes/Enzymes Involved in the Last Two Reductive Steps of Monolignol Synthesis: What Is the Functional Significance? C. R. Biol. 2004, 327, 837–845. [Google Scholar] [CrossRef]
  17. Kim, S.-J.; Kim, M.-R.; Bedgar, D.L.; Moinuddin, S.G.A.; Cardenas, C.L.; Davin, L.B.; Kang, C.; Lewis, N.G. Functional Reclassification of the Putative Cinnamyl Alcohol Dehydrogenase Multigene Family in Arabidopsis. Proc. Natl. Acad. Sci. USA 2004, 101, 1455–1460. [Google Scholar] [CrossRef]
  18. Chao, N.; Huang, S.; Kang, X.; Yidilisi, K.; Dai, M.; Liu, L. Systematic Functional Characterization of Cinnamyl Alcohol Dehydrogenase Family Members Revealed Their Functional Divergence in Lignin Biosynthesis and Stress Responses in Mulberry. Plant Physiol. Biochem. 2022, 186, 145–156. [Google Scholar] [CrossRef]
  19. Jin, Y.; Zhang, C.; Liu, W.; Qi, H.; Chen, H.; Cao, S. The Cinnamyl Alcohol Dehydrogenase Gene Family in Melon (Cucumis melo L.): Bioinformatic Analysis and Expression Patterns. PLoS ONE. 2014, 9, e101730. [Google Scholar] [CrossRef]
  20. Yusuf, C.Y.L.; Nabilah, N.S.; Taufik, N.A.A.M.; Seman, I.A.; Abdullah, M.P. Genome-Wide Analysis of the CAD Gene Family Reveals Two Bona Fide CAD Genes in Oil Palm. 3 Biotech. 2022, 12, 149. [Google Scholar] [CrossRef]
  21. Barakat, A.; Bagniewska-Zadworna, A.; Choi, A.; Plakkat, U.; DiLoreto, D.S.; Yellanki, P.; Carlsonet, G.E. The Cinnamyl Alcohol Dehydrogenase Gene Family in Populus: Phylogeny, Organization, and Expression. BMC Plant Biol. 2009, 9, 26. [Google Scholar] [CrossRef]
  22. Tobias, C.M.; Chow, E.K. Structure of the Cinnamyl-Alcohol Dehydrogenase Gene Family in Rice and Promoter Activity of a Member Associated with Lignification. Planta 2005, 220, 678–688. [Google Scholar] [CrossRef] [PubMed]
  23. Raes, J.; Rohde, A.; Christensen, J.H.; Van de Peer, Y.; Boerjan, W. Genome-Wide Characterization of the Lignification Toolbox in Arabidopsis. Plant Physiol. 2003, 133, 1051–1071. [Google Scholar] [CrossRef] [PubMed]
  24. Goffner, D.; Joffroy, I.; Grima-Pettenati, J.; Halpin, C.; Knight, M.E.; Schuch, W.; Boudet, A.M. Purification and Characterization of Isoforms of Cinnamyl Alcohol Dehydrogenase from Eucalyptus Xylem. Planta 1992, 188, 48–53. [Google Scholar] [CrossRef] [PubMed]
  25. Hirano, K.; Aya, K.; Kondo, M.; Okuno, A.; Morinaka, Y.; Matsuoka, M. OsCAD2 Is the Major CAD Gene Responsible for Monolignol Biosynthesis in Rice Culm. Plant Cell Rep. 2012, 31, 91–101. [Google Scholar] [CrossRef]
  26. Liu, X.; Van Acker, R.; Voorend, W.; Pallidis, A.; Goeminne, G.; Pollier, J.; Morreel, K.; Kim, H.; Muylle, H.; Bosio, M.; et al. Rewired Phenolic Metabolism and Improved Saccharification Efficiency of a Zea Mays Cinnamyl Alcohol Dehydrogenase 2 (Zmcad2) Mutant. Plant J. Cell Mol. Biol. 2021, 105, 1240–1257. [Google Scholar] [CrossRef]
  27. Kiedrowski, S.; Kawalleck, P.; Hahlbrock, K.; Somssich, I.E.; Dangl, J.L. Rapid Activation of a Novel Plant Defense Gene Is Strictly Dependent on the Arabidopsis RPM1 Disease Resistance Locus. EMBO J. 1992, 11, 4677–4684. [Google Scholar] [CrossRef]
  28. Kim, Y.-H.; Bae, J.M.; Huh, G.-H. Transcriptional Regulation of the Cinnamyl Alcohol Dehydrogenase Gene from Sweet Potato in Response to Plant Developmental Stage and Environmental Stress. Plant Cell Rep. 2010, 29, 779–791. [Google Scholar] [CrossRef]
  29. Dwyer, K.G.; Berger, M.T.; Ahmed, R.; Hritzo, M.K.; McCulloch, A.A.; Price, M.J.; Serniak, N.J.; Walsh, L.T.; Nasrallah, J.B.; Nasrallah, M.E. Molecular Characterization and Evolution of Self-Incompatibility Genes in Arabidopsis thaliana: The Case of the Sc Haplotype. Genetics 2013, 193, 985–994. [Google Scholar] [CrossRef]
  30. Seymour, D.K.; Chae, E.; Arioz, B.I.; Koenig, D.; Weigel, D. Transmission Ratio Distortion is Frequent in Arabidopsis thaliana Controlled Crosses. Heredity 2019, 122, 294–304. [Google Scholar] [CrossRef]
  31. Xu, G.; Guo, C.; Shan, H.; Kong, H. Divergence of Duplicate Genes in Exon-Intron Structure. Proc. Natl. Acad. Sci. USA 2012, 109, 1187–1192. [Google Scholar] [CrossRef]
  32. Panche, A.N.; Diwan, A.D.; Chandra, S.R. Flavonoids: An Overview. J. Nutr. Sci. 2016, 5, e47. [Google Scholar] [CrossRef] [PubMed]
  33. Soltis, P.S.; Marchant, D.B.; Van de Peer, Y.; Soltis, D.E. Polyploidy and Genome Evolution in Plants. Curr. Opin. Genet. Dev. 2015, 35, 119–125. [Google Scholar] [CrossRef] [PubMed]
  34. Liu, S.; Liu, Y.; Yang, X.; Tong, C.; Edwards, D.; Parkin, I.A.P.; Zhao, M.; Ma, J.; Yu, J.; Huang, S.; et al. The Brassica oleracea Genome Reveals the Asymmetrical Evolution of Polyploid Genomes. Nat. Commun. 2014, 5, 3930. [Google Scholar] [CrossRef] [PubMed]
  35. Town, C.D.; Cheung, F.; Maiti, R.; Crabtree, J.; Haas, B.J.; Wortman, J.R.; Hine, E.E.; Althoff, R.; Arbogast, T.S.; Tallon, L.J.; et al. Comparative Genomics of Brassica Oleracea and Arabidopsis Thaliana Reveal Gene Loss, Fragmentation, and Dispersal after Polyploidy. Plant Cell 2006, 18, 1348–1359. [Google Scholar] [CrossRef]
  36. Guo, D.-M.; Ran, J.-H.; Wang, X.-Q. Evolution of the Cinnamyl/Sinapyl Alcohol Dehydrogenase (CAD/SAD) Gene Family: The Emergence of Real Lignin Is Associated with the Origin of Bona Fide CAD. J. Mol. Evol. 2010, 71, 202–218. [Google Scholar] [CrossRef]
  37. Li, J.; Zhang, Z.; Vang, S.; Yu, J.; Wong, G.K.-S.; Wang, J. Correlation Between Ka/Ks and Ks is Related to Substitution Model and Evolutionary Lineage. J. Mol. Evol. 2009, 68, 414–423. [Google Scholar] [CrossRef]
  38. Ibraheem, O.; Botha, C.E.J.; Bradley, G. In Silico Analysis of Cis-Acting Regulatory Elements in 5’ Regulatory Regions of Sucrose Transporter Gene Families in Rice (Oryza sativa Japonica) and Arabidopsis thaliana. Comput. Biol. Chem. 2010, 34, 268–283. [Google Scholar] [CrossRef]
  39. Yoshida, T.; Christmann, A.; Yamaguchi-Shinozaki, K.; Grill, E.; Fernie, A.R. Revisiting the Basal Role of ABA—Roles Outside of Stress. Trends Plant Sci. 2019, 24, 625–635. [Google Scholar] [CrossRef]
  40. Qu, C.; Zhu, M.; Hu, R.; Niu, Y.; Chen, S.; Zhao, H.; Li, C.; Wang, Z.; Yin, N.; Sun, F.; et al. Comparative Genomic Analyses Reveal the Genetic Basis of the Yellow-Seed Trait in Brassica napus. Nat. Commun. 2023, 14, 5194. [Google Scholar] [CrossRef]
  41. Liu, L.; Stein, A.; Wittkop, B.; Sarvari, P.; Li, J.; Yan, X.; Dreyer, F.; Frauen, M.; Friedt, W.; Snowdon, R.J. A Knockout Mutation in the Lignin Biosynthesis Gene CCR1 Explains a Major QTL for Acid Detergent Lignin Content in Brassica napus Seeds. Theor. Appl. Genet. 2012, 124, 1573–1586. [Google Scholar] [CrossRef]
  42. Liu, L.; Qu, C.; Wittkop, B.; Yi, B.; Xiao, Y.; He, Y.; Snowdon, R.J.; Li, J. A High-Density SNP Map for Accurate Mapping of Seed Fibre QTL in Brassica napus L. PLoS ONE. 2013, 8, e83052. [Google Scholar] [CrossRef] [PubMed]
  43. Badani, A.G.; Snowdon, R.J.; Wittkop, B.; Lipsa, F.D.; Baetzel, R.; Horn, R.; De, H.A.; Font, R.; Lühs, W.; Friedt, W. Colocalization of a Partially Dominant Gene for Yellow Seed Colour with a Major QTL Influencing Acid Detergent Fibre (ADF) Content in Different Crosses of Oilseed Rape (Brassica napus). Genome 2006, 49, 1499–1509. [Google Scholar] [CrossRef] [PubMed]
  44. Chen, M.; Chory, J.; Fankhauser, C. Light Signal Transduction in Higher Plants. Annu. Rev. Genet. 2004, 38, 87–117. [Google Scholar] [CrossRef] [PubMed]
  45. Bhatia, C.; Gaddam, S.R.; Pandey, A.; Trivedi, P.K. COP1 Mediates Light-Dependent Regulation of Flavonol Biosynthesis through HY5 in Arabidopsis. Plant Sci. 2021, 303, 110760. [Google Scholar] [CrossRef]
  46. Shin, D.H.; Choi, M.; Kim, K.; Bang, G.; Cho, M.; Choi, S.-B.; Choi, G.; Park, Y.-I. HY5 regulates anthocyanin biosynthesis by inducing the transcriptional activation of the MYB75/PAP1 transcription factor in Arabidopsis. FEBS Lett. 2013, 587, 1543–1547. [Google Scholar] [CrossRef]
  47. Wang, Q.; Gong, X.; Xie, Z.; Qi, K.; Yuan, K.; Jiao, Y.; Pan, Q.; Zhang, S.; Shiratake, K.; Tao, S. Cryptochrome-Mediated Blue-Light Signal Contributes to Lignin Biosynthesis in Stone Cells in Pear Fruit. Plant Sci. 2022, 318, 111211. [Google Scholar] [CrossRef]
  48. Yang, Z.; Wang, S.; Wei, L.; Huang, Y.; Liu, D.; Jia, Y.; Luo, C.; Lin, Y.; Liang, C.; Hu, Y.; et al. BnIR: A Multi-Omics Database with Various Tools for Brassica napus Research and Breeding. Mol. Plant. 2023, 16, 775–789. [Google Scholar] [CrossRef]
  49. Sayers, E.W.; Bolton, E.E.; Brister, J.R.; Canese, K.; Chan, J.; Comeau, D.C.; Connor, R.; Funk, K.; Kelly, C.; Kim, S.; et al. Database Resources of the National Center for Biotechnology Information. Nucleic Acids Res. 2022, 50, D20–D26. [Google Scholar] [CrossRef]
  50. Chen, C.; Chen, H.; Zhang, Y.; Thomas, H.R.; Frank, M.H.; He, Y.; Xia, R. TBtools: An Integrative Toolkit Developed for Interactive Analyses of Big Biological Data. Mol. Plant. 2020, 13, 1194–1202. [Google Scholar] [CrossRef]
  51. Marchler-Bauer, A.; Bo, Y.; Han, L.; He, J.; Lanczycki, C.J.; Lu, S.; Chitsaz, F.; Derbyshire, M.K.; Geer, R.C.; Gonzales, N.R.; et al. CDD/SPARCLE: Functional Classification of Proteins via Subfamily Domain Architectures. Nucleic Acids Res. 2017, 45, D200–D203. [Google Scholar] [CrossRef]
  52. Chou, K.-C.; Shen, H.-B. Plant-mPLoc: A Top-down Strategy to Augment the Power for Predicting Plant Protein Subcellular Localization. PLoS ONE. 2010, 5, e11335. [Google Scholar] [CrossRef] [PubMed]
  53. Waterhouse, A.M.; Procter, J.B.; Martin, D.M.A.; Clamp, M.; Barton, G.J. Jalview Version 2-A Multiple Sequence Alignment Editor and Analysis Workbench. Bioinformatics 2009, 25, 1189–1191. [Google Scholar] [CrossRef] [PubMed]
  54. Crooks, G.E.; Hon, G.; Chandonia, J.M.; Brenner, S.E. WebLogo: A Sequence Logo Generator. Genome Res. 2004, 14, 1188–1190. [Google Scholar] [CrossRef] [PubMed]
  55. Kumar, S.; Stecher, G.; Li, M.; Knyaz, C.; Tamura, K. MEGA X: Molecular Evolutionary Genetics Analysis across Computing Platforms. Mol. Biol. Evol. 2018, 35, 1547–1549. [Google Scholar] [CrossRef]
  56. Subramanian, B.; Gao, S.H.; Lercher, M.J.; Hu, S.N.; Chen, W.H. Evolview v3: A Webserver for Visualization, Annotation, and Management of Phylogenetic Trees. Nucleic Acids Res. 2019, 47, 270–275. [Google Scholar] [CrossRef]
  57. Bailey, T.L.; Johnson, J.; Grant, C.E.; Noble, W.S. The MEME Suite. Nucleic Acids Res. 2015, 43, W39–W49. [Google Scholar] [CrossRef]
  58. Voorrips, R.E. MapChart: Software for the Graphical Presentation of Linkage Maps and QTLs. J. Hered. 2002, 93, 77–78. [Google Scholar] [CrossRef]
  59. Lescot, M.; Déhais, P.; Thijs, G.; Marchal, K.; Moreau, Y.; Van de Peer, Y.; Rouzé, P.; Rombauts, S. PlantCARE, a Database of Plant Cis-Acting Regulatory Elements and a Portal to Tools for in Silico Analysis of Promoter Sequences. Nucleic Acids Res. 2002, 30, 325–327. [Google Scholar] [CrossRef]
  60. Sun, F.; Chen, Z.; Zhang, Q.; Wan, Y.; Hu, R.; Shen, S.; Chen, S.; Yin, N.; Tang, Y.; Liang, Y.; et al. Genome-Wide Identification of the TIFY Gene Family in Brassiceae and Its Potential Association with Heavy Metal Stress in Rapeseed. Plants 2022, 11, 667. [Google Scholar] [CrossRef]
  61. Hu, J.; Chen, B.; Zhao, J.; Zhang, F.; Xie, T.; Xu, K.; Gao, G.; Yan, G.; Li, H.; Li, L.; et al. Genomic Selection and Genetic Architecture of Agronomic Traits during Modern Rapeseed Breeding. Nat. Genet. 2022, 54, 694–704. [Google Scholar] [CrossRef]
Figure 1. Phylogenetic tree of the CAD protein family from A. thaliana and the Brassica U-triangle species. The CAD family is divided into four groups (Groups I–IV), which are represented in pink, purple, green, and blue, respectively. Species are denoted as follows: A. thaliana (red star), B. napus (blue star), B. rapa (yellow star), B. juncea (pink star), B. oleracea (black star), B. carinata (green star), and B. nigra (purple star).
Plants 14 01184 g001
Figure 2. Multiple sequence alignment of CAD proteins in A. thaliana and the Brassica U-triangle species. (A) Sequence comparison of conserved domains. The darker blue hue indicates a higher degree of sequence conservation. (B) WebLogo analysis of the three conserved domains.
Plants 14 01184 g002
Figure 3. Phylogenetic tree, motif distribution, and gene structure analysis of CADs between A. thaliana and the Brassica U-triangle species. (A) Phylogenetic tree of the CAD protein family from A. thaliana and the Brassica U-triangle species. (B) Conserved motifs of the CAD proteins. Ten motifs are identified using the MEME program and are indicated by differently colored boxes. The black line indicates the relative length of proteins. (C) Gene structure of CADs. The green box denotes the untranslated regions (UTRs), the yellow box represents the coding sequences (CDSs), and the gray line corresponds to introns.
Plants 14 01184 g003
Figure 4. Chromosome distribution of CAD genes in the Brassica U-triangle species. (A) CADs distribution on the A subgenomes in B. juncea, B. napus, and B. rapa. (B) CADs distribution on the B subgenomes in B. juncea, B. nigra, and B. carinata. (C) CADs distribution on the C subgenomes in B. napus, B. carinata, and B. oleracea. The scales on the left indicate the size of the various Brassica chromosomes in Mb. Chromosomes within the same classification are depicted in identical colors.
Plants 14 01184 g004
Figure 5. Collinearity analysis of CAD genes between A. thaliana and Brassica U-triangle species. (A) Collinearity analysis of CAD genes between A. thaliana, B. nigra, B. oleracea, and B. carinata. (B) Collinearity analysis of CAD genes between A. thaliana, B. nigra, B. rapa, and B. juncea. (C) Collinearity analysis of CAD genes between A. thaliana, B. oleracea, B. rapa, and B. napus. Divergent colors of connecting lines indicate distinct synteny relationships among various species.
Plants 14 01184 g005
Figure 6. The distribution of Ka/Ks ratio between the orthologous gene pairs in A. thaliana and Brassica U-triangle species.
Plants 14 01184 g006
Figure 7. Cis-acting elements in the promoter regions of BnaCADs. (A) Distribution and localization of cis-acting elements in the promoter regions of BnaCADs. The scale at the bottom indicates the length of the sequence. The different cis-acting elements are indicated by different colors. (B) Functional classification of cis-acting elements in the promoter regions of BnaCADs.
Plants 14 01184 g007
Figure 8. Expression profiles of CAD genes in B. napus under drought and osmotic treatments. RNA-Seq data are downloaded from BnIR database (https://yanglab.hzau.edu.cn/BnIR, accessed on 2 January 2025). The expression profiles of each BnaCAD were calculated as Log10 (FPKM value + 1). CK (control), no stress. The color bar on the right indicates the relative level of gene expression.
Plants 14 01184 g008
Figure 9. Expression profiles of BnCAD genes in B. napus under ABA treatment. RNA-Seq data are downloaded from BnaGADB v1.0 (http://www.bnagadb.cn/, accessed on 2 January 2025). The expression profile of each BnaCAD was calculated as Log10 (FPKM value + 1). CK (control), no stress. The color bar on the right indicates the relative level of gene expression.
Plants 14 01184 g009
Figure 10. Expression pattern of four BnaCADs in yellow-seeded B. napus materials and black-seeded ones. BnaCAD4a (A), BnaCAD4b (B), BnaCAD5b (C), and BnaCAD5d (D). L956 and L1188, yellow-seeded materials; ZS11 and ZY821, black-seeded materials. DAF, days after flowering. Data of RT-qPCR were normalized to the expression level of BnaActin7. Values are presented as mean ± SD. Statistically significant differences were analyzed using Student’s t-test (*, p < 0.05, **, p < 0.01).
Plants 14 01184 g010
Disclaimer/Publisher’s Note: The statements, opinions and data contained in all publications are solely those of the individual author(s) and contributor(s) and not of MDPI and/or the editor(s). MDPI and/or the editor(s) disclaim responsibility for any injury to people or property resulting from any ideas, methods, instructions or products referred to in the content.

