
Molecular Analysis by Microsatellite Markers of Goji Plants (Lycium barbarum L.) Grown in Central Italy Reveal Genetic Distinction from Both L. barbarum and L. chinense Species

 , , , , , , and
Abstract
1. Introduction
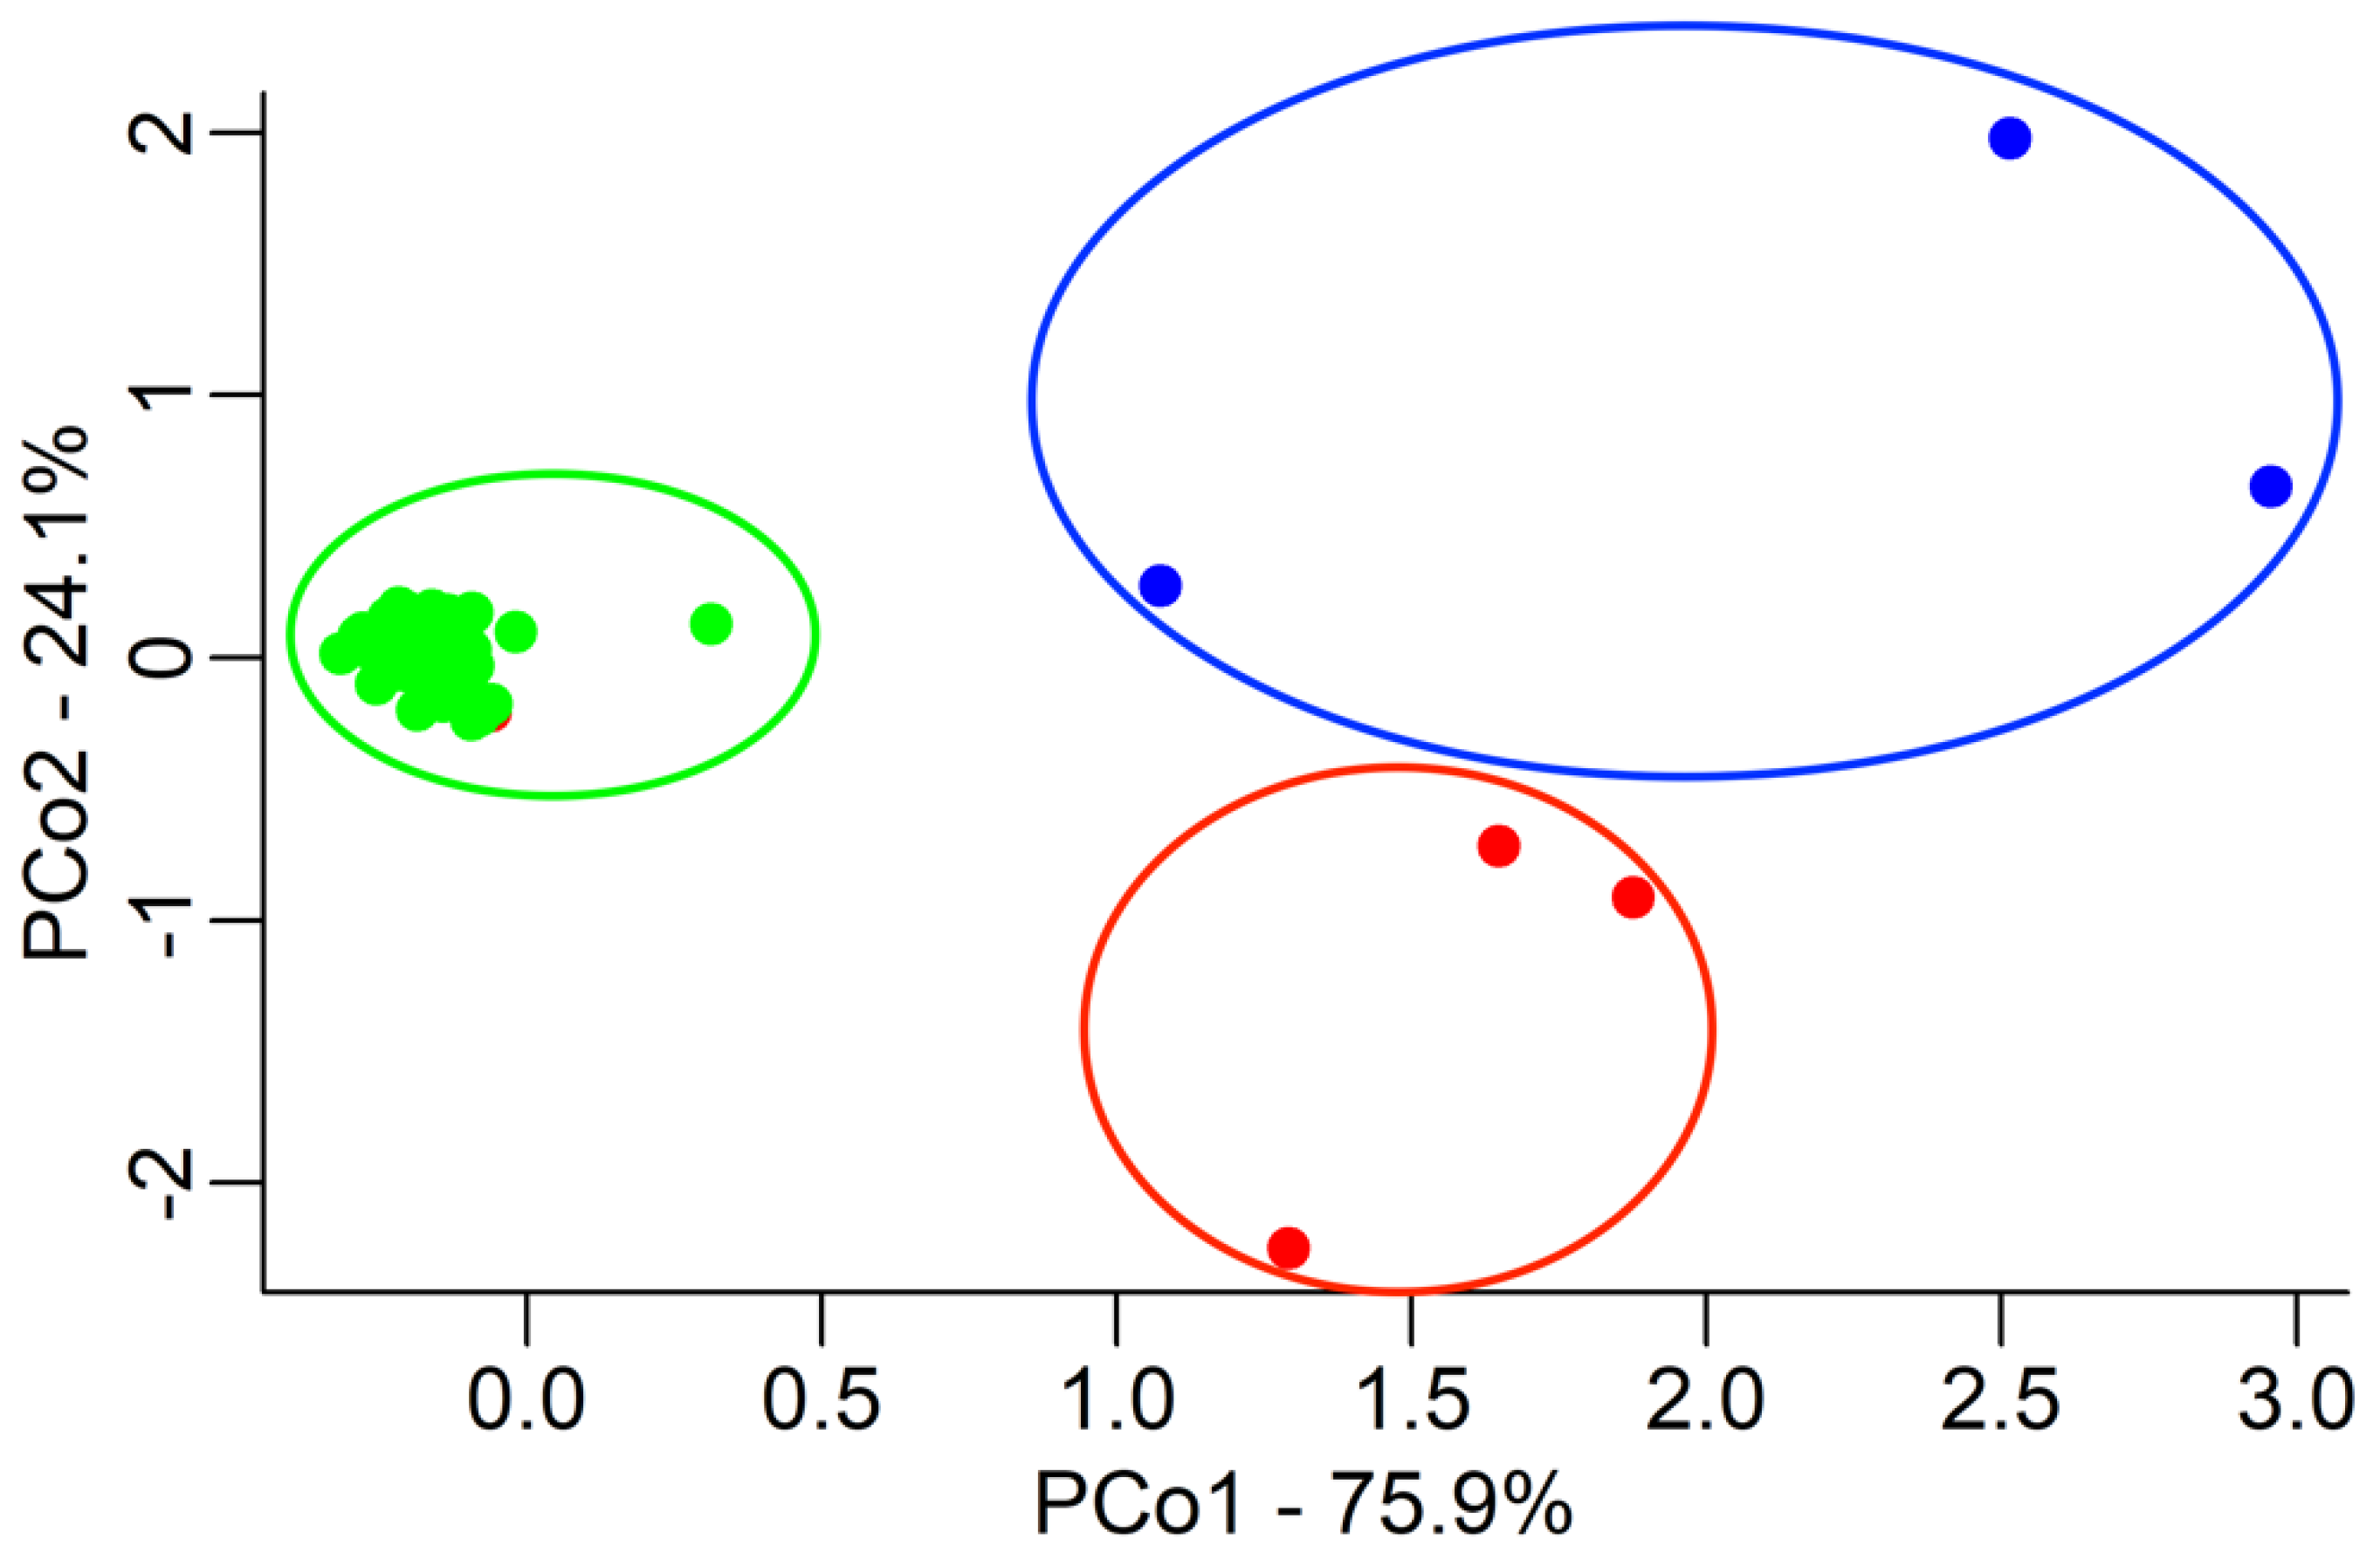
2. Results
3. Discussion
4. Materials and Methods
4.1. Plant Materials
4.2. DNA Extraction
4.3. Molecular Markers
4.4. PCR and Sequencing Protocols
4.5. Data Analysis
Supplementary Materials
Author Contributions
Funding
Data Availability Statement
Acknowledgments
Conflicts of Interest
References
- Hasan, N.; Choudhary, S.; Naaz, N.; Sharma, N.; Laskar, R.A. Recent Advancements in Molecular Marker-Assisted Selection and Applications in Plant Breeding Programmes. J. Genet. Eng. Biotechnol. 2021, 19, 128. [Google Scholar] [CrossRef] [PubMed]
- Amom, T.; Nongdam, P. The Use of Molecular Marker Methods in Plants: A Review. Int. J. Curr. Res. Rev. 2017, 9, 1–7. [Google Scholar]
- Sharma, R.; Joshi, A.; Maloo, S.; Rajaman, G. Assessment of Genetic Finger Printing Using Molecular Marker in Plants: A Review. Sci. Res. Impact 2012, 1, 29–36. [Google Scholar]
- Idrees, M.; Irshad, M. Molecular Markers in Plants for Analysis of Genetic Diversity: A Review. Eur. Acad. Res. 2014, 2, 1513–1540. [Google Scholar]
- Powell, W.; Machray, G.C.; Provan, J. Polymorphism Revealed by Simple Sequence Repeats. Trends Plant Sci. 1996, 1, 215–222. [Google Scholar] [CrossRef]
- Choudhary, A.; Kumar, A.; Kaur, H.; Balamurugan, A.; Padhy, A.K.; Mehta, S. Plant Performance and Defensive Role of β-Amino Butyric Acid Under Environmental Stress. In Plant Performance Under Environmental Stress; Springer: Berlin/Heidelberg, Germany, 2021; pp. 249–275. [Google Scholar]
- Kong, Q.; Zhang, G.; Chen, W.; Zhang, Z.; Zou, X. Identification and Development of Polymorphic EST-SSR Markers by Sequence Alignment in Pepper, Capsicum annuum (Solanaceae). Am. J. Bot. 2012, 99, e59–e61. [Google Scholar] [CrossRef]
- Ismail, N.A.; Rafii, M.; Mahmud, T.; Hanafi, M.; Miah, G. Genetic Diversity of Torch Ginger (Etlingera elatior) Germplasm Revealed by ISSR and SSR Markers. BioMed Res. Int. 2019, 2019, 5904804. [Google Scholar] [CrossRef]
- Wang, Y.; Rashid, M.A.R.; Li, X.; Yao, C.; Lu, L.; Bai, J.; Li, Y.; Xu, N.; Yang, Q.; Zhang, L. Collection and Evaluation of Genetic Diversity and Population Structure of Potato Landraces and Varieties in China. Front. Plant Sci. 2019, 10, 139. [Google Scholar] [CrossRef]
- Banks, S.C.; Cary, G.J.; Smith, A.L.; Davies, I.D.; Driscoll, D.A.; Gill, A.M.; Lindenmayer, D.B.; Peakall, R. How Does Ecological Disturbance Influence Genetic Diversity? Trends Ecol. Evol. 2013, 28, 670–679. [Google Scholar] [CrossRef]
- Ramanatha Rao, V.; Hodgkin, T. Genetic Diversity and Conservation and Utilization of Plant Genetic Resources. Plant Cell Tissue Organ Cult. 2002, 68, 1–19. [Google Scholar] [CrossRef]
- Lee, S.-R.; Choi, J.-E.; Lee, B.-Y.; Yu, J.-N.; Lim, C.E. Genetic Diversity and Structure of an Endangered Medicinal Herb: Implications for Conservation. AoB Plants 2018, 10, ply021. [Google Scholar] [CrossRef] [PubMed]
- Zhang, Y.-B.; Shaw, P.-C.; Sze, C.-W.; Wang, Z.-T.; Tong, Y. Molecular Authentication of Chinese Herbal Materials. J. Food Drug Anal. 2007, 15, 14. [Google Scholar] [CrossRef]
- Amagase, H.; Farnsworth, N.R. A Review of Botanical Characteristics, Phytochemistry, Clinical Relevance in Efficacy and Safety of Lycium barbarum Fruit (Goji). Food Res. Int. 2011, 44, 1702–1717. [Google Scholar] [CrossRef]
- Potterat, O. Goji (Lycium barbarum and L. chinense): Phytochemistry, Pharmacology and Safety in the Perspective of Traditional Uses and Recent Popularity. Planta Medica 2010, 76, 7–19. [Google Scholar] [CrossRef] [PubMed]
- Zhang, K.Y.; Leung, H.; Yeung, H.; Wong, R.N. Differentiation of Lycium barbarum from Its Related Lycium Species Using Random Amplified Polymorphic DNA. Planta Medica 2001, 67, 379–381. [Google Scholar] [CrossRef]
- Sze, S.C.; Song, J.; Wong, R.N.; Feng, Y.; Ng, T.; Tong, Y.; Zhang, K.Y. Application of SCAR (Sequence Characterized Amplified Region) Analysis to Authenticate Lycium barbarum (Wolfberry) and Its Adulterants. Biotechnol. Appl. Biochem. 2008, 51, 15–21. [Google Scholar] [CrossRef]
- Kwon, S.-J.; Lee, G.-A.; Lee, S.-Y.; Park, Y.-J.; Gwag, J.-G.; Kim, T.-S.; Ma, K.-H. Isolation and Characterization of 21 Microsatellite Loci in Lycium Chinense and Cross-Amplification in Lycium barbarum. Conserv. Genet. 2009, 10, 1557. [Google Scholar] [CrossRef]
- Chung, J.-W.; Lee, G.-A.; Lee, S.-S.; Bang, K.-H.; Park, C.-B.; Park, Y.-J. Cultivar Discrimination of Korean and Chinese Boxthorn (Lycium chinense Mill. and Lycium barbarum L.) Using SSR Markers. Korean J. Med. Crop Sci. 2009, 17, 445–451. [Google Scholar]
- Zhao, W.-G.; Chung, J.-W.; Cho, Y.-I.; Rha, W.-H.; Lee, G.-A.; Ma, K.-H.; Han, S.-H.; Bang, K.-H.; Park, C.-B.; Kim, S.-M. Molecular Genetic Diversity and Population Structure in Lycium Accessions Using SSR Markers. Comptes Rendus Biol. 2010, 333, 793–800. [Google Scholar] [CrossRef]
- Gong, H.; Rehman, F.; Yang, T.; Li, Z.; Zeng, S.; Pan, L.; Li, Y.; Wang, Y. Construction of the First High-Density Genetic Map and QTL Mapping for Photosynthetic Traits in Lycium barbarum L. Mol. Breed. 2019, 39, 106. [Google Scholar] [CrossRef]
- Gao, X.; Li, J.; Song, J.; Guo, Q. The SSR Genetic Diversity of Wild Red Fruit Lycium (Lycium barbarum) in Northwest China. Forests 2023, 14, 1598. [Google Scholar] [CrossRef]
- Chen, C.; Xu, M.; Wang, C.; Qiao, G.; Wang, W.; Tan, Z.; Wu, T.; Zhang, Z. Characterization of the Lycium barbarum Fruit Transcriptome and Development of EST-SSR Markers. PLoS ONE 2017, 12, e0187738. [Google Scholar] [CrossRef] [PubMed]
- Bertoldi, D.; Cossignani, L.; Blasi, F.; Perini, M.; Barbero, A.; Pianezze, S.; Montesano, D. Characterisation and Geographical Traceability of Italian Goji Berries. Food Chem. 2019, 275, 585–593. [Google Scholar] [CrossRef]
- Xin, T.; Yao, H.; Gao, H.; Zhou, X.; Ma, X.; Xu, C.; Chen, J.; Han, J.; Pang, X.; Xu, R. Super Food Lycium barbarum (Solanaceae) Traceability via an Internal Transcribed Spacer 2 Barcode. Food Res. Int. 2013, 54, 1699–1704. [Google Scholar] [CrossRef]
- Yao, R.; Heinrich, M.; Weckerle, C.S. The Genus Lycium as Food and Medicine: A Botanical, Ethnobotanical and Historical Review. J. Ethnopharmacol. 2018, 212, 50–66. [Google Scholar] [CrossRef]
- Kalia, R.K.; Rai, M.K.; Kalia, S.; Singh, R.; Dhawan, A. Microsatellite Markers: An Overview of the Recent Progress in Plants. Euphytica 2011, 177, 309–334. [Google Scholar] [CrossRef]
- Wright, S. Variability within and among Natural Populations. In Evolution and the Genetics of Populations; University of Chicago Press: Chicago, IL, USA, 1984; Volume 4. [Google Scholar]
- Fukuda, T.; Yokoyama, J.; Ohashi, H. Phylogeny and Biogeography of the Genus Lycium (Solanaceae): Inferences from Chloroplast DNA Sequences. Mol. Phylogenetics Evol. 2001, 19, 246–258. [Google Scholar] [CrossRef]
- Zhang, D.; Xia, T.; Dang, S.; Fan, G.; Wang, Z. Investigation of Chinese Wolfberry (Lycium Spp.) Germplasm by Restriction Site-Associated DNA Sequencing (RAD-Seq). Biochem. Genet. 2018, 56, 575–585. [Google Scholar] [CrossRef] [PubMed]
- Poggioni, L.; Romi, M.; Guarnieri, M.; Cai, G.; Cantini, C. Nutraceutical Profile of Goji (Lycium barbarum L.) Berries in Relation to Environmental Conditions and Harvesting Period. Food Biosci. 2022, 49, 101954. [Google Scholar] [CrossRef]
- Doyle, J.; Doyle, J.L. Genomic Plant DNA Preparation from Fresh Tissue-CTAB Method. Phytochem. Bull. 1987, 19, 11–15. [Google Scholar]
- Schuelke, M. An Economic Method for the Fluorescent Labeling of PCR Fragments. Nat. Biotechnol. 2000, 18, 233–234. [Google Scholar] [CrossRef] [PubMed]
- Weir, B.; Cockerham, C.C. Estimating F-Statistics for the Analysis of Population Structure. Evolution. Estim. F-Stat. Anal. Popul. Struct. Evol. 1984, 38, 1358–1370. [Google Scholar] [CrossRef]
- Nei, M. Estimation of Average Heterozygosity and Genetic Distance from a Small Number of Individuals. Genetics 1978, 89, 583–590. [Google Scholar] [CrossRef]
- Belkhir, K. GENETIX, Logiciel Sous WindowsTM Pour La Génétique Des Populations. 1999. Available online: https://kimura.univ-montp2.fr/genetix/ (accessed on 9 April 2025).
- Pritchard, J.K.; Stephens, M.; Donnelly, P. Inference of Population Structure Using Multilocus Genotype Data. Genetics 2000, 155, 945–959. [Google Scholar] [CrossRef]
- Evanno, G.; Regnaut, S.; Goudet, J. Detecting the Number of Clusters of Individuals Using the Software STRUCTURE: A Simulation Study. Mol. Ecol. 2005, 14, 2611–2620. [Google Scholar] [CrossRef] [PubMed]
- Earl, D.A.; VonHoldt, B.M. STRUCTURE HARVESTER: A Website and Program for Visualizing STRUCTURE Output and Implementing the Evanno Method. Conserv. Genet. Resour. 2012, 4, 359–361. [Google Scholar] [CrossRef]
- Pagnotta, M.A. Comparison among Methods and Statistical Software Packages to Analyze Germplasm Genetic Diversity by Means of Codominant Markers. J 2018, 1, 197–215. [Google Scholar] [CrossRef]
- Kumar, S.; Stecher, G.; Tamura, K. MEGA7: Molecular Evolutionary Genetics Analysis Version 7.0 for Bigger Datasets. Mol. Biol. Evol. 2016, 33, 1870–1874. [Google Scholar] [CrossRef]


| Marker | Ae | Ao | Ao LB | Ao LC | Ao Field | Observed Size (bp) | Range (bp) |
|---|---|---|---|---|---|---|---|
| GB-LCM-021 | 3 | 4 | 3 | 1 | 4 | 240; 248; 264; 318 | 78 |
| GB-LCM-025 | 3 | 3 | 2 | 2 | 2 | 256; 265; 277 | 21 |
| GB-LCM-075 | 5 | 2 | 1 | 1 | 1 | 187; 230 | 43 |
| GB-LCM-087 | 5 | 4 | 3 | 2 | 3 | 211; 217; 222; 225 | 14 |
| GB-LCM-104 | 3 | 3 | 2 | 2 | 3 | 330; 335; 342 | 12 |
| GB-LCM-119 | 3 | 2 | 2 | 1 | 2 | 277; 281 | 4 |
| GB-LCM-166 | 3 | 3 | 2 | 2 | 4 | 207; 211; 217 | 10 |
| GB-LCM-167 | 6 | 5 | 2 | 2 | 3 | 187; 195; 201; 207; 211 | 24 |
| GB-LCM-199 | 2 | 3 | 1 | 2 | 3 | 292; 302; 314 | 22 |
| Groups | Diversity | ||||
|---|---|---|---|---|---|
| n | NA | He | Ho | FIS | |
| LB | 4 | 2.00 | 0.314 | 0.365 | −0.16 |
| LC | 3 | 1.67 | 0.272 | 0.259 | 0.05 |
| Field | 81 | 3.00 | 0.355 | 0.443 | −0.25 |
| Total/Mean | 88 | 2.22 | 0.314 | 0.356 | |
| LC | Field | |
|---|---|---|
| LB | 0.01 | 0.159 |
| LC | - | 0.357 |
| n. | Clusters | |||
|---|---|---|---|---|
| 1 | 2 | 3 | ||
| LB | 4 | 0.008 | 0.254 | 0.739 |
| LC | 3 | 0.036 | 0.021 | 0.943 |
| Field | 81 | 0.458 | 0.534 | 0.008 |
| Marker | Primer Sequence (5′-3′) | Repeat Motif | Tm (°C) | Size Range (bp) | A | MAF | He | Ho | PIC | |
|---|---|---|---|---|---|---|---|---|---|---|
| Forward | Reverse | |||||||||
| GB-LCM-021 | ATCAAGGCGCTATTTCCC | GGCCGGGATCTGTTAGAC | (AT)4 | 58 | 237–321 | 3 | 0.83 | 0.17 | 0.29 | 0.27 |
| GB-LCM-025 | AAGACAGCACGCCAAAAA | AGCCACCCCCAACTAAAA | (GAG)4 | 58 | 258–267 | 3 | 0.58 | 0.83 | 0.54 | 0.46 |
| GB-LCM-075 | TCTCCTTCGGACCCATTT | TTGGCATAAGGTGCTCGT | (CA)15 | 58 | 136–228 | 5 | 0.40 | 0.80 | 0.72 | 0.68 |
| GB-LCM-087 | CTCCTGAATACCCTGGGC | AGAAGAAGCAGCAGCACG | (GCW)34 | 58 | 117–240 | 5 | 0.58 | 0.50 | 0.61 | 0.58 |
| GB-LCM-104 | TTTGGAATGAAACGACGG | ACACCCCCGAGACTTAGC | (GTT)2, (GTT)2 | 58 | 289–346 | 3 | 0.58 | 0.50 | 0.57 | 0.50 |
| GB-LCM-119 | AATGTACATCGCCCCCA | GATTCGGAGCCTGCTTTT | (CA)4, (CA)4 | 58 | 276–286 | 3 | 0.50 | 1.00 | 0.57 | 0.48 |
| GB-LCM-166 | CTGAGAGCTGATGTGGC | AGGAGGAGAAGGGGGAAG | (TTC)3 | 58 | 213–225 | 3 | 0.50 | 1.00 | 0.58 | 0.49 |
| GB-LCM-167 | CTTGAAGATGGAGGAAAGCA | CCCAAAATTAAAGGGGCA | (GA)7, (GA)18 | 58 | 193–227 | 6 | 0.40 | 0.60 | 0.76 | 0.73 |
| GB-LCM-199 | CCATTTGCACCACAAAGG | TAAGGGCCCTCTTCAACG | (CA)9, (CA)2 | 58 | 293–317 | 3 | 0.67 | 0.67 | 0.49 | 0.42 |
Disclaimer/Publisher’s Note: The statements, opinions and data contained in all publications are solely those of the individual author(s) and contributor(s) and not of MDPI and/or the editor(s). MDPI and/or the editor(s) disclaim responsibility for any injury to people or property resulting from any ideas, methods, instructions or products referred to in the content. |
© 2025 by the authors. Licensee MDPI, Basel, Switzerland. This article is an open access article distributed under the terms and conditions of the Creative Commons Attribution (CC BY) license (https://creativecommons.org/licenses/by/4.0/).
Share and Cite
Poggioni, L.; Cantini, C.; Binelli, G.; Cai, G.; Conti, V.; Mareri, L.; Romi, M.; Piccini, C. Molecular Analysis by Microsatellite Markers of Goji Plants (Lycium barbarum L.) Grown in Central Italy Reveal Genetic Distinction from Both L. barbarum and L. chinense Species. Plants 2025, 14, 1182. https://doi.org/10.3390/plants14081182
Poggioni L, Cantini C, Binelli G, Cai G, Conti V, Mareri L, Romi M, Piccini C. Molecular Analysis by Microsatellite Markers of Goji Plants (Lycium barbarum L.) Grown in Central Italy Reveal Genetic Distinction from Both L. barbarum and L. chinense Species. Plants. 2025; 14(8):1182. https://doi.org/10.3390/plants14081182
Chicago/Turabian StylePoggioni, Letizia, Claudio Cantini, Giorgio Binelli, Giampiero Cai, Veronica Conti, Lavinia Mareri, Marco Romi, and Chiara Piccini. 2025. "Molecular Analysis by Microsatellite Markers of Goji Plants (Lycium barbarum L.) Grown in Central Italy Reveal Genetic Distinction from Both L. barbarum and L. chinense Species" Plants 14, no. 8: 1182. https://doi.org/10.3390/plants14081182
APA StylePoggioni, L., Cantini, C., Binelli, G., Cai, G., Conti, V., Mareri, L., Romi, M., & Piccini, C. (2025). Molecular Analysis by Microsatellite Markers of Goji Plants (Lycium barbarum L.) Grown in Central Italy Reveal Genetic Distinction from Both L. barbarum and L. chinense Species. Plants, 14(8), 1182. https://doi.org/10.3390/plants14081182