
Irrigation Intensities Drive Soil N2O Emission Reduction in Drip-Irrigated Cotton Fields

 ,
,
Abstract
1. Introduction
2. Materials and Methods
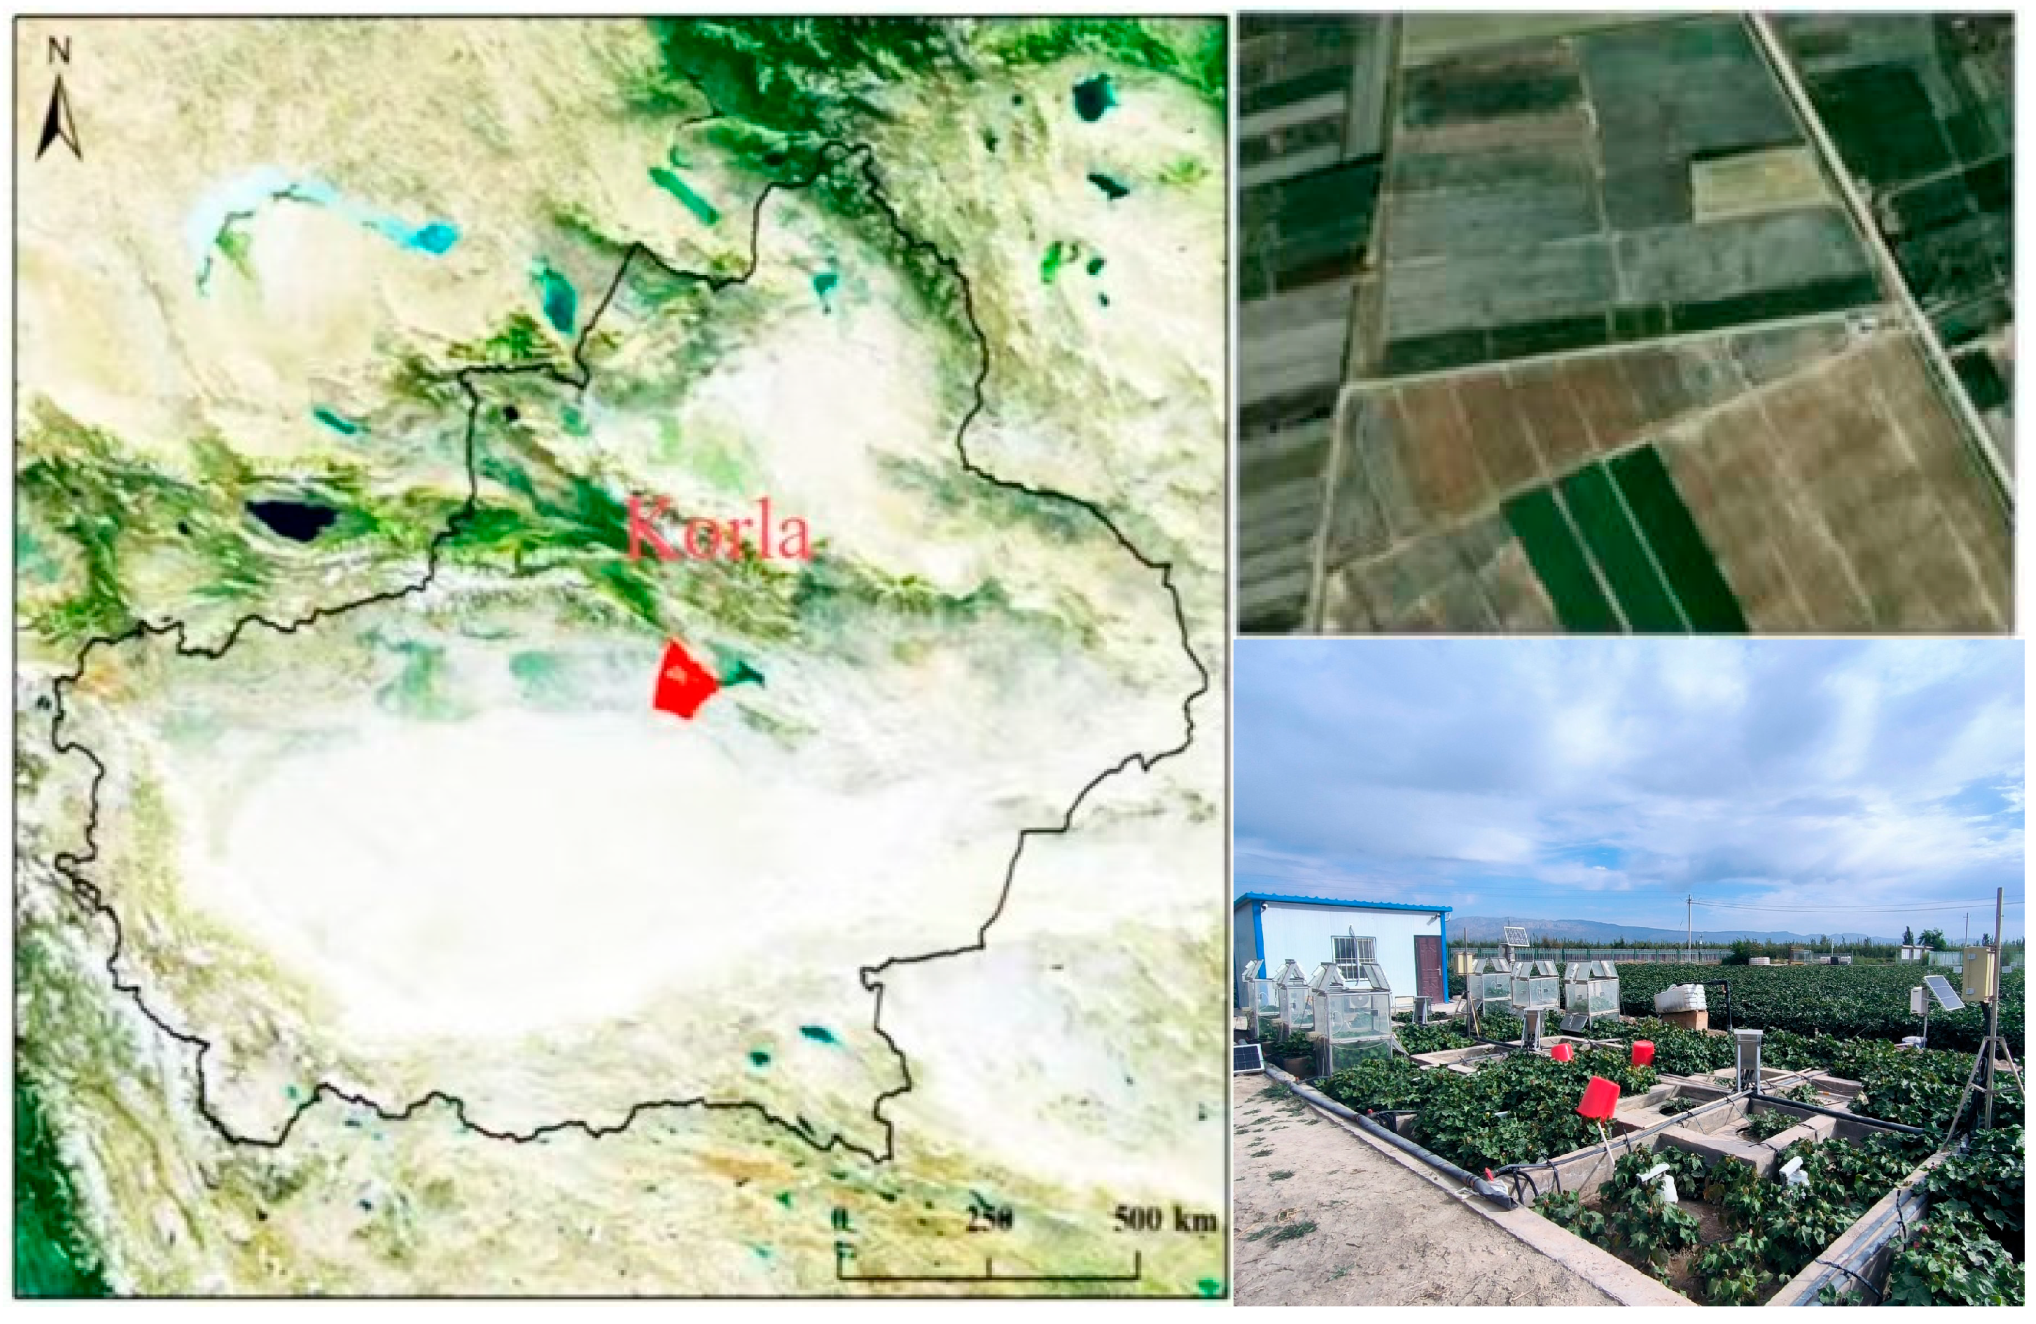
2.1. Site Description and Soil Properties
2.2. Experimental Design and Agronomic Management
2.3. Sampling and Analysis
- Y = Y represents yield per unit area (t ha−1)
- m represents total weight of seed or lint cotton in the test plot (kg), and A represents total area of the test plot (m2).
2.4. Data Analysis
3. Results
3.1. Cotton Yield
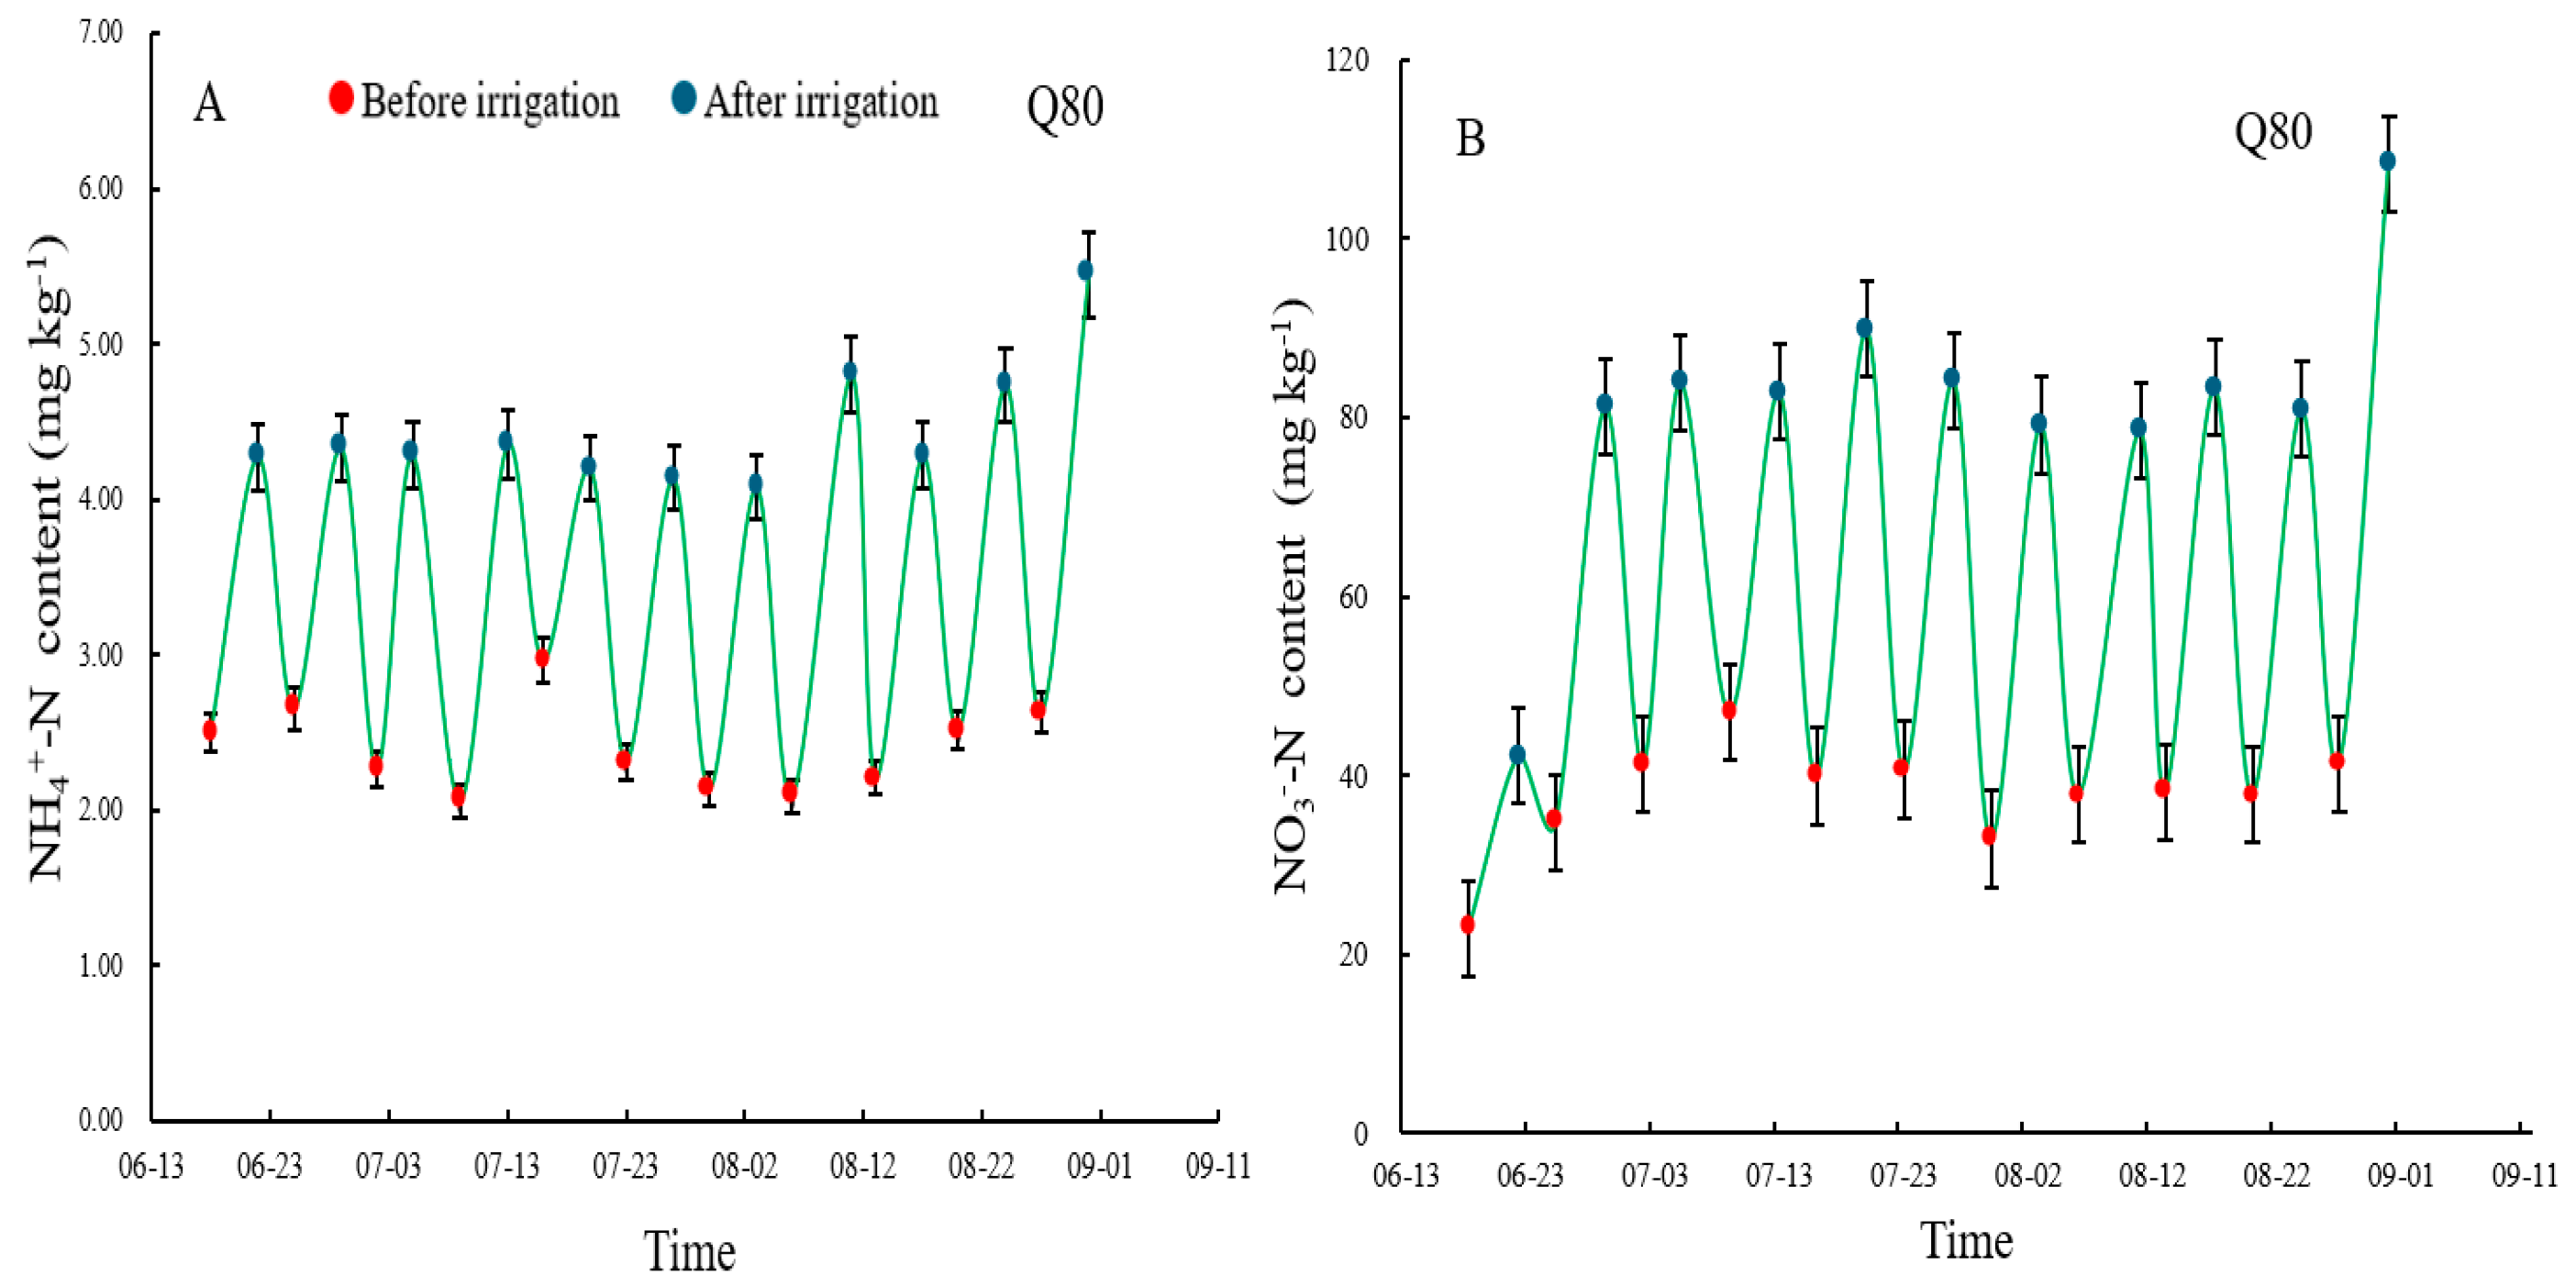
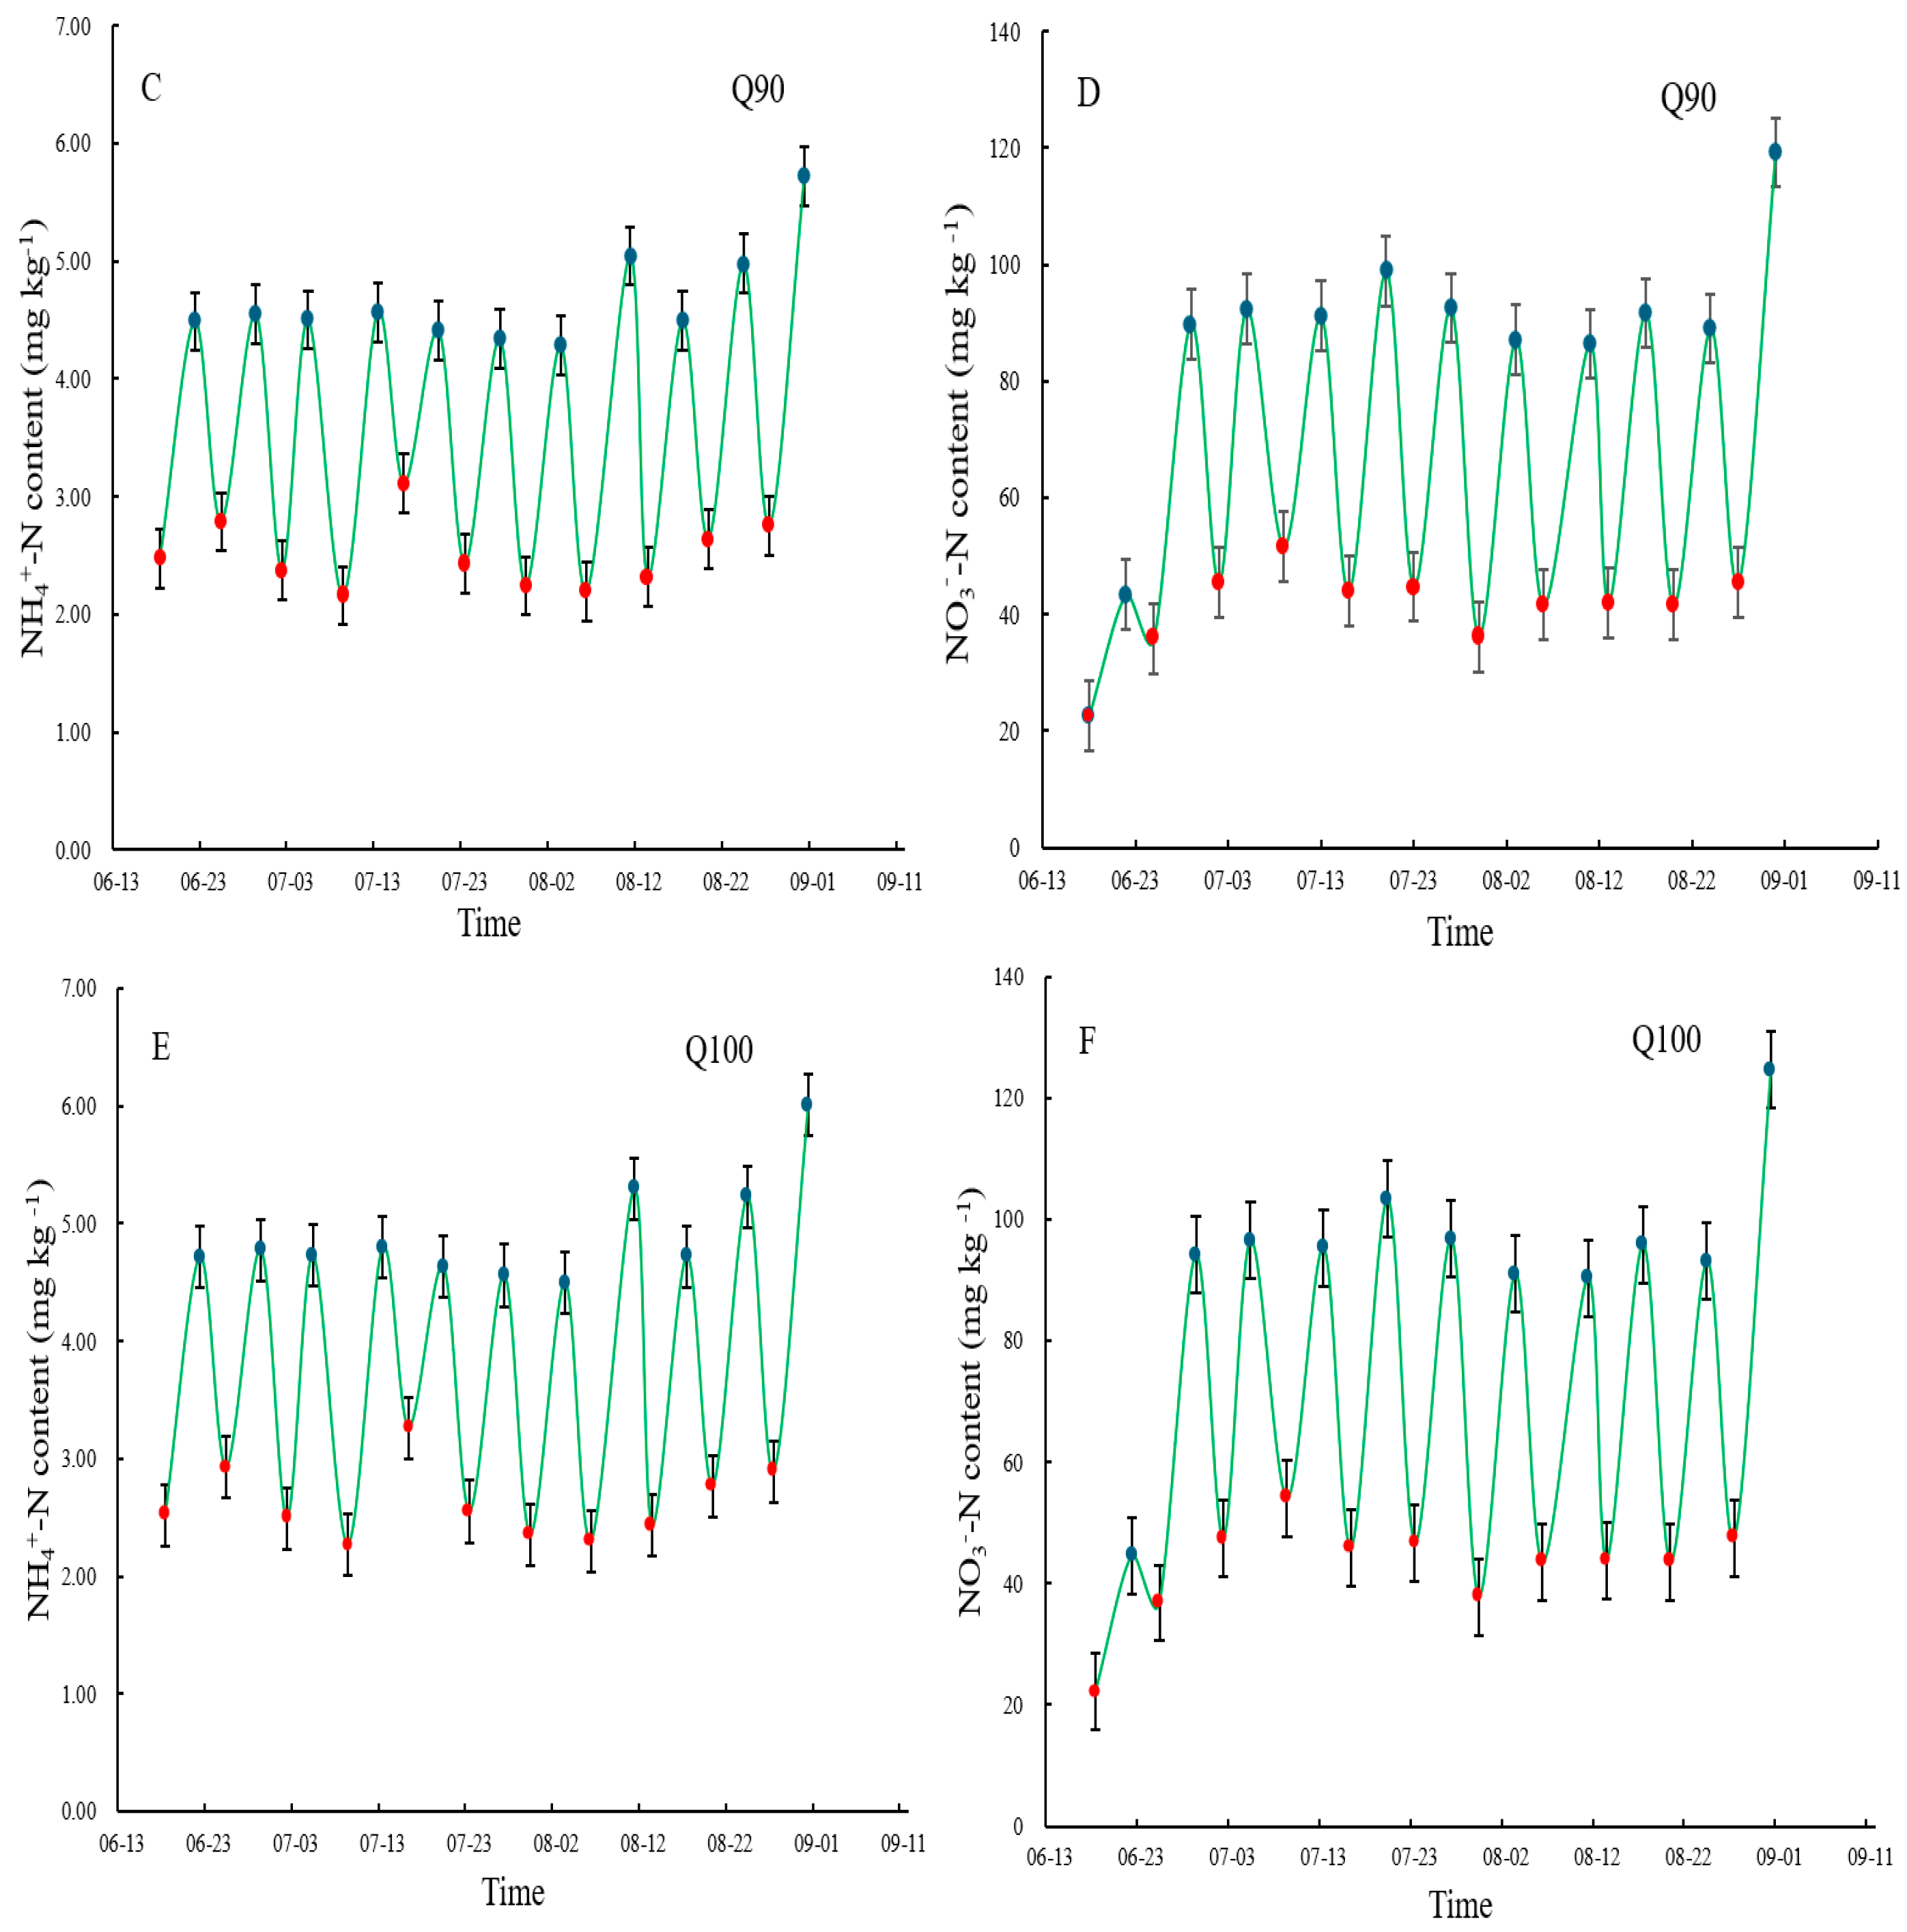
3.2. -N and _N
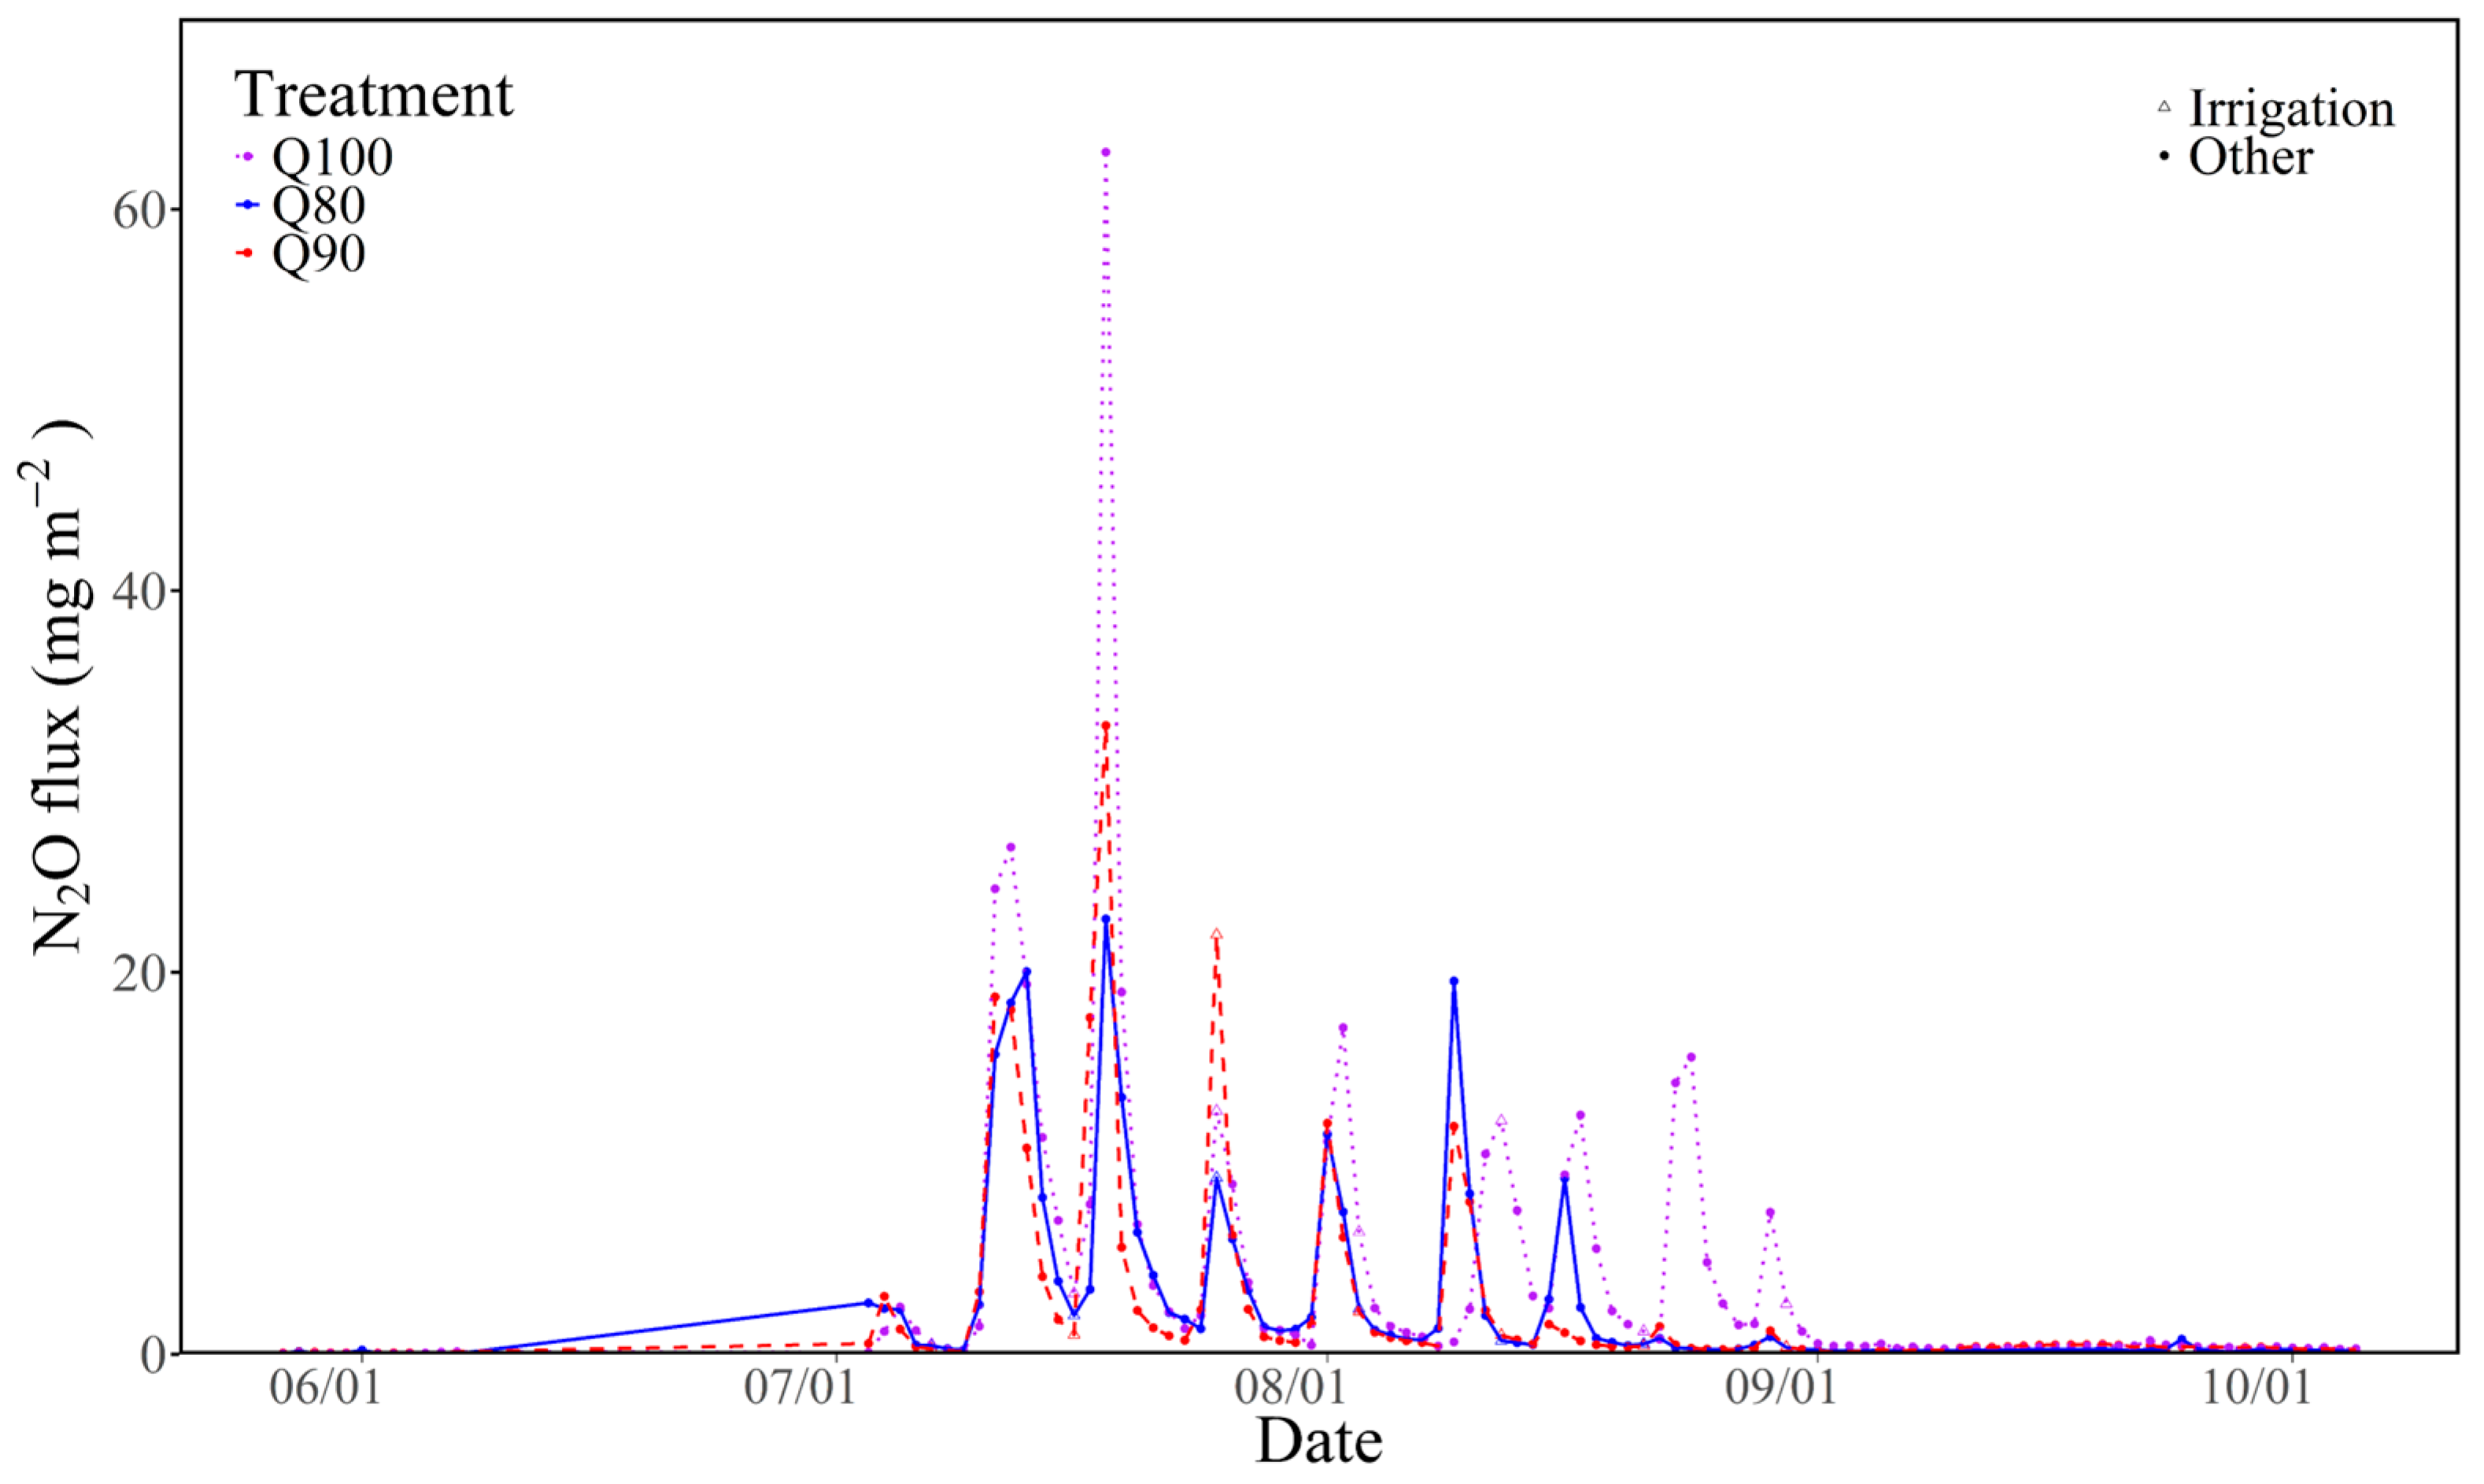
3.3. N2O Flux
3.4. Microbial Community Under Different Irrigation Treatments
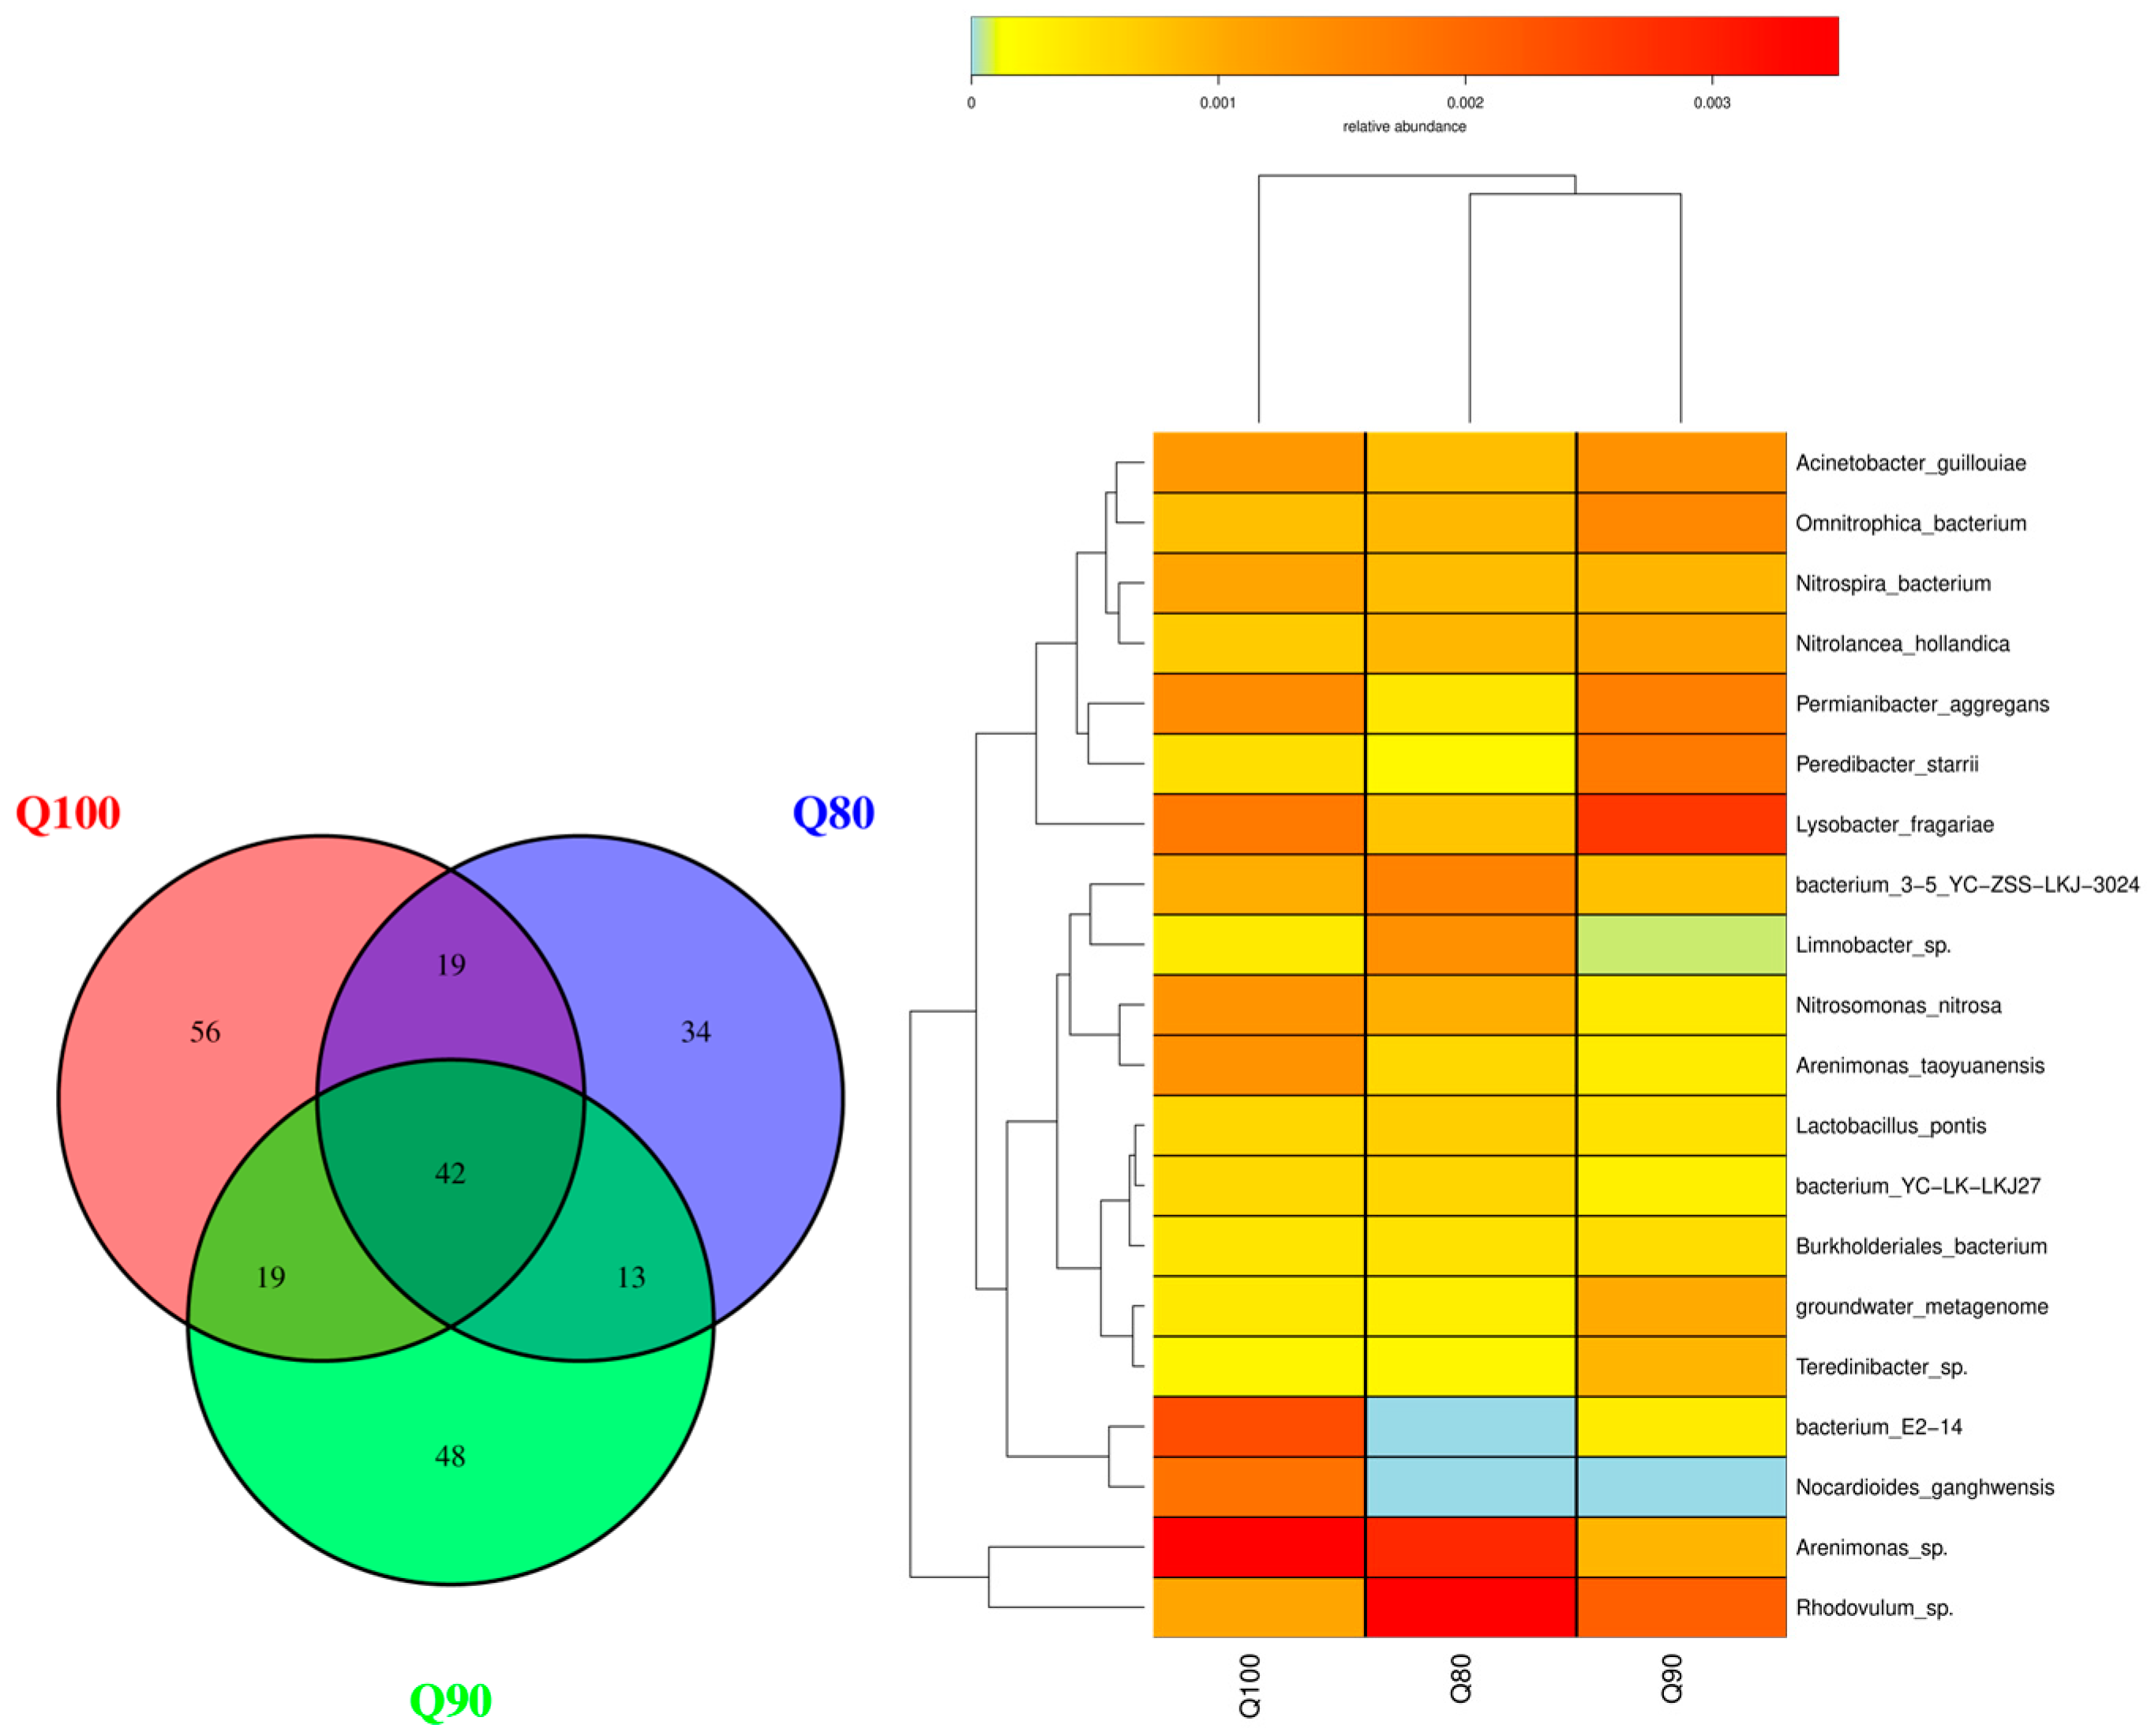
3.4.1. Bacterium
3.4.2. Fungi
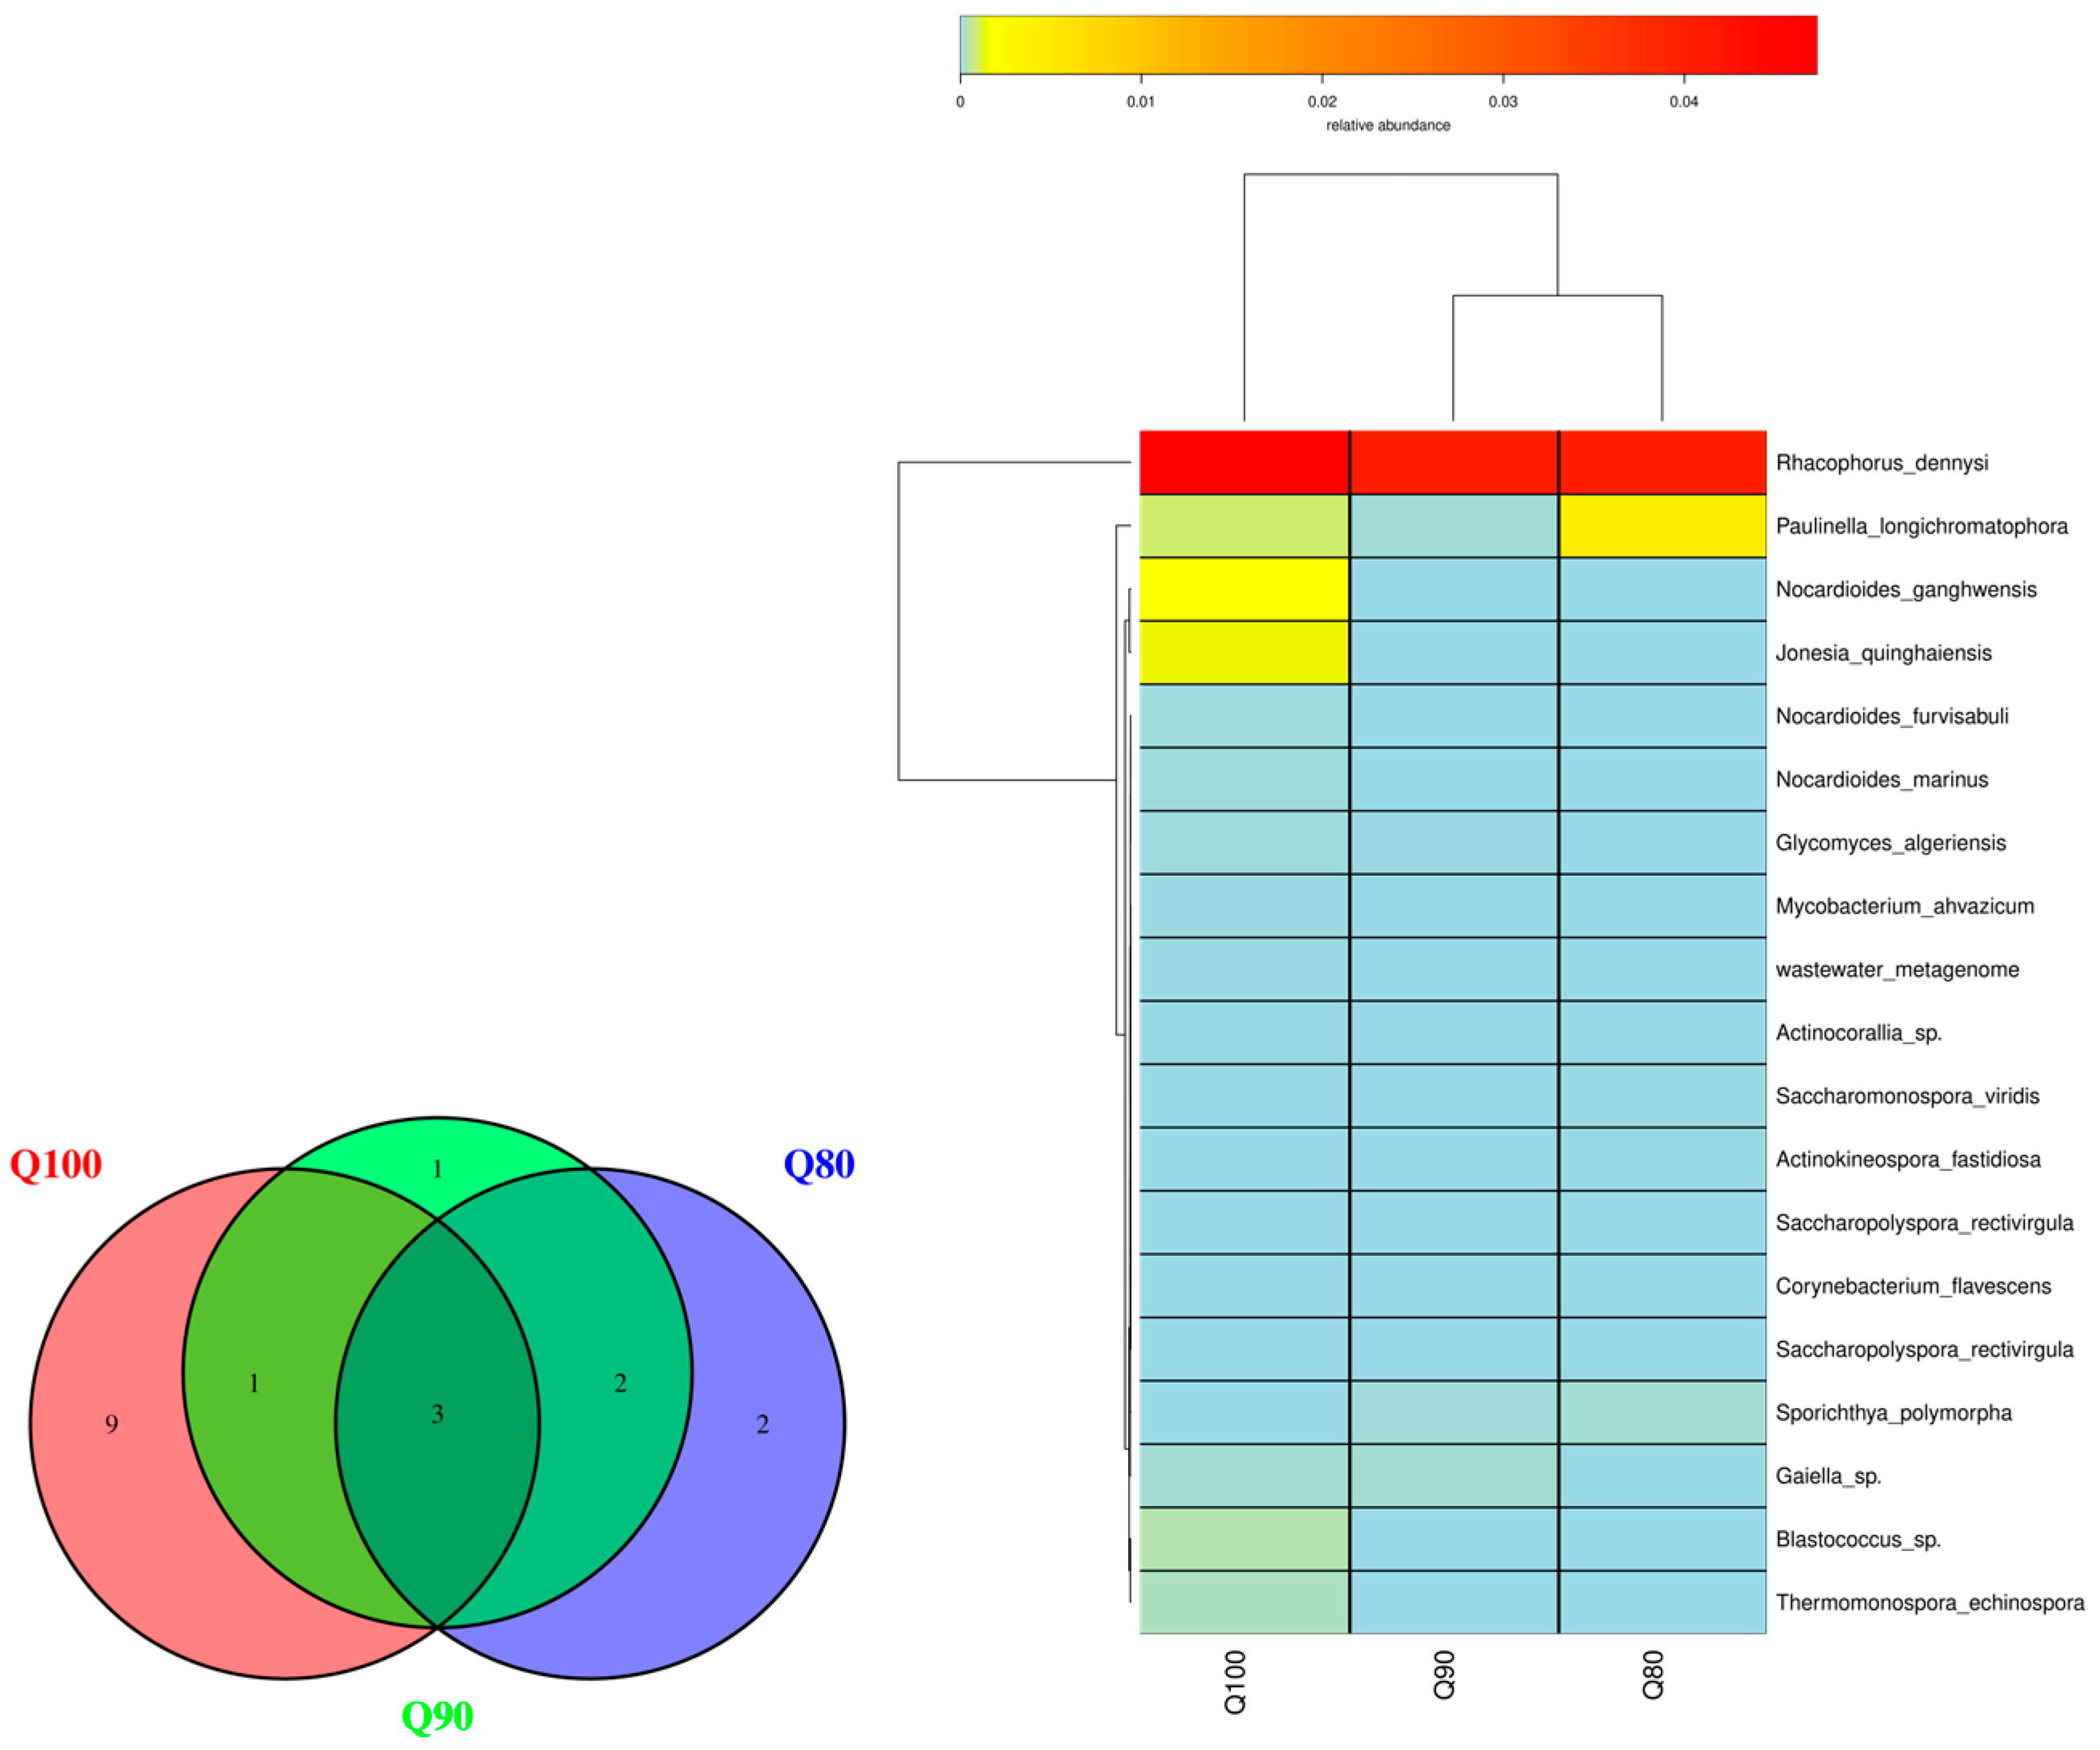
3.4.3. Actinobacteria
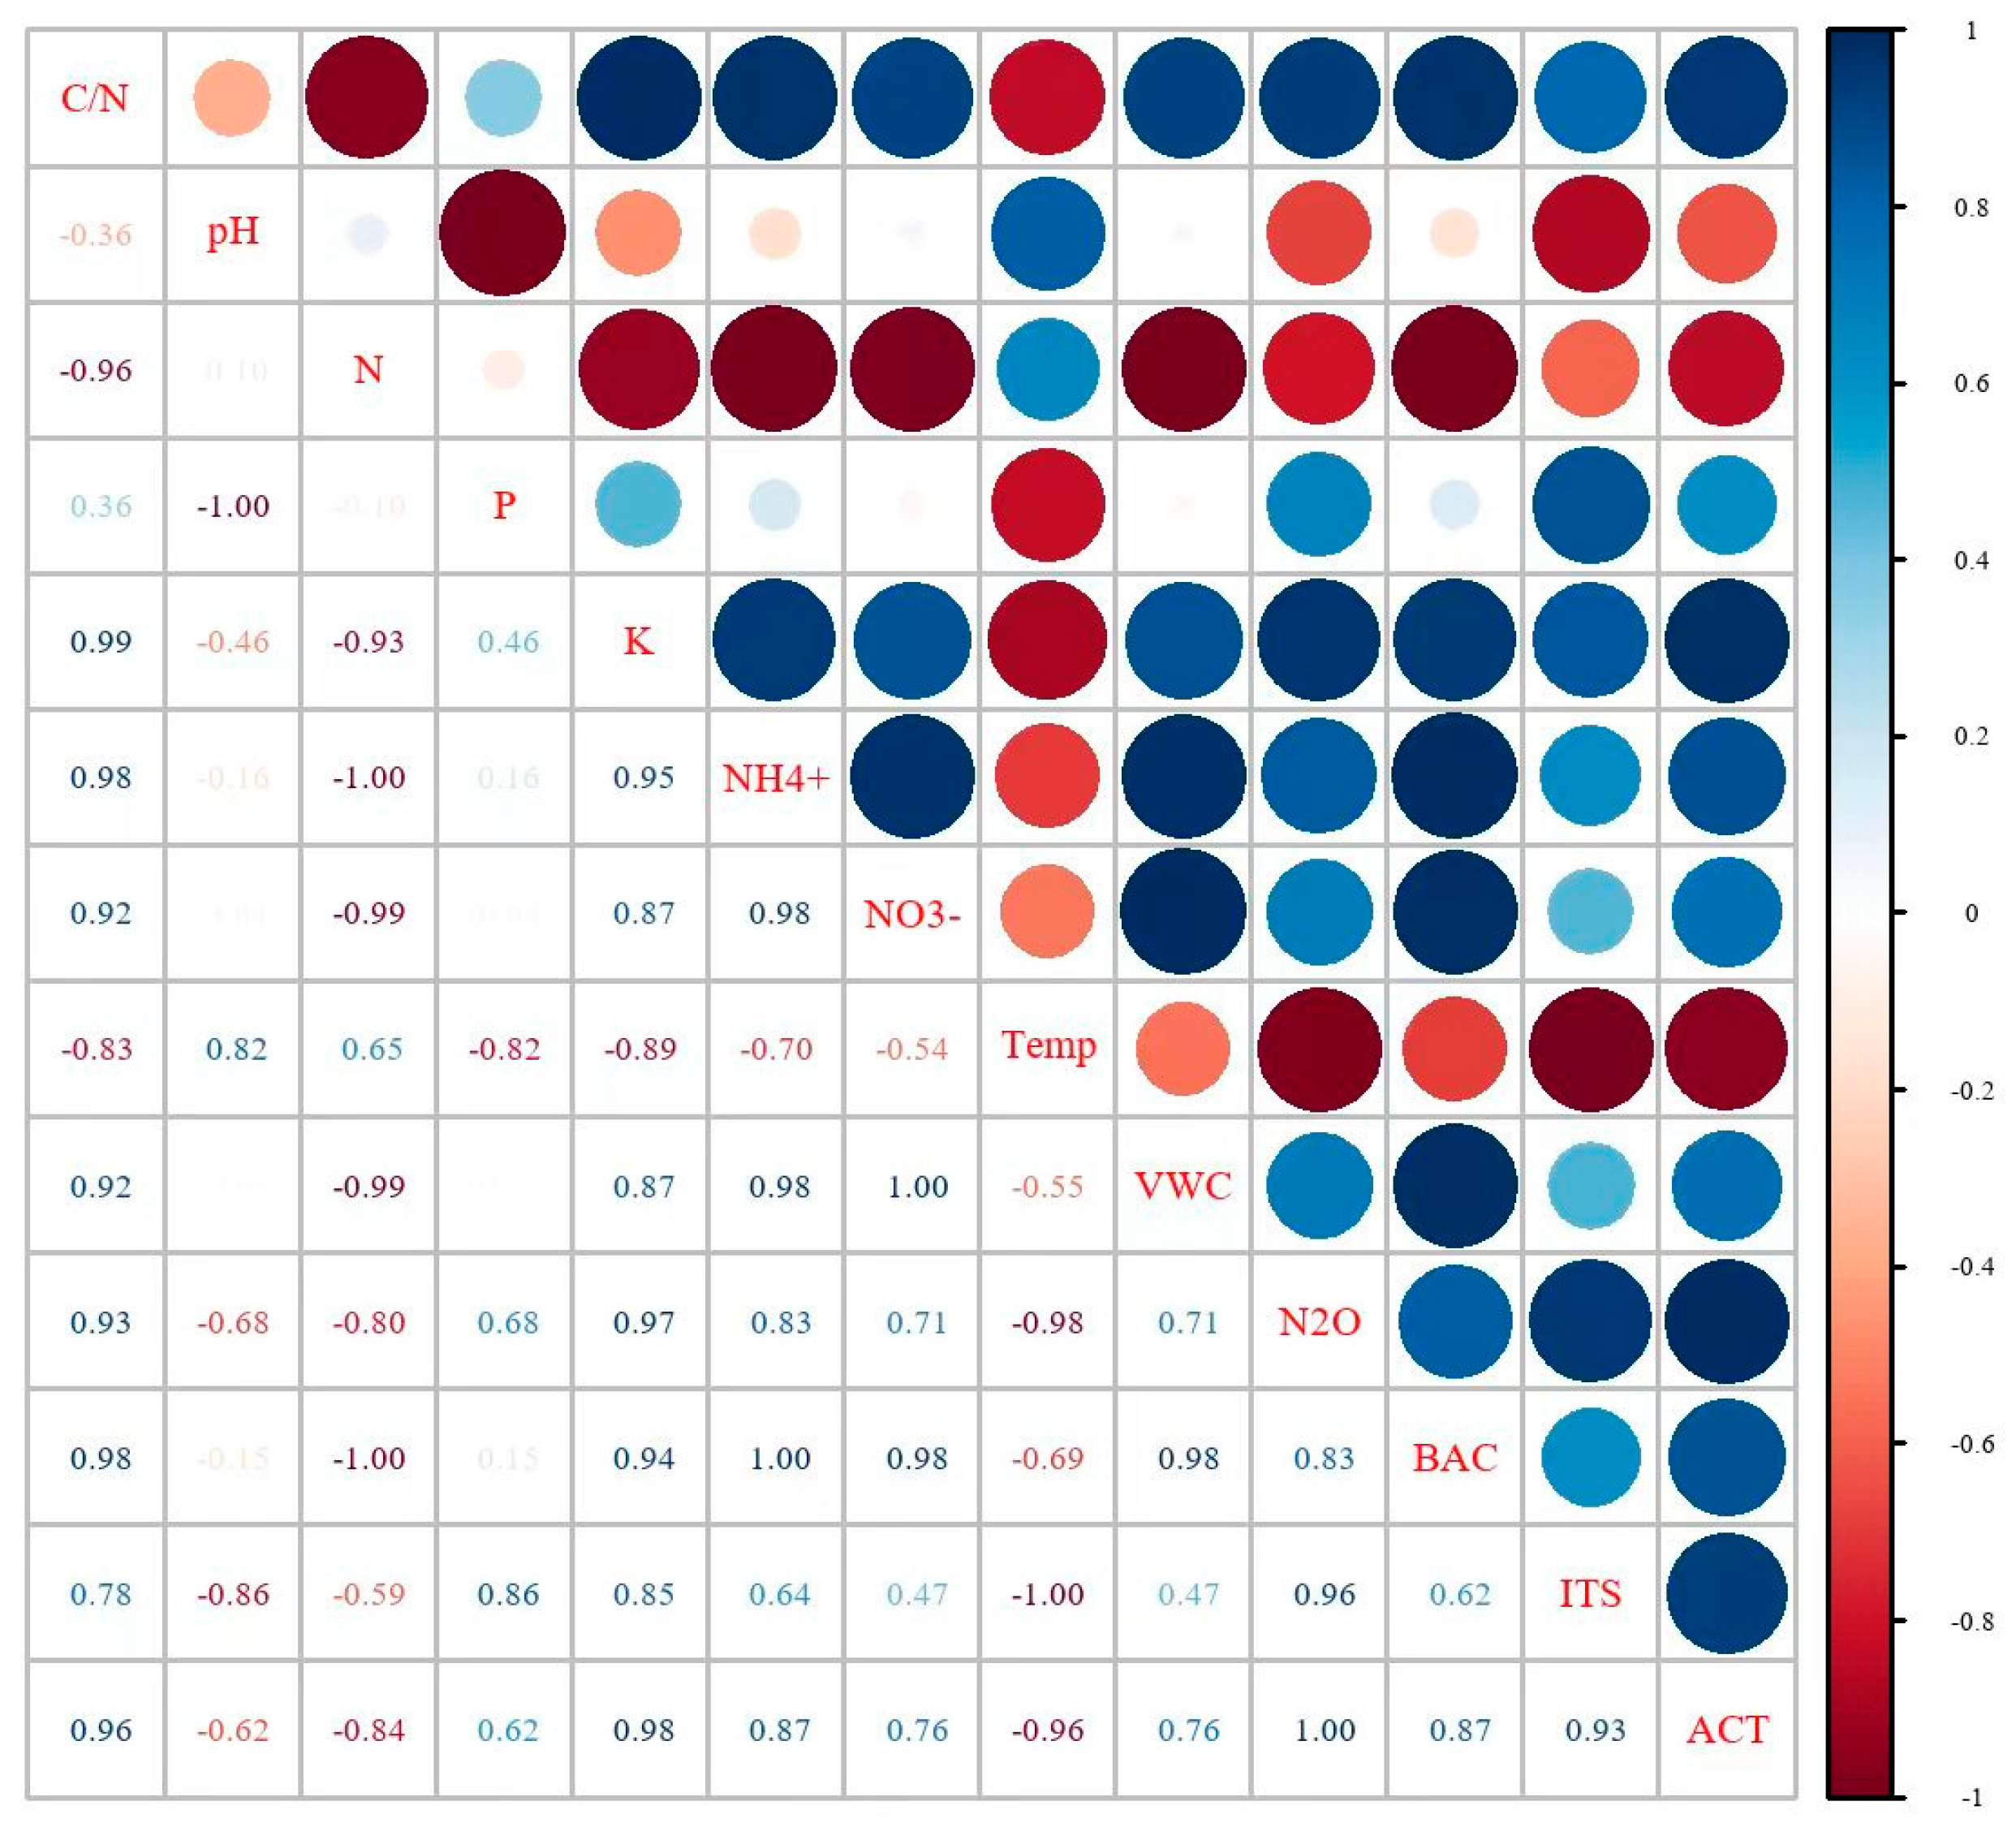
3.5. The Main Factors
4. Discussion
4.1. The Effects of Irrigation Intensities on N2O Emissions
4.2. The Main Factors Influencing N2O Emissions
4.3. Limitations and Future Works
5. Conclusions
Author Contributions
Funding
Data Availability Statement
Conflicts of Interest
References
- Ravishankara, A.R.; Daniel, J.S.; Portmann, R.W. Nitrous oxide (N2O): The dominant ozone-depleting substance emitted in the 21st century. Science 2009, 326, 123–125. [Google Scholar]
- Khalil, A.A.K.; Akter, K.-M.; Kim, H.-J.; Park, W.S.; Kang, D.-M.; Koo, K.A.; Ahn, M.-J. Comparative Inner Morphological and Chemical Studies on Reynoutria Species in Korea. Plants 2020, 9, 222. [Google Scholar] [CrossRef]
- Timilsina, A.; Bizimana, F.; Pandey, B.; Yadav, R.K.P.; Dong, W.; Hu, C. Nitrous oxide emissions from paddies: Understanding the role of rice plants. Plants 2020, 9, 180. [Google Scholar] [CrossRef] [PubMed]
- Gomez, J.A.; Ament, W.J. Nitrous oxide emissions from agricultural soils in response to nitrogen fertilization: A review. Plants 2020, 9, 663. [Google Scholar]
- Wu, S.; Zhang, Z.; Sun, H.; Hu, H. Responses of Rice Yield, N Uptake, NH3 and N2O Losses from Reclaimed Saline Soils to Varied N Inputs. Plants 2023, 12, 2446. [Google Scholar] [CrossRef] [PubMed]
- Yao, Z.; Zheng, X.; Liu, C.; Wang, R.; Xie, B.; Butterbach-Bahl, K. Stand age amplifies greenhouse gas and NO releases following conversion of rice paddy to tea plantations in subtropical China. Agric. For. Meteorol. 2018, 248, 386–396. [Google Scholar]
- Ji, C.; Li, S.; Geng, Y.; Yuan, Y.; Zhi, J.; Yu, K.; Zou, J. Decreased N2O and NO emissions associated with stimulated denitrification following biochar amendment in subtropical tea plantations. Geoderma 2020, 365, 114233. [Google Scholar]
- Xia, L.; Li, X.; Ma, Q.; Lam, S.K.; Wolf, B.; Kiese, R.; Yan, X. Simultaneous quantification of N2, NH3 and N2O emissions from a flooded paddy field under different N fertilization regimes. Glob. Change Biol. 2020, 26, 2292–2303. [Google Scholar]
- Wei, Z.; Shan, J.; Well, R.; Yan, X.; Senbayram, M. Land use conversion and soil moisture affect the magnitude and pattern of soil-borne N2, NO, and N2O emissions. Geoderma 2022, 407, 115568. [Google Scholar]
- Kanerva, T.; Regina, K.; Rämö, K.; Ojanperä, K.; Manninen, S. Fluxes of N2O, CH4 and CO2 in a meadow ecosystem exposed to elevated ozone and carbon dioxide for three years. Environ. Pollut. 2007, 145, 818–828. [Google Scholar]
- National Statistical Office. Statistical Bulletin on Agricultural and Rural Work in 2022. 2023. Available online: https://www.stats.gov.cn/sj/zxfb/202302/t20230203_1901689.html (accessed on 1 January 2023).
- Wang, Y.; Cao, W.; Zhang, X.; Guo, J. Abiotic nitrate loss and nitrogenous trace gas emission from Chinese acidic forest soils. Environ. Sci. Pollut. Res. 2017, 24, 22679–22687. [Google Scholar]
- World Reference Base for Soil Resources. World Reference Base for Soil Resources 2022, Update 2022. International Soil Classification System for Naming Soils and Creating Legends for Soil Maps. FAO, Rome. 2022. Available online: https://www.fao.org/soils-portal/soil-survey/soil-classification/world-reference-base-for-soil-resources/en/ (accessed on 3 January 2023).
- Caporaso, J.G.; Lauber, C.L.; Walters, W.A.; Berg-Lyons, D.; Huntley, J.; Fierer, N.; Owens, S.M.; Betley, J.; Fraser, L.; Bauer, M.; et al. Ultra-high-throughput microbial community analysis on the Illumina HiSeq and MiSeq platforms. ISME J. 2012, 6, 1621–1624. [Google Scholar] [PubMed]
- Fadrosh, D.W.; Ma, B.; Gajer, P.; Sengamalay, N.; Ott, S.; Brotman, R.M.; Ravel, J. An improved dual-indexing approach for multiplexed 16S rRNA gene sequencing on the Illumina MiSeq platform. Microbiome 2014, 2, 6. [Google Scholar] [CrossRef] [PubMed]
- Yu, Y.; Lee, C.; Kim, J.; Hwang, S. Group-specific primer and probe sets to detect methanogenic communities using quantitative re-al-time polymerase chain reaction. Biotechnol. Bioeng. 2005, 89, 670–679. [Google Scholar]
- GB/T 50123-1999; Soil Quality—Determination of Bulk Density. Standards Press of China: Beijing, China, 1999.
- GB/T 17278-2008; Soil Quality—Determination of Field Water Capacity. Standards Press of China: Beijing, China, 2008.
- GB/T 22923-2008; Soil Quality—Determination of Organic Matter. Standards Press of China: Beijing, China, 2008.
- Olsen, S.R.; Cole, C.V.; Watanabe, F.S.; Dean, L.A. Estimation of available phosphorus in soils by extraction with sodium bicarbonate. Circular 1954, 939, 1–19. [Google Scholar]
- HJ 491-2019; Soil and Sediment—Determination of Copper, Zinc, Lead, Nickel, Chromium—Flame Atomic Absorption Spectro-Photometry. Ministry of Ecology and Environment: Beijing, China, 2019.
- Linquist, B.A.; Anders, M.M.; Adviento-Borbe, M.A.A.; Chaney, R.L.; Nalley, L.L.; Da Rosa, E.F.; Van Kessel, C. Reducing greenhouse gas emissions, water use, and grain ar-senic levels in rice systems. Glob. Change Biol. 2015, 21, 407–417. [Google Scholar] [CrossRef]
- Granli, T.; Bockman, O.C. Nitrous oxide from agriculture. Nor. J. Agric. Sci. 1994, 12, 1–128. [Google Scholar]
- Pan, Z.; Zhang, Z.; Li, J.; Zhang, Y.; Zhai, M.; Zhao, W.; Wang, Z. A global synthesis of nitrous oxide emissions across cotton-planted soils. Sustain. Prod. Consum. 2024, 51, 315–326. [Google Scholar]
- Sha, Y.; Chi, D.; Chen, T.; Wang, S.; Zhao, Q.; Li, Y.; Lærke, P.E. Zeolite application increases grain yield and mitigates greenhouse gas emissions under alternate wetting and drying rice system. Sci. Total Environ. 2022, 838, 156067. [Google Scholar]
- Friedl, J.; Deltedesco, E.; Keiblinger, K.M.; Gorfer, M.; De Rosa, D.; Scheer, C.; Rowlings, D.W. Amplitude and frequency of wetting and drying cycles drive N2 and N2O emissions from a subtropical pasture. Biol. Fertil. Soils 2022, 58, 593–605. [Google Scholar]
- Zhou, S.; Sun, H.; Bi, J.; Zhang, J.; Riya, S.; Hosomi, M. Effect of water-saving irrigation on the N2O dynamics and the contribution of exogenous and endogenous nitrogen to N2O production in paddy soil using 15N tracing. Soil Tillage Res. 2020, 200, 104610. [Google Scholar]
- Liao, N.; Li, Q.; Zhang, W.; Zhou, G.; Ma, L.; Min, W.; Hou, Z. Effects of biochar on soil microbial community composition and activity in drip-irrigated desert soil. Eur. J. Soil Biol. 2016, 72, 27–34. [Google Scholar]
- Roelandt, C.; van Wesemael, B.; Rounsevell, M. Estimating annual N2O emissions from agricultural soils in temperate climates. Glob. Change Biol. 2025, 11, 1701–1711. [Google Scholar]
- Ma, Z.; Gao, X.; Tenuta, M.; Kuang, W.; Gui, D.; Zeng, F. Urea fertigation sources affect nitrous oxide emission from a drip-fertigated cotton field in northwestern China. Agric. Ecosyst. Environ. 2018, 265, 22–30. [Google Scholar] [CrossRef]
- Shcherbak, I.; Millar, N.; Robertson, G.P. Global meta-analysis of the nonlinear response of soil nitrous oxide (N2O) emissions to fertilizer nitrogen. Proc. Natl. Acad. Sci. USA 2014, 111, 9199–9204. [Google Scholar]
- Khalil, M.; Hossain, M.; Schmidhalter, U. Carbon and nitrogen mineralization in different upland soils of the subtropics treated with organic materials. Soil Biol. Biochem. 2005, 37, 1507–1518. [Google Scholar]
- Laughlin, R.J.; Stevens, R. Evidence for fungal dominance of denitrification and codenitrification in a grassland soil. Soil Sci. Soc. Am. J. 2002, 66, 1540–1548. [Google Scholar] [CrossRef]
- Marusenko, Y.; Huber, D.P.; Hall, S. Fungi mediate nitrous oxide production but not ammonia oxidation in arid land soils of the southwestern US. Soil Biol. Biochem. 2013, 63, 24–36. [Google Scholar]
- Zhu, T.; Meng, T.; Zhang, J.; Zhong, W.; Müller, C.; Cai, Z. Fungi dominant heterotrophic nitrification in a subtropical forest soil of China. J. Soils Sediments 2015, 15, 705–709. [Google Scholar]
- Zhong, L.; Wang, S.; Xu, X.; Wang, Y.; Rui, Y.; Zhou, X.; Chen, G. Fungi regulate the response of the N2O production process to warming and grazing in a Tibetan grassland. Biogeosciences 2018, 15, 4447–4457. [Google Scholar]


| Treatment | 1st | 2nd | 3rd | 4th | 5th | 6th | 7th | 8th | 9th | 10th | 11th | Total Amount |
|---|---|---|---|---|---|---|---|---|---|---|---|---|
| Date | 19 June | 26 June | 3 July | 10 July | 17 July | 24 July | 31 July | 7 August | 14 August | 21 August | 28 August | |
| Q80 | 7 | 11 | 18 | 44 | 47 | 47 | 58 | 55 | 36 | 22 | 11 | 358 |
| Q90 | 9 | 14 | 24 | 57 | 62 | 62 | 76 | 71 | 48 | 29 | 14 | 466 |
| Q100 | 12 | 18 | 30 | 71 | 77 | 77 | 95 | 89 | 59 | 36 | 18 | 580 |
| Treatment | Unginned Cotton | Ginned Cotton |
|---|---|---|
| Q80 | 1.242 ± 0.019 b | 1.734 ± 0.027 b |
| Q90 | 1.763 ± 0.018 a | 2.421 ± 0.025 a |
| Q100 | 0.793 ± 0.014 c | 1.144 ± 0.020 c |
| p value | ||
| Intensity | 0.03 | <0.01 |
| F value | ||
| Intensity | 10.16 | 36.65 |
Disclaimer/Publisher’s Note: The statements, opinions and data contained in all publications are solely those of the individual author(s) and contributor(s) and not of MDPI and/or the editor(s). MDPI and/or the editor(s) disclaim responsibility for any injury to people or property resulting from any ideas, methods, instructions or products referred to in the content. |
© 2025 by the authors. Licensee MDPI, Basel, Switzerland. This article is an open access article distributed under the terms and conditions of the Creative Commons Attribution (CC BY) license (https://creativecommons.org/licenses/by/4.0/).
Share and Cite
Ma, H.; Wu, Q.; Wu, X.; Zhu, Q.; Pu, S.; Ma, X. Irrigation Intensities Drive Soil N2O Emission Reduction in Drip-Irrigated Cotton Fields. Plants 2025, 14, 987. https://doi.org/10.3390/plants14070987
Ma H, Wu Q, Wu X, Zhu Q, Pu S, Ma X. Irrigation Intensities Drive Soil N2O Emission Reduction in Drip-Irrigated Cotton Fields. Plants. 2025; 14(7):987. https://doi.org/10.3390/plants14070987
Chicago/Turabian StyleMa, Honghong, Qi Wu, Xianglin Wu, Qianqian Zhu, Shenghai Pu, and Xinwang Ma. 2025. "Irrigation Intensities Drive Soil N2O Emission Reduction in Drip-Irrigated Cotton Fields" Plants 14, no. 7: 987. https://doi.org/10.3390/plants14070987
APA StyleMa, H., Wu, Q., Wu, X., Zhu, Q., Pu, S., & Ma, X. (2025). Irrigation Intensities Drive Soil N2O Emission Reduction in Drip-Irrigated Cotton Fields. Plants, 14(7), 987. https://doi.org/10.3390/plants14070987