Article

Evaluating Genome Assemblies for Optimized Completeness and Accuracy of Reference Gene Sequences in Wheat, Rye, and Triticale

1
College of Grassland Agriculture, Northwest A&F University, Yangling 712100, China
2
College of Plant Protection, Northwest A&F University, Yangling 712100, China
*
Authors to whom correspondence should be addressed.
These authors contributed equally to this work.
Plants 2025, 14(7), 1140; https://doi.org/10.3390/plants14071140
Submission received: 6 February 2025 / Revised: 21 March 2025 / Accepted: 31 March 2025 / Published: 6 April 2025
(This article belongs to the Special Issue Functional Genomics and Molecular Breeding of Crops—2nd Edition)

Abstract

Recent years have witnessed a surge in the publication of dozens of genome assemblies for Triticeae crops, which have significantly advanced gene-related research in wheat, rye, and triticale. However, this progress has also introduced challenges in selecting universally efficient and applicable reference genomes for genotypes with distant or ambiguous phylogenetic relationships. In this study, we assessed the completeness and accuracy of genome assemblies for wheat, rye, and triticale using comparative benchmarking universal single-copy orthologue (BUSCO) analysis and transcript mapping approaches. BUSCO analysis revealed that the proportion of complete genes positively correlated with RNA-seq read mappability, while the frequency of internal stop codons served as a significant negative indicator of assembly accuracy and RNA-seq data mappability in wheat. By integrated analysis of alignment rate, covered length, and total depth from RNA-seq data, we identified the assemblies of SY Mattis, Lo7, and SY Mattis plus Lo7 as the most robust references for gene-related studies in wheat, rye, and triticale, respectively. Furthermore, we recommend that the D genome sequence be incorporated in reference assemblies in bioinformatic analyses for triticale, as introgression, translocation, and substitution of the D genome into triticale genome frequently occurs during triticale breeding. The frequency of internal stop codons could help in evaluating correctness of assemblies published in the future, and other findings are expected to support gene-related research in wheat, rye, triticale, and other closely related species.

1. Introduction

Wheat (Triticum aestivum L.), rye (Secale cereale L.), and triticale (× Triticosecale Wittmack) are members of the wheat tribe (Triticeae) within the Pooideae subfamily of grasses. Wheat is one of the most widely grown crops used as eaten cereals throughout the world. Rye and triticale can also serve human culinary uses, but are more often cultivated as cover crops and important forage grasses. These Triticeae species contain the basic chromosome set with a number of 7, and the entire genomes are often very complex and large (e.g., diploid rye, ~7–8 Gb; tetraploid wheat, >10 Gb; hexaploid wheat, ~16 Gb; hexaploid triticale, ~17 Gb), and more than 80% of each genome is composed of repetitive DNA sequences [1,2,3,4].
A new member of the Triticeae species, triticale is a synthetic hybrid derived by crossing wheat (T. durum L., AABB, or T. aestivum L., AABBDD) and rye (S. cereale L., RR). As a result, triticale may be hexaploid (2N = 42; AABBRR) or octoploid (2N = 56; AABBDDRR) depending on which category of wheat is crossed with rye [5]. Most commonly grown triticale are hexaploids, because the large genome of octoploid types renders them less stable. Other ploidy levels such as decaploid and tetraploid exist, but are rarer [5]. After a breeding history of nearly 150 years, most modern triticale cultivars are derived from crossing two triticale parents or from crossing wheat with triticale [5,6]. As the D subgenome (~3.95 Gb) is smaller than the R subgenome (~7–8 Gb), the triticale genome may be more complicated than common wheat [7,8].
In efforts to accelerate the breeding process, recent technological advances in high-throughput DNA sequencing, high-throughput chromosome conformation capture (Hi-C), optical map-assisted assembly, and data analysis algorithms have resulted in significant progress in the genome sequencing of Triticeae crops [7,9]. However, hampered by the highly complex structure, assembled chromosome-scale genomes of polyploid wheat were not released until 2017 [10,11]. Since then, dozens of high-quality wheat and rye genome assemblies have been released (a subset of chromosome-scale assemblies, which were used as references in the current study, are listed in Table 1). Coupled with the genome sequences, tens of thousands to hundreds of thousands of genes have been predicted or annotated (34,441–43,928 in rye; 66,559–88,002 in tetraploid wheat; 105,692–147,646 in hexaploid wheat) (Table 1). These resources have greatly accelerated the identification and valuation of elite genes/alleles and their application in improvements in wheat and rye and their derivative triticale.
One of the main objectives of sequencing a genome is to obtain its catalogue of genes. The gene space (i.e., the part of the genome comprising all the genes and gene-related DNA) in a genome is the core focus of genetic, transcriptomic, proteomic, and evolutionary studies. Denton et al. [12] compared multiple draft assemblies against higher-quality versions and discovered that over 40% of all gene families are estimated to have an inaccurate number of genes in draft assemblies and that these incorrect assemblies both add and subtract genes. In addition, the large numbers of fragmented genes in low-quality genomes can significantly impede efficient genetic research [12]. Moreover, reference-based transcriptomic studies have been reported to be more convenient, productive, and accurate in most cases [13]. RNA-seq-based gene expression quantification achieves high accuracy when the reference genome and query samples share identical genotypes. However, cross-mapping reads to genomes of different genotypes introduces measurable reference bias correlating with genetic distance [14]. Since genomic data have become available, the assembly of the bread wheat cultivar Chinese spring has been widely used as reference for wheat and triticale (e.g., [1,15,16,17,18]) or Lo7 assembly in rye studies [19,20,21]. When more genome assemblies become available, whether such choices are still optimal should be reexamined. More appropriate reference data would help in assessing gene expression and structure and in detecting new genetic information more comprehensively and accurately. Therefore, given the challenges associated with processing large-scale genomic datasets in downstream research, evaluating existing assemblies to select the most complete, accurate, and robust reference data with wide applicability is of high value.
The completeness and correctness of gene sequences serve as critical quality indicators for genome assemblies [22,23,24]. To evaluate the completeness of gene space, also known as functional completeness, a widely used metric is Benchmarking Universal Single-Copy Orthologs (BUSCO). BUSCO evaluates the presence of a predefined set of highly conserved orthologous genes as a proxy for genome-wide completeness [25]. However, BUSCO may be ineffective for gauging assembly completeness in certain species or situations, such as in genes with long introns [22]. Another metric for functional completeness is transcript mappability [24,26]. Inadequate coverage can lead to assembly defects, such as premature stop codons and frame-shift indel errors. These and other assembly errors critically affect transcript mapping, resulting in downstream errors that obscure meaningful signals and propagate into false candidate gene identification and inaccurate gene annotation [24,27]. These assembly defects fall under the issues of assembly correctness, which is challenging to assess directly [22]. Therefore, comparing the functional completeness and correctness of different genome assemblies can facilitate transcriptomic and gene-related studies.
To evaluate the mapping performance of RNA-seq data, three frequently used metrics are overall alignment rate, coverage, and depth. Alignment rate (or mapping rate) reflects read-level mapping efficiency, while coverage and depth represent base-level mapping statistics [28]. Since coverage is a proportion or percentage, the corresponding absolute value of covered length or total covered sites may be a better metric to evaluate mappability across different genome assemblies. Additionally, the accuracy of RNA-seq improves with increasing sequencing depth, and higher depth is generally preferred for correctly determining transcript and base abundance [29,30,31].
In order to facilitate future gene-related studies in wheat, rye and triticale, in this study, we performed a comprehensive evaluation of functional completeness and correctness of publicly available genomic references using BUSCO analysis and RNA-seq read mapping methodologies. Three groups of assemblies were proposed as high-confidence references with wide applicability for gene-related studies in wheat, rye, and triticale, respectively. Based on the evaluation, new metrics were proposed for future genome assembly. Our findings will assist future transcriptomic, genetic, proteomic, and evolutionary studies in the three crops.

2. Results

2.1. Differences in the Key Parameters of Triticeae Genome Assemblies

A total of 41 chromosome-scale genome assemblies were compared in this study, including 37 allohexaploid wheat (AABBDD), 2 allotetraploid wheat (AABB) and 2 rye (RR) genomes (Table 1). The size of the T. aestivum assemblies varied between 14.29 Gb and 15.10 Gb. The assembly sizes of the two allotetraploid wheat genomes were very close (10.46 Gb and 10.68 Gb), while the two rye assemblies differed greatly (6.74 Gb and 7.74 Gb). The number of predicted genes was overall in concordance with the assembly size: 105,692–147,646 in allohexaploid wheat, 66,559–88,002 in allotetraploid wheat, and 34,441–43,928 in rye. Assembly continuity metrics revealed that N50 values of contigs varied dramatically among the assemblies, ranging from 56 Kb in Svevo to 58 Mb in Chuanmai104. In comparison, N50 values of scaffolds across assemblies were closer, especially in wheat (smallest: 688 Mb in LongReach_Lancer; largest: 747 Mb in Zavitan ).
Table 1. Statistics of the Triticeae assemblies compared in this study.
SpeciesGenotypeGenome TypeAssembly Length (Gb)Predicted Gene Number *Number of ContigsNumber of ScaffoldsN50 of ContigsN50 of ScaffoldsPercent of GapsAssembly VersionReference
Triticum aestivumChinese SpringAABBDD14.58106,914306,70722341 Kb713 Mb1.78%v2.1[32]
Zang1817AABBDD14.71107,336822,893383,26166 Kb704 Mb1.05%v1[33]
ArinaLrForAABBDD14.66117,569501,4582280 Kb697 Mb0.82%v3.0[3]
JaggerAABBDD14.55115,873705,5582285 Kb705 Mb1.67%v1.1
JuliusAABBDD14.39115,552620,7802277 Kb708 Mb1.21%v1.0
LandmarkAABBDD14.44115,515662,7662281 Kb705 Mb1.92%v1.0
LongReach LancerAABBDD14.29116,473508,1462275 Kb688 Mb0.81%v1.0
MaceAABBDD14.36116,367533,0952271 Kb690 Mb0.87%v1.0
Norin61AABBDD14.91116,106462,0632266 Kb712 Mb0.78%v1.1
spelta_PI190962AABBDD14.45116,395487,2122283 Kb707 Mb0.76%v1.0
StanleyAABBDD14.47115,781603,4082271 Kb713 Mb1.68%v1.2
SY MattisAABBDD14.96117,2761,063,6532276 Kb698 Mb1.03%v1.0
FielderAABBDD14.70116,4805202379520 Mb717 Mb0.00%v1[34]
KariegaAABBDD14.68116,83873952226 Mb717 Mb0.13%v1[35]
RenanAABBDD14.26109,65312,7793592 Mb703 Mb1.79%v2.1[36]
AttraktionAABBDD14.24NA15532117 Mb703 Mb0.00%NA[37]
Kenong9204AABBDD14.47105,692102,80622373 Kb714 Mb0.74%NA[38]
Aikang58AABBDD14.76119,350279,897158,176237 Kb717 Mb0.63%NA[39]
Chuanmai104AABBDD14.78122,5546065539858 Mb727 Mb0.00%v2.0[40]
CWI86942AABBDD14.57147,64647802244 Mb726 Mb0.00%v1[41]
AbbondanzaAABBDD14.70134,0907905656725 Mb719 Mb0.00%NA[42]
AimengniuAABBDD15.01135,63919,53618,16324 Mb727 Mb0.00%NA
Beijing8AABBDD14.83136,1695995370819 Mb718 Mb0.00%NA
Chuanmai42AABBDD14.66133,3914876390641 Mb722 Mb0.00%NA
Handan6172AABBDD15.10138,70911,413886226 Mb735 Mb0.00%NA
Jimai22AABBDD14.62134,4245417426833 Mb726 Mb0.00%NA
Jinmai47AABBDD15.05136,2828175279021 Mb744 Mb0.00%NA
Kuofan11AABBDD14.86133,7899446818530 Mb726 Mb0.00%NA
MazhamaiAABBDD14.67135,8966584498532 Mb721 Mb0.00%NA
Ningchun4AABBDD14.58133,7734996364931 Mb714 Mb0.00%NA
Shi4185AABBDD14.99134,13011,963917126 Mb738 Mb0.00%NA
Xiaoyan6AABBDD14.87138,45714,98113,67425 Mb720 Mb0.00%NA
Xinong6028AABBDD14.69136,4714827352231 Mb723 Mb0.00%NA
Yangmai158AABBDD14.70135,2076028403325 Mb714 Mb0.00%NA
Zhengmai366AABBDD14.83135,29611,915800326 Mb735 Mb0.00%NA
Zhoumai16AABBDD15.06136,2716413336633 Mb742 Mb0.00%NA
Zhoumai22AABBDD15.04135,05413,80810,95426 Mb729 Mb0.00%NA
Triticum turgidumSvevoAABB10.4666,559476,8251556 Kb722 Mb1.55%v1[4]
ZavitanAABB10.6888,002492,885148,29657 Kb747 Mb3.31%v2.1[43]
Secale cerealeLo7RR6.7434,441314,632872 Kb900 Mb2.31%v1p1p1[44]
WeiningRR7.7443,92871,7058441 Kb1024 Mb0.10%NA[8]
* Limited to high-confidence genes (if available). NA, not available.
Gene completeness assessment by BUSCO evaluation revealed that all the wheat assemblies showed high completeness, as the complete BUSCO gene percentages were estimated to be over 99.37%. By contrast, the diploid rye exhibited slightly lower complete BUSCO gene percentages: 98.65% for Lo7 and 96.75% for Weining (Figure 1A). Furthermore, we identified a differentially distributed frequency of internal stop codons in BUSCO genes among genotypes, which was overall reversely correlated with the complete BUSCO gene percentage (Figure 1B). The frequency of internal stop codons served as an indicator for deciphering gene mapping efficiency and will be further addressed in later sections.

2.2. Efficiency Differences in Reference-Based Transcript Mapping in Wheat

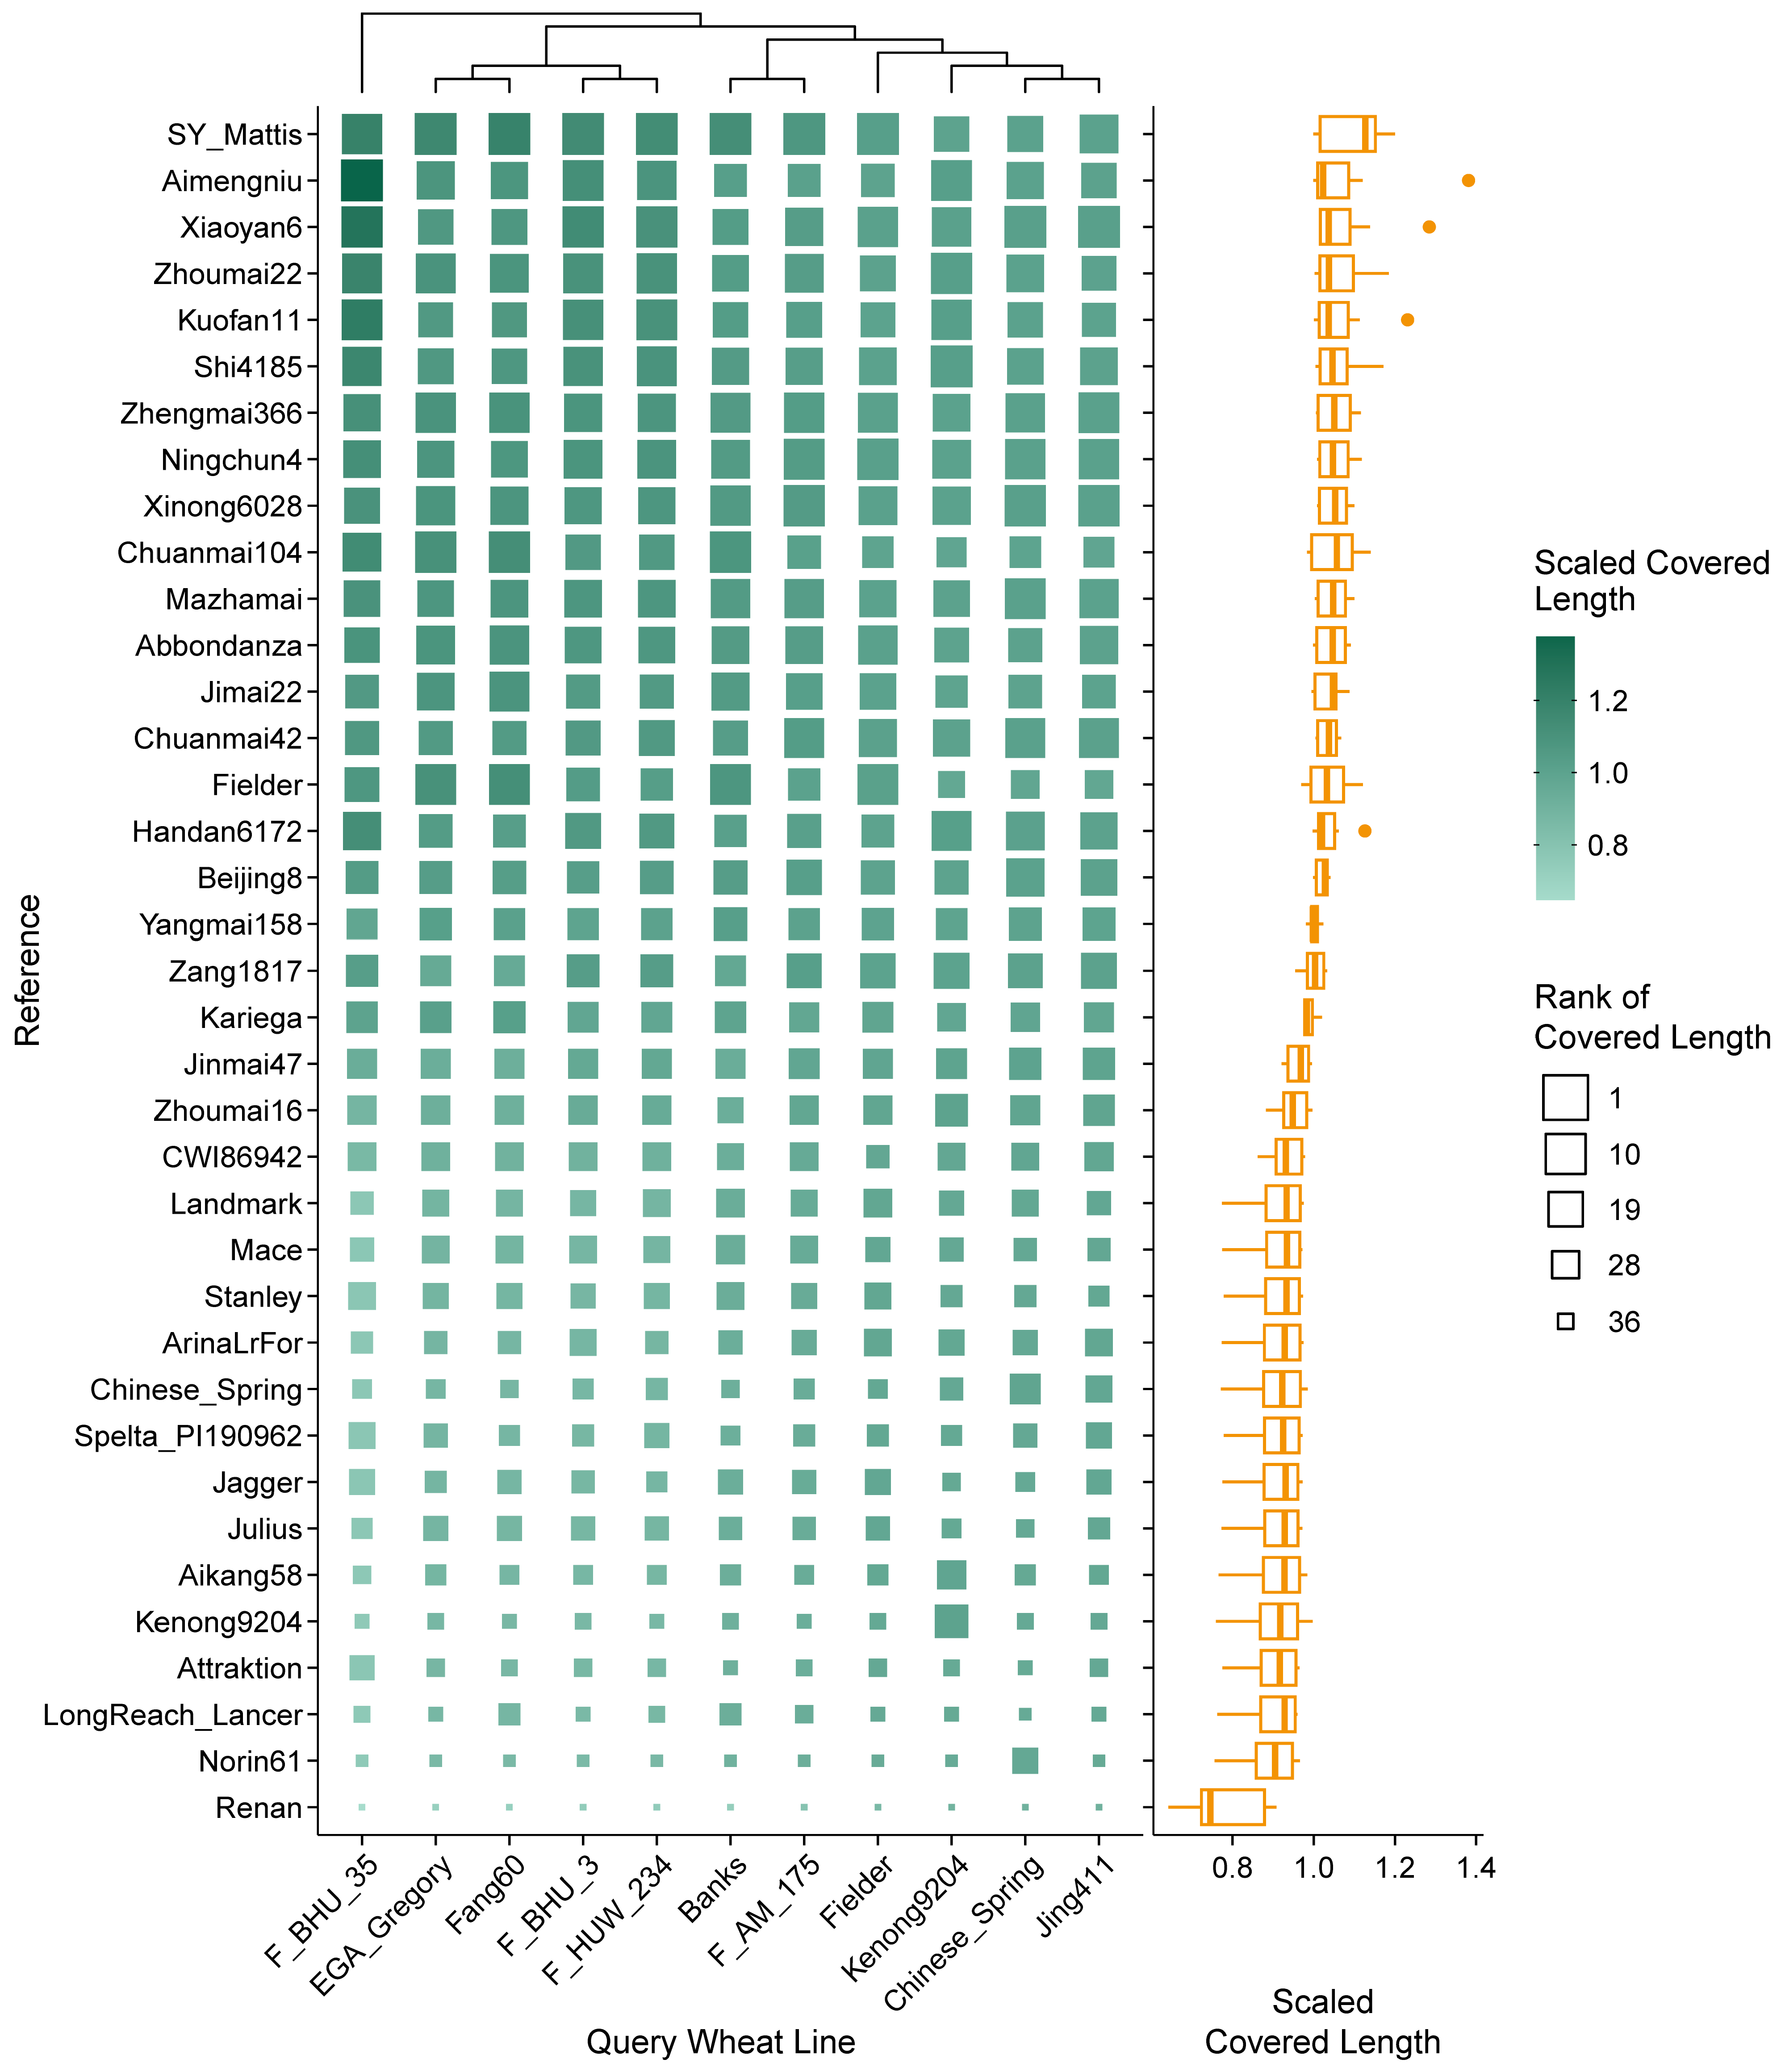
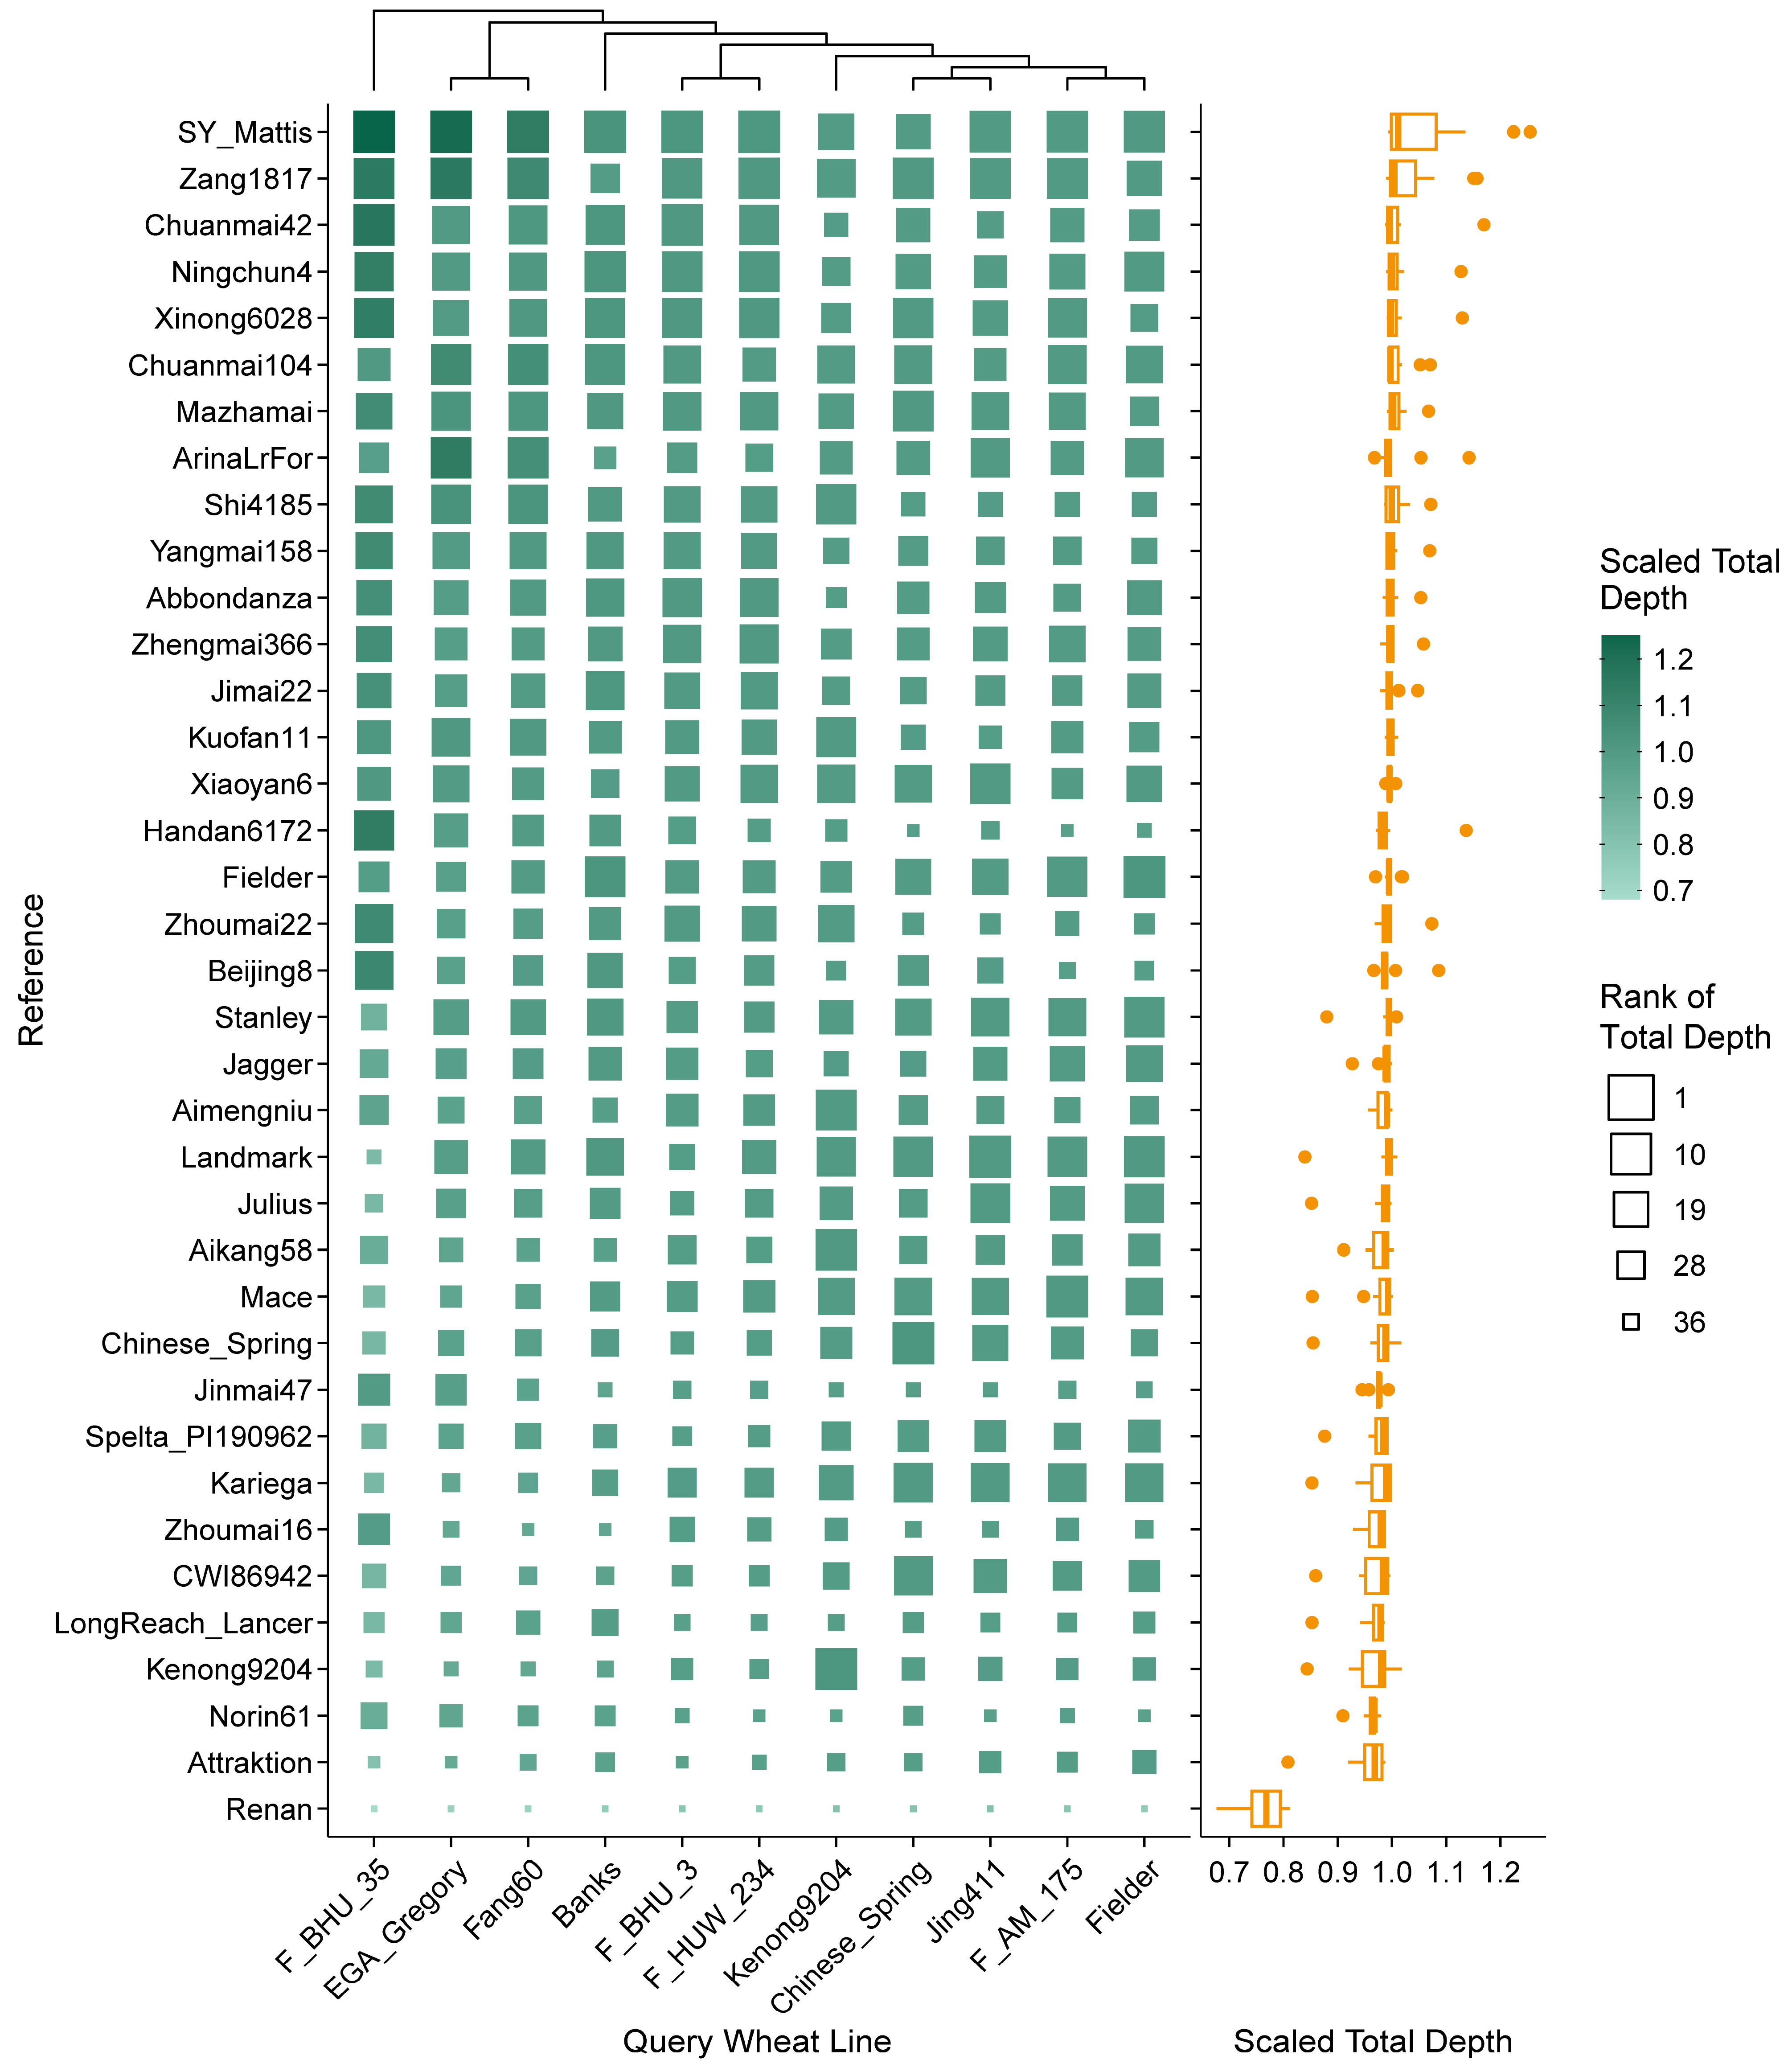
To evaluate the fitness and efficiency of different reference genome assemblies in gene study in wheat, rye and triticale, cDNA sequences represented by RNA-seq reads of the crop lines originating from different regions of the world (Table S1) were mapped to different genome assemblies. Mapping results of 11 wheat lines revealed that the alignment rate ranged from 74.6% (EGA_Gregory mapped to Renan) to 98.6% (Fielder mapped to Fielder). The reference-wise distribution of read coverage and depth was in a similar pattern irrespective of query lines, while the variation of alignment rate was more inconsistent. On average, using SY Mattis as reference achieved high alignment rate, covered length, and total depth. Other references with high alignment rate included Zang1817, Beijing8, Xiaoyan6, and Shi4185 (Figure S1); references with high covered length included Aimengniu, Xiaoyan6, Zhoumai22, and Kuofan11 (Figure 2); references with high total depth included Zang1817, Chuanmai42, Ningchun4, and Xinong6028 (Figure 3). In contrast, Renan, Attraktion, LongReach_Lancer, and Kenong9204 were the poorly mapped references in all aspects. Taking query line Jing411 as an example, the difference between the highest (95.1%) and lowest (90.5%) alignment rates corresponded to a gap of 5,369,097 read pairs; the difference between the highest and lowest covered lengths was 35,397,977 bp (0.24% of the Chinese Spring assembly; 15.78% of the total length of Chinese Spring HC exons); the difference between the highest and lowest total depths was 5,931,922,239 bp (0.41× of the Chinese Spring assembly; 26.44× of the total length of Chinese Spring HC exons). It should be noted that RNA-seq reads mapped to assemblies of the identical genotypic source always performed well in all indices, as proved in Chinese Spring, Fielder, and Kenong9204.
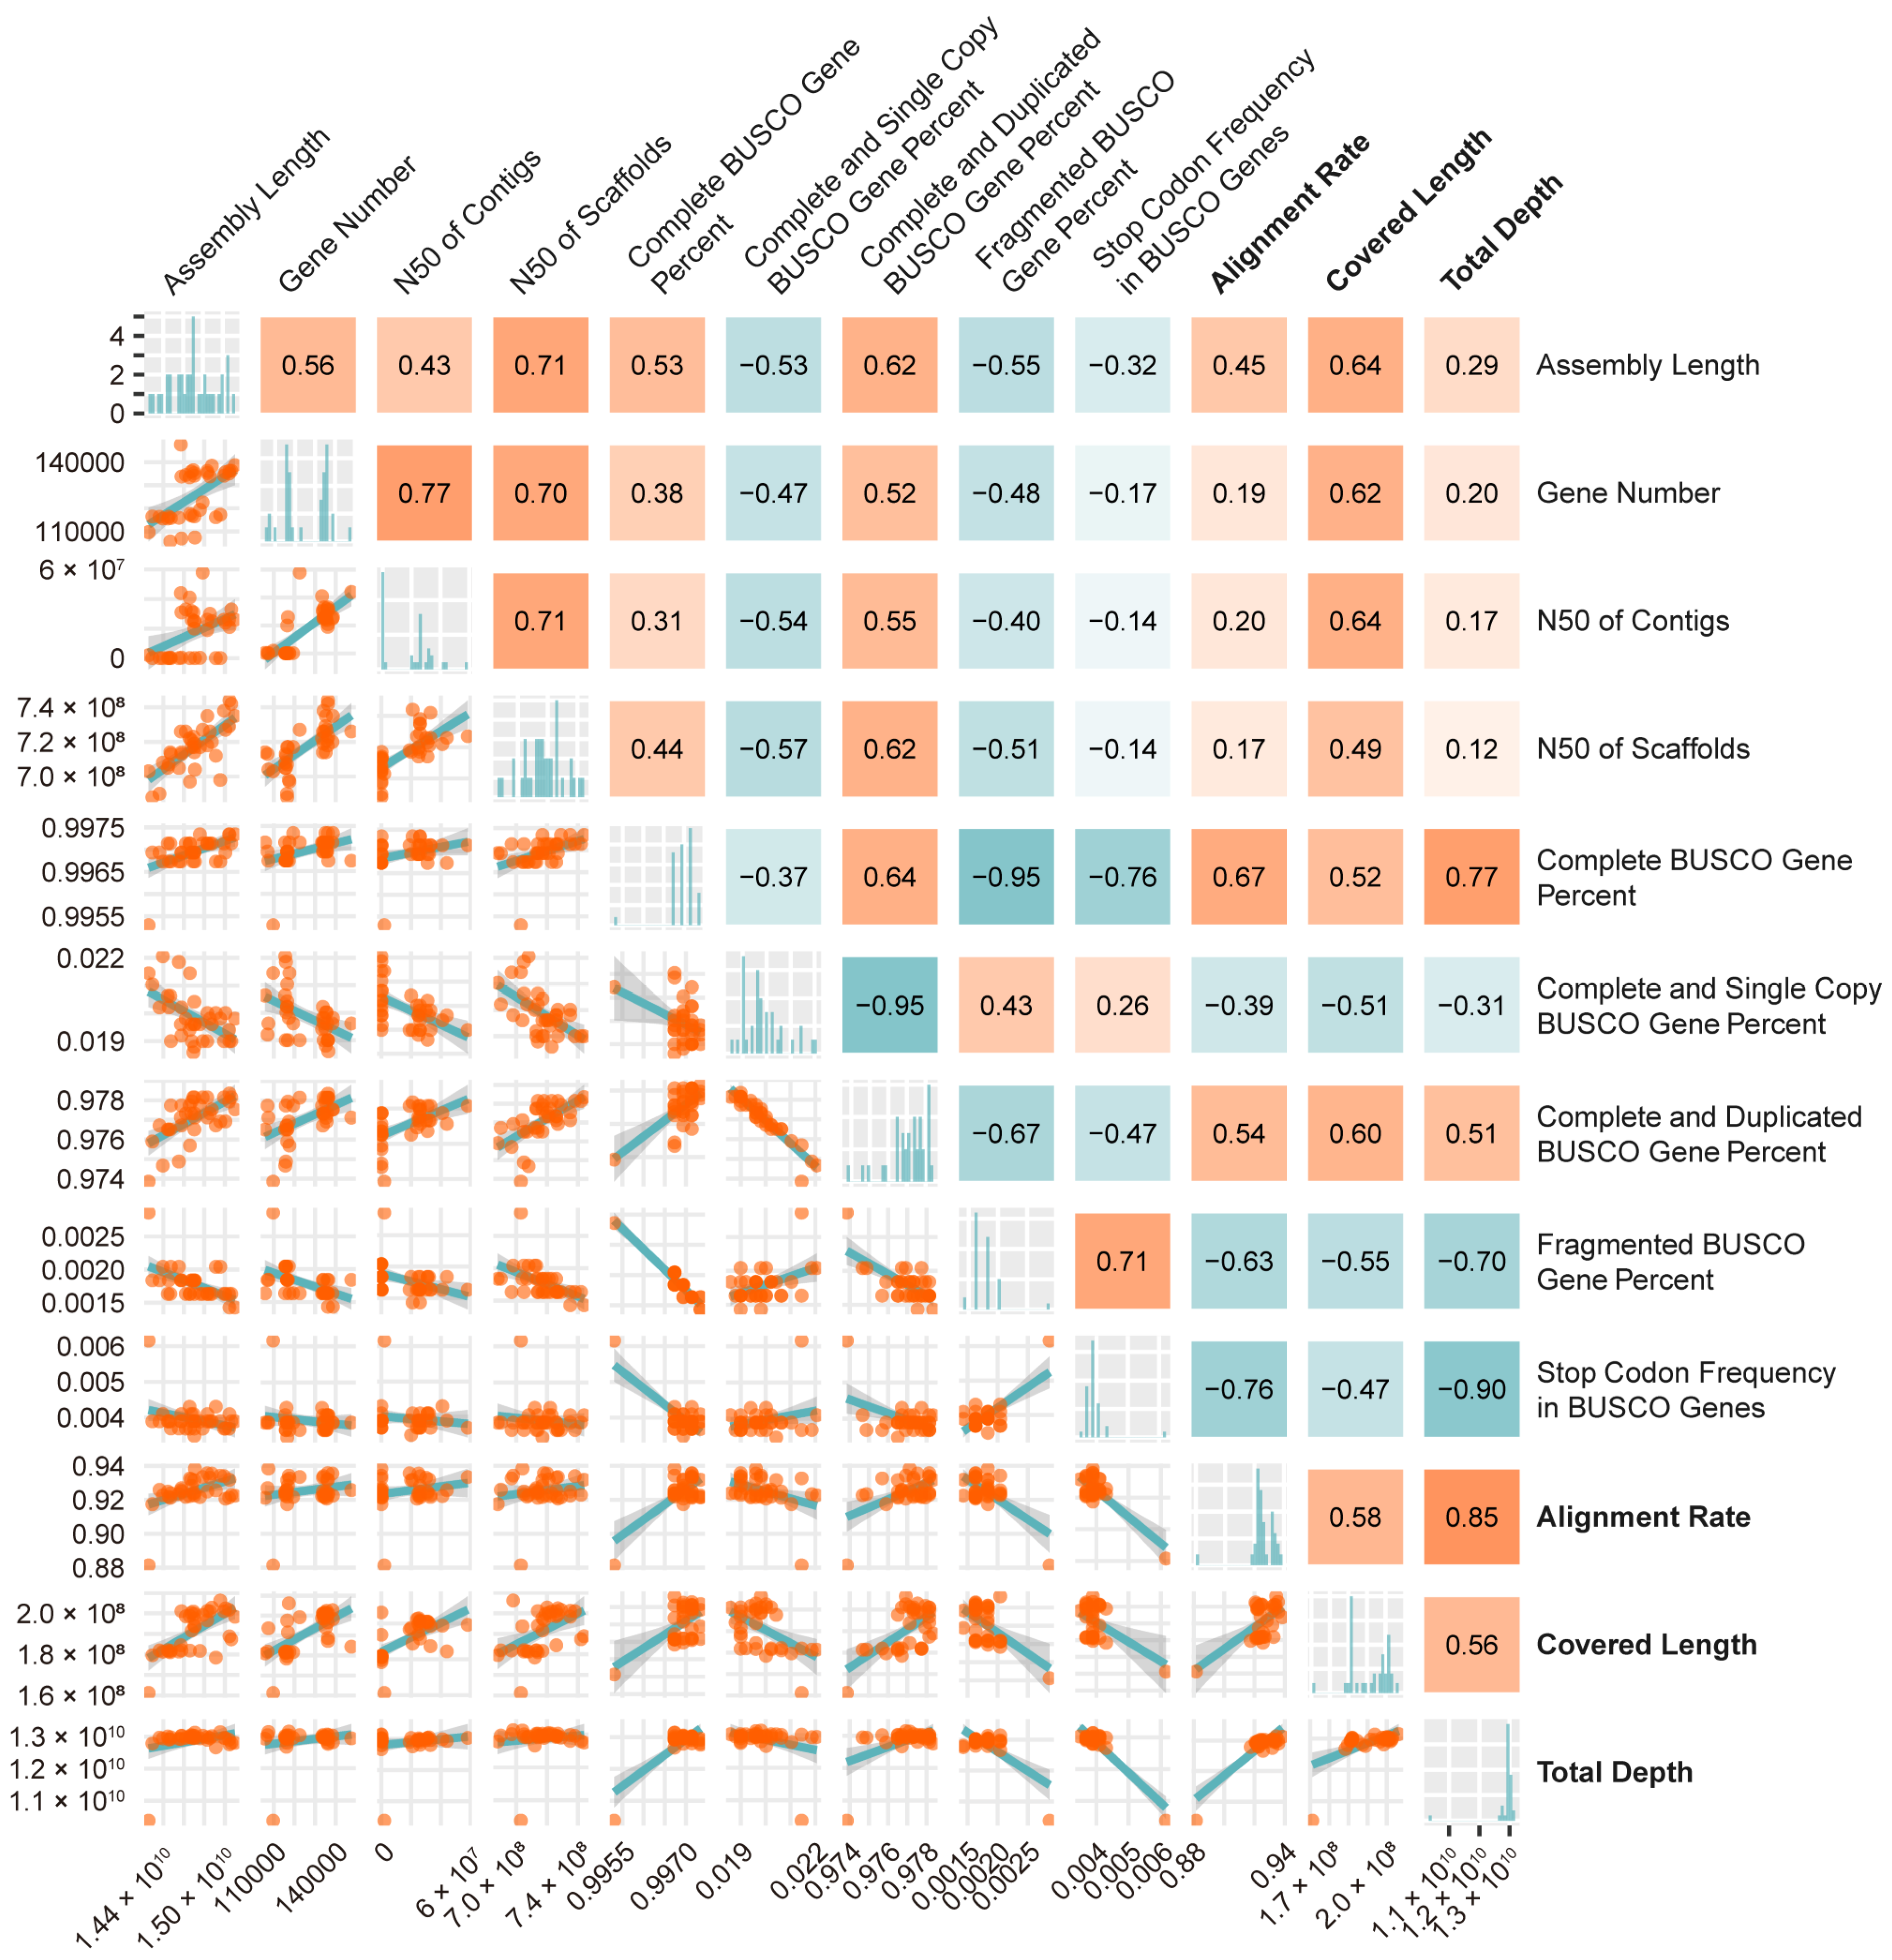
To explore assembly indicators putatively determining or reflecting alignment efficiency, a correlation analysis was performed between the major reference assembly quality indices and wheat cDNA mapping results. This revealed a high negative correlation between stop codon frequency in BUSCO genes and alignment depth, and the former was also moderately negatively correlated with alignment rate. In addition, all the alignment indices were moderately correlated with fragmented BUSCO gene percentage (negative), complete BUSCO gene percentage (positive), and complete and duplicated BUSCO gene percentage (positive). Moderate positive correlations were also observed between covered length and assembly length, gene number and N50 of contigs (Figure 4).

2.3. Efficiency Differences in Reference-Based Transcript Mapping in Rye

Mapping results of rye lines revealed that the alignment rate of Helltop was merely 22.8% on average. We suspect that Helltop was actually not a rye cultivar [45]. Therefore, Helltop was excluded from the subsequent analyses. The alignment rate of other rye lines ranged from 76.2% (Weining mapped to Lo7) to 96.1% (Imperil mapped to Lo7). The Lo7 assembly performed overall better than Weining in alignment rate, covered length, and total depth. However, mapping reads to the Weining genome assembly achieved larger covered length for Weining itself and rye lines Beira, D33, D39, and L318 (Figure 5). Similar to wheat, mapping of RNA reads from a line to its own assembly produced high yields.

2.4. Efficiency Differences in Reference-Based Transcript Mapping in Triticale

To date, there have been no triticale reference genome assemblies available. Therefore, we mapped the triticale cDNA reads (Table S1 and PRJCA035606 (https://ngdc.cncb.ac.cn/gsa, created in the present study)) to the genomes of their originating parents, namely wheat and rye. Results from single-parent references revealed that mapping to the reference assemblies of Kariega, Fielder, CWI86942, Chuanmai104, and Chinese Spring yielded higher alignment rates (Figure S2). The results of covered length were similar to those in wheat, with SY Mattis, Aimengniu, Shi4185, Kuofan11, and Xiaoyan6 ranking highest (Figure S3). For total depth, SY Mattis, Svevo, Zang1817, Zavitan, and Jagger showed the highest values (Figure S4). The single references of rye (Weining and Lo7) and allohexaploid wheat Renan performed poorly in terms of alignment rate, covered length, and total depth. Interestingly, although assemblies of the two allotetraploid wheat lines (Zavitan and Svevo) ranked high in total depth, they performed poorly in alignment rate and covered length.
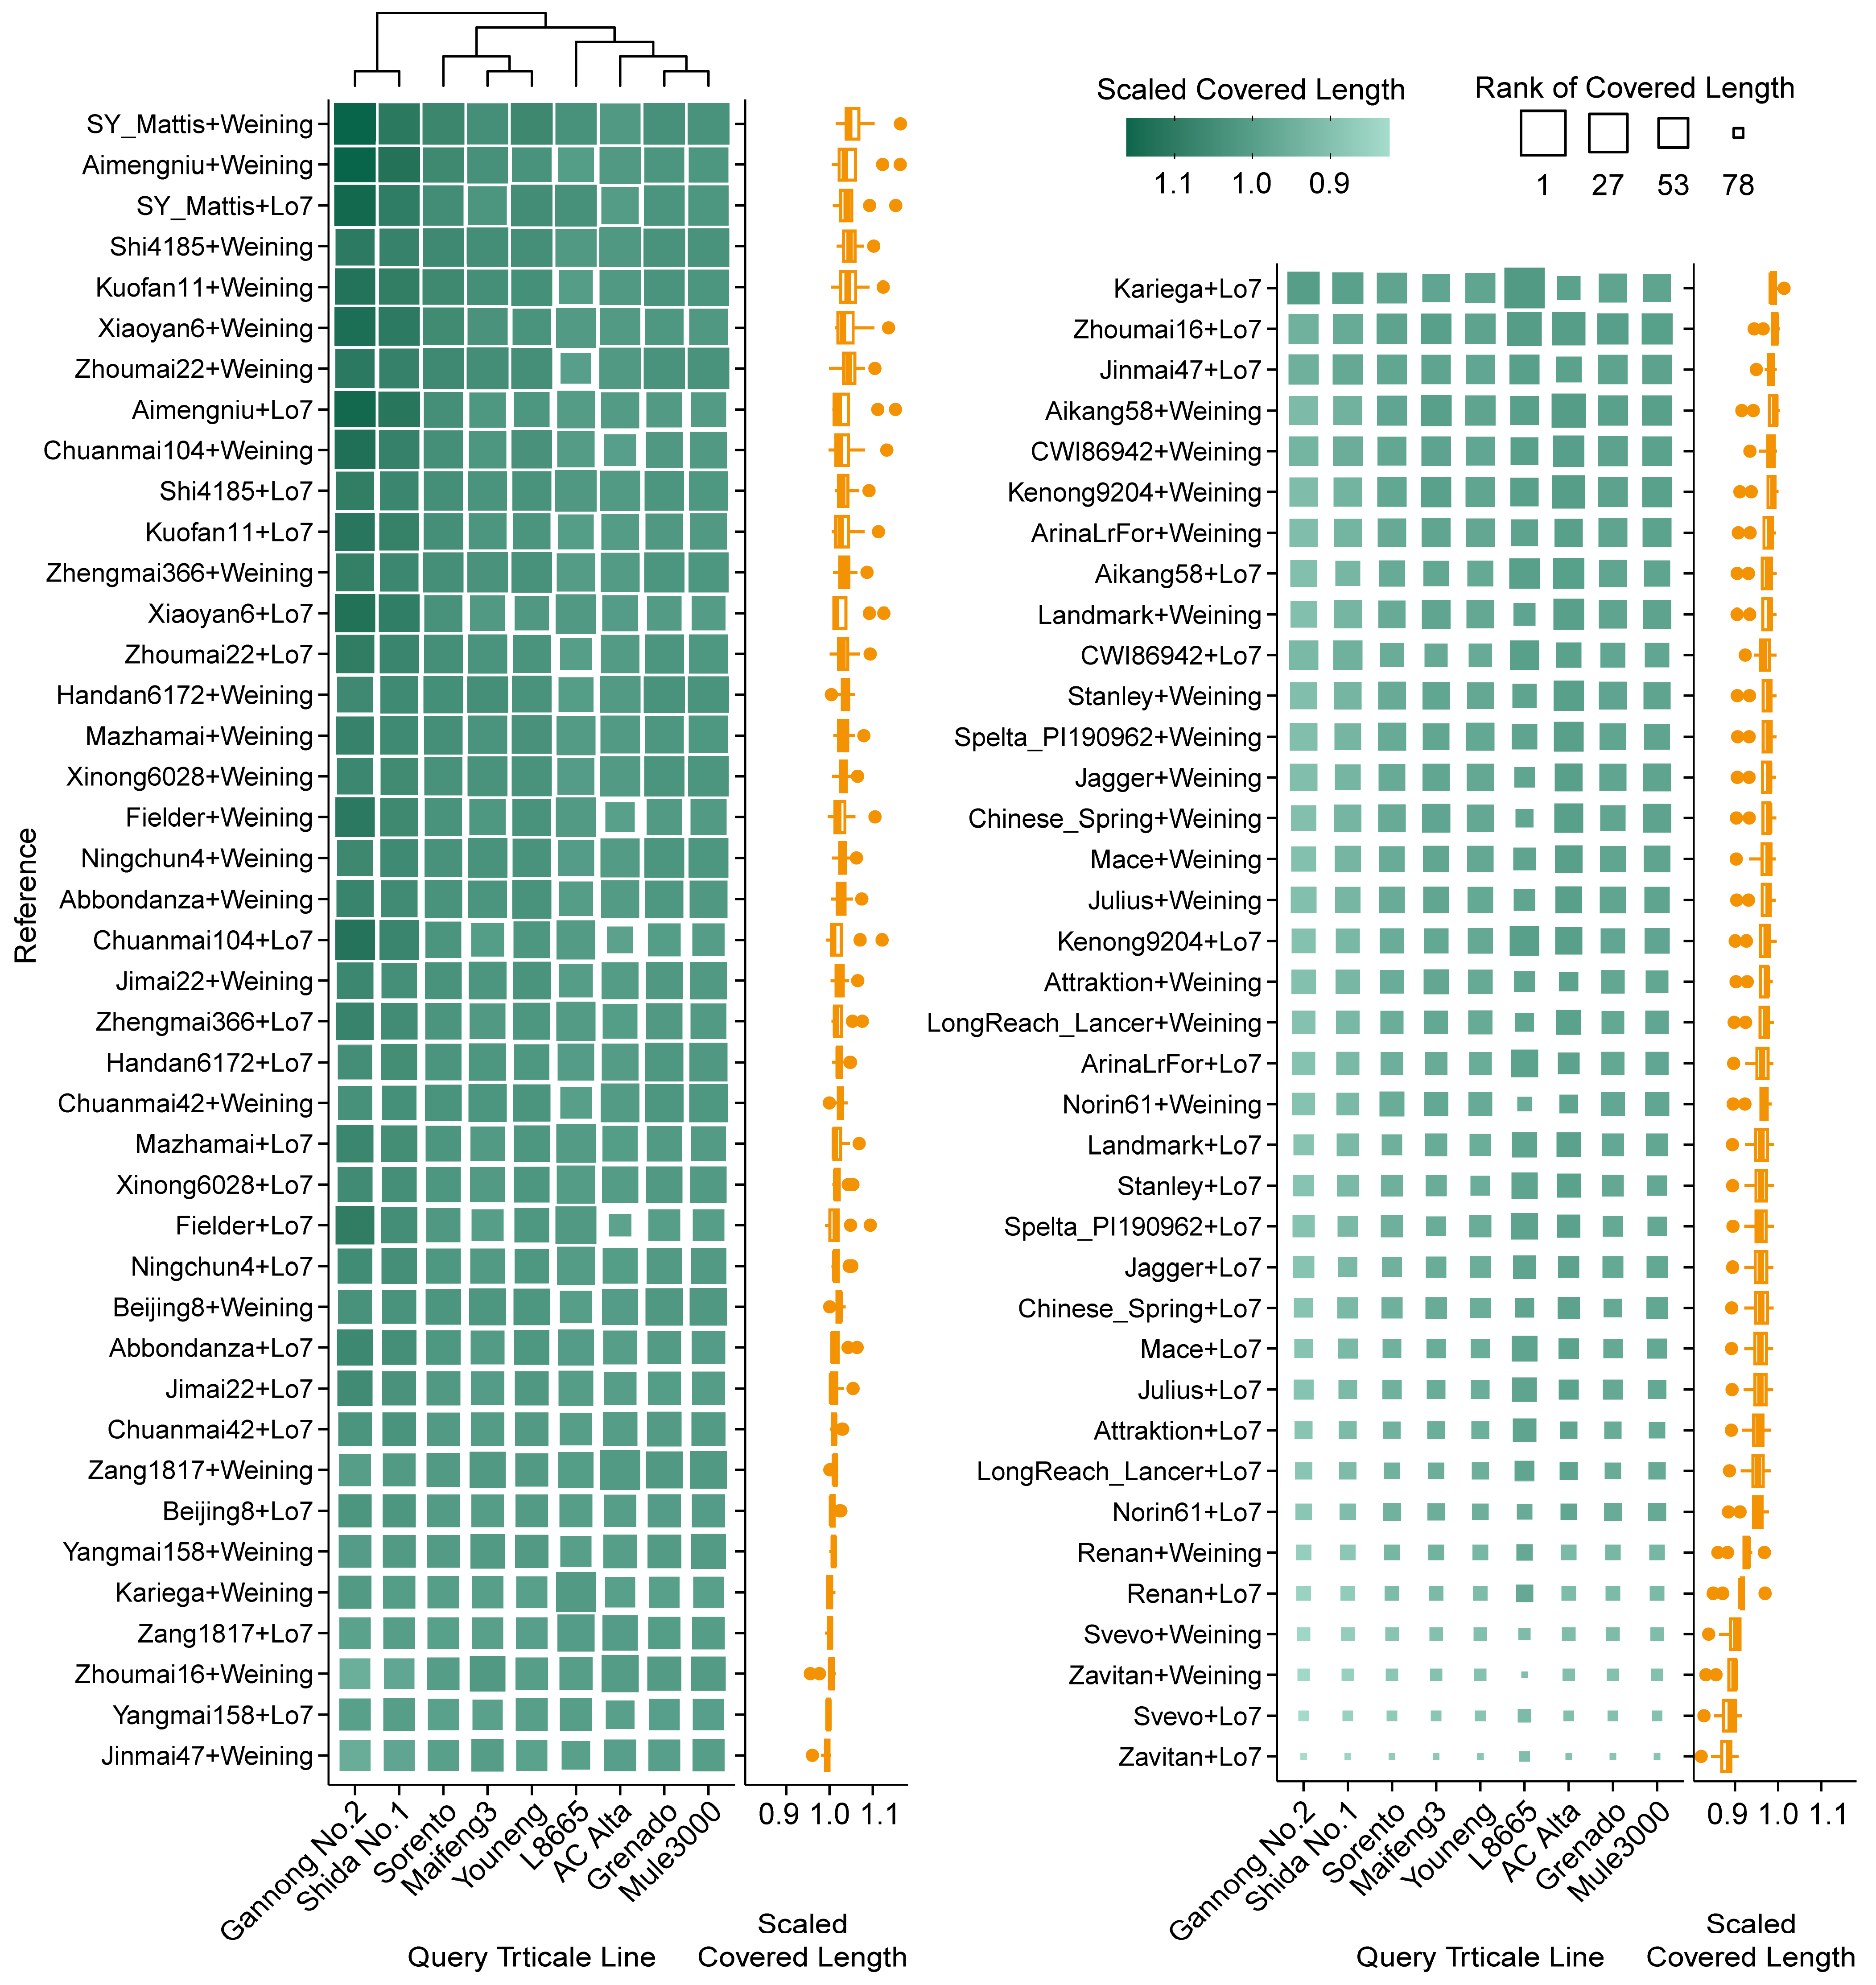
The typical triticale genome is a combination of wheat (either tetraploid or hexaploid) and rye. To interpret the real genome more closely, we combined wheat and rye assemblies and evaluated their performance in annotating RNA-seq data. The resulting alignment rate showed that the long-read L8665 dataset reached more than 99.9%. The alignment rates of other short-read datasets ranged from 88% to 93%, except for Shida No. 1 (~65%), evidencing the high reliability of the combined reference genome. Specifically, Kariega + Weining ranked first overall, followed by Kariega + Lo7, Zang1817 + Weining, ArinaLrFor + Weining, and Xinong6028 + Lo7 (Figure S5); the top combined covered lengths were achieved by SY Mattis + Weining, Aimengniu + Weining, SY Mattis + Lo7, Shi4185 + Weining, and Kuofan11 + Weining (Figure 6). The total depth was separated by the two rye assemblies into two main groups, with the top values all represented by combinations of Lo7 with SY Mattis, Svevo, Zang1817, Zavitan, and Jagger (Figure 7).

2.5. Karyotype Analysis Using RNA-Seq-Based Read Mapping in Triticale

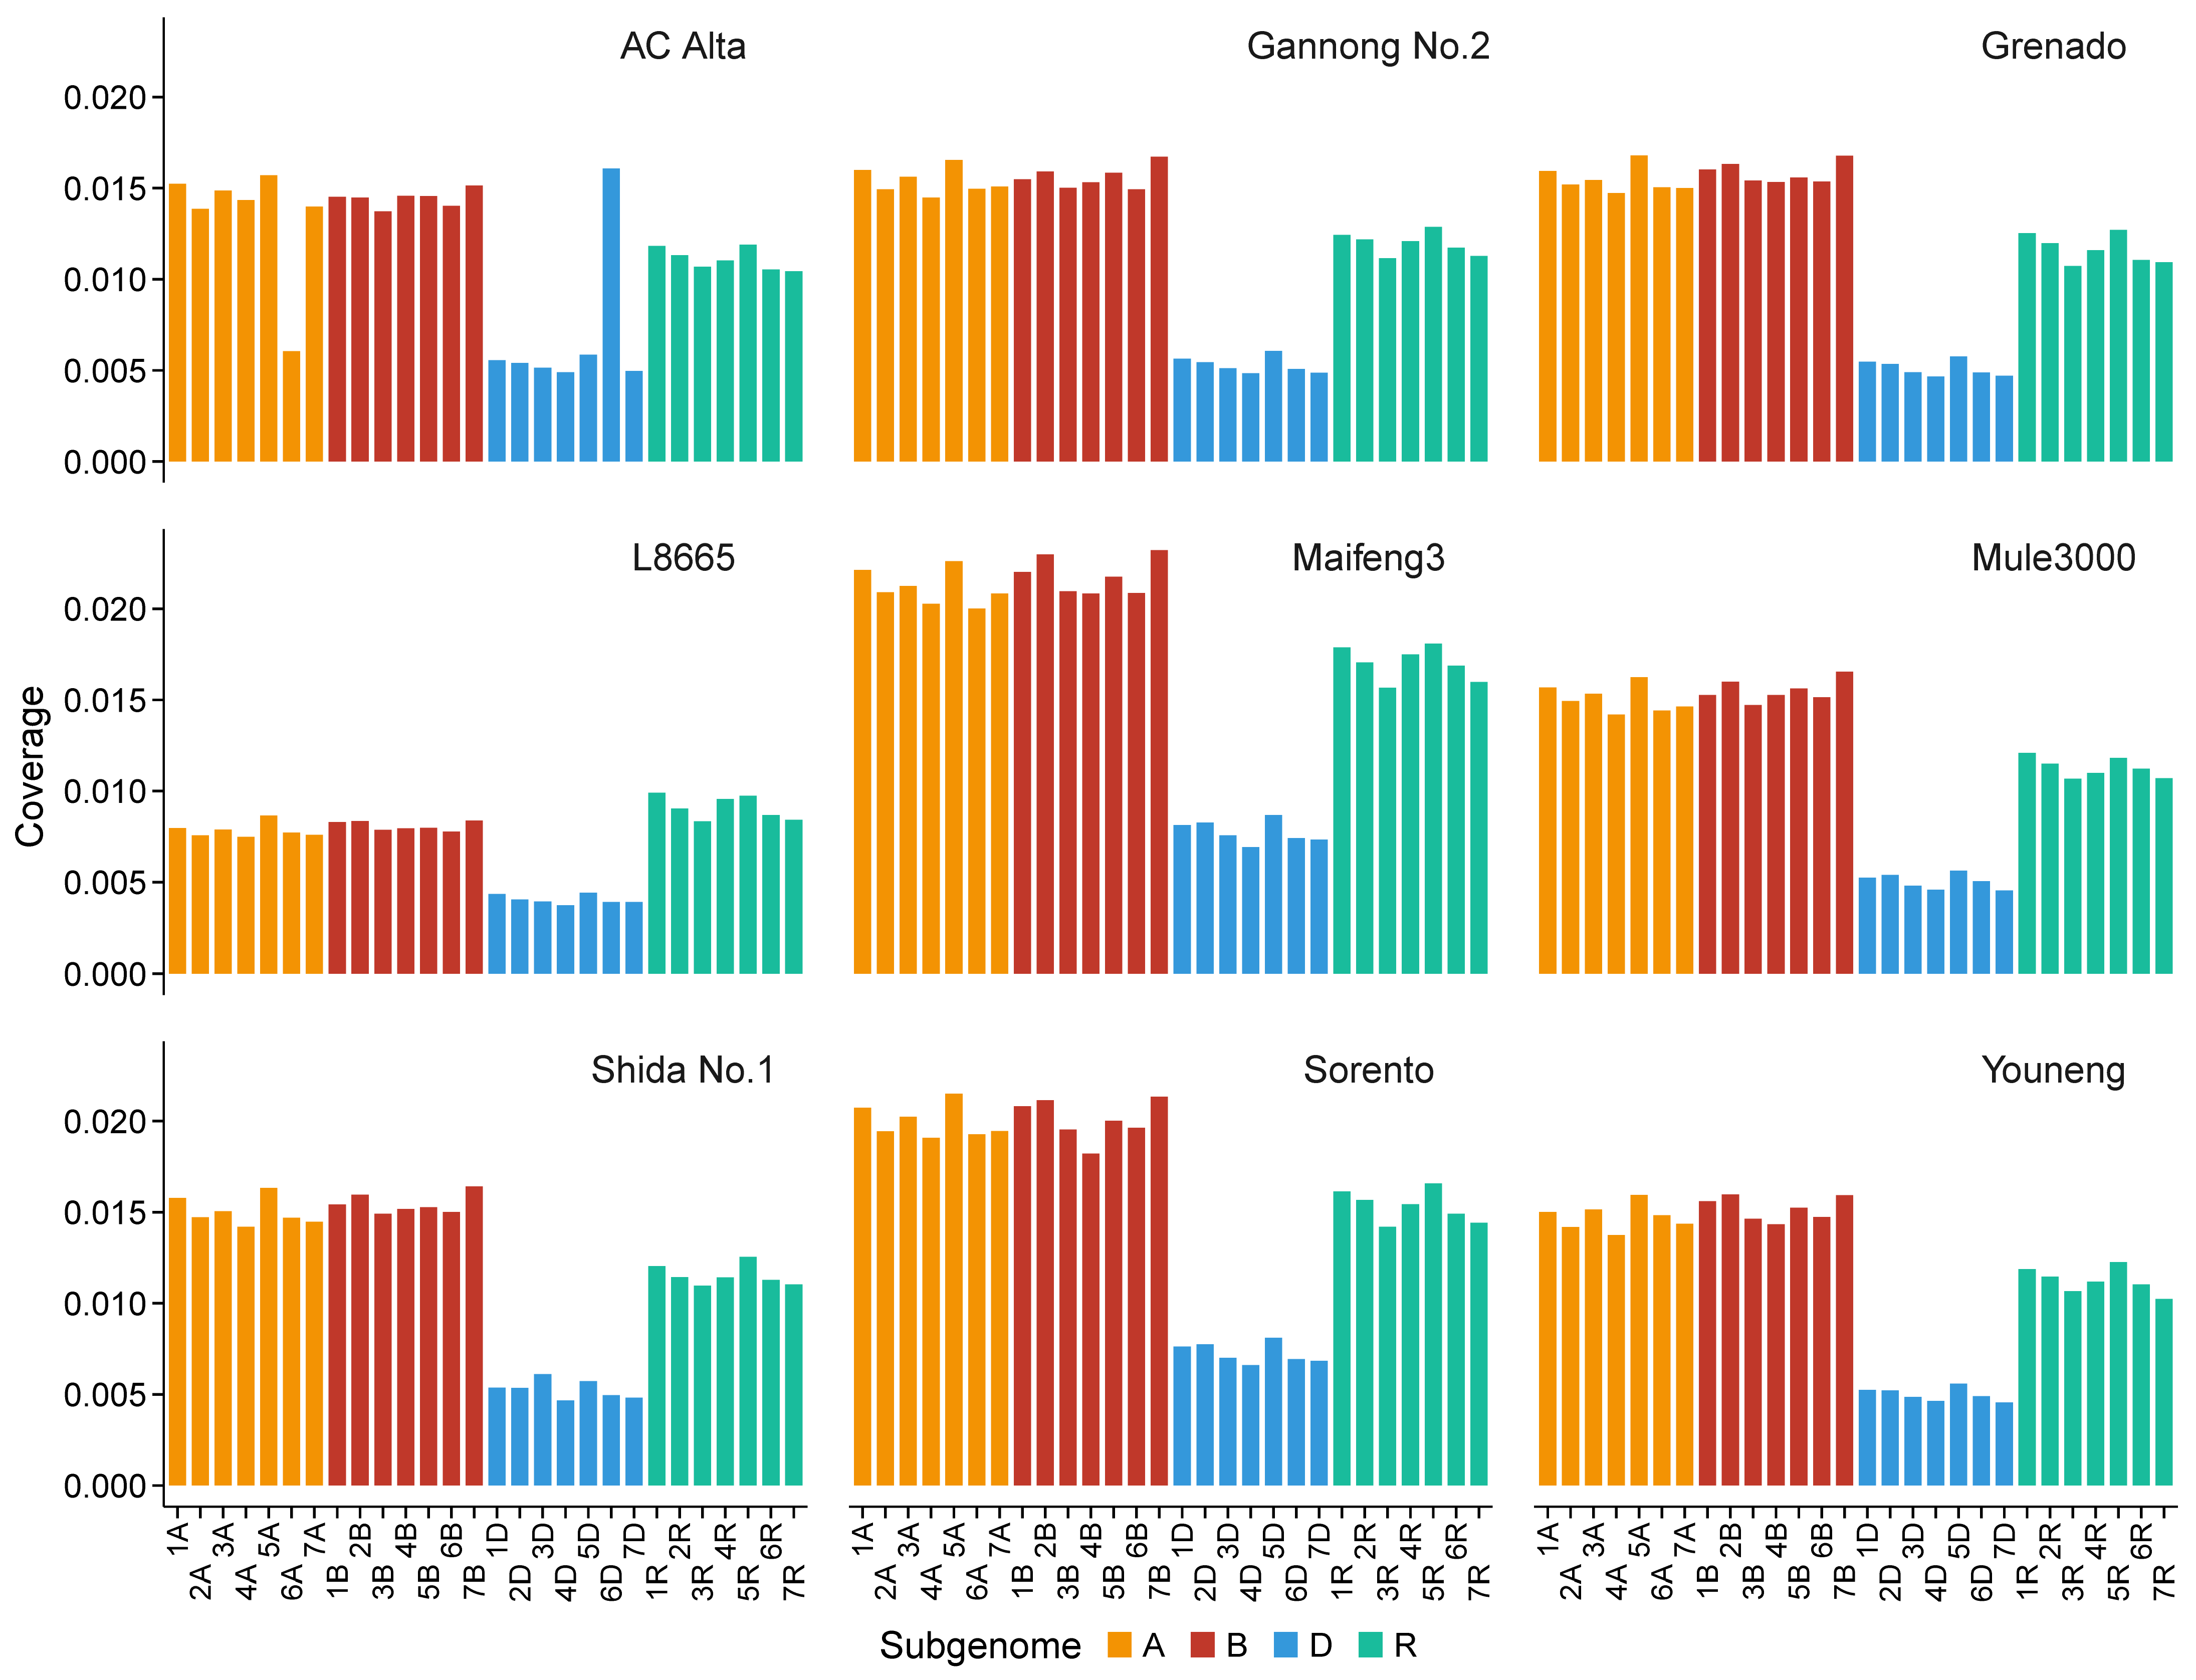
Hexaploid triticale is the most commonly cultivated form. However, chromosomal rearrangements, including replacement, addition, or loss of chromosome(s), as well as partial chromosomal translocations, have been observed in some genotypes [18]. Therefore, chromosome-wise distribution of reads was analyzed to identify the karyotype variations. Among the nine hexaploid triticale lines tested in the present study, read mapping of AC Alta displayed an abnormal decrease in coverage on chromosome 6A but an increase on 6D (Figure 8 and Figure S6), suggesting chromosome replacement or translocation events during the breeding of this line. A more detailed read distribution atlas indicated that stacks of reads were mapped to the entire chromosome 6D and only a short segment of 6A (Figure 9). Another example is Shida No. 1, in which a segment near the end of the 3D chromosome exhibited abnormal read aggregation, also resulting in increased read coverage and total depth of this chromosome (Figure 8 and Figures S6 and S7).

3. Discussion

A proper genome reference could improve the efficiency and accuracy of gene-related studies. By comparing the functional completeness and correctness of the published assemblies of wheat, rye, and triticale, we identified high-performance references that displayed universal applicability across different genotypes.

3.1. Correctness Rather than Number of Complete BUSCO Genes Is the Priority to Characterize Sequence Accuracy of Wheat Assemblies

BUSCO implements standardized benchmarking metrics for the presence of a predefined and expected set of single-copy marker genes as a proxy for genome-wide completeness [25]. BUSCO is particularly valuable for newly sequenced genomes and for comparing the completeness of different genome assemblies. In the present study, all the assemblies covered at least 96.75% of complete BUSCO genes, with completeness exceeding 99.37% in all wheat assemblies. The high percentage may be attributed to the large genome size of Triticeae species, and additionally the polyploid nature of wheat. Furthermore, polyploid genomes (e.g., hexaploid wheat) showed elevated proportions of duplicated BUSCO genes (hexaploid wheat vs. tetraploid wheat vs. rye). This pattern aligns with the inherent genomic redundancy of polyploid Triticeae species, where whole-genome duplication events amplify gene copy numbers. The overall trend was in line with the findings described previously [46].
Notably, differences in the percentages of complete BUSCO genes among wheat assemblies were minimal, and the scores displayed only moderate correlation with read mapping statistics from RNA-seq analysis (Figure 1 and Figure 4). In contrast, the difference in complete BUSCO genes between the two diploid rye lines was distinct (98.65% for Lo7 vs. 96.75% for Weining) and was in line with the RNA-seq validation metrics (Figure 1 and Figure 5). Similar results were also observed in other plants [47]. These observations question the efficacy of using BUSCO in assessing large, complex, and polyploid genome assemblies.
Base-level correctness of a genome assembly can be interpreted as the accuracy of nucleotide assignment, mainly including single-base substitutions and insertions/deletions. Evaluation of base-level correctness is often neglected, despite its essential role in genome quality [22]. Single-base errors generated during sequence assembly might introduce new start or stop codons, leading to false downstream annotations of coding sequences (CDS) and protein sequences, and disrupting BUSCO gene integrity. In our study, a significantly high negative correlation was observed between internal stop codon frequency in BUSCO genes and total depth in wheat (Figure 4). Considering the high conservation of BUSCO genes among different plant species, it is likely that the internal stop codons in BUSCO genes represent one type of base-level error during genome sequencing or assembly. Moreover, mapping depth has been reported as a direct indicator of the accuracy of RNA-seq data [29,30,31]. In the context of mapping various RNA-seq data to different genome assemblies, the variance in resulting mapping depth can also be evaluated to reflect the correctness of reference assemblies. Similarly, although just moderately correlated, the percentage of fragmented BUSCO genes serves as a reference for assessing long fragment and structural correctness of a genome assembly (Figure 4). Collectively, the internal stop codon frequency in BUSCO genes can be employed to evaluate the base-level correctness of existing and future genome assemblies.

3.2. Efficient References to Study Gene Structure and Expression in Wheat, Rye, and Triticale

Statistics of overall alignment rate, covered length, and depth generated via RNA-seq read mapping were employed to evaluate the transcript mappability of genome assemblies. Specifically, alignment rate represents the percentage of sequenced reads successfully mapped to a reference genome. Considering that some mapped reads are partially aligned to the genome or contain unmapped bases, alignment rate cannot faithfully reflect the absolute amount of mapped bases [48]. Therefore, total covered length and depth of mapped RNA-seq reads were preferentially selected to signify the completeness and correctness of the subject assemblies [28]. However, as a basic statistic of read mapping, alignment rate is easy to obtain and can be utilized to evaluate mapping quality. For example, in the current study, the alignment rate of a claimed rye cultivar Helltop was as low as 22.8% on average, which was evidently incorrect and should be excluded from downstream analyses to avoid wasting time and making erroneous decisions. In such cases, covered length and total depth cannot directly quantify the large number of unmapped bases.
Larger covered length represents a longer effective reference template in the assembly than other candidates, which is predominantly linked to the completeness of gene space. On the other hand, higher depth indicates that more reads were successfully aligned to the subject assembly than to other candidates, which implies a higher sequence similarity between the query line and the subject genome, and also ensures the accuracy of sequence structure and expression quantification [29,30,31]. Additionally, alignment rate in this study was regarded as an auxiliary metric for total depth evaluation.
For allohexaploid wheat, alignment to the assembly of SY Mattis achieved both the largest covered length and total depth on average across all query lines. SY Mattis is a European winter wheat variety that harbors numerous chromosome segment translocations [3,49,50]. Other top-ranked assemblies exhibited advantages specifically in either covered length or total depth. The widely adopted Chinese Spring assembly ranked in a lower position and was not recommended for gene-related studies unless using data from the same genotype. Nevertheless, a key advantage of the Chinese Spring assembly is its extensive gene annotations [32]. Researchers may need to map the existing annotations to genes in other assemblies, or select the Chinese Spring assembly directly if sequence completeness is not the priority. Similar considerations apply to triticale studies.
Although the assembly size of Lo7 is much smaller, and the predicted gene number is less than Weining, and was not recommended by Rabanus-Wallace et al. [51] due to the shorter scaffolds, the assembly of Lo7 ranked higher in all three metrics of covered length, total depth, and alignment rate on average (Table 1; Figure 5). The consistent results in rye and wheat indicated that the assembly continuity had limited influence on functional completeness and correctness, which is in line with the previously discovered poor correlation between BUSCO scores and N50 [47]. It should be noted that both of the two sequenced rye lines are self-pollinated, which is inconsistent with the general cultivated cross-pollinated cultivars [8,44]. Hence, relevant aspects should be taken into account when referring to these two assemblies. Moreover, the highly reticulate evolutionary history of rye is thought to have contributed to a highly mosaic genome structure, including frequent introgression and translocation of other Triticeae genome segments [44,52]. When analyzing structure or expression of rye genes, incorporation of other Triticeae genome resources may provide supplementary insights.
For hexaploid triticale, the top-performing assemblies can be summarized as a combination of top candidates of wheat and rye. Considering the large deficiency of total depth in the combined assembly of SY Mattis + Weining and Aimengniu + Weining, we recommend that the assembly of SY Mattis + Lo7 be prioritized as a mapping reference to balance mapping completeness and correctness (Figure 6 and Figure 7). As most cultivated triticale worldwide are hexaploid, covered length and depth designated on the D genome could result in a high probability of false positives. However, the octoploid reference is still recommended because introgression of the D genome into ABR genomes frequently occurs during triticale breeding, such as substitutions of 1D (1A), 2D (2R), 5D (5B) and 6D (6R), deletions of the long arm of chromosome 2D or the short arm of 5R, and translocations of the long arms of 7D/7A, the short arms of 6D/6A, or the long arms of 1D/1A [1,18,53]. Read mapping of AC Alta and Shida No. 1 in this study evidenced these modifications (Figure 9 and Figure S7). Moreover, Cao et al. [18] reported that among 199 accessions originally labeled as triticale, 20 were verified as hexaploid wheat, three as tetraploid wheat, and one as rye. An option to avoid or decrease artifacts is examining read distribution on chromosomes after read mapping to clarify potential mislabeling, chromosome substitutions, or large segment translocations, and excluding void mapping results on certain chromosomes (usually D genomes) in downstream analyses. However, reads mapped to sequences on unassigned chromosomes are difficult to identify or remove and require further consideration.

4. Materials and Methods

4.1. Data Source

Genome sequences and corresponding annotations of wheat and rye, publicly available RNA-seq data for wheat and rye, and triticale cultivars AC Alta, Gannong No. 2, Shida No. 1, and L8665 were downloaded from the relevant repositories described in each reference publication. The basic information and sources of the data are listed in Table 1 and Table S1. Transcriptomic data of triticale cultivars Youneng, Maifeng3, Sorento, Grenado, and Mule3000 were obtained through local RNA-seq analysis as described in subsequent Section 4.3 and Section 4.4 below.

4.2. BUSCO Assessing of Genome Assemblies

Completeness of genome assemblies was assessed using BUSCO (version 5.7.1). Genes were mapped via the Miniprot pipeline and the poales_odb10 gene set was used as the reference. Statistics of the assemblies and annotations were summarized using BUSCO and assembly_stats (version 0.1.4).

4.3. Plant Materials and Growth Conditions

The triticale used for seedling growth and RNA extraction in this study included cultivars Youneng, Maifeng3, Sorento, Grenado, and Mule3000. Healthy and uniform seeds were surface-sterilized by soaking in 10% hydrogen peroxide for 30 min, followed by rinsing in distilled water five times. The seeds were then placed on filter paper in 15 cm diameter petri dishes and kept in a growth chamber to select uniformly germinated seeds. After one day, seeds with protruding radicles were carefully transplanted to rectangular pots (10 cm × 10 cm × 8.5 cm) with perlite as the culture substrates. Deionized water and 1/2-strength Hoagland solution were applied alternately every other week. Throughout cultivation, the growth chamber was maintained at a photoperiod of 16 h light/8 h dark and a temperature of 25/20 °C (light/dark). After three weeks, the shoots were collected, immediately frozen in liquid nitrogen, and stored at −80 °C until RNA extraction.

4.4. RNA Extraction, RNA-Seq Library Construction and Transcriptome Sequencing

Total RNA of triticale cultivars Youneng, Maifeng3, Sorento, Grenado, and Mule3000 was extracted using RNAprep Pure Plant Kit (Tiangen Biotech, Beijing, China) according to the manufacturer’s instructions. After concentration and quality examination, mRNA was purified from total RNA using oligo(dT)-attached magnetic beads for transcriptome sequencing. The subsequent RNA fragmentation, cDNA synthesis, sequencing library construction, and qualification processes were performed using the NEBNext Ultra RNA Library Prep Kit for Illumina (NEB, Ipswich, MA, USA) according to the manufacturer’s instructions. The qualified libraries were pooled and sequenced using a paired-end 150 bp (PE150) strategy on the Illumina NovaSeq 6000 platform at Novogene Bioinformatics Technology Co., Ltd. (Beijing, China). The generated sequences were deposited in the China National Center for Bioinformation under project number PRJCA035606 and are publicly accessible at https://ngdc.cncb.ac.cn/gsa (date created: 26 January 2025).

4.5. RNA-Seq Data Analysis

All sequence data generated via Next-Generation Sequencing, including those obtained from public repositories and those generated in this study (Table S1), were processed in the same downstream pipeline. Sequence data from the same crop variety and experiment were merged prior to processing. Quality control of raw sequence data was performed using fastp (version 0.23.2) to remove reads containing adapters or of low quality. The main filtering criteria included qualified quality phred (5), unqualified percent limit (50), limit of number of N base (15), and minimal required read length (60% of total). The maximum number and percentage of mismatched bases to detect overlapping regions of PE reads were set to 1 and 10, respectively. After building indices based on the corresponding GTF annotation for high-confidence (HC) genes, the obtained clean reads from each genotype were aligned separately to the reference genomes using hisat2 (version 2.2.1) with the default settings. The alignment rate of query RNA-seq reads was calculated from hisat2 outputs. After mapping, the SAM files generated by hisat2 were sorted and converted to BAM format using Samtools (version 1.16.1) before downstream analyses.
Sequence data of triticale cultivar L8665 were generated using Oxford Nanopore MinION platform [54] and were processed differently. Briefly, raw sequences were filtered using Filtlong (version 0.2.1) with minimum length threshold and minimum mean quality threshold set to 500 and 7, respectively. The resulting clean reads were then mapped to reference genomes via minimap2 (version 2.28), and alignment metadata were retrieved using Samtools flagstat, followed by calculating via a local Perl script.
Based on the BAM files generated by sequence alignment, mapping coverage and depth of mapped reads were analyzed using PanDepth (version 2.25) and further summarized and visualized in R.

5. Conclusions

In this study, assemblies of wheat, rye, and triticale were analyzed through integrated BUSCO analysis and transcript mapping to select high-performance references for studies of gene space and expression. Comparison of alignment rate, covered length, and total depth for RNA-seq read mapping revealed that the assemblies of SY Mattis, Lo7, and SY Mattis plus Lo7 were the most robust references for gene-related studies in wheat, rye, and triticale, respectively. Most BUSCO statistics for wheat genomes were not sensitive enough to evaluate the genome assemblies, but the frequency of internal stop codons in BUSCO genes was closely correlated with RNA-seq read mapping depth, which was considered to be an indicator of sequence correctness of a genome assembly. For hexaploid triticale, the combination of AABBDDRR genomes provides a comprehensive reference that included the frequently incorporated D genome sequences in the genome. Reference assemblies recommended in this study could assist future gene-related research, and the BUSCO indicators could serve to evaluate plant genome assemblies in the future.

Supplementary Materials

The following supporting information can be downloaded at https://www.mdpi.com/article/10.3390/plants14071140/s1. Figure S1: Alignment rate distribution of RNA-seq reads derived from different wheat varieties mapped to different wheat genome references. Figure S2: Alignment rate distribution of RNA-seq reads derived from different triticale varieties mapped to different wheat or rye genome references. Figure S3: Covered length distribution of RNA-seq reads derived from different triticale varieties mapped to different wheat or rye genome references. Figure S4: Total depth distribution of RNA-seq reads derived from different triticale varieties mapped to different wheat or rye genome references. Figure S5: Alignment rate distribution of RNA-seq reads derived from different triticale varieties mapped to different simulated triticale genome references. Figure S6: Chromosome-wise total depth distribution of RNA-seq reads derived from different triticale varieties mapped to genome reference of combined SY Mattis plus Lo7. Figure S7: Read depth profile of RNA-seq reads derived from Shida 1 mapped to genome reference of combined SY Mattis plus Lo7. Table S1: Information on RNA-seq data used in this study.

Author Contributions

Conceptualization, M.Y.; methodology, G.Y., M.Y. and D.Y.; resources, Q.W., J.G. and C.M; data curation, M.Y., G.Y. and C.M.; writing—original draft preparation, M.Y.; writing—review and editing, X.Z.; supervision, Q.W., J.G. and C.M. All authors have read and agreed to the published version of the manuscript.

Funding

This research was funded by the National Natural Science Foundation of China (32301486), the National Key Research and Development Program (2023YFD1900402-02), and the Scientific Startup Foundation for Doctors of Northwest A&F University (2452021054).

Data Availability Statement

The raw sequence data reported in this paper have been deposited in the Genome Sequence Archive (Genomics, Proteomics & Bioinformatics 2021) in the National Genomics Data Center, China National Center for Bioinformation/Beijing Institute of Genomics, Chinese Academy of Sciences (PRJCA035606), and are publicly accessible at https://ngdc.cncb.ac.cn/gsa (date created: 26 January 2025).

Acknowledgments

We would like to thank Peizhi Yang (Northwest A&F University, China) for kind provision of some of the germplasm resources used in this study. We thank the high-performance computing platform of Northwest A&F University (HPC of NWAFU) for support with computing resources.

Conflicts of Interest

The authors declare no conflicts of interest.

References

  1. Ayalew, H.; Anderson, J.D.; Krom, N.; Tang, Y.; Butler, T.J.; Rawat, N.; Tiwari, V.; Ma, X.-F. Genotyping-by-sequencing and genomic selection applications in hexaploid triticale. G3 Genes|Genomes|Genet. 2022, 12, jkab413. [Google Scholar] [CrossRef] [PubMed]
  2. Schreiber, M.; Özkan, H.; Komatsuda, T.; Mascher, M. Evolution and domestication of rye. In The Rye Genome; Rabanus-Wallace, M.T., Stein, N., Eds.; Springer International Publishing: Cham, Switzerland, 2021; pp. 85–100. [Google Scholar]
  3. Walkowiak, S.; Gao, L.; Monat, C.; Haberer, G.; Kassa, M.T.; Brinton, J.; Ramirez-Gonzalez, R.H.; Kolodziej, M.C.; Delorean, E.; Thambugala, D.; et al. Multiple wheat genomes reveal global variation in modern breeding. Nature 2020, 588, 277–283. [Google Scholar] [CrossRef]
  4. Maccaferri, M.; Harris, N.S.; Twardziok, S.O.; Pasam, R.K.; Gundlach, H.; Spannagl, M.; Ormanbekova, D.; Lux, T.; Prade, V.M.; Milner, S.G.; et al. Durum wheat genome highlights past domestication signatures and future improvement targets. Nat. Genet. 2019, 51, 885–895. [Google Scholar] [CrossRef]
  5. Randhawa, H.S.; Bona, L.; Graf, R.J. Triticale breeding—Progress and prospect. In Triticale; Eudes, F., Ed.; Springer International Publishing: Cham, Switzerland, 2015; pp. 15–32. [Google Scholar]
  6. Kuleung, C.; Baenziger, P.S.; Dweikat, I. Transferability of SSR markers among wheat, rye, and triticale. Theor. Appl. Genet. 2004, 108, 1147–1150. [Google Scholar] [CrossRef] [PubMed]
  7. Gao, Z.; Bian, J.; Lu, F.; Jiao, Y.; He, H. Triticeae crop genome biology: An endless frontier. Front. Plant Sci. 2023, 14, 1222681. [Google Scholar]
  8. Li, G.; Wang, L.; Yang, J.; He, H.; Jin, H.; Li, X.; Ren, T.; Ren, Z.; Li, F.; Han, X.; et al. A high-quality genome assembly highlights rye genomic characteristics and agronomically important genes. Nat. Genet. 2021, 53, 574–584. [Google Scholar] [CrossRef]
  9. Xiao, J.; Liu, B.; Yao, Y.; Guo, Z.; Jia, H.; Kong, L.; Zhang, A.; Ma, W.; Ni, Z.; Xu, S.; et al. Wheat genomic study for genetic improvement of traits in China. Sci. China Life Sci. 2022, 65, 1718–1775. [Google Scholar] [CrossRef]
  10. Avni, R.; Nave, M.; Barad, O.; Baruch, K.; Twardziok, S.O.; Gundlach, H.; Hale, I.; Mascher, M.; Spannagl, M.; Wiebe, K.; et al. Wild emmer genome architecture and diversity elucidate wheat evolution and domestication. Science 2017, 357, 93–97. [Google Scholar] [CrossRef] [PubMed]
  11. The International Wheat Genome Sequencing Consortium; Appels, R.; Eversole, K.; Stein, N.; Feuillet, C.; Keller, B.; Rogers, J.; Pozniak, C.J.; Choulet, F.; Distelfeld, A.; et al. Shifting the limits in wheat research and breeding using a fully annotated reference genome. Science 2018, 361, eaar7191. [Google Scholar] [CrossRef]
  12. Denton, J.F.; Lugo-Martinez, J.; Tucker, A.E.; Schrider, D.R.; Warren, W.C.; Hahn, M.W. Extensive error in the number of genes inferred from draft genome assemblies. PLoS Comput. Biol. 2014, 10, e1003998. [Google Scholar] [CrossRef]
  13. Vuruputoor, V.S.; Monyak, D.; Fetter, K.C.; Webster, C.; Bhattarai, A.; Shrestha, B.; Zaman, S.; Bennett, J.; McEvoy, S.L.; Caballero, M.; et al. Welcome to the big leaves: Best practices for improving genome annotation in non-model plant genomes. Appl. Plant Sci. 2023, 11, e11533. [Google Scholar] [CrossRef]
  14. Coombes, B.; Lux, T.; Akhunov, E.; Hall, A. Introgressions lead to reference bias in wheat RNA-seq analysis. BMC Biol. 2024, 22, 56. [Google Scholar] [CrossRef] [PubMed]
  15. Yang, Y.; Zhang, X.; Wu, L.; Zhang, L.; Liu, G.; Xia, C.; Liu, X.; Kong, X. Transcriptome profiling of developing leaf and shoot apices to reveal the molecular mechanism and co-expression genes responsible for the wheat heading date. BMC Genom. 2021, 22, 468. [Google Scholar] [CrossRef] [PubMed]
  16. Hao, M.; Yang, W.; Li, T.; Shoaib, M.; Sun, J.; Liu, D.; Li, X.; Nie, Y.; Tian, X.; Zhang, A. Combined transcriptome and proteome analysis of anthers of AL-type cytoplasmic male sterile line and its maintainer line reveals new insights into mechanism of male sterility in common wheat. Front. Genet. 2021, 12, 762332. [Google Scholar] [CrossRef] [PubMed]
  17. Hua, Y.-p.; Wang, Y.; Zhou, T.; Huang, J.-y.; Yue, C.-p. Combined morpho-physiological, ionomic and transcriptomic analyses reveal adaptive responses of allohexaploid wheat (Triticum aestivum L.) to iron deficiency. BMC Plant Biol. 2022, 22, 234. [Google Scholar] [CrossRef]
  18. Cao, D.; Wang, D.; Li, S.; Li, Y.; Hao, M.; Liu, B. Genotyping-by-sequencing and genome-wide association study reveal genetic diversity and loci controlling agronomic traits in triticale. Theor. Appl. Genet. 2022, 135, 1705–1715. [Google Scholar] [CrossRef]
  19. Bimpong, D.; Zhao, L.; Ran, M.; Zhao, X.; Wu, C.; Li, Z.; Wang, X.; Cheng, L.; Fang, Z.; Hu, Z.; et al. Transcriptomic analysis reveals the regulatory mechanisms of messenger RNA (mRNA) and long non-coding RNA (lncRNA) in response to waterlogging stress in rye (Secale cereale L.). BMC Plant Biol. 2024, 24, 534. [Google Scholar] [CrossRef]
  20. Tsers, I.; Meshcherov, A.; Gogoleva, O.; Petrova, O.; Gogoleva, N.; Ponomareva, M.; Gogolev, Y.; Korzun, V.; Gorshkov, V. Alterations in the transcriptome of rye plants following the Microdochium nivale infection: Identification of resistance/susceptibility-related reactions based on RNA-Seq analysis. Plants 2021, 10, 2723. [Google Scholar] [CrossRef]
  21. Krępski, T.; Piasecka, A.; Święcicka, M.; Kańczurzewska, M.; Sawikowska, A.; Dmochowska-Boguta, M.; Rakoczy-Trojanowska, M.; Matuszkiewicz, M. Leaf rust (Puccinia recondita f. sp. secalis) triggers substantial changes in rye (Secale cereale L.) at the transcriptome and metabolome levels. BMC Plant Biol. 2024, 24, 107. [Google Scholar] [CrossRef]
  22. Wang, P.; Wang, F. A proposed metric set for evaluation of genome assembly quality. Trends Genet. 2023, 39, 175–186. [Google Scholar] [CrossRef]
  23. Parra, G.; Bradnam, K.; Ning, Z.; Keane, T.; Korf, I. Assessing the gene space in draft genomes. Nucleic Acids Res. 2009, 37, 289–297. [Google Scholar] [CrossRef] [PubMed]
  24. Rhie, A.; McCarthy, S.A.; Fedrigo, O.; Damas, J.; Formenti, G.; Koren, S.; Uliano-Silva, M.; Chow, W.; Fungtammasan, A.; Kim, J.; et al. Towards complete and error-free genome assemblies of all vertebrate species. Nature 2021, 592, 737–746. [Google Scholar] [CrossRef] [PubMed]
  25. Manni, M.; Berkeley, M.R.; Seppey, M.; Zdobnov, E.M. BUSCO: Assessing genomic data quality and beyond. Curr. Protoc. 2021, 1, e323. [Google Scholar] [CrossRef] [PubMed]
  26. Earth Biogenome Project’s Scientific Subcommittee for Sequencing and Assembly. Report on Assembly Standards. Available online: https://www.earthbiogenome.org/report-on-assembly-standards (accessed on 21 January 2025).
  27. Whibley, A.; Kelley, J.L.; Narum, S.R. The changing face of genome assemblies: Guidance on achieving high-quality reference genomes. Mol. Ecol. Resour. 2021, 21, 641–652. [Google Scholar] [CrossRef]
  28. Sims, D.; Sudbery, I.; Ilott, N.E.; Heger, A.; Ponting, C.P. Sequencing depth and coverage: Key considerations in genomic analyses. Nat. Rev. Genet. 2014, 15, 121–132. [Google Scholar] [CrossRef]
  29. Cai, G.; Li, H.; Lu, Y.; Huang, X.; Lee, J.; Müller, P.; Ji, Y.; Liang, S. Accuracy of RNA-Seq and its dependence on sequencing depth. BMC Bioinform. 2012, 13 (Suppl. S13), S5. [Google Scholar] [CrossRef]
  30. Daley, T.; Smith, A.D. Predicting the molecular complexity of sequencing libraries. Nat. Methods 2013, 10, 325–327. [Google Scholar] [CrossRef]
  31. Cai, G.; Liang, S.; Zheng, X.; Xiao, F. Local sequence and sequencing depth dependent accuracy of RNA-seq reads. BMC Bioinform. 2017, 18, 364. [Google Scholar] [CrossRef]
  32. Zhu, T.; Wang, L.; Rimbert, H.; Rodriguez, J.C.; Deal, K.R.; De Oliveira, R.; Choulet, F.; Keeble-Gagnère, G.; Tibbits, J.; Rogers, J.; et al. Optical maps refine the bread wheat Triticum aestivum cv. Chinese Spring genome assembly. Plant J. 2021, 107, 303–314. [Google Scholar] [CrossRef]
  33. Guo, W.; Xin, M.; Wang, Z.; Yao, Y.; Hu, Z.; Song, W.; Yu, K.; Chen, Y.; Wang, X.; Guan, P.; et al. Origin and adaptation to high altitude of Tibetan semi-wild wheat. Nat. Commun. 2020, 11, 5085. [Google Scholar] [CrossRef]
  34. Sato, K.; Abe, F.; Mascher, M.; Haberer, G.; Gundlach, H.; Spannagl, M.; Shirasawa, K.; Isobe, S. Chromosome-scale genome assembly of the transformation-amenable common wheat cultivar ‘Fielder’. DNA Res. 2021, 28, dsab008. [Google Scholar] [CrossRef] [PubMed]
  35. Athiyannan, N.; Abrouk, M.; Boshoff, W.H.P.; Cauet, S.; Rodde, N.; Kudrna, D.; Mohammed, N.; Bettgenhaeuser, J.; Botha, K.S.; Derman, S.S.; et al. Long-read genome sequencing of bread wheat facilitates disease resistance gene cloning. Nat. Genet. 2022, 54, 227–231. [Google Scholar] [CrossRef] [PubMed]
  36. Aury, J.-M.; Engelen, S.; Istace, B.; Monat, C.; Lasserre-Zuber, P.; Belser, C.; Cruaud, C.; Rimbert, H.; Leroy, P.; Arribat, S.; et al. Long-read and chromosome-scale assembly of the hexaploid wheat genome achieves high resolution for research and breeding. GigaScience 2022, 11, giac034. [Google Scholar] [CrossRef]
  37. Kale, S.M.; Schulthess, A.W.; Padmarasu, S.; Boeven, P.H.G.; Schacht, J.; Himmelbach, A.; Steuernagel, B.; Wulff, B.B.H.; Reif, J.C.; Stein, N.; et al. A catalogue of resistance gene homologs and a chromosome-scale reference sequence support resistance gene mapping in winter wheat. Plant Biotechnol. J. 2022, 20, 1730–1742. [Google Scholar] [CrossRef] [PubMed]
  38. Shi, X.; Cui, F.; Han, X.; He, Y.; Zhao, L.; Zhang, N.; Zhang, H.; Zhu, H.; Liu, Z.; Ma, B.; et al. Comparative genomic and transcriptomic analyses uncover the molecular basis of high nitrogen-use efficiency in the wheat cultivar Kenong 9204. Mol. Plant 2022, 15, 1440–1456. [Google Scholar] [CrossRef]
  39. Jia, J.; Zhao, G.; Li, D.; Wang, K.; Kong, C.; Deng, P.; Yan, X.; Zhang, X.; Lu, Z.; Xu, S.; et al. Genome resources for the elite bread wheat cultivar Aikang 58 and mining of elite homeologous haplotypes for accelerating wheat improvement. Mol. Plant 2023, 16, 1893–1910. [Google Scholar] [CrossRef]
  40. Liu, Z.; Yang, F.; Deng, C.; Wan, H.; Tang, H.; Feng, J.; Wang, Q.; Yang, N.; Li, J.; Yang, W. Chromosome-level assembly of the synthetic hexaploid wheat-derived cultivar Chuanmai 104. Sci. Data 2024, 11, 670. [Google Scholar] [CrossRef]
  41. Cavalet-Giorsa, E.; González-Muñoz, A.; Athiyannan, N.; Holden, S.; Salhi, A.; Gardener, C.; Quiroz-Chávez, J.; Rustamova, S.M.; Elkot, A.F.; Patpour, M.; et al. Origin and evolution of the bread wheat D genome. Nature 2024, 633, 848–855. [Google Scholar] [CrossRef]
  42. Jiao, C.; Xie, X.; Hao, C.; Chen, L.; Xie, Y.; Garg, V.; Zhao, L.; Wang, Z.; Zhang, Y.; Li, T.; et al. Pan-genome bridges wheat structural variations with habitat and breeding. Nature 2024, 637, 384–393. [Google Scholar] [CrossRef]
  43. Zhu, T.; Wang, L.; Rodriguez, J.C.; Deal, K.R.; Avni, R.; Distelfeld, A.; McGuire, P.E.; Dvorak, J.; Luo, M.-C. Improved genome sequence of wild emmer wheat Zavitan with the aid of optical maps. G3 Genes|Genomes|Genet. 2019, 9, 619–624. [Google Scholar] [CrossRef]
  44. Rabanus-Wallace, M.T.; Hackauf, B.; Mascher, M.; Lux, T.; Wicker, T.; Gundlach, H.; Baez, M.; Houben, A.; Mayer, K.F.X.; Guo, L.; et al. Chromosome-scale genome assembly provides insights into rye biology, evolution and agronomic potential. Nat. Genet. 2021, 53, 564–573. [Google Scholar] [CrossRef] [PubMed]
  45. Mahmood, K.; Orabi, J.; Kristensen, P.S.; Sarup, P.; Jørgensen, L.N.; Jahoor, A. De novo transcriptome assembly, functional annotation, and expression profiling of rye (Secale cereale L.) hybrids inoculated with ergot (Claviceps purpurea). Sci. Rep. 2020, 10, 13475. [Google Scholar] [CrossRef]
  46. Abbas, Q.; Wilhelm, M.; Kuster, B.; Poppenberger, B.; Frishman, D. Exploring crop genomes: Assembly features, gene prediction accuracy, and implications for proteomics studies. BMC Genom. 2024, 25, 619. [Google Scholar] [CrossRef]
  47. Jauhal, A.A.; Newcomb, R.D. Assessing genome assembly quality prior to downstream analysis: N50 versus BUSCO. Mol. Ecol. Resour. 2021, 21, 1416–1421. [Google Scholar] [CrossRef]
  48. Kim, D.; Paggi, J.M.; Park, C.; Bennett, C.; Salzberg, S.L. Graph-based genome alignment and genotyping with HISAT2 and HISAT-genotype. Nat. Biotechnol. 2019, 37, 907–915. [Google Scholar] [CrossRef]
  49. Keilwagen, J.; Lehnert, H.; Berner, T.; Badaeva, E.; Himmelbach, A.; Börner, A.; Kilian, B. Detecting major introgressions in wheat and their putative origins using coverage analysis. Sci. Rep. 2022, 12, 1908. [Google Scholar] [CrossRef]
  50. Wang, X.; Li, H.; Shen, T.; Wang, X.; Yi, S.; Meng, T.; Sun, J.; Wang, X.; Qu, X.; Chen, S.; et al. A near-complete genome sequence of einkorn wheat provides insight into the evolution of wheat A subgenomes. Plant Commun. 2024, 5, 100768. [Google Scholar] [CrossRef] [PubMed]
  51. Rabanus-Wallace, M.T.; Wang, D.; Yang, J.; Li, G.; Stein, N. Assembling the rye genome. In The Rye Genome; Rabanus-Wallace, M.T., Stein, N., Eds.; Springer International Publishing: Cham, Switzerland, 2021; pp. 101–116. [Google Scholar]
  52. Martis, M.M.; Zhou, R.; Haseneyer, G.; Schmutzer, T.; Vrána, J.; Kubaláková, M.; König, S.; Kugler, K.G.; Scholz, U.; Hackauf, B.; et al. Reticulate evolution of the rye genome. Plant Cell 2013, 25, 3685–3698. [Google Scholar] [CrossRef]
  53. Kwiatek, M.T.; Nawracała, J. Chromosome manipulations for progress of triticale (×Triticosecale) breeding. Plant Breed. 2018, 137, 823–831. [Google Scholar] [CrossRef]
  54. Polkhovskaya, E.; Bolotina, A.; Merkulov, P.; Dudnikov, M.; Soloviev, A.; Kirov, I. Long-read cDNA sequencing revealed novel expressed genes and dynamic transcriptome landscape of triticale (x Triticosecale Wittmack) seed at different developing stages. Agronomy 2023, 13, 292. [Google Scholar] [CrossRef]
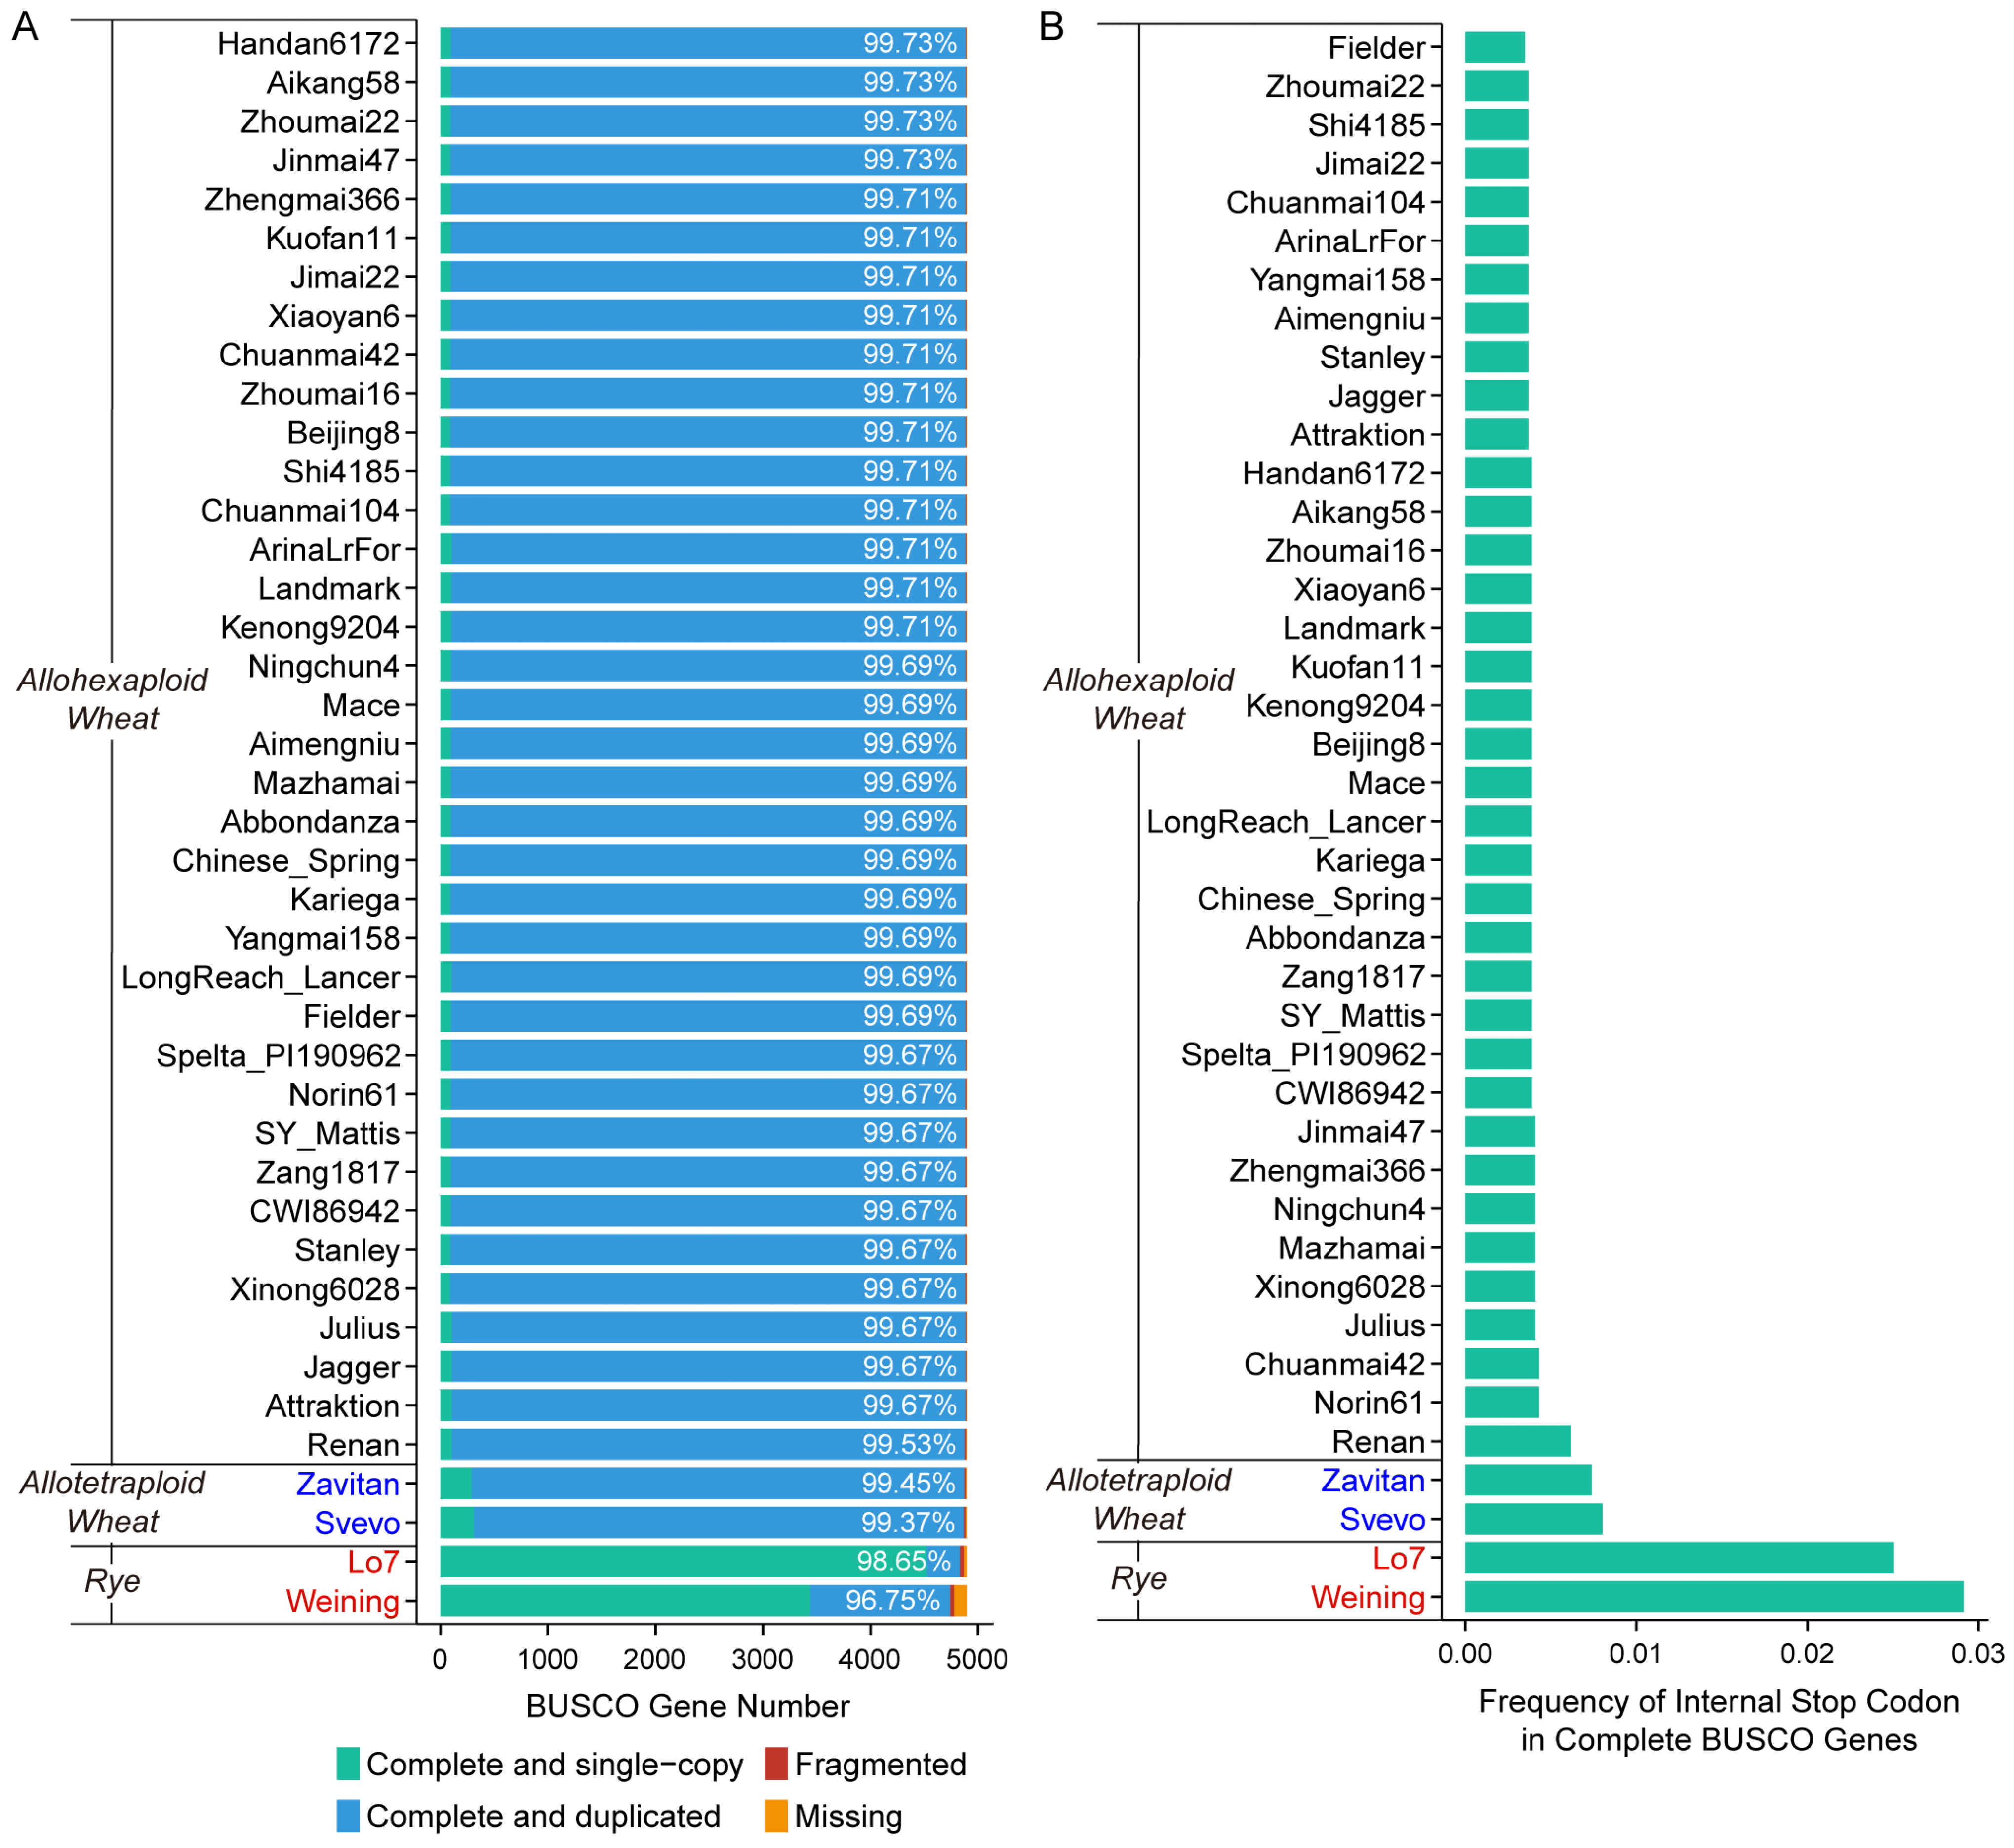
Figure 1. BUSCO analysis of wheat, rye, and triticale assemblies. (A) Distribution of different categories of BUSCO genes. The percentages of complete BUSCO genes (both single-copy and duplicated complete genes) for each line were marked on corresponding bars. (B) Frequency of internal stop codon inside the total complete BUSCO genes.
Plants 14 01140 g001
Figure 2. Covered length distribution of RNA-seq reads derived from different wheat varieties mapped to different wheat genome references. Scaled covered lengths are displayed via heatmap on the left and corresponding boxplot (statistics based on each reference) on the right. Original covered lengths are scaled according to each query wheat line and ranked in descending order (e.g., F_BHU_35 received the highest and lowest covered length when mapped to Aimengniu and Renan, respectively). The references are sorted according to the average scaled covered length of all varieties.
Plants 14 01140 g002
Figure 3. Total depth distribution of RNA-seq reads derived from different wheat varieties mapped to different wheat genome references. Scaled total depths are displayed via heatmap on the left and corresponding boxplot (statistics based on each reference) on the right. Original total depths are scaled according to each query wheat line and ranked in descending order (e.g., F_BHU_35 received the highest and lowest total depth when mapped to SY_Mattis and Renan, respectively). The references are sorted according to the average scaled total depth of all varieties.
Plants 14 01140 g003
Figure 4. Correlation analysis between reference assembly information and wheat RNA-seq read mapping statistics. The lower triangular matrix is composed of the bivariate scatter plots with a fitted smooth line. The upper triangular matrix shows the values and heatmap of Pearson correlation. The colors of the heatmap were assigned according to the correlation coefficient, as indicated by the color scale. The diagonal plots represent histogram distributions for each measurement. The average values of alignment rate, covered length and total depth obtained for each reference over different query wheat lines were employed in correlation analysis. Genome statistics of ‘Attraktion’ were excluded from correlation analysis due to lack of annotation data.
Plants 14 01140 g004
Figure 5. Distribution of alignment rate, covered length, and total depth of RNA-seq reads derived from different rye varieties mapped to different rye genome references. (A) Alignment rate. (B) Covered length. (C) Total depth. Scaled statistics are displayed via heatmap on the left and corresponding boxplot (statistics based on each reference) on the right. Original statistics are scaled according to each query rye line and ranked in descending order (e.g., Beira received the higher covered length when mapped to Weining but higher total depth when mapped to Lo7). The references are sorted according to the average scaled total statistics.
Plants 14 01140 g005
Figure 6. Covered length distribution of RNA-seq reads derived from different triticale varieties mapped to different simulated triticale genome references. Scaled covered lengths are displayed via heatmap on the left and corresponding boxplot (statistics based on each reference) on the right. Original covered lengths were scaled according to each query triticale line and ranked in descending order (e.g., AC Alta received the highest and lowest covered length when mapped to Shi4185 + Weining and Zavitan + Lo7, respectively). The references are sorted according to the average scaled covered length of all varieties.
Plants 14 01140 g006
Figure 7. Total depth distribution of RNA-seq reads derived from different triticale varieties mapped to different simulated triticale genome references. Scaled total depths are displayed via heatmap on the left and corresponding boxplot (statistics based on each reference) on the right. Original total depths are scaled according to each query triticale line and ranked in descending order (e.g., AC Alta received the highest and lowest total depth when mapped to Svevo + Lo7 and Renan + Weining, respectively). The references are sorted according to the average scaled total depth of all varieties.
Plants 14 01140 g007
Figure 8. Chromosome-wise coverage distribution of RNA-seq reads derived from different triticale varieties mapped to genome reference of combined SY Mattis plus Lo7. Reads mapped to unassigned chromosomes are not displayed.
Plants 14 01140 g008
Figure 9. Read depth profile of RNA-seq reads derived from AC Alta mapped to genome reference of combined SY Mattis plus Lo7. Note the read depth distribution on chromosomes 6A and 6D. To ensure the y axis values were positive, average depths were increased by 1 before logarithmic transformation.
Plants 14 01140 g009
Disclaimer/Publisher’s Note: The statements, opinions and data contained in all publications are solely those of the individual author(s) and contributor(s) and not of MDPI and/or the editor(s). MDPI and/or the editor(s) disclaim responsibility for any injury to people or property resulting from any ideas, methods, instructions or products referred to in the content.