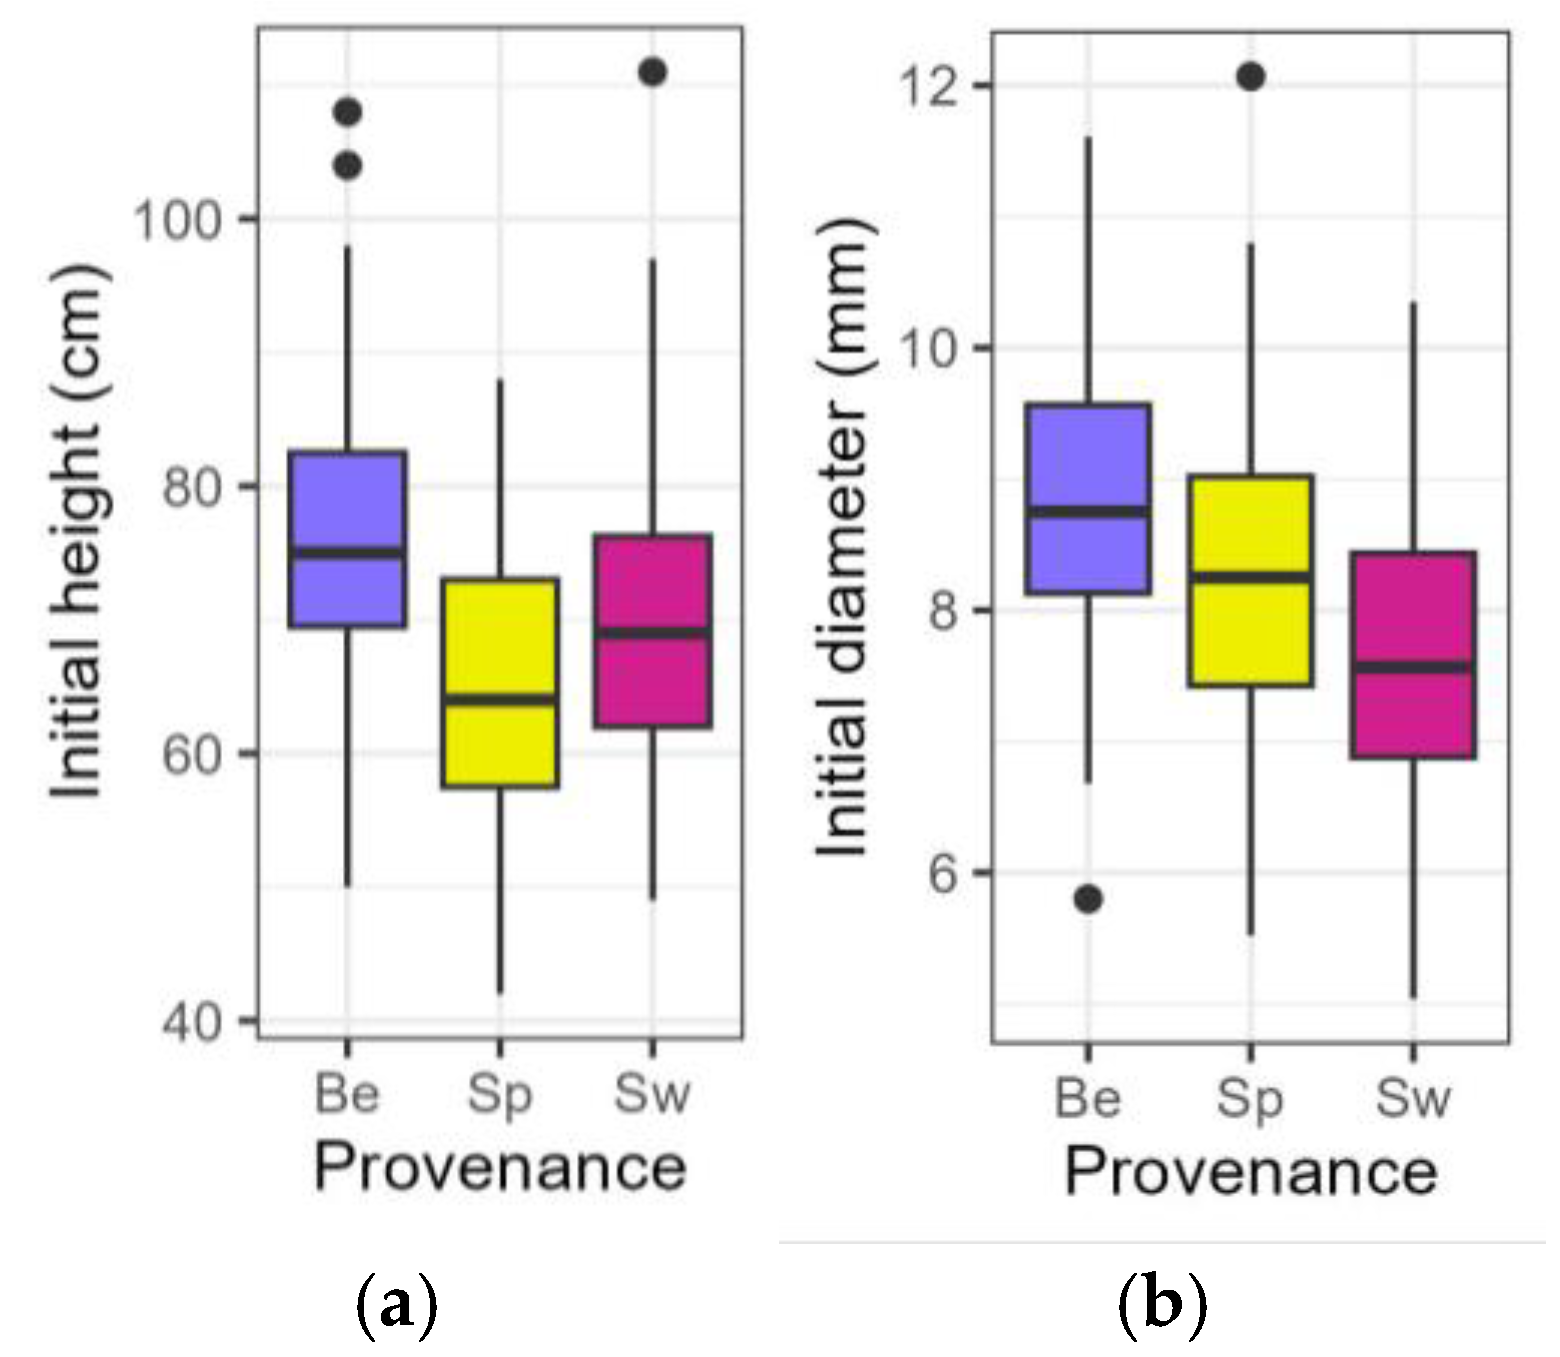
Figure 1.
Boxplots presenting the initial height (a) and diameter (b) of the saplings at the start of the treatment. Be: Belgian, Sp: Spanish-Pyrenean, Sw: Swedish.
Figure 1.
Boxplots presenting the initial height (a) and diameter (b) of the saplings at the start of the treatment. Be: Belgian, Sp: Spanish-Pyrenean, Sw: Swedish.
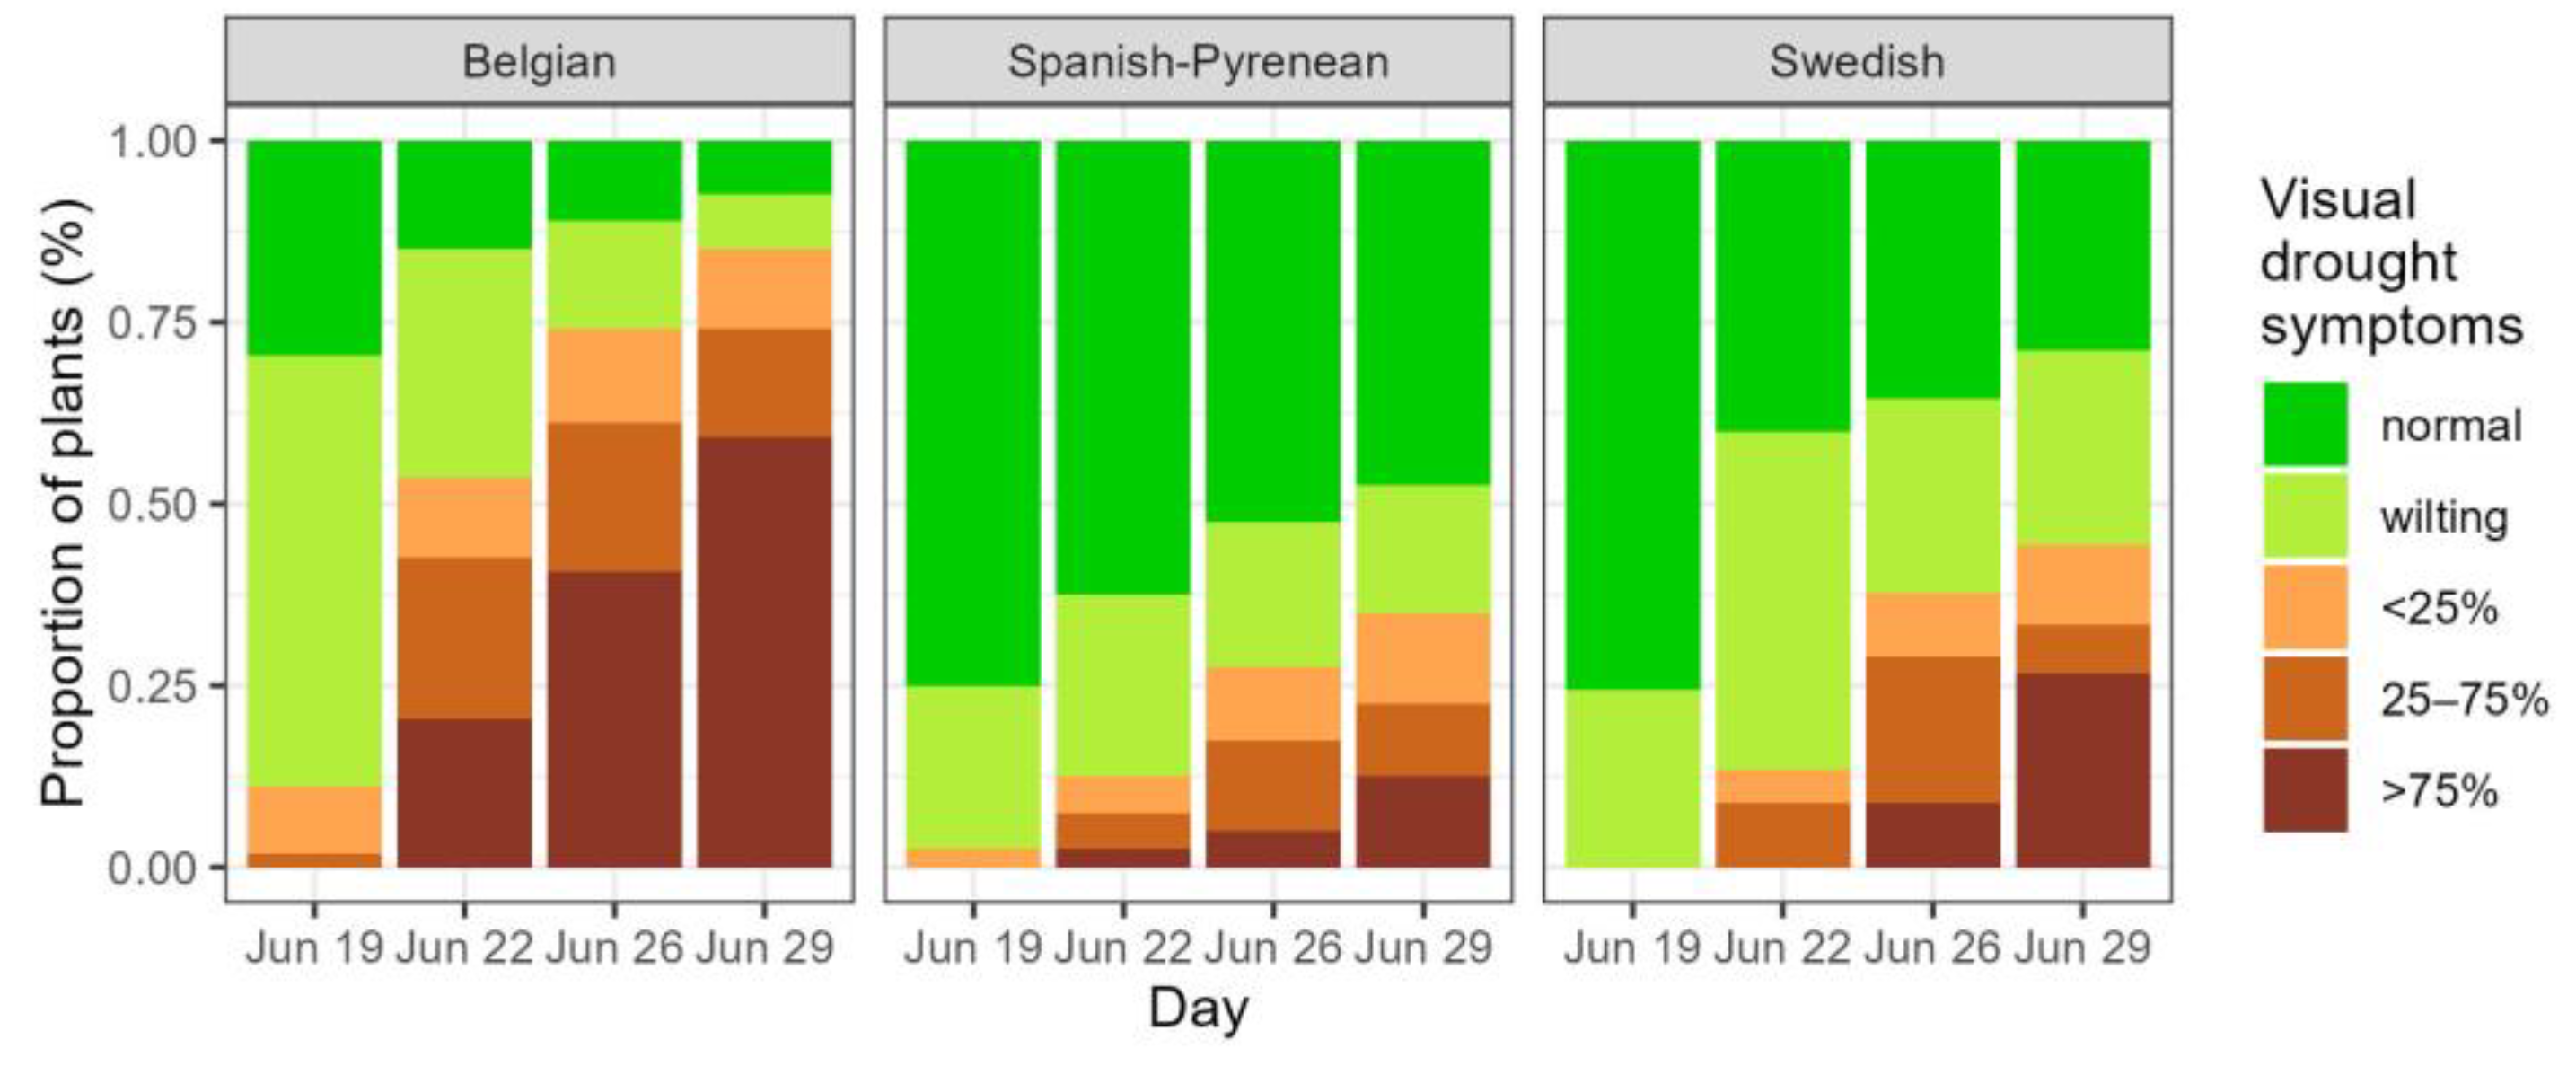
Figure 2.
Development of visual drought symptoms during the drought period in the three provenances, with p values for the fixed effects in the mixed model. Normal: no visual drought symptoms; wilting: leaf wilting, <25%, 25–75% and >75% of desiccated leaves.
Figure 2.
Development of visual drought symptoms during the drought period in the three provenances, with p values for the fixed effects in the mixed model. Normal: no visual drought symptoms; wilting: leaf wilting, <25%, 25–75% and >75% of desiccated leaves.
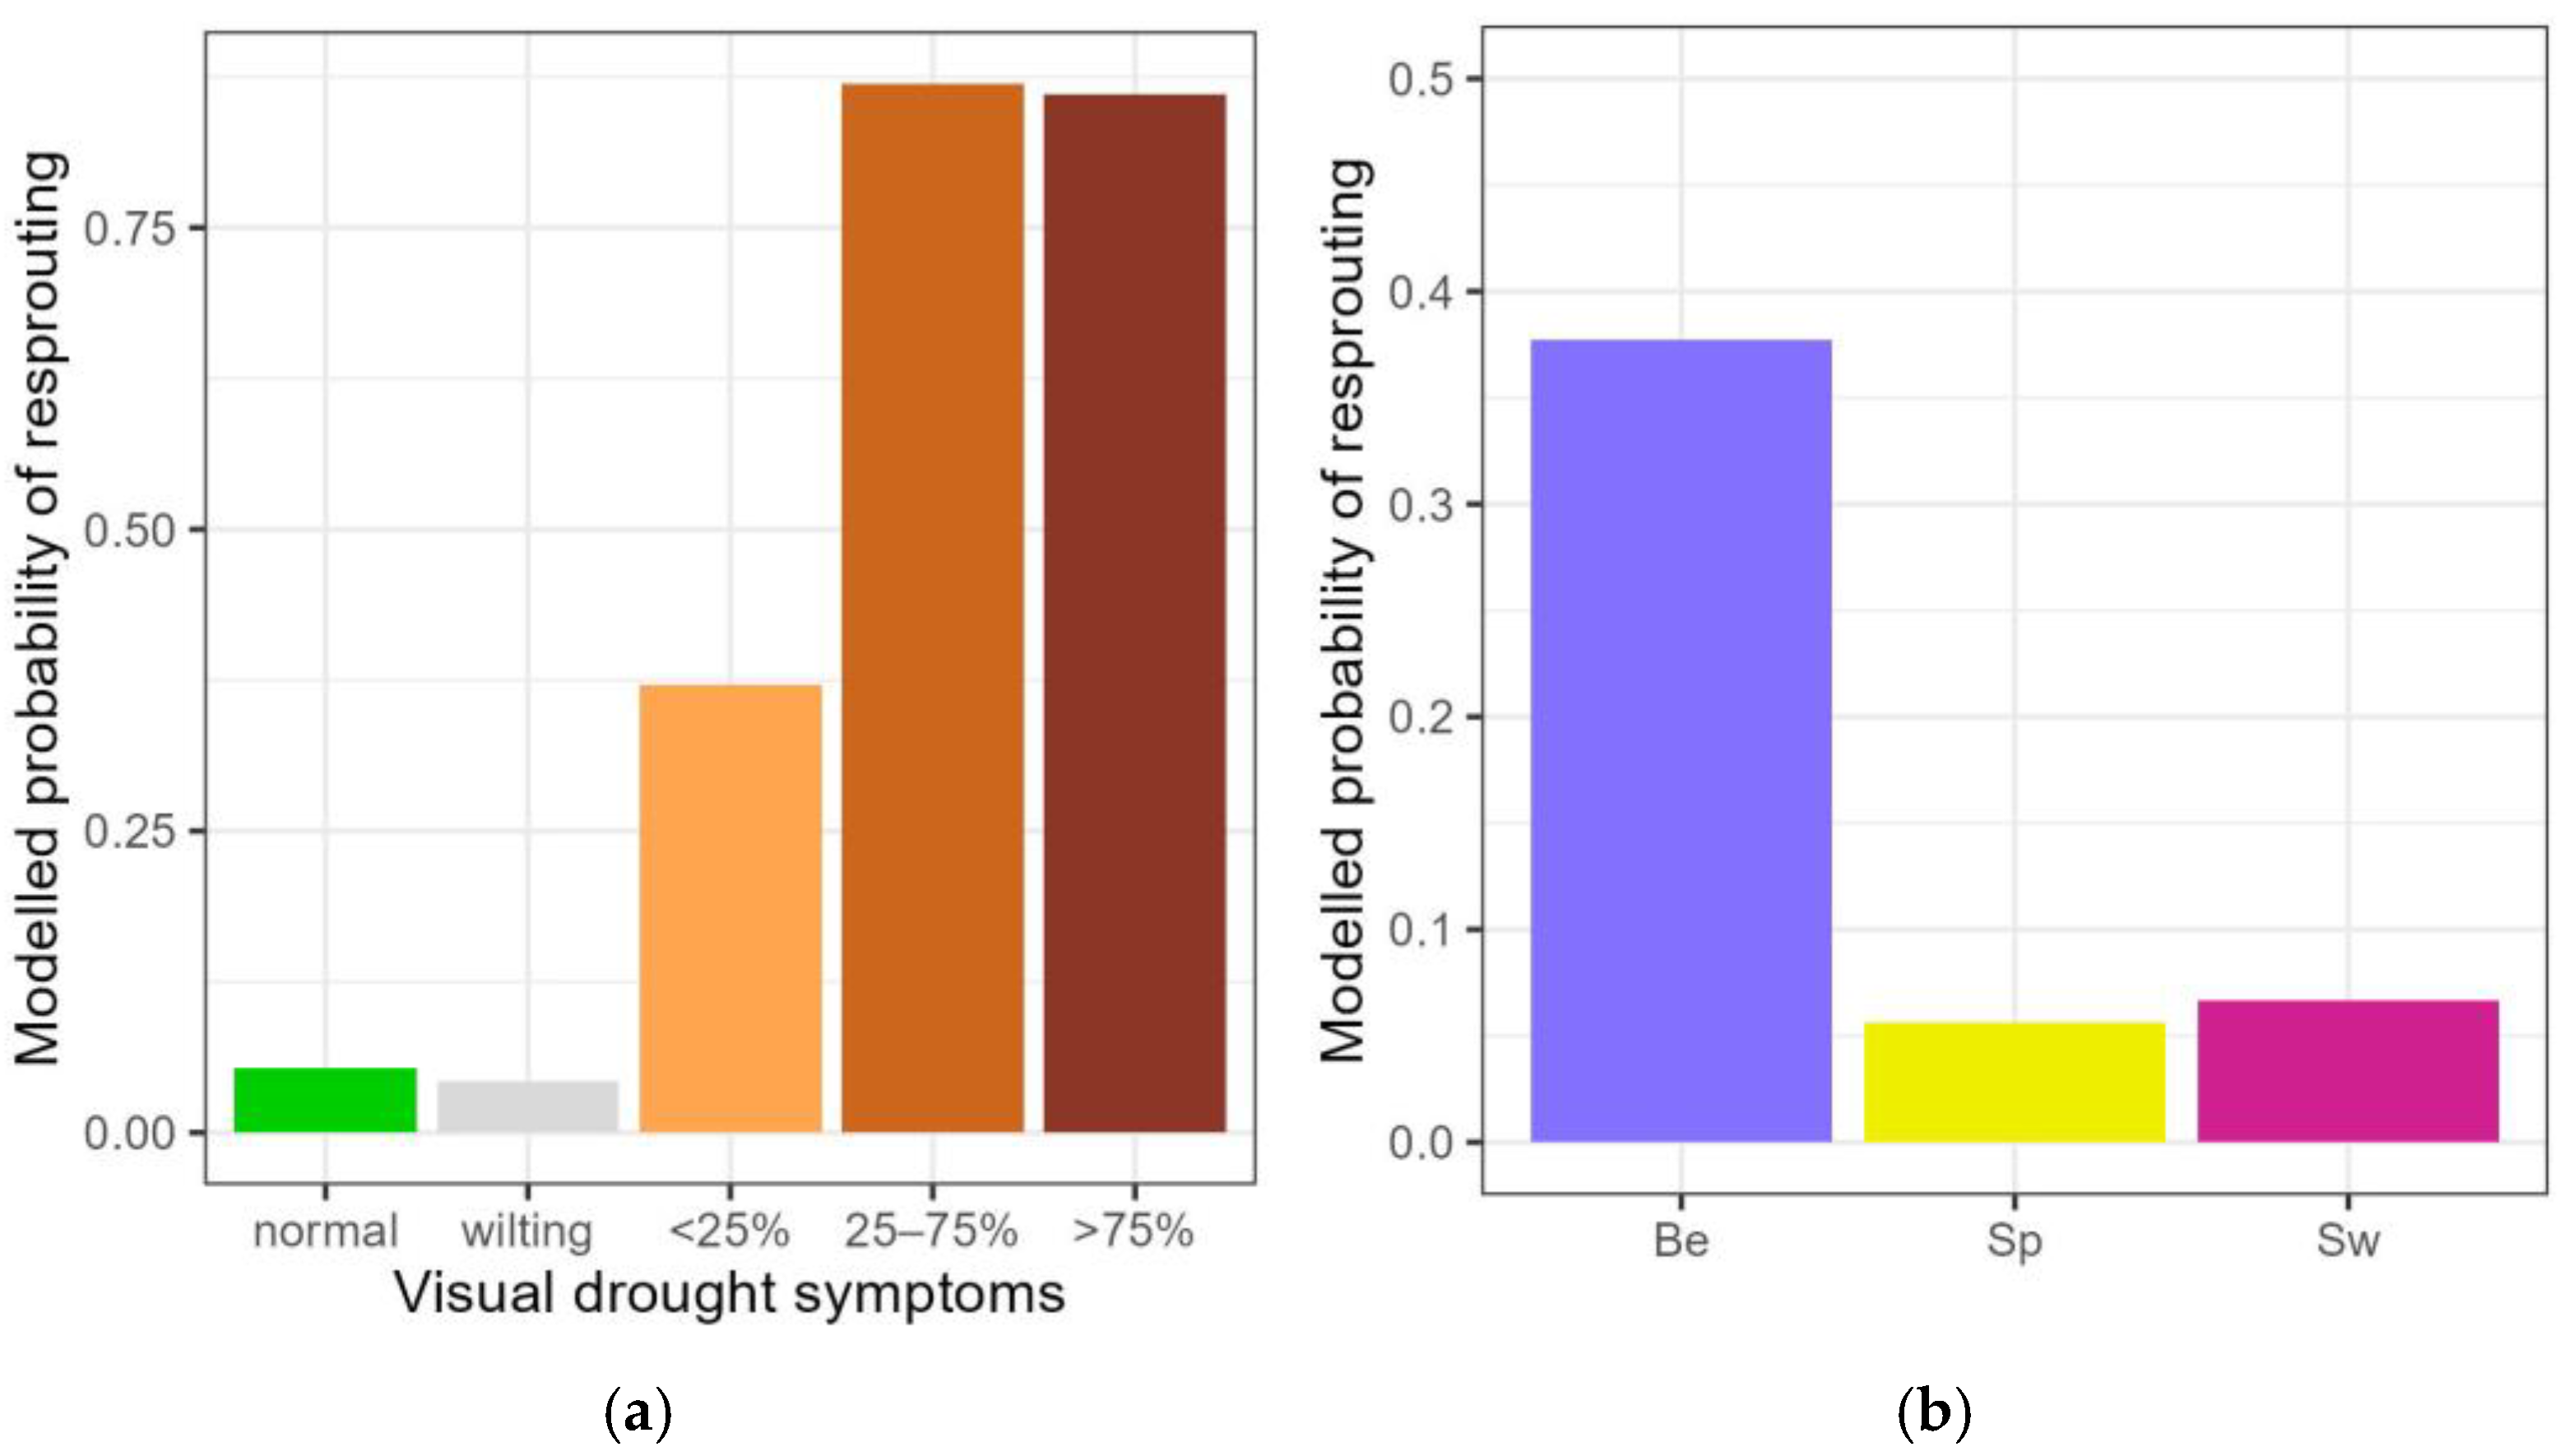
Figure 3.
Modelled probability of post-drought resprouting among the different categories of visual drought symptoms (a) and among the three provenances for the pooled visual drought categories normal, wilting leaves and <25% desiccated leaves (b). Normal: no visual drought symptoms; wilting: leaf wilting, <25%, 25–75% and >75% of desiccated leaves. Be: Belgian, Sp: Spanish-Pyrenean, Sw: Swedish. Categories not significantly differing from the standard (normal) are displayed in grey.
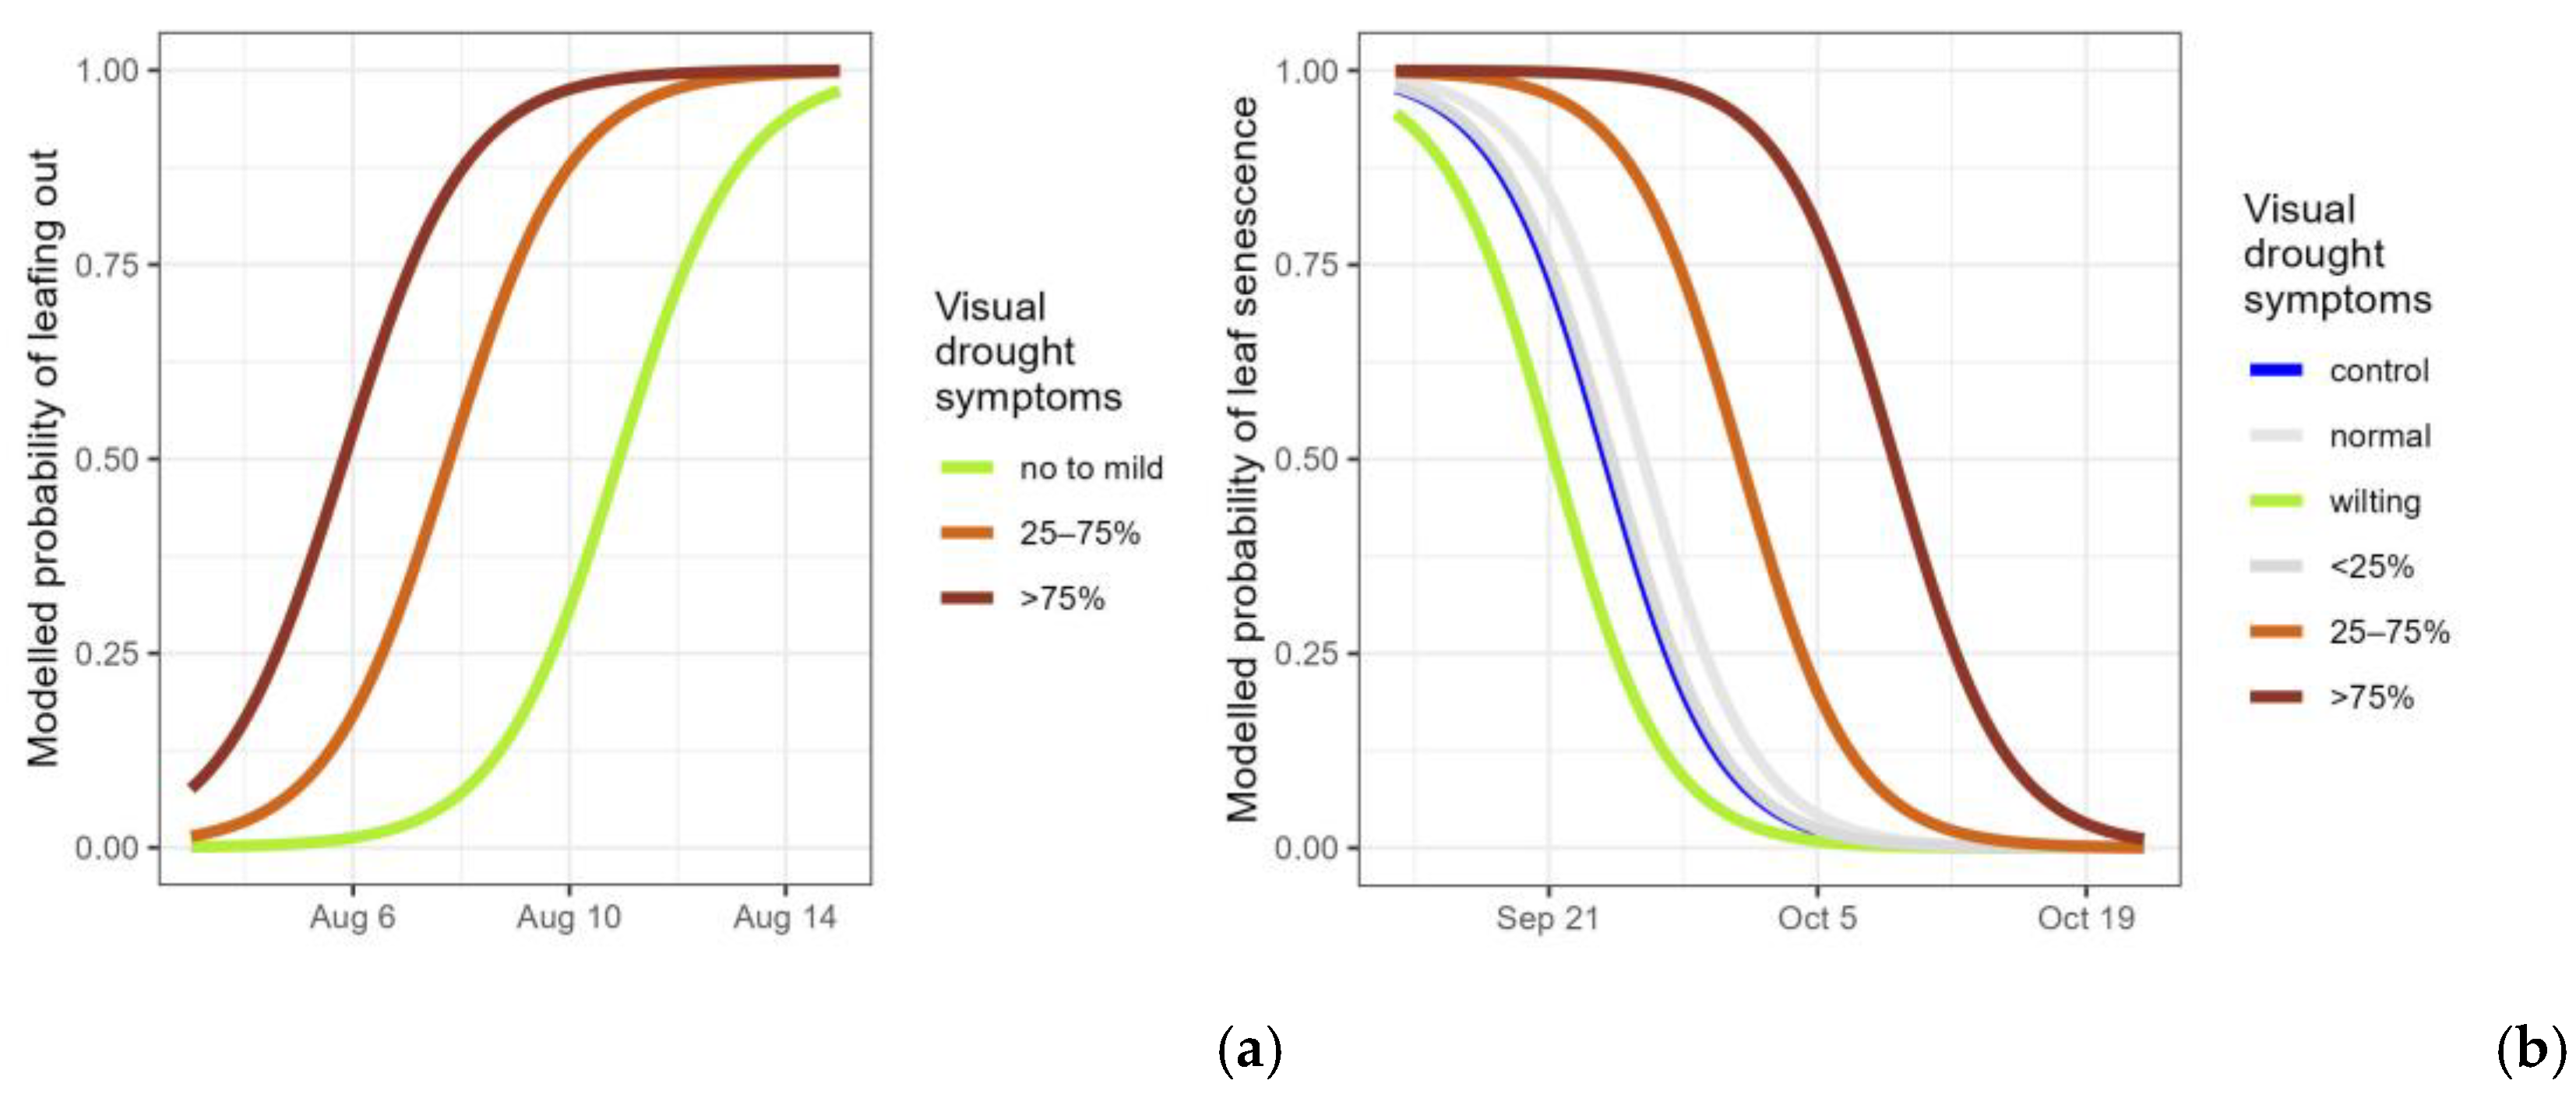
Figure 4.
Modelled probability of the timing of resprouting among the resprouting saplings (having new leaves emerging but not yet protruding from the bud) (a) and modelled probability of the timing of leaf senescence for all controls and droughted plants (still having green leaves) (b), according to the visual drought symptom categories. For the resprouting (a), no to mild: pooling of no visual drought symptoms, wilting leaves and <25% of desiccated leaves; 25–75% and >75% of desiccated leaves. For leaf senescence (b), normal: no visual drought symptoms; wilting: leaf wilting, <25%, 25–75% and >75% of desiccated leaves. Categories not significantly differing from the standard (control) are displayed in grey.
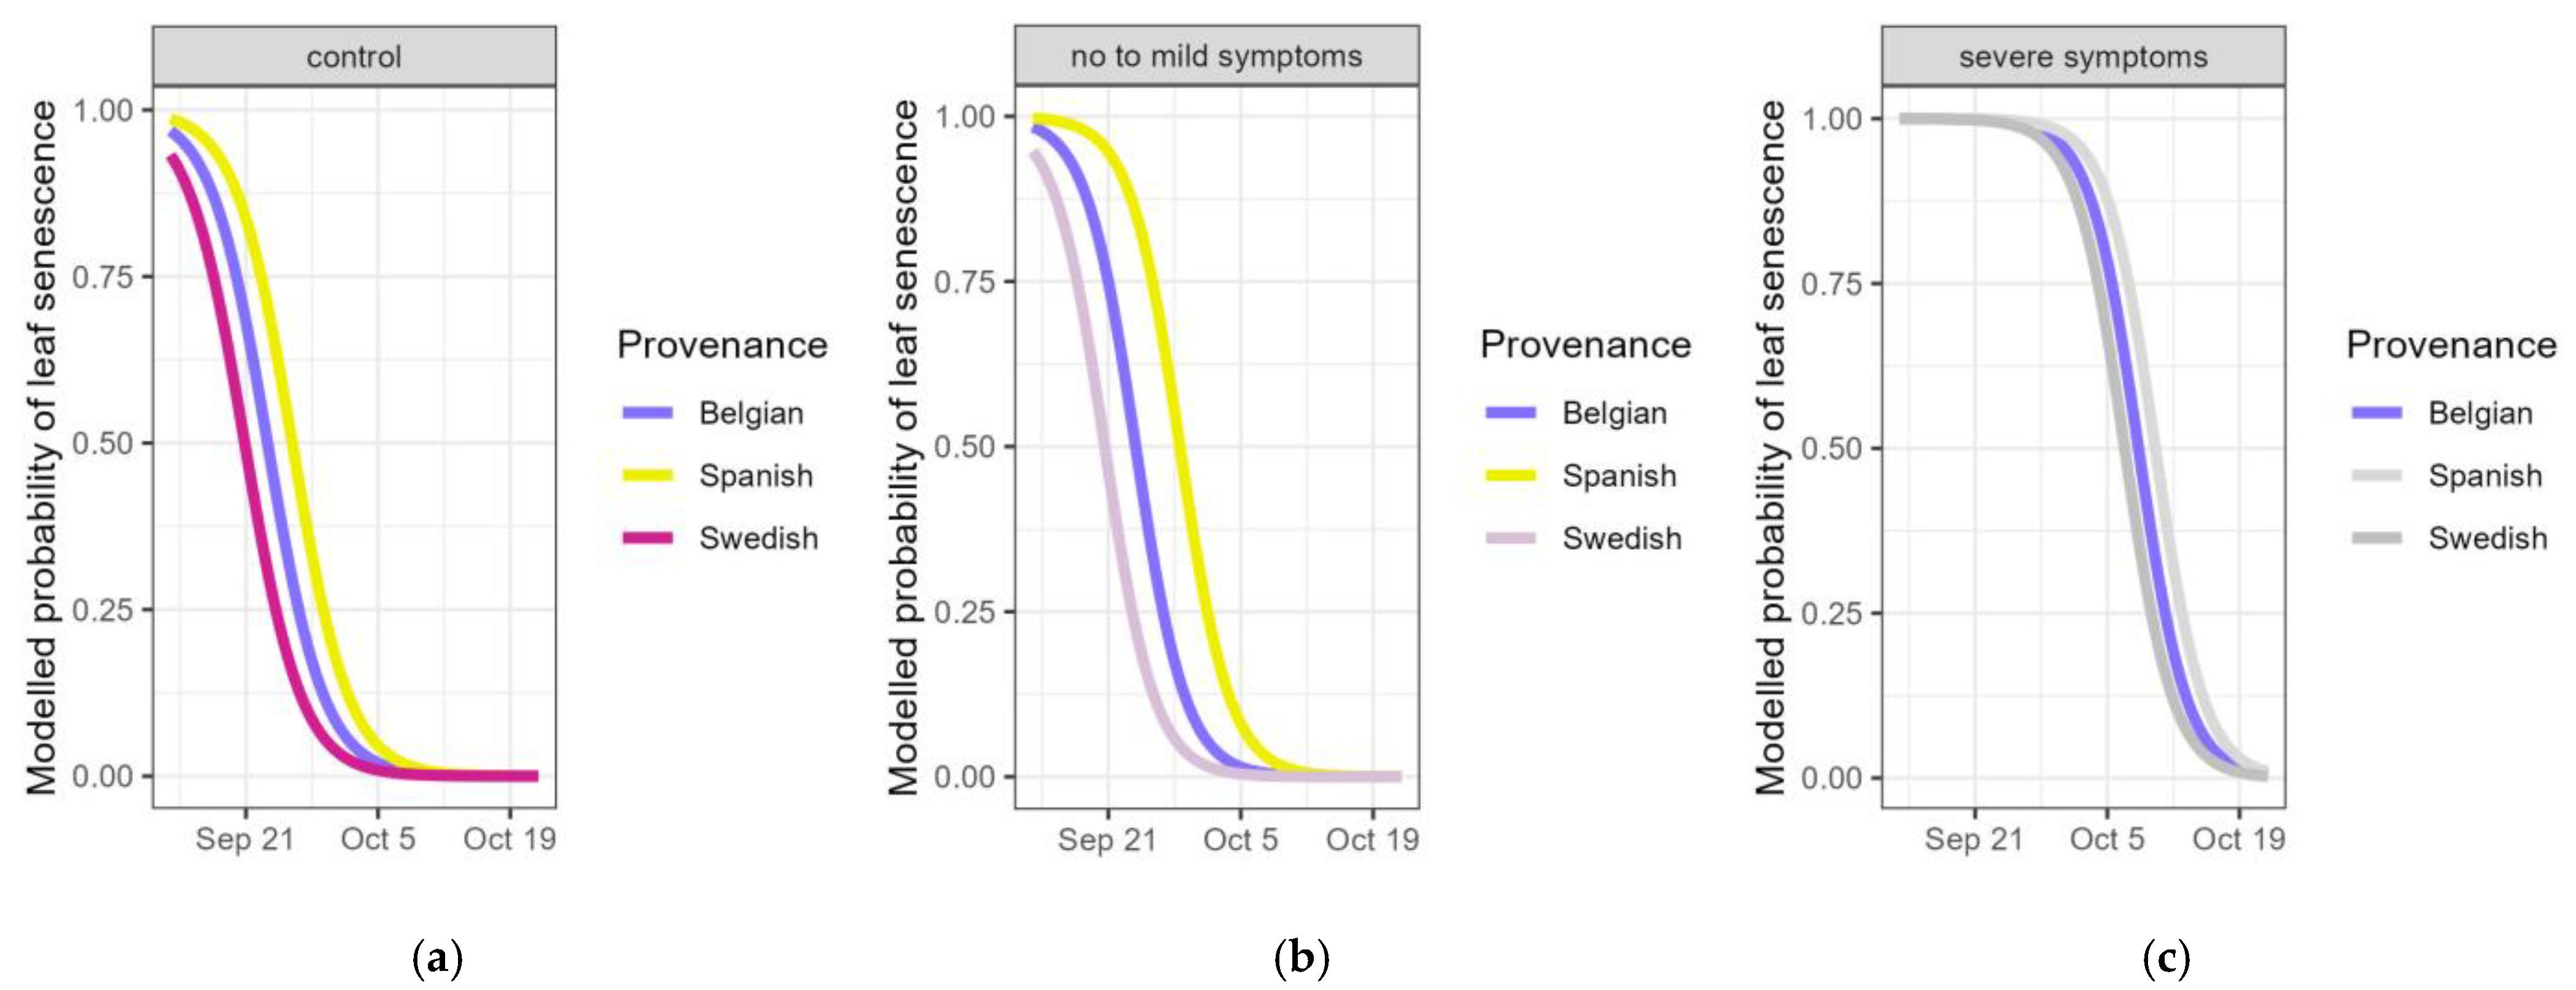
Figure 5.
Modelled probability of the timing of leaf senescence (still having green leaves) according to the provenance for controls (a), pooled categories of visual drought symptoms normal, wilting and <25% desiccated leaves (b) and pooled categories of visual drought symptoms 25–75% and >75% desiccated leaves (c). Provenances not significantly differing from the standard (Belgian) are displayed in grey.
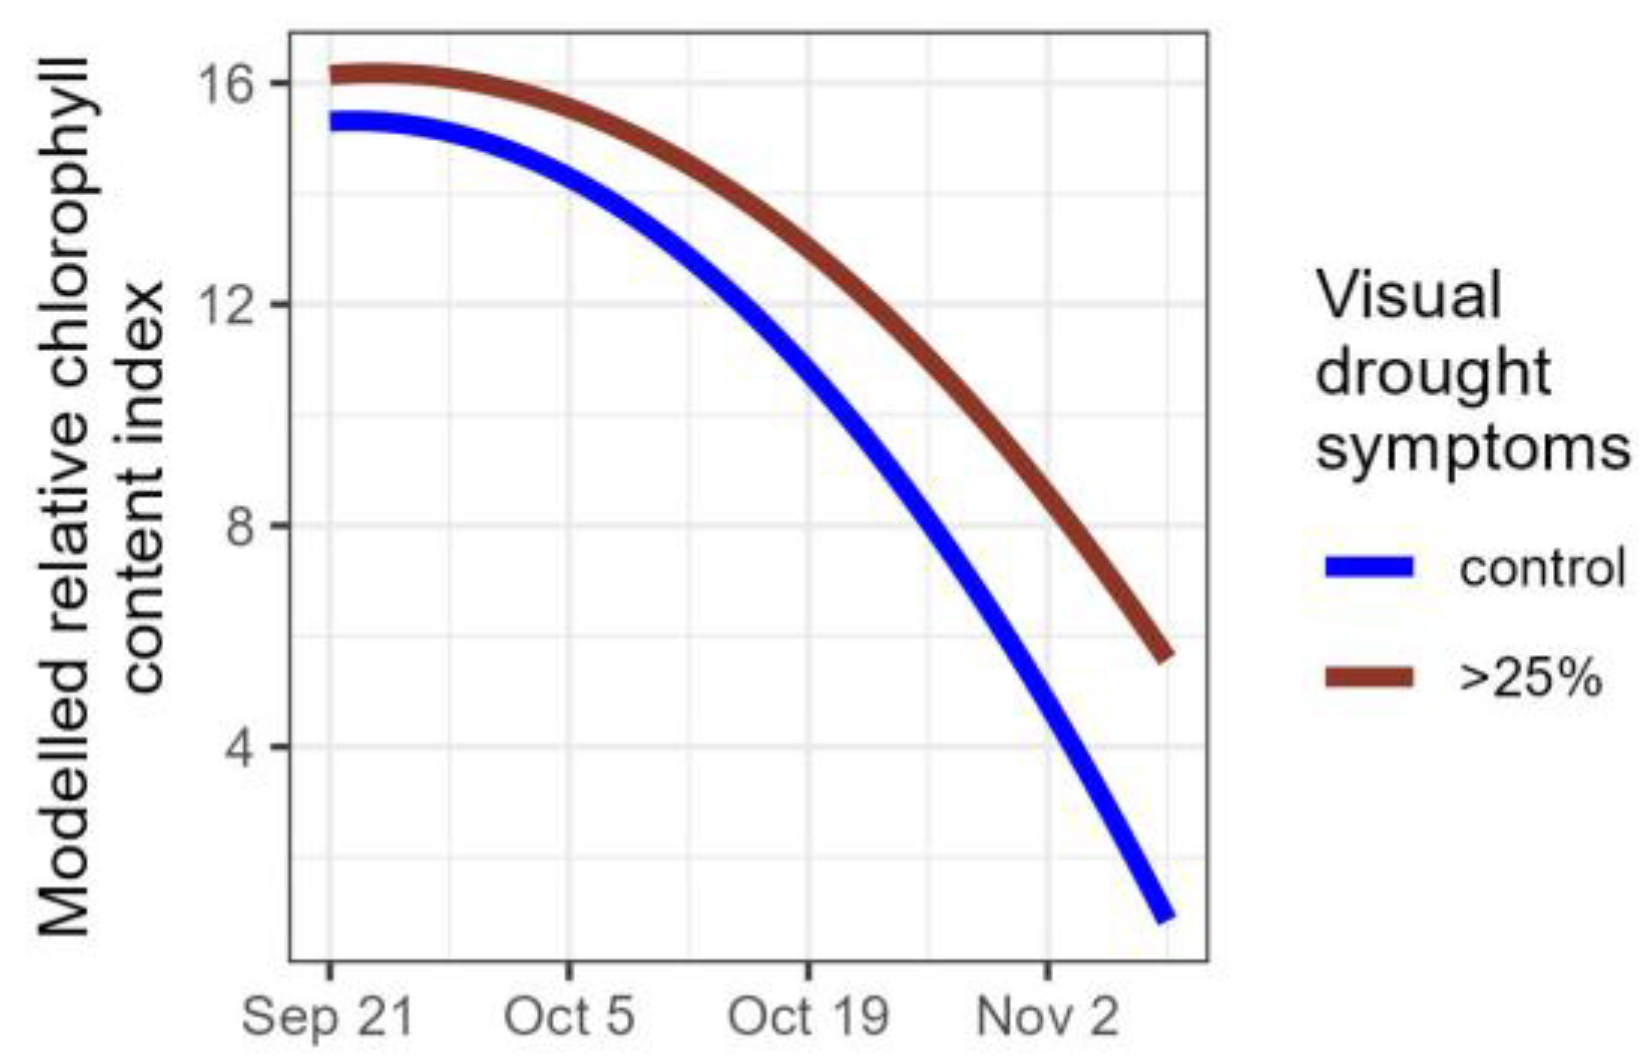
Figure 6.
Modelled relative chlorophyll content index for control plants (n = 27) and for plants severely affected by the drought, i.e., that lost more than a quarter of their foliage (n = 27).
Figure 6.
Modelled relative chlorophyll content index for control plants (n = 27) and for plants severely affected by the drought, i.e., that lost more than a quarter of their foliage (n = 27).
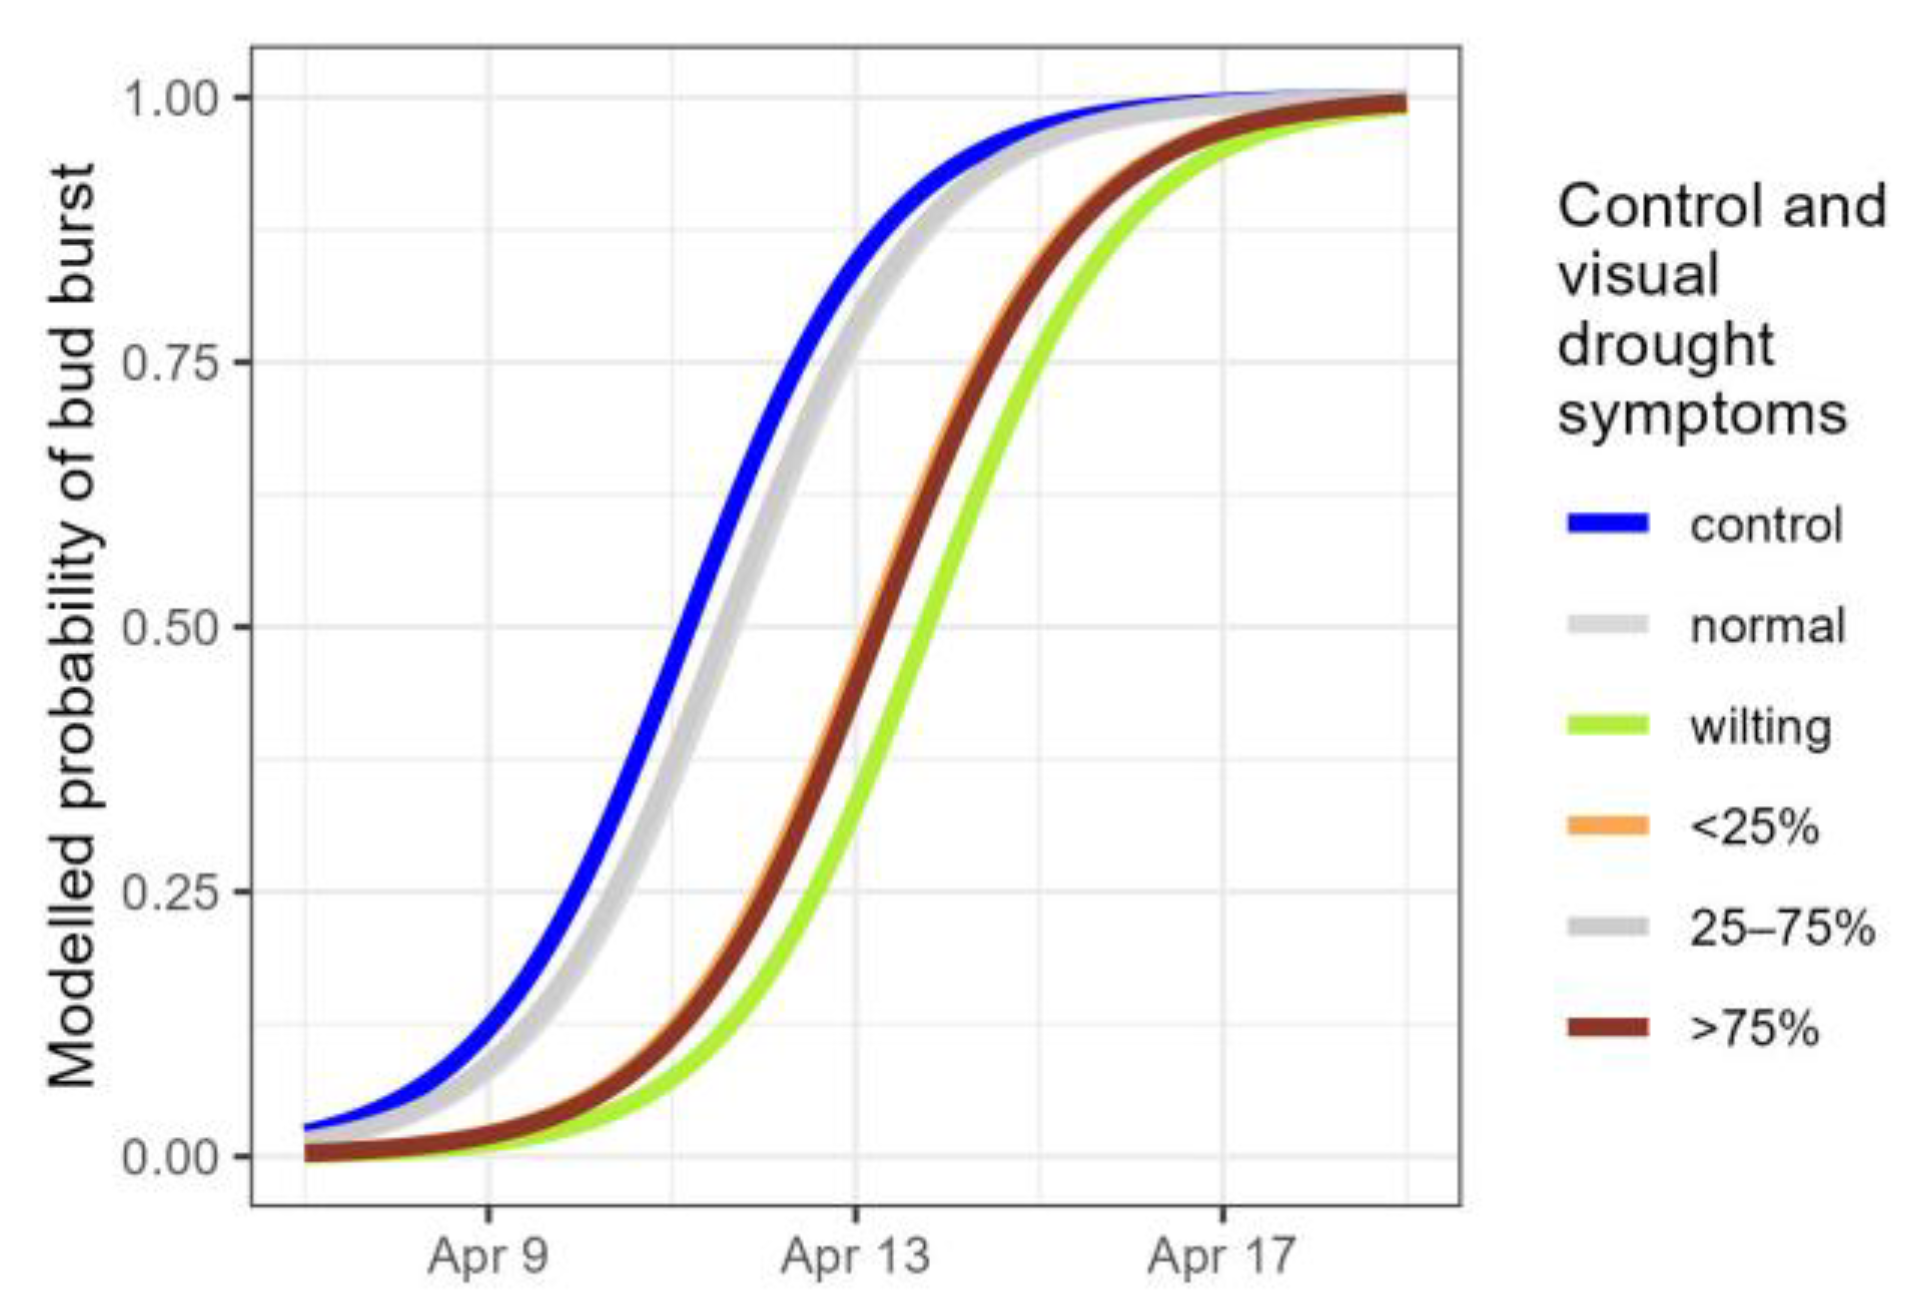
Figure 7.
Modelled probability of the timing of bud burst for controls and droughted plants, according to the visual drought symptom categories. Normal: no visual drought symptoms; wilting: leaf wilting, <25%, 25–75% and >75% of desiccated leaves. Categories not significantly differing from the standard (control) are displayed in grey.
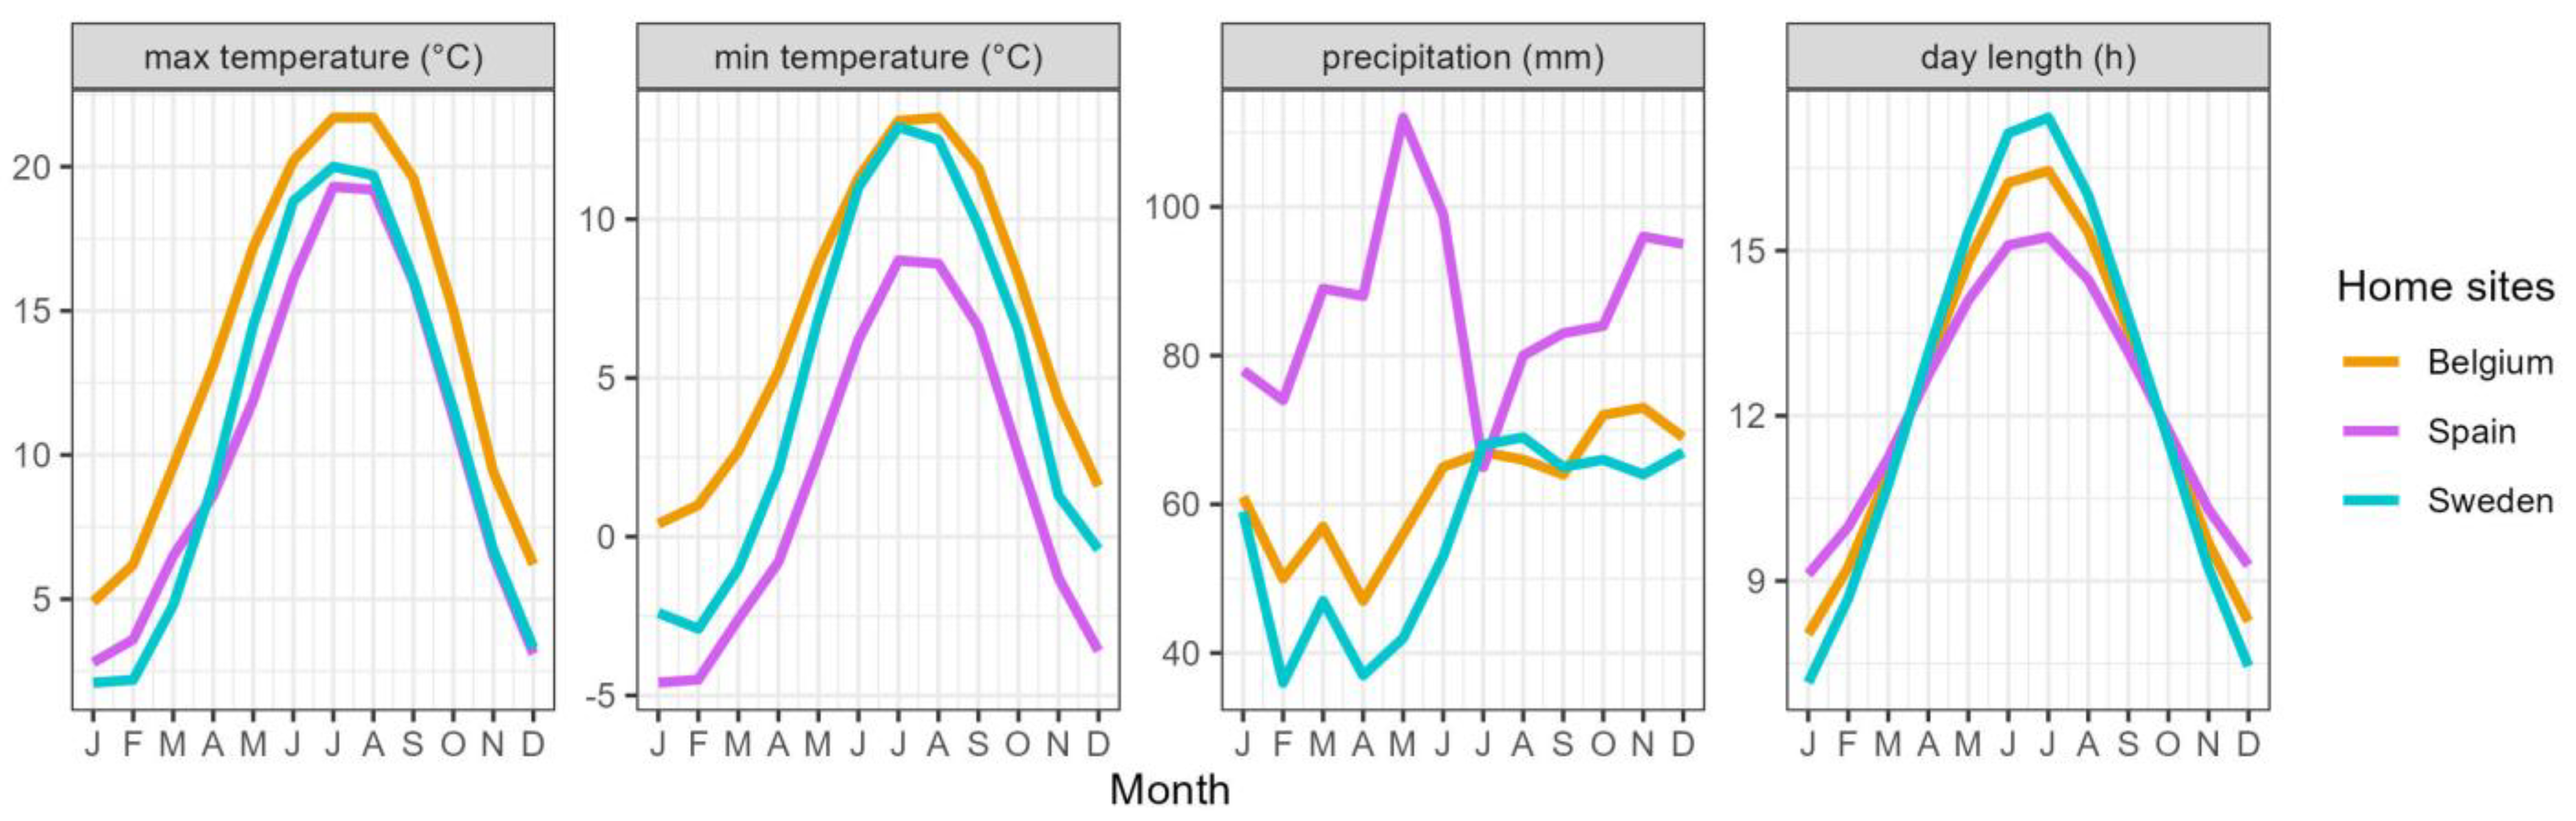
Figure 8.
Mean monthly maximum and minimum temperature, mean monthly precipitation and day length at the origin of the provenances of P. spinosa.
Figure 8.
Mean monthly maximum and minimum temperature, mean monthly precipitation and day length at the origin of the provenances of P. spinosa.
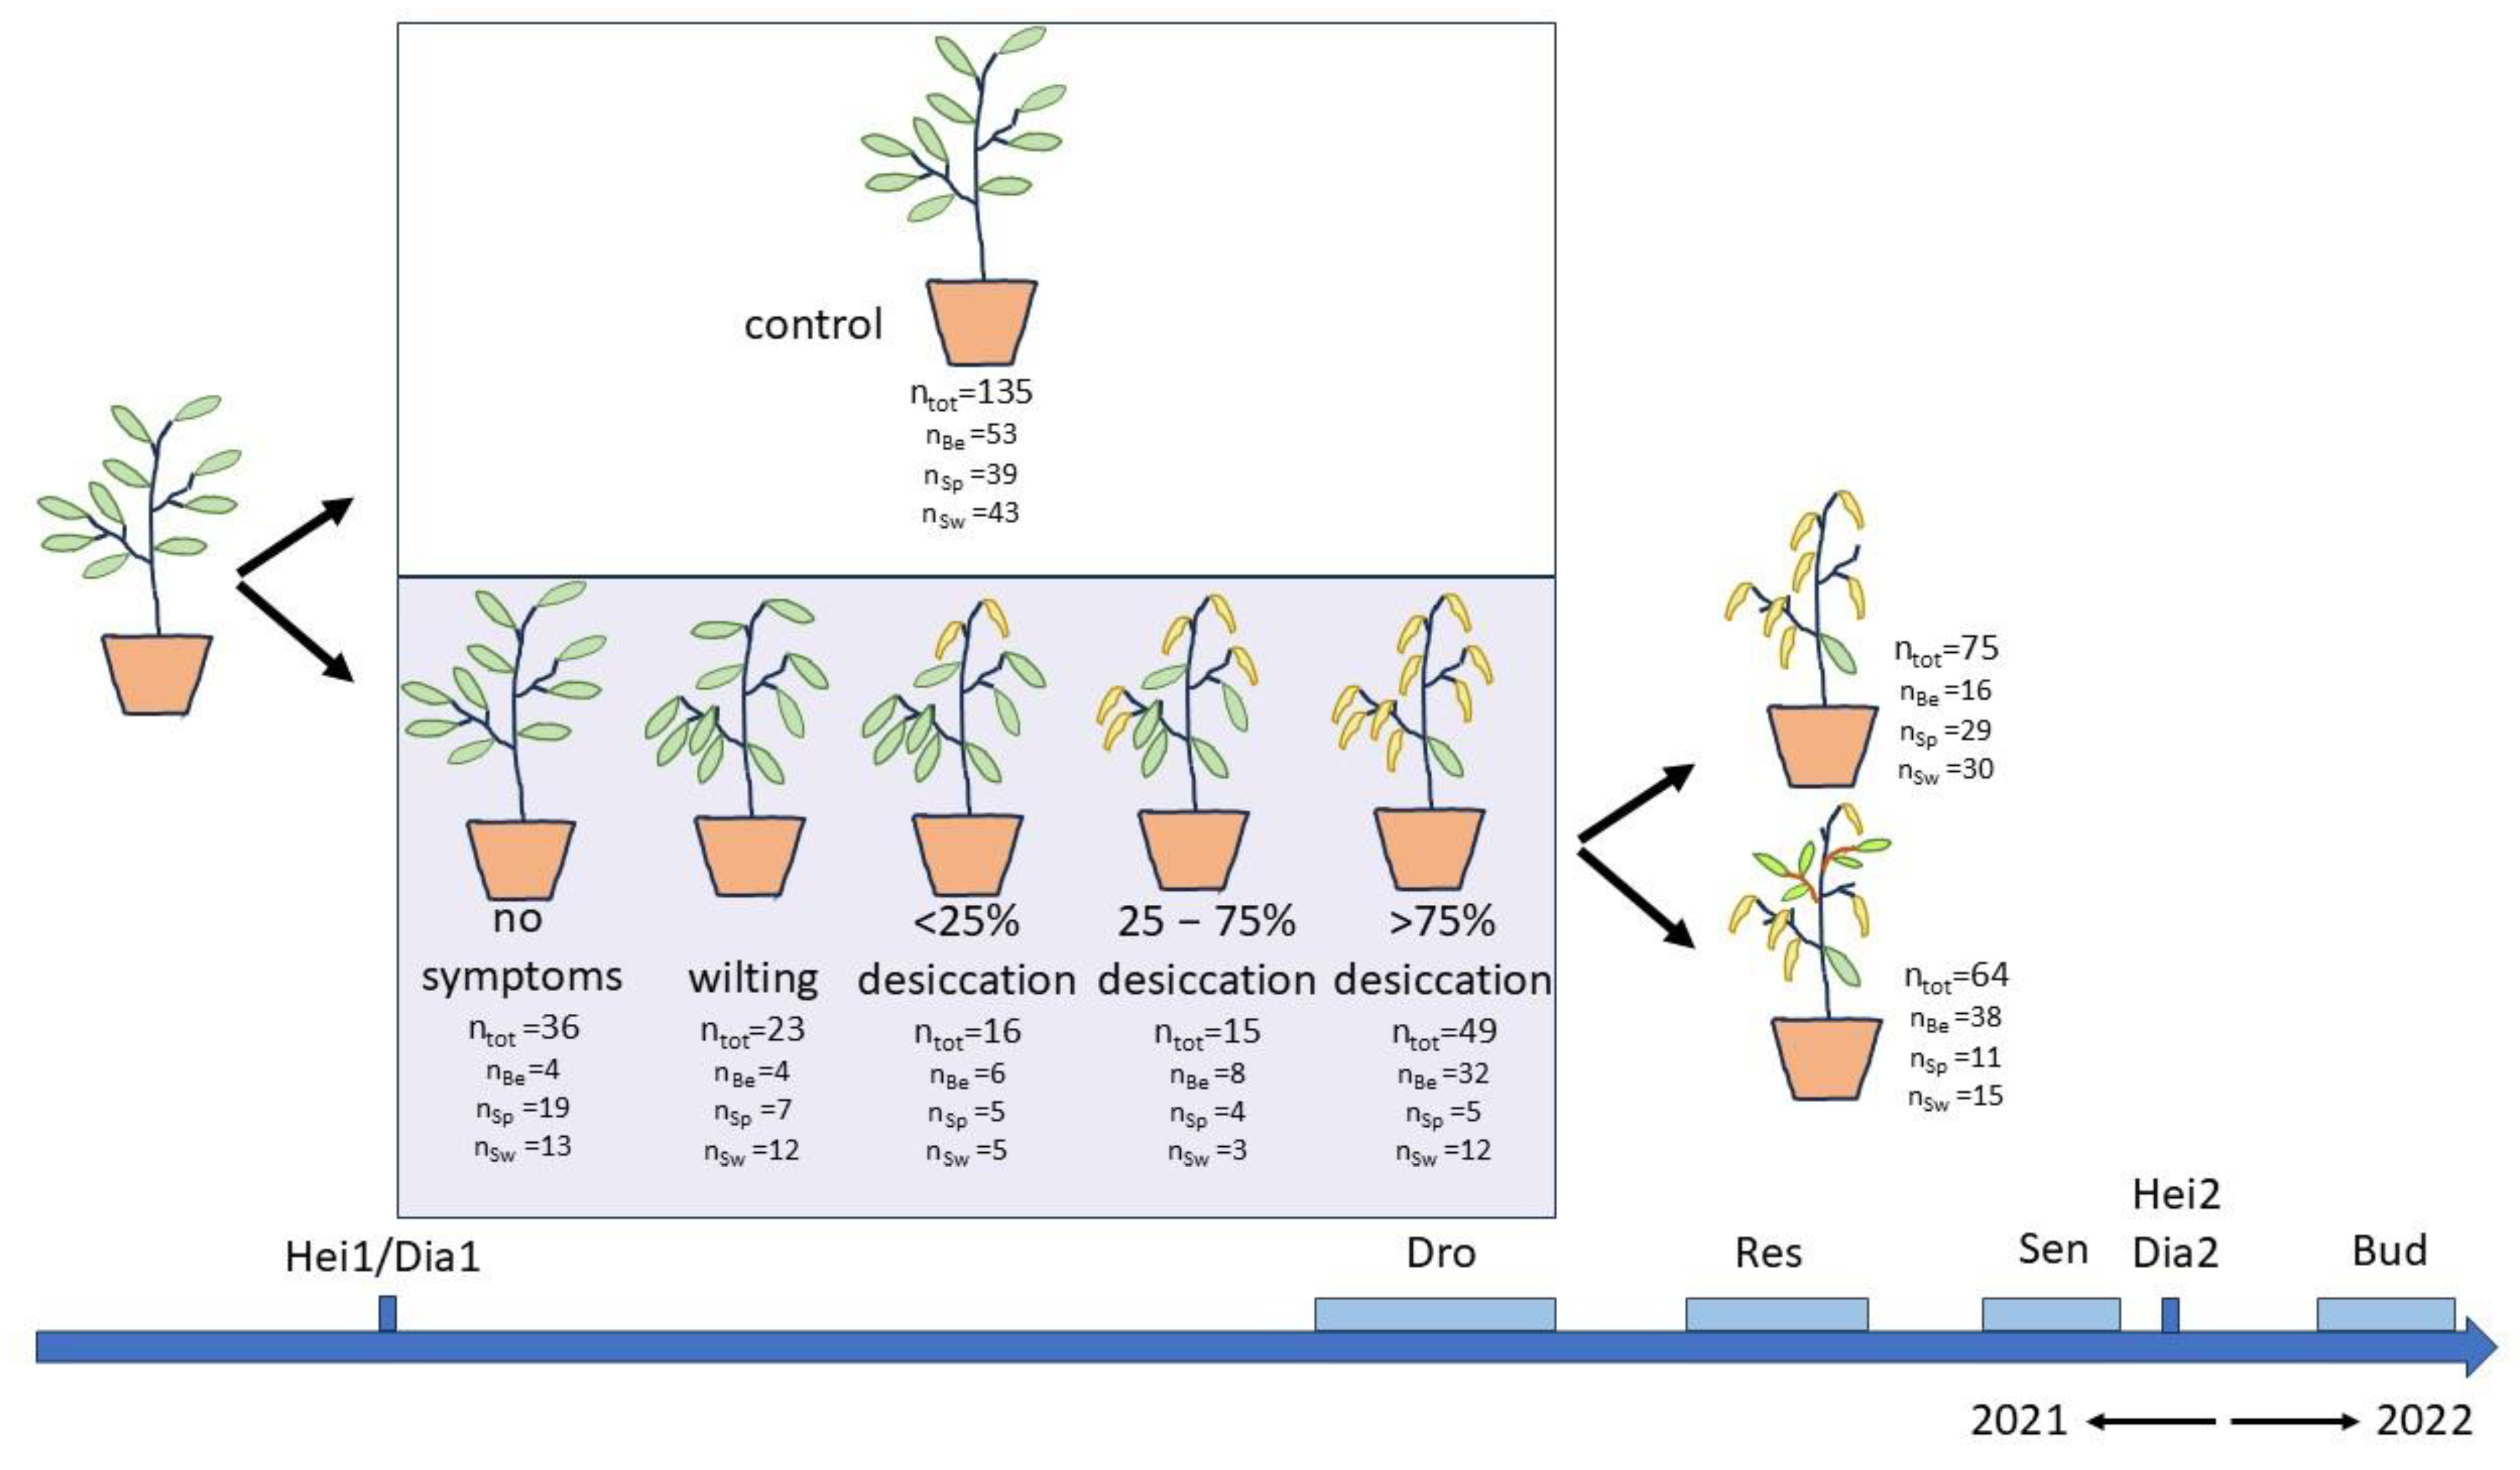
Figure 9.
Schematic representation of the drought treatment with the plants subjected to water exclusion categorised according to the level of visible drought symptoms. The number of plants in each group is indicated with a further subdivision according to the provenance (Be: Belgian, Sp: Spanish-Pyrenean, Sw: Swedish). Several variables were recorded during and after the treatment. Hei1/Hei2/Dia1/Dia2: height and diameter, Dro: visual drought stress symptoms, Res: post-drought resprouting, Sen: autumn leaf senescence, Bud: bud burst.
Figure 10.
Weights of the pots during the treatment for the control and drought group, according to the provenance.
Figure 10.
Weights of the pots during the treatment for the control and drought group, according to the provenance.
Table 1.
Test statistics for the height (Hei1) and diameter (Dia1) at the start of the treatment, with p values for the fixed effects in the mixed model. The Spanish-Pyrenean (Sp) and the Swedish (Sw) provenances are compared to the standard Belgian provenance.
Table 1.
Test statistics for the height (Hei1) and diameter (Dia1) at the start of the treatment, with p values for the fixed effects in the mixed model. The Spanish-Pyrenean (Sp) and the Swedish (Sw) provenances are compared to the standard Belgian provenance.
| | Height | | | | Diameter | | | |
|---|
| | Estimate | Std. Error | t Value | p Value | Estimate | Std. Error | t Value | p Value |
|---|
| (Intercept) | 75.523 | 1.055 | 71.557 | <0.001 *** | 8.900 | 0.113 | 78.898 | <0.001 *** |
| Sp | −10.650 | 1.619 | −6.576 | <0.001 *** | −0.617 | 0.173 | −3.564 | <0.001 *** |
| Sw | −5.194 | 1.571 | −3.306 | 0.001 ** | −1.214 | 0.168 | −7.231 | <0.001 *** |
Table 2.
Test statistics for the development of drought symptoms during the drought treatment. The Spanish-Pyrenean (Sp) and the Swedish (Sw) provenances are compared to the standard Belgian provenance. Rew is the relative weight loss, Day is the day of observation, and Hei1 is the plant height at the start of the treatment.
| | Estimate | Std. Error | z Value | p Value |
|---|
| Day | 0.707 | 0.057 | 12.330 | <0.001 *** |
| Sp | −3.416 | 0.815 | −4.194 | <0.001 *** |
| Sw | −1.754 | 0.713 | −2.459 | 0.014 * |
| Rew | 77.327 | 9.396 | 8.230 | <0.001 *** |
| Hei1 | 0.053 | 0.028 | 1.930 | 0.054 |
Table 3.
Test statistics for the modelling of the chance on post-drought resprouting in the drought-treated plants among the different categories of visual drought symptoms (Dro) and among the provenances, with p values for the fixed effects in the mixed model. In the model of the drought categories, the category normal (no symptoms, score 1) is the standard to which the other categories are compared to. In the two provenance models, the Belgian provenance is the standard to which the other provenances are compared to. Hei1 is the plant height at the start of the drought period. Sp: Spanish-Pyrenean provenance, Sw: Swedish provenance.
| | | Estimate | Std. Error | z Value | p Value |
|---|
| Visual drought symptom categories (Dro) | (Intercept) | −2.477 | 1.703 | −1.454 | 0.146 |
| Dro score 2 | −0.238 | 1.258 | −0.190 | 0.850 |
| Dro score 3 | 2.341 | 0.897 | 2.612 | 0.009 ** |
| Dro score 4 | 4.766 | 1.087 | 4.383 | <0.001 *** |
| Dro score 5 | 4.692 | 0.888 | 5.284 | <0.001 *** |
| Hei1 | −0.006 | 0.024 | −0.231 | 0.818 |
provenances in dataset containing no to mild visual drought symptom categories
(pooled Dro scores 1, 2 and 3) | (Intercept) | 1.511 | 2.561 | 0.590 | 0.555 |
| Sp | −2.320 | 0.972 | −2.387 | 0.017 * |
| Sw | −2.136 | 0.933 | −2.289 | 0.022 * |
| Hei1 | −0.031 | 0.037 | −0.831 | 0.406 |
provenances in dataset containing severe visual drought symptoms
(pooled Dro scores 4 and 5) | (Intercept) | 0.625 | 2.578 | 0.242 | 0.808 |
| Sp | 17.060 | 2171.000 | 0.008 | 0.994 |
| Sw | 0.310 | 0.868 | 0.358 | 0.721 |
| Hei1 | 0.012 | 0.034 | 0.362 | 0.718 |
Table 4.
Test statistics for the modelling of the timing of post-drought resprouting in the resprouting plants of the drought-treated group, among the different categories of visual drought symptoms and among the provenances, with p values for the fixed effects in the mixed model. In the model of the drought categories, the categories normal, wilting and <25% desiccated leaves (Dro scores 1, 2 and 3) are pooled and serve as the standard to which the other categories are compared to. In the provenance model, the Belgian provenance is the standard to which the other provenances are compared to. Day is the day of observation, and Hei1 is the plant height at the start of the treatment. Sp: Spanish-Pyrenean provenance, Sw: Swedish provenance.
| | | Estimate | Std. Error | z Value | p Value |
|---|
| visual drought symptom categories (Dro with scores 1, 2 and 3 being pooled) | Day | −0.885 | 0.098 | −9.011 | <0.001 *** |
| Dro score 4 | −2.774 | 1.258 | −2.206 | 0.027 * |
| Dro score 5 | −4.498 | 1.149 | −3.916 | <0.001 *** |
| Hei1 | −0.029 | 0.030 | −0.986 | 0.324 |
| provenances | Day | −0.883 | 0.097 | −9.073 | <0.001 *** |
| | Sp | 0.879 | 1.072 | 0.820 | 0.412 |
| | Sw | 0.344 | 0.955 | 0.360 | 0.719 |
| | Hei1 | −0.060 | 0.034 | −1.775 | 0.076 |
Table 5.
Test statistics for the modelling of the timing of leaf senescence in controls and droughted plants, among the different categories of visual drought symptoms and among the provenances, with p values for the fixed effects in the mixed model. In the visual drought symptoms model, the control plants are the standard to which the different categories of visual drought symptoms (Dro) are compared to. In the three provenance models, the Belgian provenance is the standard to which the other provenances are compared to. Day is the day of observation, and Hei2 is the plant height at the end of the growing season. Sp: Spanish-Pyrenean provenance, Sw: Swedish provenance.
| | | Estimate | Std. Error | z Value | p Value |
|---|
| visual drought symptom categories (total dataset) | Day | 0.343 | 0.020 | 17.288 | <0.001 *** |
| Dro score1 | −0.647 | 0.347 | −1.864 | 0.062 |
| Dro score2 | 0.941 | 0.398 | 2.363 | 0.018 * |
| Dro score3 | −0.084 | 0.464 | −0.180 | 0.857 |
| Dro score4 | −2.379 | 0.524 | −4.545 | <0.00 1*** |
| Dro score5 | −5.126 | 0.442 | −11.609 | <0.001 *** |
| Hei2 | 0.013 | 0.009 | 1.516 | 0.129 |
| provenances in dataset of control plants | Sp | −0.872 | 0.311 | −2.808 | 0.005 ** |
| Sw | 0.808 | 0.272 | 2.969 | 0.003 ** |
| Day | 0.334 | 0.026 | 12.699 | <0.001*** |
| Hei2 | 0.008 | 0.008 | 0.968 | 0.333 |
| provenances in dataset of plants with no to mild visual drought symptoms (pooled Dro scores 1, 2 and 3) | Sp | −1.771 | 0.673 | −2.631 | 0.009 ** |
| Sw | 1.239 | 0.634 | 1.954 | 0.051 |
| Day | 0.379 | 0.041 | 9.248 | <0.001 *** |
| Hei2 | 0.003 | 0.021 | 0.134 | 0.893 |
| provenances in dataset of plants with severe visual drought symptoms (pooled Dro scores 4 and 5) | Sp | −0.694 | 1.052 | −0.659 | 0.510 |
| Sw | 0.569 | 0.872 | 0.652 | 0.514 |
| Day | 0.390 | 0.064 | 6.129 | <0.001 *** |
| Hei2 | −0.006 | 0.033 | −0.172 | 0.863 |
Table 6.
Test statistics for the modelling of the relative chlorophyll content index between control plants and plants that lost more than a quarter of their foliage due to the drought, with p values for the fixed effects in the mixed model. The control plants are the standard to which the severely affected plants (Dro_adj2) are compared to. Day is the day of observation.
| | Estimate | Std. Error | DF | t Value | p Value |
|---|
| (Intercept) | 11.45 | 0.69 | 152 | 16.65 | <0.001 *** |
| Day | −55.78 | 3.21 | 152 | −17.37 | <0.001 *** |
| Day2 | −18.04 | 3.15 | 152 | −5.72 | <0.001 *** |
| Dro_adj2 | 1.98 | 0.97 | 52 | 2.04 | 0.047 * |
| Day:Dro_adj2 | 15.49 | 4.40 | 152 | 3.52 | 0.001 *** |
| Day2:Dro_adj2 | 4.00 | 4.38 | 152 | 0.91 | 0.362 |
Table 7.
Test statistics for the modelling of the timing of bud burst in controls and droughted plants, among the different categories of visual drought symptoms and among the provenances, with p values for the fixed effects in the mixed model. In the visual drought symptoms model, the control plants are the standard to which the different categories of visual drought symptoms (Dro) are compared to. In the three provenance models, the Belgian provenance is the standard to which the other provenances are compared to. Day is the day of observation, Hei2, the plant height at the end of the growing season. Sp: Spanish-Pyrenean provenance, Sw: Swedish provenance.
| | | Estimate | Std. Error | z Value | p Value |
|---|
| visual drought symptom categories (total dataset) | Dro score1 | 0.450 | 0.621 | 0.724 | 0.469 |
| Dro score2 | 2.374 | 0.756 | 3.139 | 0.002 ** |
| Dro score3 | 1.839 | 0.902 | 2.038 | 0.042 * |
| Dro score4 | 0.366 | 0.895 | 0.409 | 0.682 |
| Dro score5 | 1.901 | 0.565 | 3.363 | <0.001 *** |
| Hei2 | 0.058 | 0.014 | 4.028 | <0.001 *** |
| Day | −0.914 | 0.051 | −17.785 | <0.001 *** |
| provenances in dataset of control plants | Sp | −0.713 | 0.507 | −1.407 | 0.160 |
| Sw | 4.286 | 0.572 | 7.490 | <0.001 *** |
| Day | −0.854 | 0.069 | −12.427 | <0.001 *** |
| Hei2 | 0.061 | 0.015 | 4.033 | <0.001 *** |
| provenances in dataset of plants with no to mild visual drought symptoms (pooled Dro scores 1, 2 and 3) | Sp | 0.350 | 0.750 | 0.466 | 0.641 |
| Sw | 4.977 | 0.920 | 5.410 | <0.001 *** |
| Day | −0.889 | 0.099 | −9.017 | <0.001 *** |
| Hei2 | 0.105 | 0.027 | 3.913 | <0.001 *** |
| provenances in dataset of plants with severe visual drought symptoms (pooled Dro scores 4 and 5) | Sp | −0.114 | 1.198 | −0.095 | 0.924 |
| Sw | 4.829 | 1.170 | 4.129 | <0.001 *** |
| Day | −1.036 | 0.131 | −7.894 | <0.001 *** |
| Hei2 | −0.004 | 0.037 | −0.111 | 0.912 |
Table 8.
Schematic representation of the timing of autumn leaf senescence and spring bud burst in the droughted plants in comparison to the controls. Droughted plants are grouped according to the categories of visual drought symptoms during the summer water withholding.
Table 8.
Schematic representation of the timing of autumn leaf senescence and spring bud burst in the droughted plants in comparison to the controls. Droughted plants are grouped according to the categories of visual drought symptoms during the summer water withholding.
| Visual Drought Symptoms During Water Withholding (Dro) | Leaf Senescence | Bud Burst |
|---|
| Score 1: no symptoms | =control | =control |
| Score 2: wilting leaves | earlier | later |
| Score 3: <25% desiccated leaves | =control | later |
| Score 4: 25–75% desiccated leaves | later | =control |
| Score 5: >75% desiccated leaves | later | later |
Table 9.
Description of the variables in the statistical modelling.
Table 9.
Description of the variables in the statistical modelling.
| Abbreviation | General Description | Detailed Description |
|---|
| Bud | Timing of bud burst: model without provenance | |
| BudPro | Timing of bud burst: model with provenance | Three datasets: Control plants + Pooled Dro scores 1, 2 and 3 + pooled Dro scores 4 and 5 |
| Day | Day of observation | |
| Dia1 | Initial diameter | |
| Dro | Visual drought symptoms | |
| Dro_adj | Pooled visual drought symptoms | Categorical variable with 3 levels: Pooled Dro scores 1, 2 and 3 + Dro score 4 + Dro score 5 |
| Dro_adj2 | Controls and pooled visual drought symptoms | Categorical variable with 2 levels: Controls + pooled Dro scores 4 and 5 |
| Hei1 | Initial height | |
| Hei2 | Height at winter rest | |
| Lle | Leaf lamina length | |
| Llw | Leaf lamina widest width | |
| Pro | Provenance | Categorical variable with 3 levels: Be (Belgian) + Sp (Spanish-Pyrenean) + Sw (Swedish) |
| Rcc | Relative chlorophyll content | |
| Res1 | Resprouting (yes/no): model without provenance | |
| Res1Pro | Resprouting (yes/no): model with provenance | Two datasets: Pooled Dro scores 1, 2 and 3 + pooled Dro scores 4 and 5 |
| Res2 | Timing of resprouting: model without provenance | |
| Res2Pro | Timing of resprouting: model with provenance | |
| Rwe | Relative weight loss of the pots | |
| Sen | Timing of leaf senescence: model without provenance | |
| SenPro | Timing of leaf senescence: model with provenance | Three datasets: Control plants + Pooled Dro scores 1, 2 and 3 + pooled Dro scores 4 and 5 |
| Stl | Stomatal length | |
| Std | Stomatal density | |
.png)


 ,
, 

