
GC-Faster RCNN: The Object Detection Algorithm for Agricultural Pests Based on Improved Hybrid Attention Mechanism


Abstract
1. Introduction
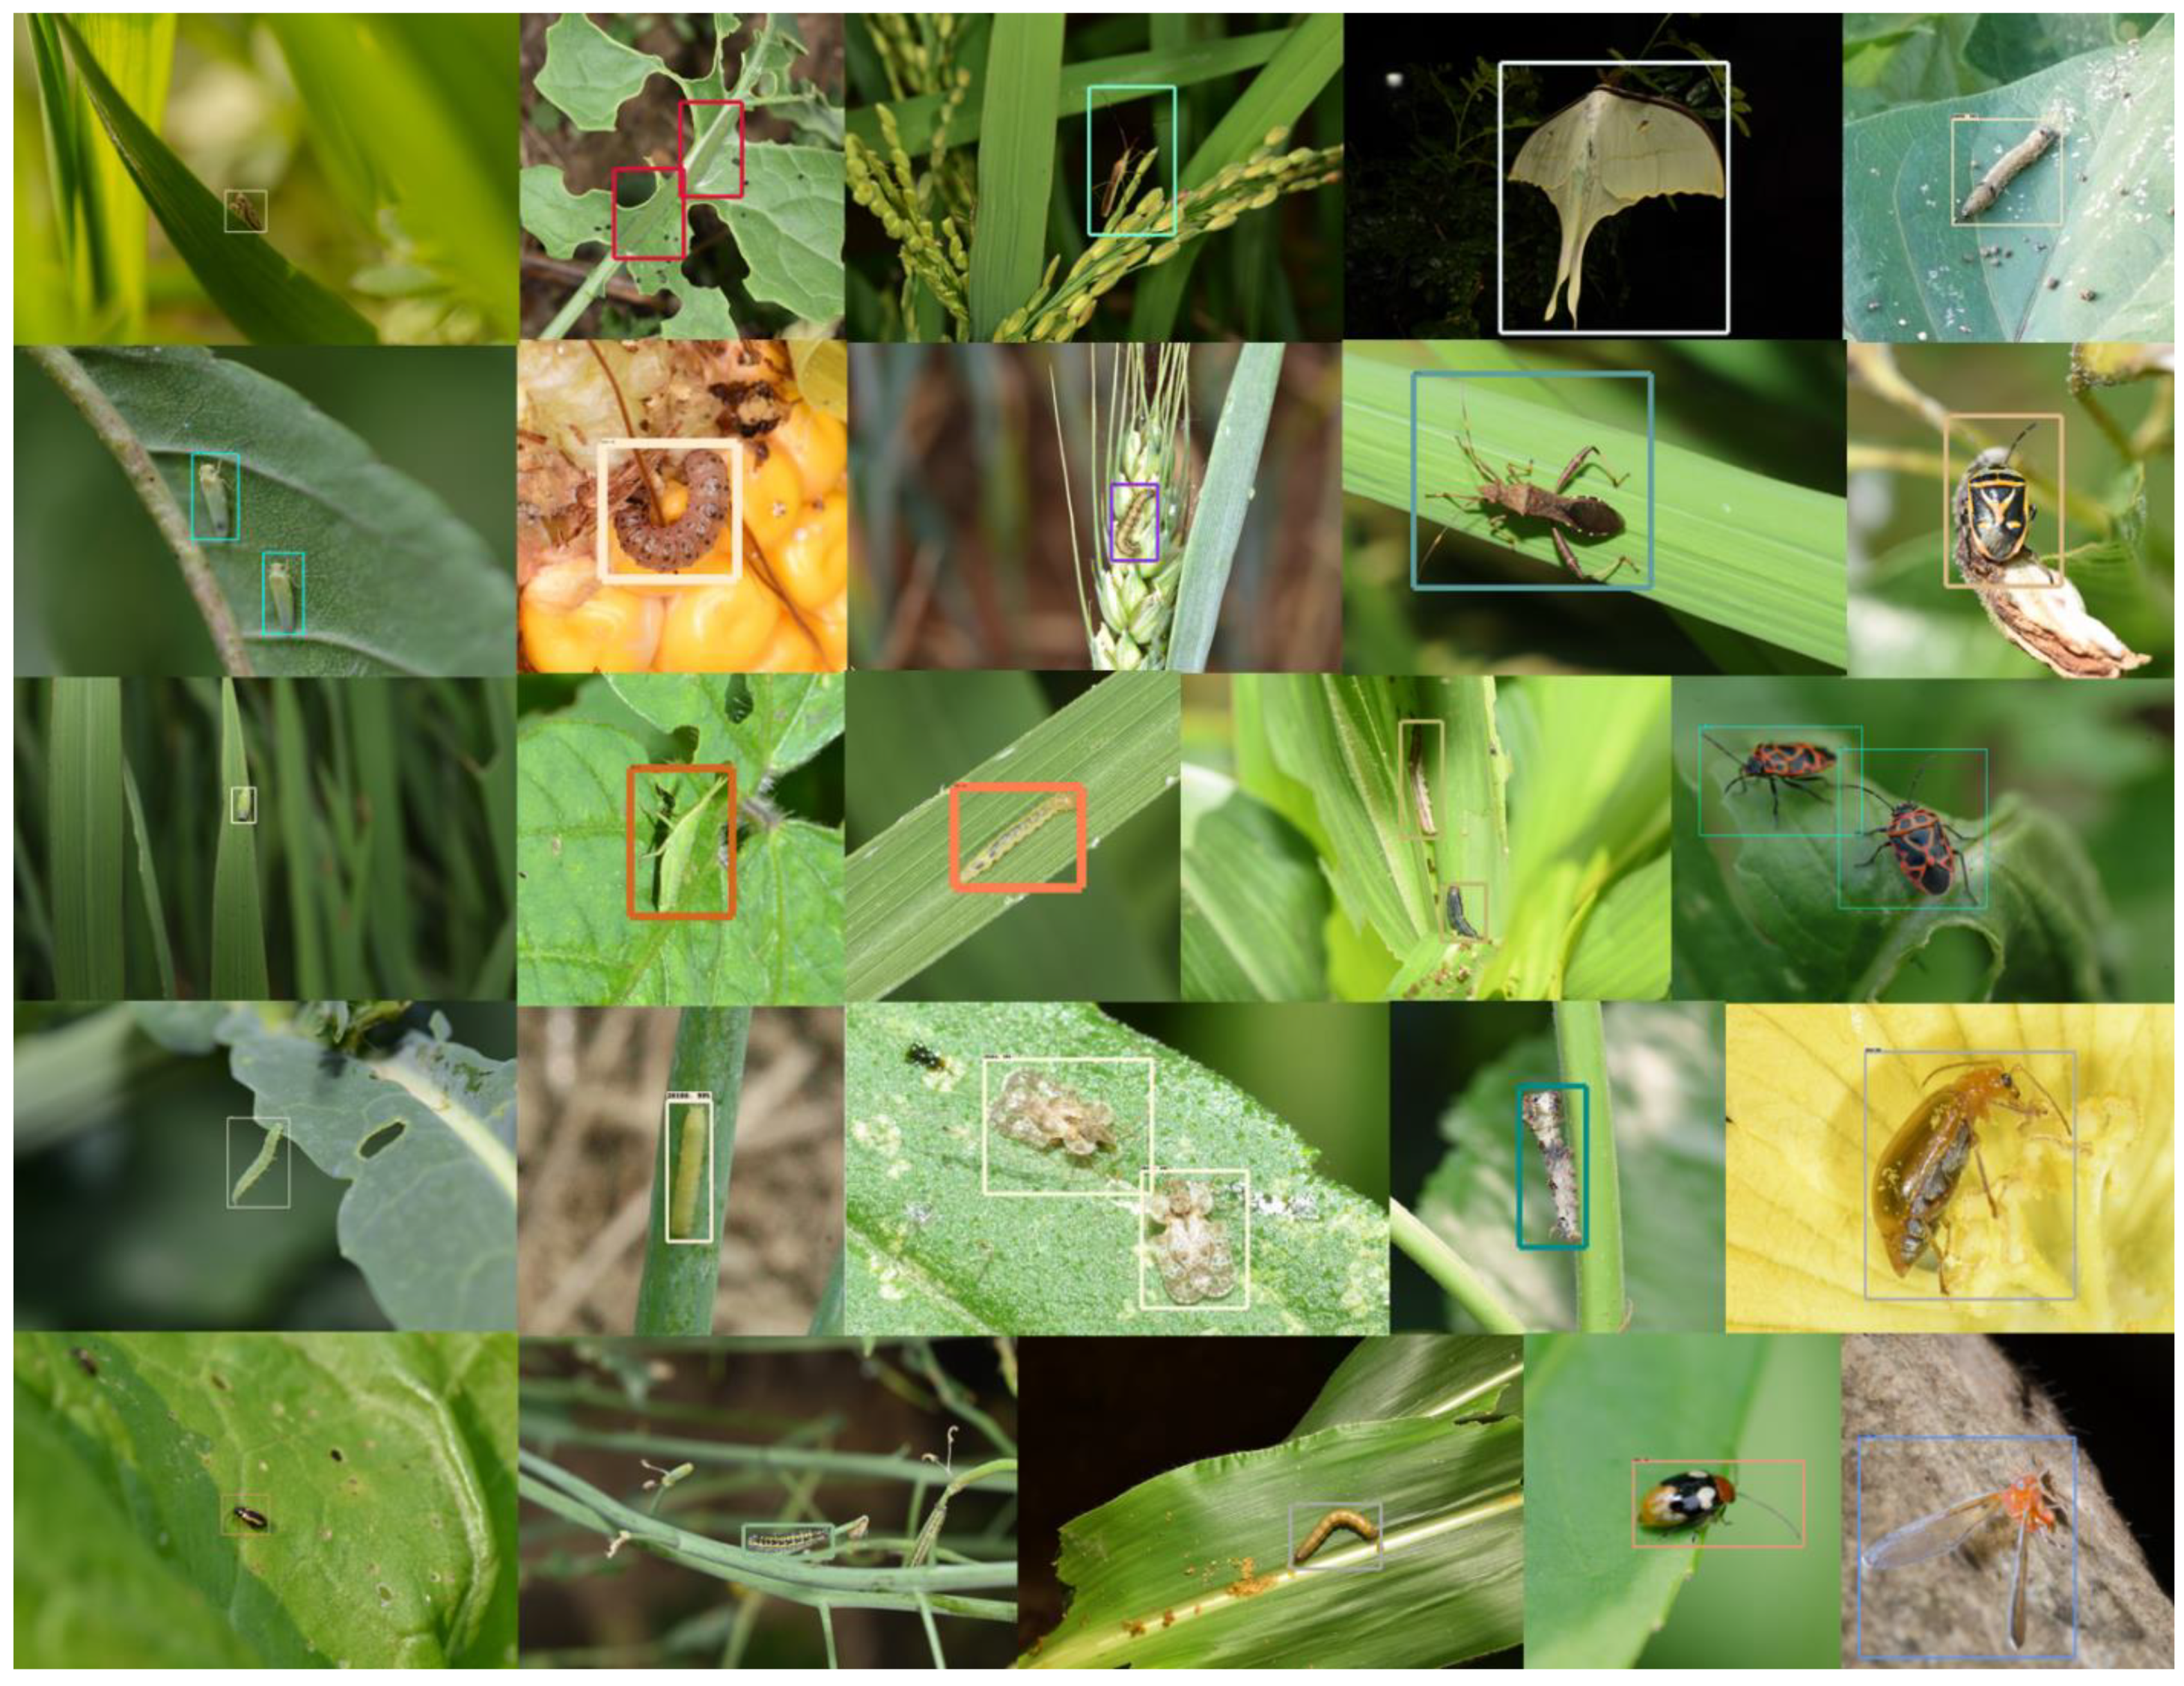
- We have constructed an image dataset called Insect25, which contains 25 categories of agricultural pests. Data augmentation methods have been applied to some categories to enhance the representation ability of the dataset.
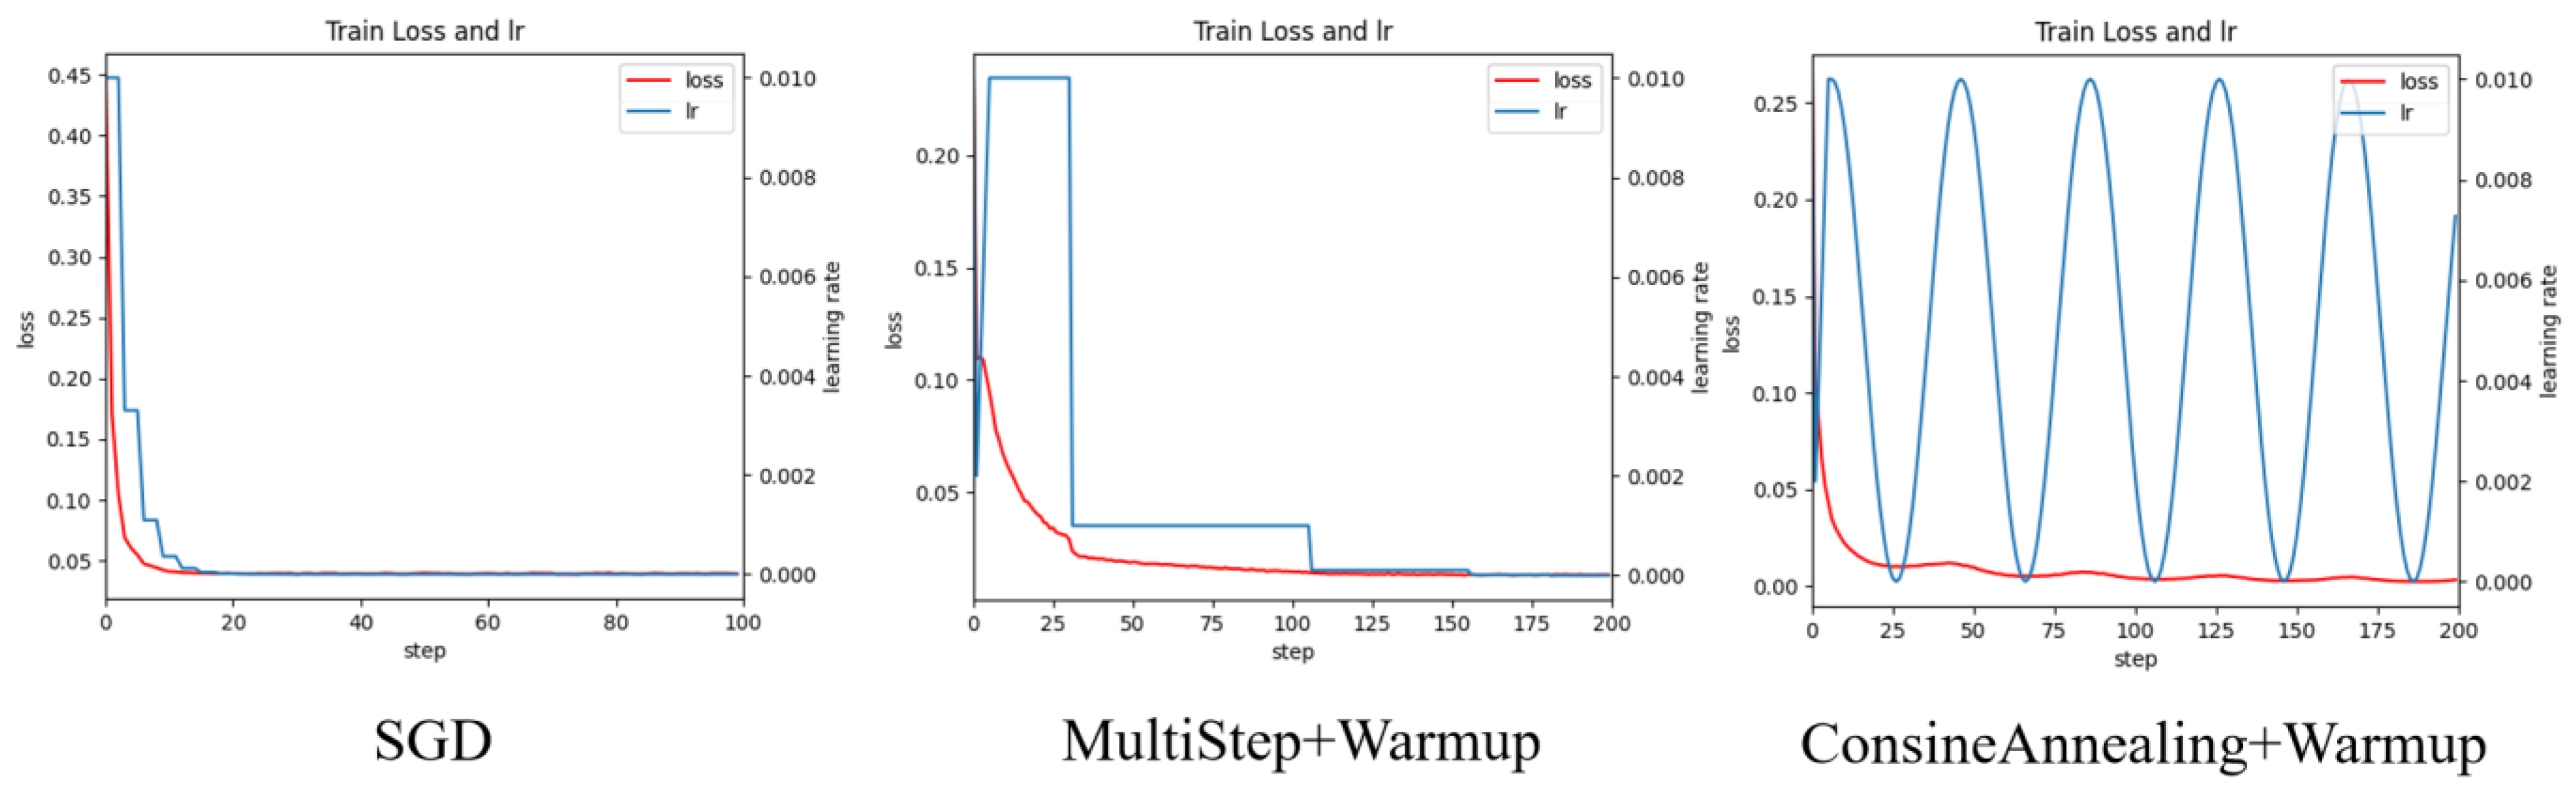
- A GC-Faster RCNN model was designed based on GCT and CBAM hybrid attention mechanism, which utilizes the correlation between channels and spatial key features to improve the feature extraction ability of the model. The IoU loss function was modified by introducing the EIoU function to improve the ability to locate objects for model. Specifically, the SGD optimizer was enhanced by incorporating a cosine annealing learning rate scheduler with linear warm-up (CosineAnnealing + Warmup), which dynamically adjusted the learning rate throughout the training cycle. This hybrid scheduling strategy effectively stabilized the early training phase through gradual warm-up while enabling precise convergence later via periodic learning rate resetting through cosine annealing.
2. Materials and Methods
2.1. Data
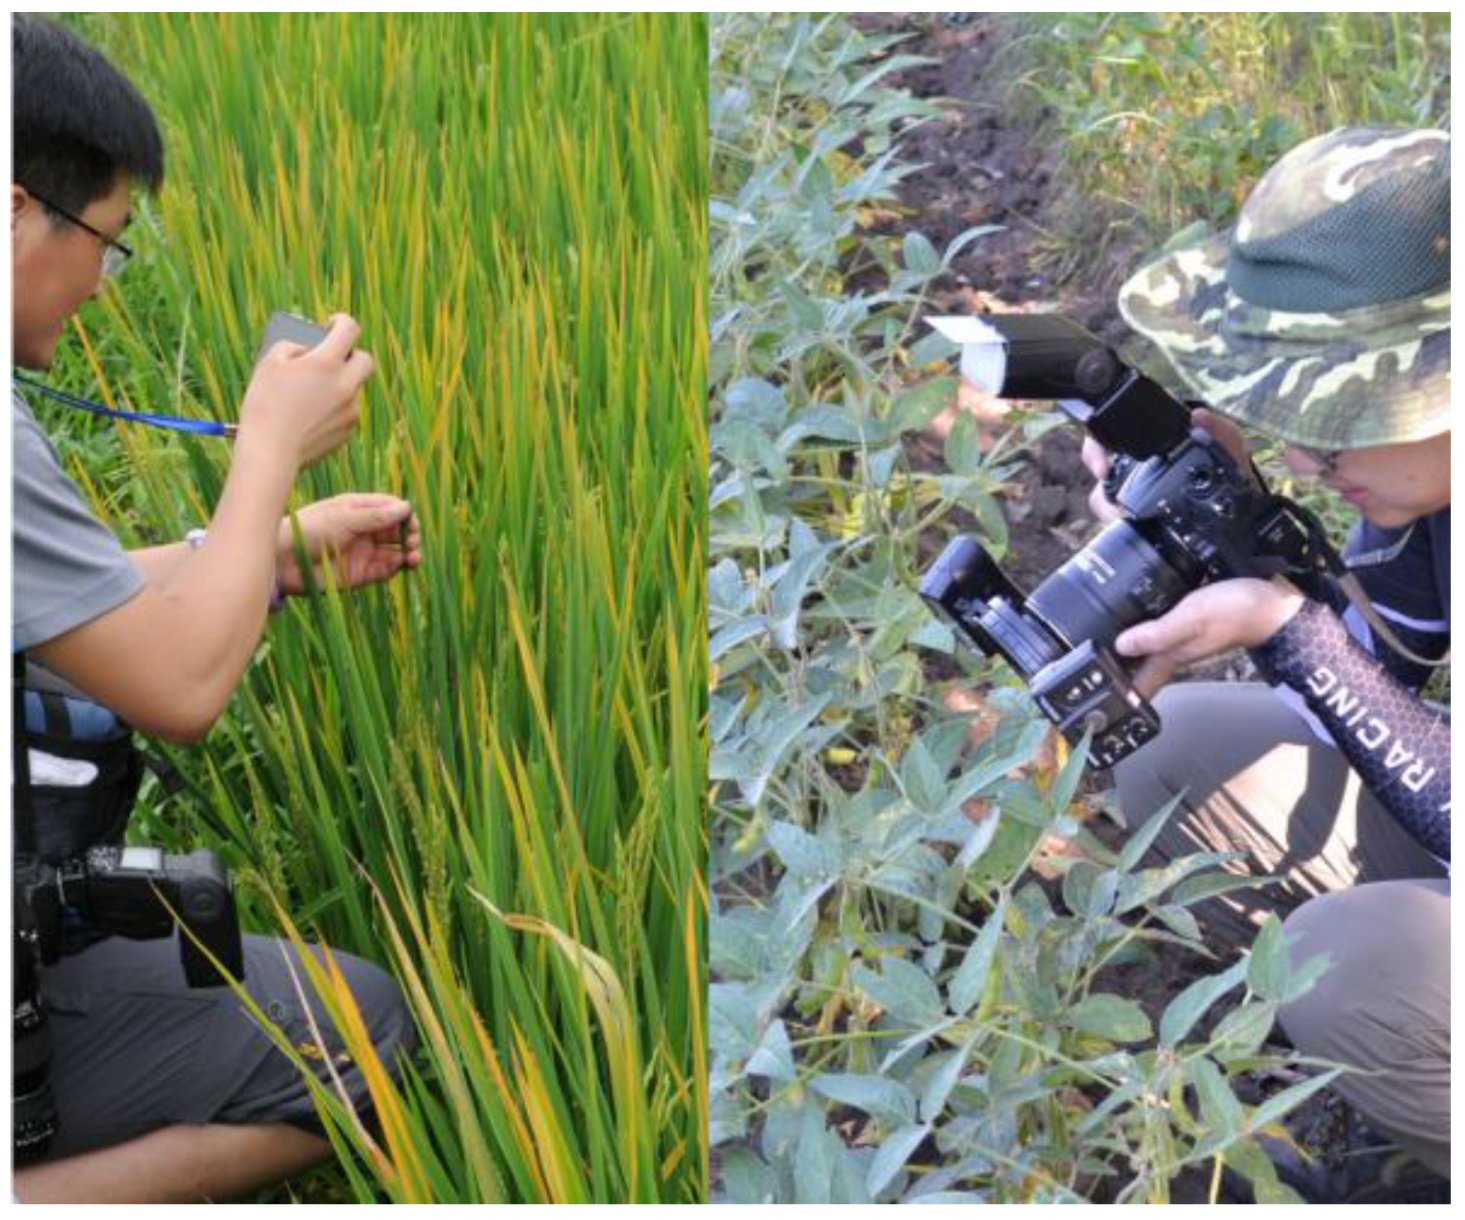
2.1.1. Data Collection
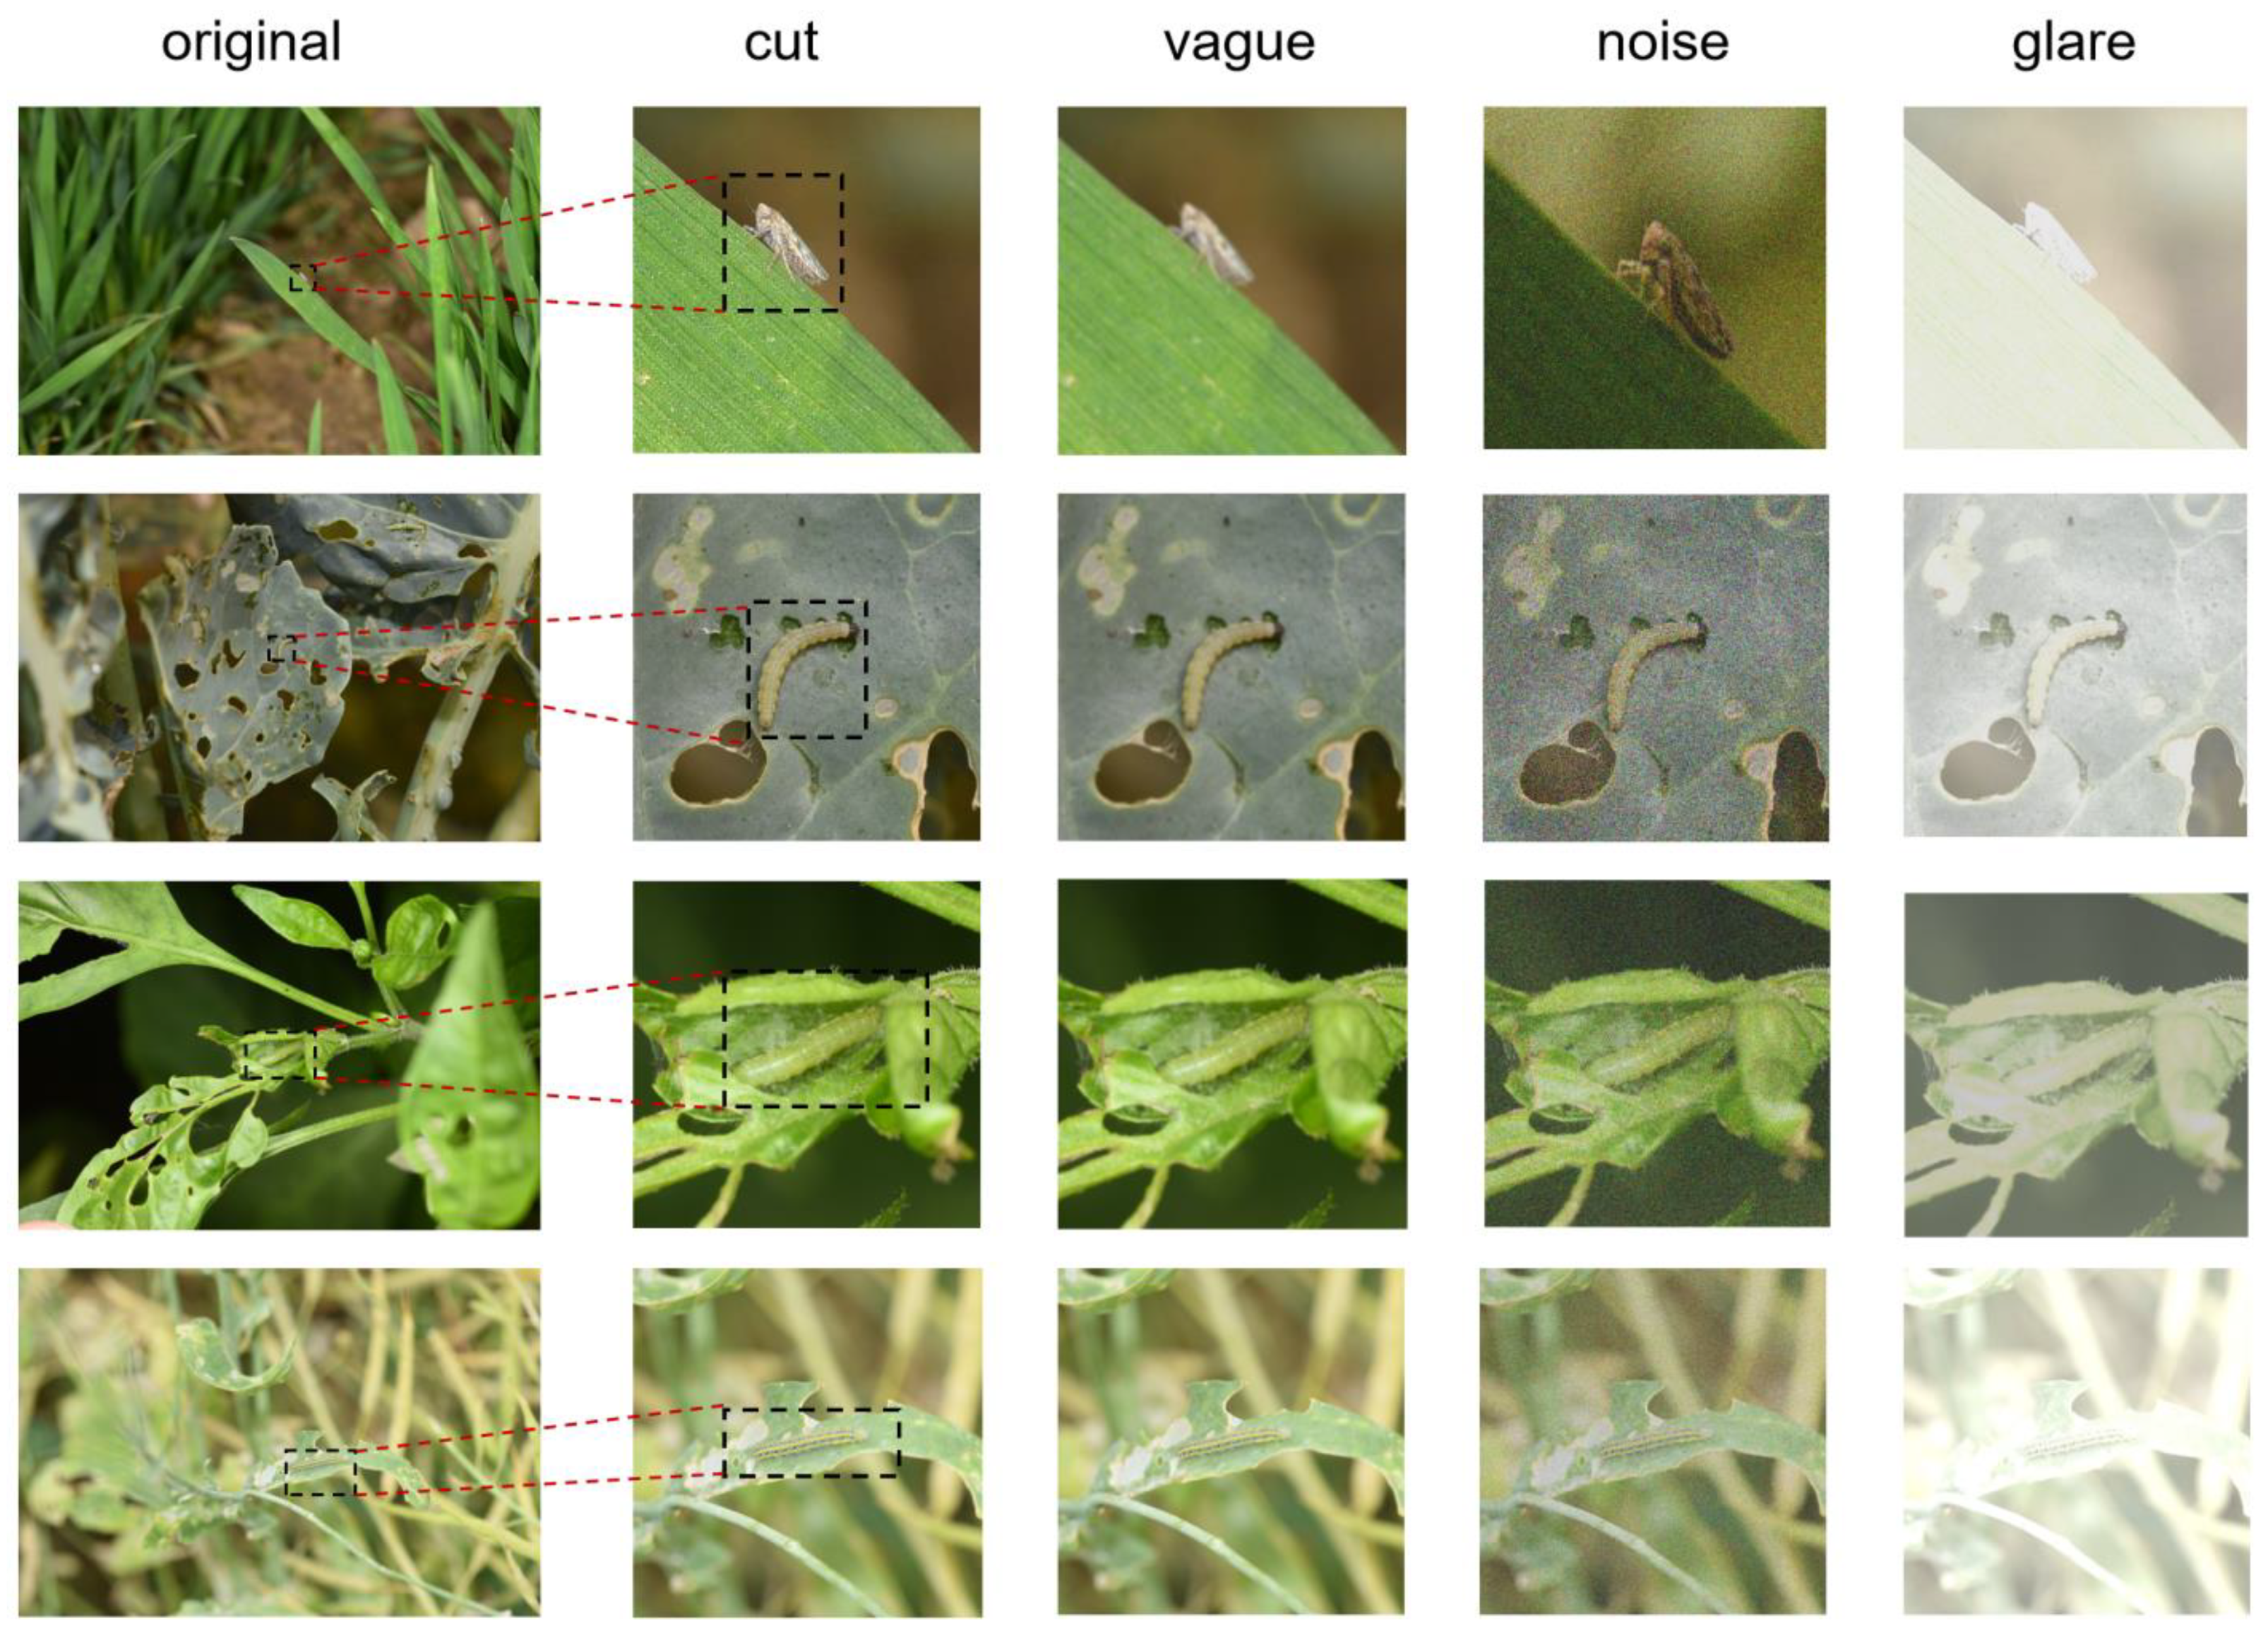
2.1.2. Data Processing
2.2. Method
2.2.1. Baseline Model
2.2.2. Faster RCNN Model Based on Hybrid Attention Mechanism
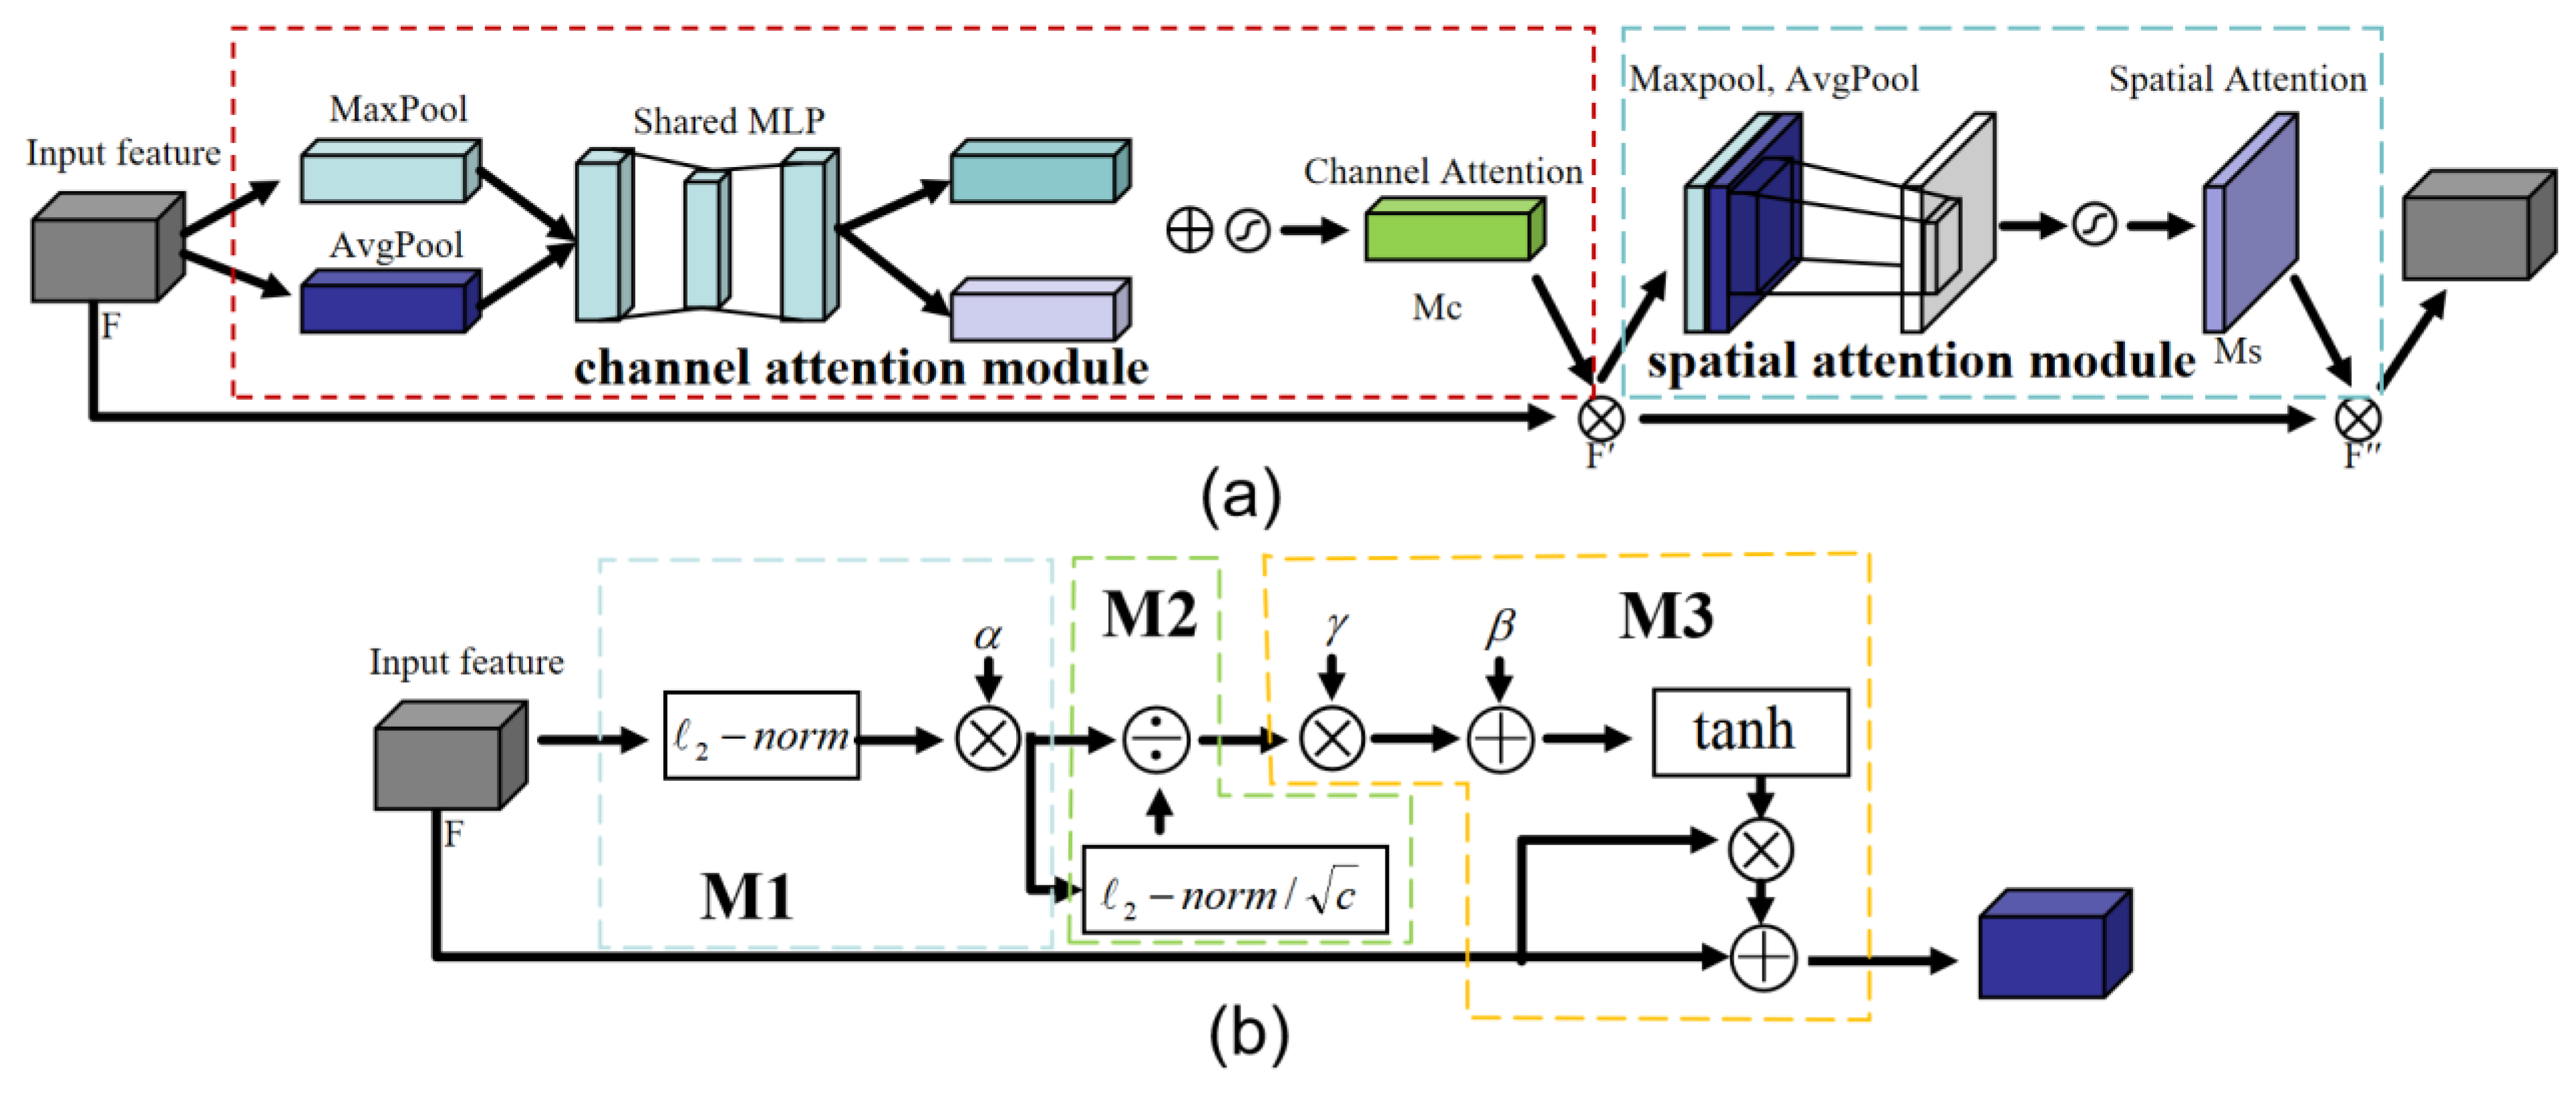
2.2.3. Attention Mechanism
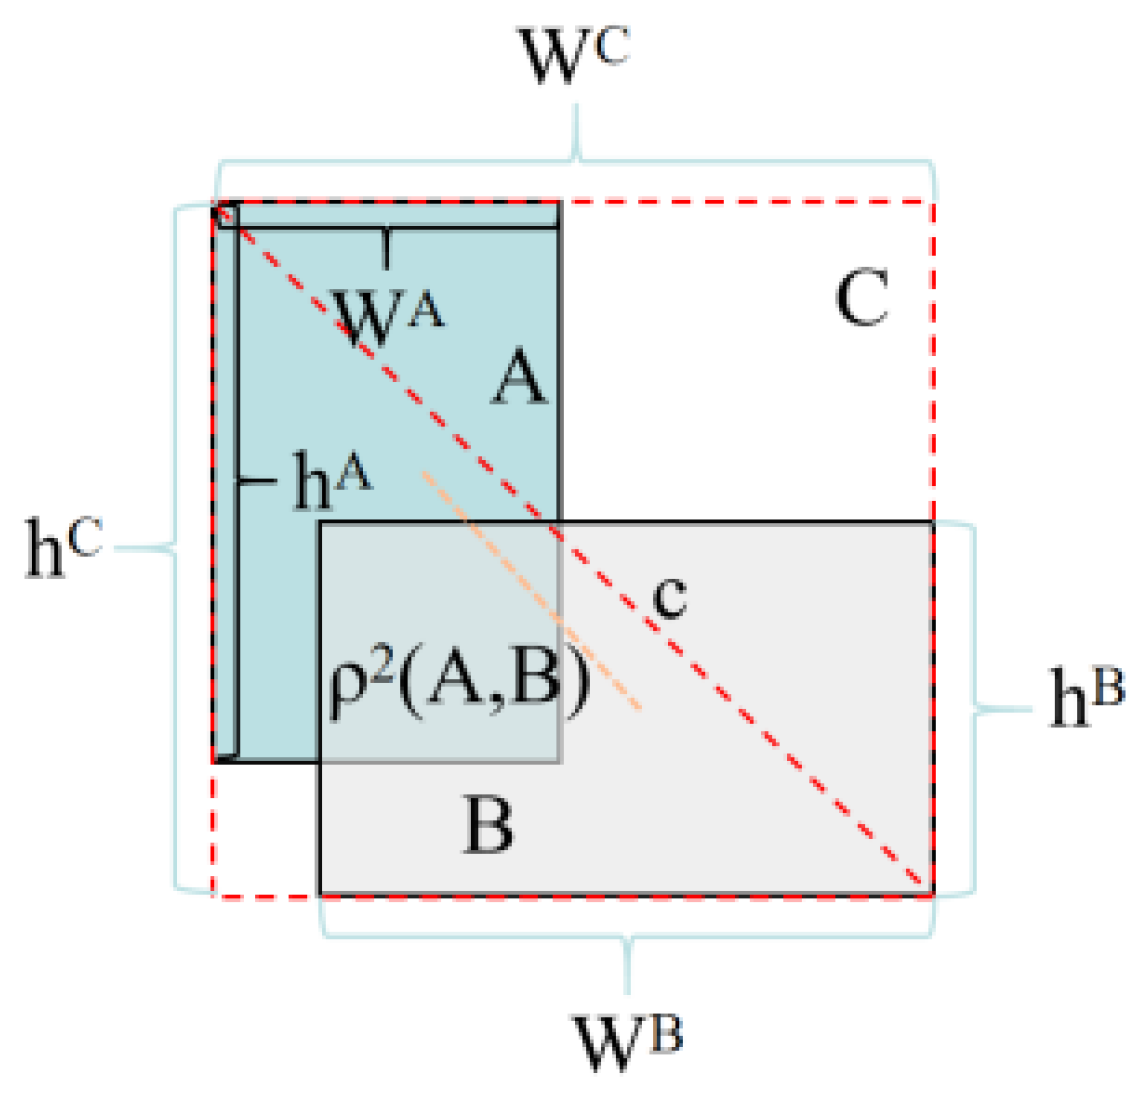
2.2.4. EIOU Improvement
3. Results
3.1. Evaluation Indices
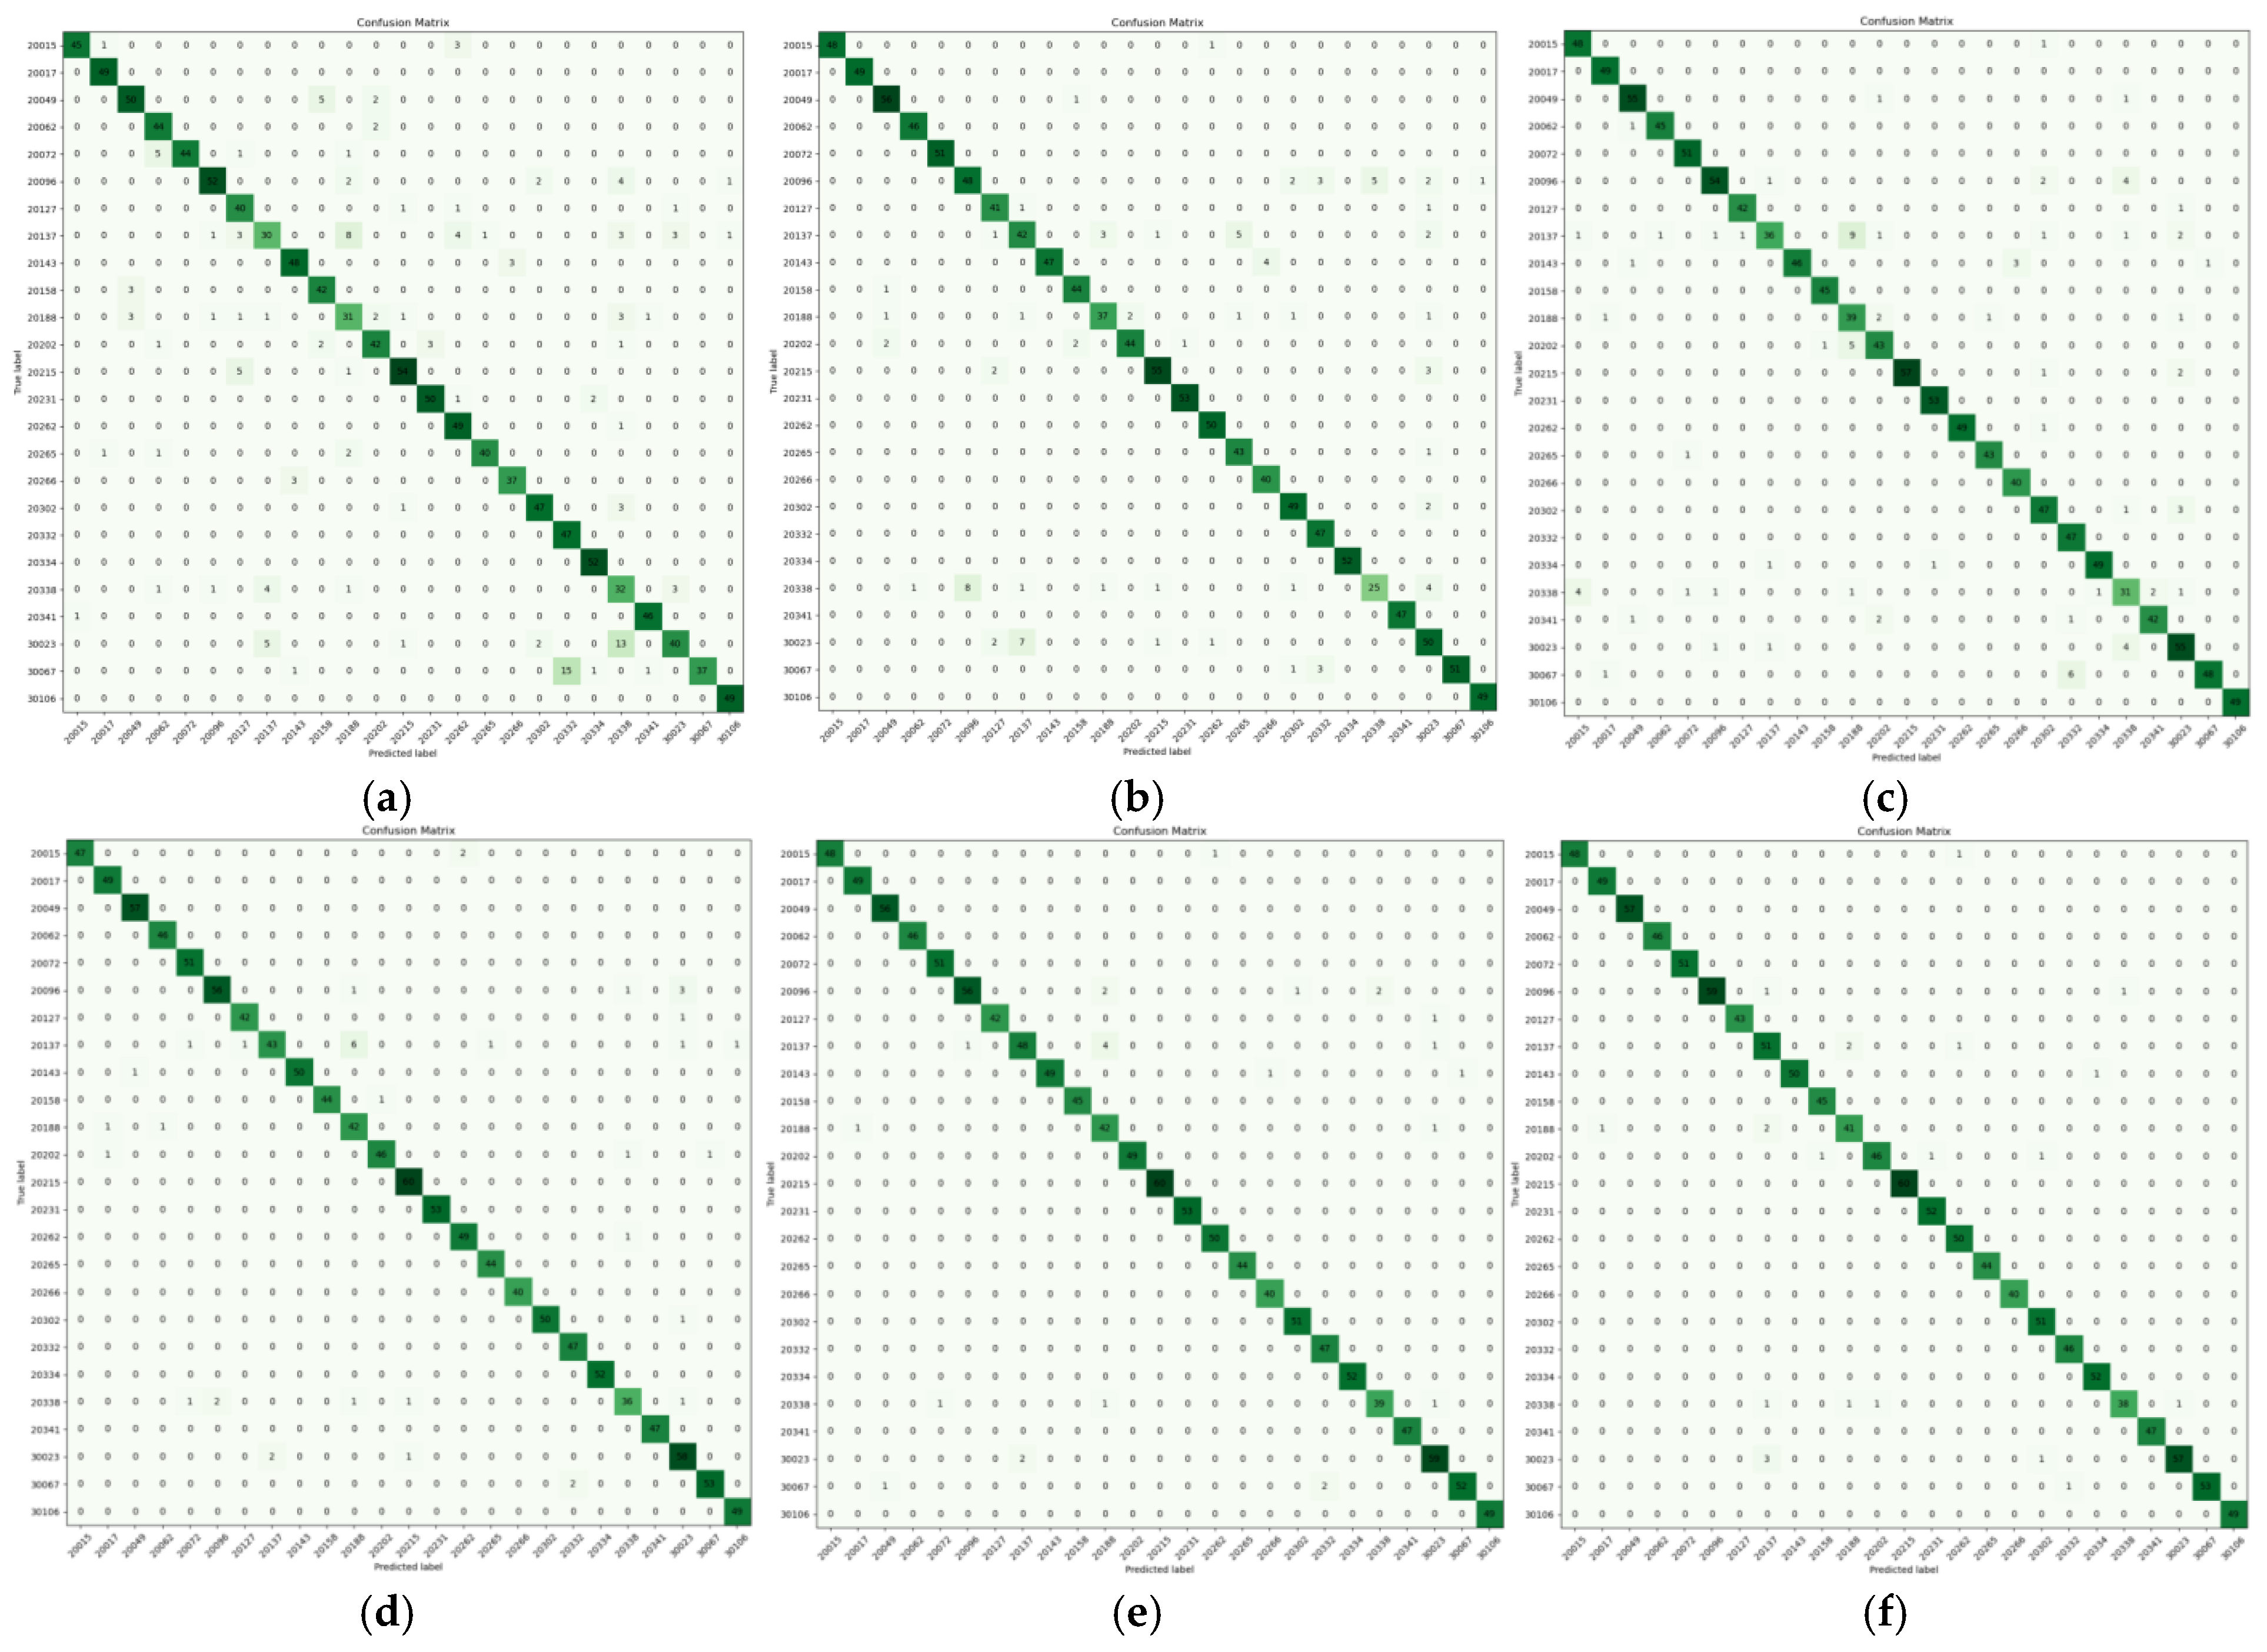
3.2. Results and Analysis
3.3. Ablation Experiment
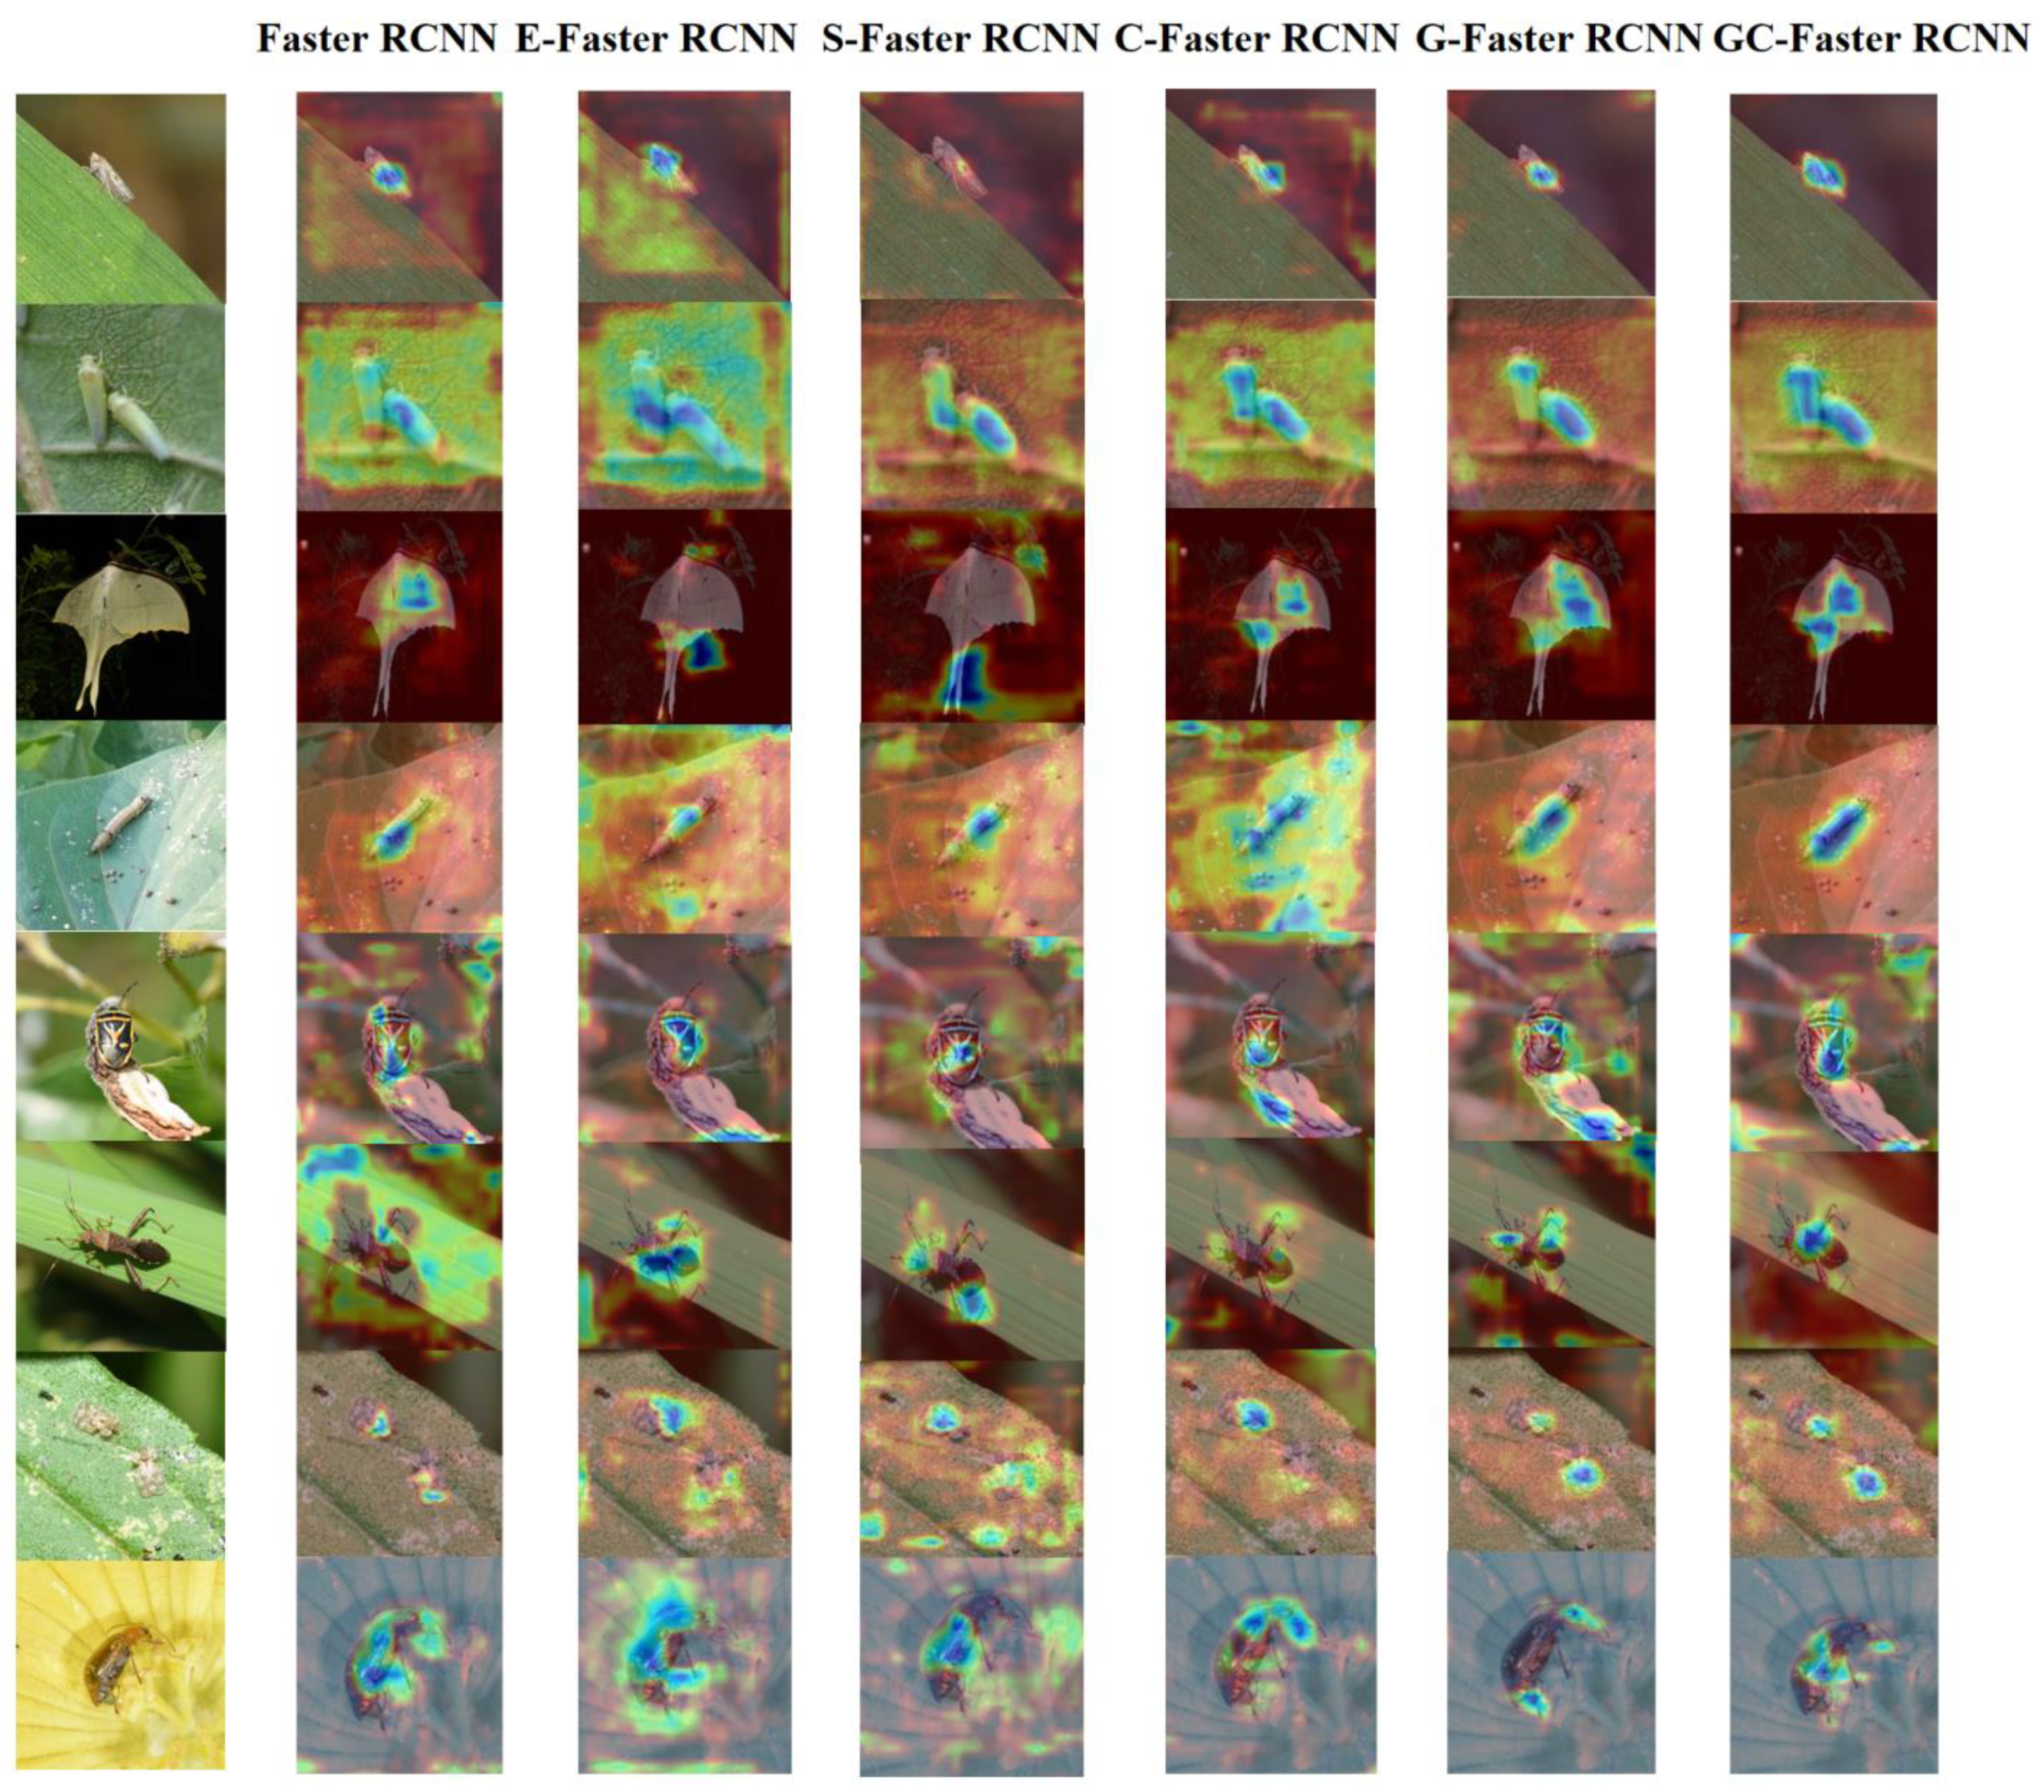
3.4. Visual Experiment
4. Discussion
Author Contributions
Funding
Data Availability Statement
Conflicts of Interest
Abbreviations
| GC | Gated and CBAM |
| RCNN | Region-based Convolutional Neural Networks |
References
- Zhao, C.J. Agricultural knowledge intelligent service technology: A review. Smart Agric. 2023, 5, 126–148, (In Chinese with English Abstract). [Google Scholar] [CrossRef]
- Chen, Y.; Huang, Y.; Zhang, Z.; Wang, Z.; Liu, B.; Liu, C.; Huang, C.; Dong, S.; Pu, X.; Wan, F.; et al. Plant image recognition with deep learning: A review. Comput. Electron. Agric. 2023, 212, 108072. [Google Scholar]
- Zhao, Z.A.; Wang, S.; Chen, M.X.; Mao, Y.J.; Chan, A.C.; Lai, D.K.; Wong, D.W.; Cheung, J.C. Enhancing human detection in occlusion-heavy disaster scenarios: A visibility-enhanced DINO (VE-DINO) model with reassembled occlusion dataset. Smart Cities 2025, 8, 12. [Google Scholar] [CrossRef]
- Johannes, A.; Picon, A.; Alvarez-Gila, A.; Echazarra, J.; Rodriguez-Vaamonde, S.; Navajas, A.D.; Ortiz-Barredo, A. Automatic plant disease diagnosis using mobile capture devices, applied on a wheat use case. Comput. Electron. Agric. 2017, 138, 200–209. [Google Scholar]
- Nawoya, S.; Ssemakula, F.; Akol, R.; Geissmann, Q.; Karstoft, H.; Bjerge, K.; Mwikirize, C.; Katumba, A.; Gebreyesus, G. Computer vision and deep learning in insects for food and feed production: A review. Comput. Electron. Agric. 2024, 126, 108503. [Google Scholar]
- Zou, Z.; Chen, K.; Shi, Z.; Guo, Y.; Ye, J. Object detection in 20 years: A survey. arXiv 2023, arXiv:1905.05055. [Google Scholar]
- Zhang, M.Q.; Xing, F.; Liu, D. External defect detection of transformer substation equipment based on improved Faster R-CNN. CAAI Trans. Intell. Syst. 2024, 19, 290–298. [Google Scholar]
- Lin, J.; Chen, X.; Cai, J.; Pan, R.; Cernava, T.; Migheli, Q.; Zhang, X.; Qin, Y. Looking from shallow to deep: Hierarchical complementary networks for large-scale pest identification. Comput. Electron. Agric. 2023, 214, 108342. [Google Scholar]
- Peng, Y.; Wang, Y. CNN and transformer framework for insect pest classification. Ecol. Inform. 2022, 72, 101846. [Google Scholar]
- Ren, S.; He, K.; Girshick, R.; Sun, J. Faster R-CNN: Towards real-time object detection with region proposal networks. IEEE Trans. Pattern Anal. Mach. Intell. 2016, 39, 1137–1149. [Google Scholar]
- Lin, T.Y.; Dollár, P.; Girshick, R.; He, K.; Hariharan, B.; Belongie, S. Feature pyramid networks for object detection. In Proceedings of the 2017 IEEE Conference on Computer Vision and Pattern Recognition, Honolulu, HI, USA, 21–26 July 2017; IEEE: Piscataway, NJ, USA, 2017; pp. 936–944. [Google Scholar]
- Zheng, X.R.; Zheng, P.; Wang, W.X.; Cheng, Y.H.; Su, Y.F. Rice pest recognition based on multi-scale feature extraction depth residual network. J. South China Agric. Univ. 2023, 44, 438–446. [Google Scholar]
- Zhang, K.; Wu, Q.; Chen, Y. Detecting soybean leaf disease from synthetic image using multi-feature fusion Faster R-CNN. Comput. Electron. Agric. 2021, 183, 106064. [Google Scholar] [CrossRef]
- Wang, Z.; Ling, Y.; Wang, X.; Meng, D.; Nie, L.; An, G.; Wang, X. An improved Faster R-CNN model for multi-object tomato maturity detection in complex scenarios. Ecol. Inform. 2022, 72, 101886. [Google Scholar] [CrossRef]
- Wang, M.; Fu, B.; Fan, J.; Wang, Y.; Zhang, L.; Xia, C. Sweet potato leaf detection in a natural scene based on Faster R-CNN with a visual attention mechanism and DIoU-NMS. Ecol. Inform. 2023, 73, 101931. [Google Scholar] [CrossRef]
- Kong, X.; Li, X.; Zhu, X.; Guo, Z.; Zeng, L. Detection model based on improved Faster-RCNN in apple orchard environment. Intell. Syst. Appl. 2024, 21, 200325. [Google Scholar] [CrossRef]
- Zhang, R.H.; Bai, X.; Fan, J.C. Crop pest target detection algorithm in complex scenes: YOLOv8-Extend. Smart Agric. 2024, 6, 49. [Google Scholar]
- Coulibaly, S.; Kamsu-Foguem, B.; Kamissoko, D.; Traore, D. Explainable deep convolutional neural networks for insect pest recognition. J. Clean. Prod. 2022, 371, 133638. [Google Scholar] [CrossRef]
- Ye, Y.; Huang, Q.; Rong, Y.; Yu, X.; Liang, W.; Chen, Y.; Xiong, S. Field detection of small pests through stochastic gradient descent with genetic algorithm. Comput. Electron. Agric. 2023, 206, 107694. [Google Scholar] [CrossRef]
- Xu, X.K. Research on the Balanced and Complete Construction Technology of Image Target Dataset. Ph.D. Thesis, Hangzhou Dianzi University, Hangzhou, China, 2021. [Google Scholar]
- Wu, X.P.; Zhan, C.; Lai, Y.K.; Cheng, M.M.; Yang, J. IP102: A large-scale benchmark dataset for insect pest recognition. In Proceedings of the 2019 IEEE/CVF Conference on Computer Vision and Pattern Recognition (CVPR), Long Beach, CA, USA, 15–20 June 2019; IEEE: Piscataway, NJ, USA, 2020; pp. 8779–8788. [Google Scholar]
- Huang, M.L.; Chuang, T.C. A Database of Eight Common Tomato Pest Images. Mendeley Data 2020, V1. Available online: https://data.mendeley.com/datasets/s62zm6djd2/1 (accessed on 2 June 2023).
- Zhang, X.H.; Wang, X.L.; Liu, T.T.; Hu, L.; Fan, J.C. Image dataset of six common orchard pests such as Bactrocera dorsalis. J. Agric. Big Data 2022, 4, 114–118. [Google Scholar]
- Girshick, R.; Donahue, J.; Darrell, T.; Malik, J. Rich feature hierarchies for accurate object detection and semantic segmentation. In Proceedings of the 2014 IEEE Conference on Computer Vision and Pattern Recognition, Columbus, OH, USA, 23–28 June 2014; pp. 580–587. [Google Scholar]
- He, K.; Zhang, X.; Ren, S.; Sun, J. Spatial pyramid pooling in deep convolutional networks for visual recognition. IEEE Trans. Pattern Anal. Mach. Intell. 2015, 37, 1904–1916. [Google Scholar] [CrossRef]
- Girshick, R. Fast R-CNN. arXiv 2015, arXiv:1504.08083. [Google Scholar]
- Wang, Y.; Wang, H.; Peng, Z. Rice diseases detection and classification using attention-based neural network and Bayesian optimization. Expert Syst. Appl. 2021, 178, 114770. [Google Scholar] [CrossRef]
- Peng, H.X.; Xu, H.M.; Liu, H.N. A grape pest identification model incorporating two-branch feature and attention mechanism. J. Agric. Eng. 2022, 38, 156–165. [Google Scholar]
- Woo, S.; Park, J.; Lee, J.Y.; Kweon, I.S. CBAM: Convolutional block attention module. In Proceedings of the 15th European Conference on Computer Vision (ECCV), Munich, Germany, 8–14 September 2018; Springer: Cham, Switzerland, 2018; pp. 3–19. [Google Scholar]
- Qi, X.H.; Zhi, M. Review of attention mechanisms in image processing. J. Front. Comput. Sci. Technol. 2024, 18, 345–362. [Google Scholar]
- Yang, Z.; Zhu, L.; Wu, Y.; Yang, Y. Gated channel transformation for visual recognition. In Proceedings of the 2020 IEEE/CVF Conference on Computer Vision and Pattern Recognition (CVPR), Seattle, WA, USA, 13–19 June 2020; pp. 11794–11803. [Google Scholar]
- Arumugam, C.; Nallaperumal, K.; Arumugam, S. FPN_GCT: Feature pyramid network gated channel transformation for automatic image sentiment analysis. Int. J. Intell. Eng. Syst. 2024, 17, 561–571. [Google Scholar]
- Yu, J.; Jiang, Y.; Wang, Z.; Cao, Z.; Huang, T. Unitbox: An advanced object detection network. In Proceedings of the 24th ACM International Conference on Multimedia, Amsterdam, The Netherlands, 15–19 October 2016; pp. 516–520. [Google Scholar]
- Zhang, Y.F.; Ren, W.; Zhang, Z.; Jia, Z.; Wang, L.; Tan, T. Focal and efficient IOU loss for accurate bounding box regression. arXiv 2021, arXiv:2101.08158. [Google Scholar]
- Qi, W.; Chen, H.; Ye, Y.; Yu, G. Indoor object recognition based on YOLOv5 with EIOU loss function. In Proceedings of the Third International Conference on Advanced Algorithms and Signal Image Processing (AASIP 2023), Kuala Lumpur, Malaysia, 30 June–2 July 2023; SPIE: Bellingham, WA, USA, 2023; Volume 12799, pp. 880–885. [Google Scholar]
- Guan, B.L.; Zhang, L.P.; Zhu, J.B.; Li, R.M.; Kong, J.J.; Wang, Y.; Dong, W. Review on key issues and evaluation methods of agricultural pest image dataset construction. Smart Agric. 2023, 5, 17–34. [Google Scholar]
- Wang, Q.; Wu, B.; Zhu, P.; Li, P.; Zuo, W.; Hu, Q. ECA-Net: Efficient Channel Attention for Deep Convolutional Neural Networks. In Proceedings of the 2020 IEEE/CVF Conference on Computer Vision and Pattern Recognition (CVPR), Seattle, WA, USA, 13–19 June 2020; pp. 1153–1160. [Google Scholar]
- Hu, J.; Shen, L.; Sun, G. Squeeze-and-Excitation Networks. IEEE Trans. Pattern Anal. Mach. Intell. 2020, 42, 2011–2023. [Google Scholar]
- Wang, C.Y.; Bochkovskiy, A.; Liao, H.Y.M. YOLOv7: Trainable bag-of-freebies sets new state-of-the-art for real-time object detectors. arXiv 2022, arXiv:2207.02696. [Google Scholar]


| Dataset | Task | Scale | Resolution | Categories | Number | Source |
|---|---|---|---|---|---|---|
| IP102 [21] | Detection | Large-scale | Low | 102 | 75,222 | Internet |
| Tomato pests [22] | Classification | Multi-scale | Low | 8 | 609 | Internet |
| Orchard pests [23] | Classification | Multi-scale | Low | 6 | 1568 | Internet |
| Insect25 | Detection | Multi-scale | High | 25 | 18,349 | Real scenes |
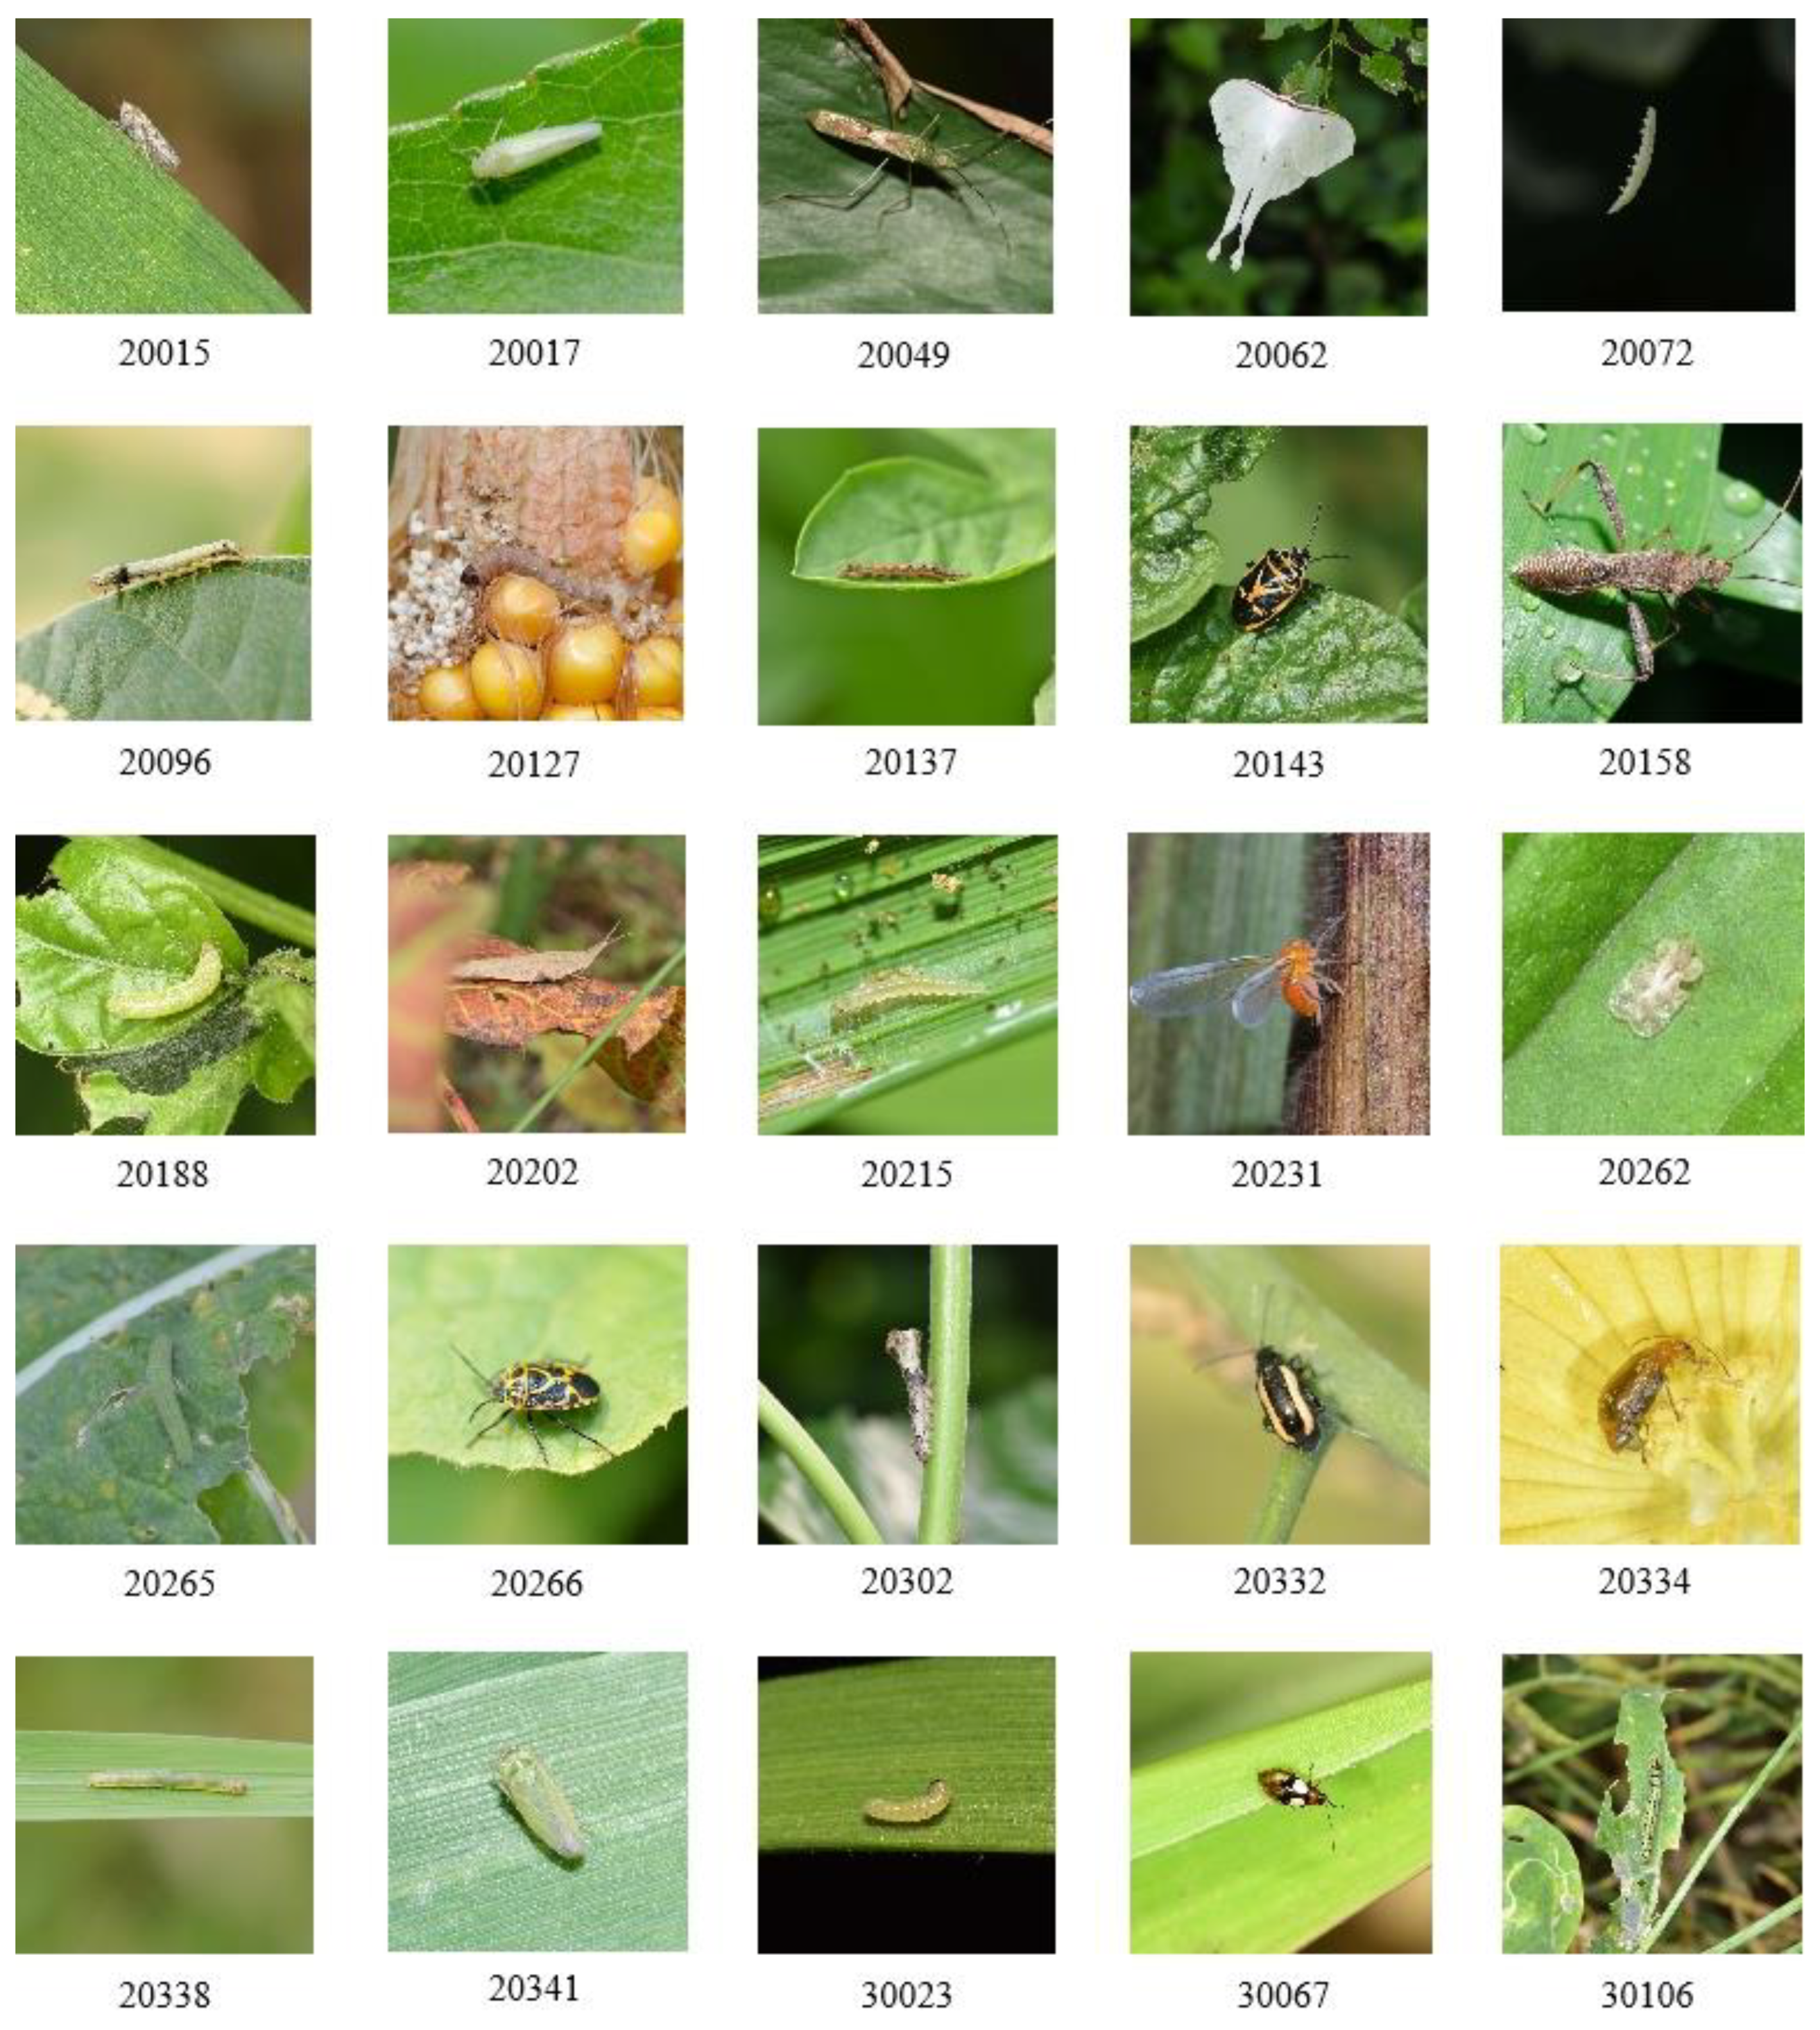
| Class | Name | Number | Class | Name | Number |
|---|---|---|---|---|---|
| 20015 | Psammotettix striatus (Linnaeus) | 529 | 20262 | Corythucha marmorata (Uhler) | 944 |
| 20017 | Singapora shinshana (Matsumura) | 555 | 20265 | Pieris rapae (Linnaeus) | 488 |
| 20049 | Leptocorisa acuta (Thunberg) | 264 | 20266 | Eurydema dominulus (Scopoli) | 696 |
| 20062 | Actias ningpoana Felder | 281 | 20302 | Bombyx mandarina (Moore) | 234 |
| 20072 | Plutella xylostella (Linnaeus) | 450 | 20332 | Phyllotreta striolata (Fabricius) | 2210 |
| 20096 | Spodoptera litura (Fabricius) | 1234 | 20334 | Aulacophora indica (Gmelin) | 635 |
| 20127 | Conogethes punctiferalis (Guenée) | 340 | 20338 | Mythimna separata (Walker) | 1871 |
| 20137 | Helicoverpa armigera (Hübner) | 726 | 20341 | Nephotettix cincticeps (Fabricius) | 773 |
| 20143 | Eurydema gebleri Kolenati | 478 | 30023 | Spodoptera frugiperda (J. E. Smith) | 1147 |
| 20158 | Riptortus pedestris (Fabricius) | 969 | 30067 | Monolepta signata (Olivier) | 1205 |
| 20188 | Spodoptera exigua (Hübner) | 257 | 30106 | Pontia edusa (Fabricius) | 346 |
| 20202 | Atractomorpha sinensis Bolvar | 920 | 20262 | Corythucha marmorata (Uhler) | 944 |
| 20215 | Cnaphalocrocis medinalis (Guenée) | 278 | 20265 | Pieris rapae (Linnaeus) | 488 |
| 20231 | Diostrombus politus Uhler | 519 | 20266 | Eurydema dominulus (Scopoli) | 696 |
| 20302 | Bombyx mandarina (Moore) | 234 |
| Model | mAP0.5 | mAP0.75 | mAP0.5:0.95 | mAR0.5:0.95 |
|---|---|---|---|---|
| Faster RCNN [10] | 0.925 | 0.735 | 0.611 | 0.674 |
| YOLOv7 [39] | 0.924 | 0.912 | 0.700 | 0.835 |
| E-Faster RCNN | 0.981 | 0.924 | 0.756 | 0.791 |
| S-Faster RCNN | 0.974 | 0.918 | 0.757 | 0.794 |
| C-Faster RCNN | 0.977 | 0.921 | 0.761 | 0.795 |
| G-Faster RCNN | 0.978 | 0.917 | 0.769 | 0.796 |
| GC-Faster RCNN (ours) | 0.970 | 0.939 | 0.819 | 0.840 |
| AM | mAP0.5 | mAP0.75 | mAP0.5:0.95 | mAR0.5:0.95 |
|---|---|---|---|---|
| Original | 0.925 | 0.735 | 0.611 | 0.674 |
| ECA | 0.981 | 0.924 | 0.756 | 0.791 |
| SE | 0.974 | 0.918 | 0.757 | 0.794 |
| CBAM | 0.977 | 0.921 | 0.761 | 0.795 |
| GCT | 0.978 | 0.917 | 0.769 | 0.796 |
| Ours | 0.963 | 0.923 | 0.779 | 0.823 |
| AM | Optimizer | IoU | mAP0.5 | mAP0.75 | mAP0.5:0.95 | mAR0.5:0.95 |
|---|---|---|---|---|---|---|
| Original | SGD + MultiStep + Warmup | - | 0.931 | 0.749 | 0.655 | 0.694 |
| SGD + CosineAnnealing + Warmup | 0.928 | 0.755 | 0.658 | 0.688 | ||
| ECA | SGD + MultiStep + Warmup | - | 0.980 | 0.936 | 0.762 | 0.804 |
| SGD + CosineAnnealing + Warmup | 0.971 | 0.935 | 0.769 | 0.810 | ||
| SE | SGD + MultiStep + Warmup | - | 0.988 | 0.921 | 0.775 | 0.796 |
| SGD + CosineAnnealing + Warmup | 0.988 | 0.922 | 0.776 | 0.804 | ||
| CBAM | SGD + MultiStep + Warmup | - | 0.978 | 0.930 | 0.786 | 0.796 |
| SGD + CosineAnnealing + Warmup | 0.978 | 0.933 | 0.794 | 0.812 | ||
| GCT | SGD + MultiStep + Warmup | - | 0.972 | 0.938 | 0.807 | 0.837 |
| SGD + CosineAnnealing + Warmup | 0.972 | 0.943 | 0.810 | 0.834 | ||
| Ours | SGD + MultiStep + Warmup | - | 0.978 | 0.942 | 0.814 | 0.837 |
| SGD + CosineAnnealing + Warmup | 0.972 | 0.936 | 0.817 | 0.841 |
| AM | Optimizer | IoU | mAP0.5 | mAP0.75 | mAP0.5:0.95 | mAR0.5:0.95 |
|---|---|---|---|---|---|---|
| Original | SGD + CosineAnnealing + Warmup | - EIoU | 0.928 0.928 | 0.755 0.753 | 0.658 0.652 | 0.688 0.703 |
| ECA | SGD + CosineAnnealing + Warmup | - EIoU | 0.971 0.971 | 0.935 0.936 | 0.769 0.771 | 0.810 0.811 |
| SE | SGD + CosineAnnealing + Warmup | - EIoU | 0.988 0.987 | 0.922 0.926 | 0.776 0.781 | 0.804 0.808 |
| CBAM | SGD + CosineAnnealing + Warmup | - EIoU | 0.978 0.975 | 0.933 0.934 | 0.794 0.803 | 0.812 0.834 |
| GCT | SGD + CosineAnnealing + Warmup | - EIoU | 0.972 0.970 | 0.943 0.938 | 0.810 0.814 | 0.834 0.835 |
| Ours | SGD + CosineAnnealing + Warmup | - EIoU | 0.972 0.970 | 0.936 0.939 | 0.817 0.819 | 0.841 0.840 |
| Method | AM | IoU | mAP0.5 | mAP0.75 | mAP0.5:0.95 | mAR0.5:0.95 |
|---|---|---|---|---|---|---|
| Layer23 | GCT + SAM | EIoU | 0.971 | 0.939 | 0.807 | 0.830 |
| Layer23 | Ours | EIoU | 0.971 | 0.941 | 0.812 | 0.840 |
| Layer123 | GCT + SAM | EIoU | 0.972 | 0.936 | 0.815 | 0.841 |
| Layer123 | Ours | EIoU | 0.970 | 0.939 | 0.819 | 0.840 |
| Class | Model | mAP 0.5:0.95 | mAR 0.5:0.95 | Class | Model | mAP 0.5:0.95 | mAR 0.5:0.95 |
|---|---|---|---|---|---|---|---|
| 20015 | Faster RCNN | 0.677 | 0.738 | 20231 | Faster RCNN | 0.759 | 0.796 |
| E-Faster RCNN | 0.657 | 0.740 | E-Faster RCNN | 0.841 | 0.866 | ||
| S-Faster RCNN | 0.754 | 0.823 | S-Faster RCNN | 0.855 | 0.878 | ||
| C-Faster RCNN | 0.848 | 0.887 | C-Faster RCNN | 0.898 | 0.924 | ||
| G-Faster RCNN | 0.830 | 0.873 | G-Faster RCNN | 0.895 | 0.922 | ||
| GC-Faster RCNN | 0.837 | 0.871 | GC-Faster RCNN | 0.911 | 0.935 | ||
| 20017 | Faster RCNN | 0.622 | 0.683 | 20262 | Faster RCNN | 0.697 | 0.550 |
| E-Faster RCNN | 0.654 | 0.706 | E-Faster RCNN | 0.702 | 0.555 | ||
| S-Faster RCNN | 0.728 | 0.782 | S-Faster RCNN | 0.669 | 0.543 | ||
| C-Faster RCNN | 0.786 | 0.832 | C-Faster RCNN | 0.725 | 0.589 | ||
| G-Faster RCNN | 0.791 | 0.834 | G-Faster RCNN | 0.755 | 0.573 | ||
| GC-Faster RCNN | 0.798 | 0.834 | GC-Faster RCNN | 0.747 | 0.573 | ||
| 20049 | Faster RCNN | 0.516 | 0.573 | 20265 | Faster RCNN | 0.666 | 0.669 |
| E-Faster RCNN | 0.550 | 0.615 | E-Faster RCNN | 0.760 | 0.730 | ||
| S-Faster RCNN | 0.628 | 0.699 | S-Faster RCNN | 0.821 | 0.775 | ||
| C-Faster RCNN | 0.732 | 0.775 | C-Faster RCNN | 0.847 | 0.793 | ||
| G-Faster RCNN | 0.715 | 0.767 | G-Faster RCNN | 0.879 | 0.812 | ||
| GC-Faster RCNN | 0.726 | 0.767 | GC-Faster RCNN | 0.878 | 0.814 | ||
| 20062 | Faster RCNN | 0.761 | 0.804 | 20266 | Faster RCNN | 0.763 | 0.807 |
| E-Faster RCNN | 0.810 | 0.849 | E-Faster RCNN | 0.829 | 0.854 | ||
| S-Faster RCNN | 0.827 | 0.873 | S-Faster RCNN | 0.852 | 0.875 | ||
| C-Faster RCNN | 0.887 | 0.913 | C-Faster RCNN | 0.877 | 0.902 | ||
| G-Faster RCNN | 0.906 | 0.928 | G-Faster RCNN | 0.880 | 0.902 | ||
| GC-Faster RCNN | 0.925 | 0.941 | GC-Faster RCNN | 0.893 | 0.922 | ||
| 20072 | Faster RCNN | 0.701 | 0.745 | 20302 | Faster RCNN | 0.733 | 0.778 |
| E-Faster RCNN | 0.794 | 0.831 | E-Faster RCNN | 0.741 | 0.786 | ||
| S-Faster RCNN | 0.829 | 0.865 | S-Faster RCNN | 0.786 | 0.821 | ||
| C-Faster RCNN | 0.881 | 0.898 | C-Faster RCNN | 0.810 | 0.850 | ||
| G-Faster RCNN | 0.880 | 0.909 | G-Faster RCNN | 0.830 | 0.874 | ||
| GC-Faster RCNN | 0.891 | 0.913 | GC-Faster RCNN | 0.837 | 0.876 | ||
| 20096 | Faster RCNN | 0.650 | 0.749 | 20332 | Faster RCNN | 0.677 | 0.694 |
| E-Faster RCNN | 0.781 | 0.811 | E-Faster RCNN | 0.649 | 0.690 | ||
| S-Faster RCNN | 0.819 | 0.864 | S-Faster RCNN | 0.763 | 0.768 | ||
| C-Faster RCNN | 0.861 | 0.906 | C-Faster RCNN | 0.795 | 0.798 | ||
| G-Faster RCNN | 0.868 | 0.903 | G-Faster RCNN | 0.793 | 0.792 | ||
| GC-Faster RCNN | 0.867 | 0.900 | GC-Faster RCNN | 0.808 | 0.811 | ||
| 20127 | Faster RCNN | 0.634 | 0.700 | 20334 | Faster RCNN | 0.598 | 0.634 |
| E-Faster RCNN | 0.635 | 0.669 | E-Faster RCNN | 0.578 | 0.610 | ||
| S-Faster RCNN | 0.717 | 0.769 | S-Faster RCNN | 0.687 | 0.712 | ||
| C-Faster RCNN | 0.679 | 0.774 | C-Faster RCNN | 0.651 | 0.720 | ||
| G-Faster RCNN | 0.744 | 0.800 | G-Faster RCNN | 0.663 | 0.717 | ||
| GC-Faster RCNN | 0.754 | 0.811 | GC-Faster RCNN | 0.663 | 0.727 | ||
| 20137 | Faster RCNN | 0.572 | 0.664 | 20338 | Faster RCNN | 0.537 | 0.702 |
| E-Faster RCNN | 0.624 | 0.700 | E-Faster RCNN | 0.599 | 0.732 | ||
| S-Faster RCNN | 0.711 | 0.782 | S-Faster RCNN | 0.715 | 0.776 | ||
| C-Faster RCNN | 0.808 | 0.850 | C-Faster RCNN | 0.758 | 0.819 | ||
| G-Faster RCNN | 0.789 | 0.842 | G-Faster RCNN | 0.776 | 0.819 | ||
| GC-Faster RCNN | 0.833 | 0.890 | GC-Faster RCNN | 0.753 | 0.792 | ||
| 20143 | Faster RCNN | 0.684 | 0.709 | 20341 | Faster RCNN | 0.730 | 0.778 |
| E-Faster RCNN | 0.692 | 0.747 | E-Faster RCNN | 0.707 | 0.770 | ||
| S-Faster RCNN | 0.790 | 0.816 | S-Faster RCNN | 0.799 | 0.834 | ||
| C-Faster RCNN | 0.802 | 0.845 | C-Faster RCNN | 0.867 | 0.900 | ||
| G-Faster RCNN | 0.799 | 0.831 | G-Faster RCNN | 0.847 | 0.882 | ||
| GC-Faster RCNN | 0.823 | 0.849 | GC-Faster RCNN | 0.853 | 0.887 | ||
| 20158 | Faster RCNN | 0.685 | 0.726 | 30023 | Faster RCNN | 0.670 | 0.759 |
| E-Faster RCNN | 0.778 | 0.817 | E-Faster RCNN | 0.760 | 0.816 | ||
| S-Faster RCNN | 0.799 | 0.836 | S-Faster RCNN | 0.799 | 0.845 | ||
| C-Faster RCNN | 0.860 | 0.891 | C-Faster RCNN | 0.816 | 0.850 | ||
| G-Faster RCNN | 0.872 | 0.904 | G-Faster RCNN | 0.844 | 0.883 | ||
| GC-Faster RCNN | 0.870 | 0.902 | GC-Faster RCNN | 0.847 | 0.847 | ||
| 20188 | Faster RCNN | 0.606 | 0.695 | 30067 | Faster RCNN | 0.625 | 0.665 |
| E-Faster RCNN | 0.689 | 0.745 | E-Faster RCNN | 0.595 | 0.633 | ||
| S-Faster RCNN | 0.748 | 0.814 | S-Faster RCNN | 0.698 | 0.713 | ||
| C-Faster RCNN | 0.831 | 0.865 | C-Faster RCNN | 0.681 | 0.724 | ||
| G-Faster RCNN | 0.812 | 0.852 | G-Faster RCNN | 0.716 | 0.750 | ||
| GC-Faster RCNN | 0.830 | 0.868 | GC-Faster RCNN | 0.720 | 0.726 | ||
| 20202 | Faster RCNN | 0.533 | 0.606 | 30106 | Faster RCNN | 0.713 | 0.739 |
| E-Faster RCNN | 0.609 | 0.661 | E-Faster RCNN | 0.828 | 0.833 | ||
| S-Faster RCNN | 0.685 | 0.725 | S-Faster RCNN | 0.818 | 0.825 | ||
| C-Faster RCNN | 0.727 | 0.779 | C-Faster RCNN | 0.869 | 0.868 | ||
| G-Faster RCNN | 0.732 | 0.785 | G-Faster RCNN | 0.864 | 0.870 | ||
| GC-Faster RCNN | 0.733 | 0.763 | GC-Faster RCNN | 0.874 | 0.876 | ||
| 20215 | Faster RCNN | 0.670 | 0.726 | ||||
| E-Faster RCNN | 0.746 | 0.786 | |||||
| S-Faster RCNN | 0.804 | 0.834 | |||||
| C-Faster RCNN | 0.837 | 0.880 | |||||
| G-Faster RCNN | 0.857 | 0.890 | |||||
| GC-Faster RCNN | 0.848 | 0.885 |
Disclaimer/Publisher’s Note: The statements, opinions and data contained in all publications are solely those of the individual author(s) and contributor(s) and not of MDPI and/or the editor(s). MDPI and/or the editor(s) disclaim responsibility for any injury to people or property resulting from any ideas, methods, instructions or products referred to in the content. |
© 2025 by the authors. Licensee MDPI, Basel, Switzerland. This article is an open access article distributed under the terms and conditions of the Creative Commons Attribution (CC BY) license (https://creativecommons.org/licenses/by/4.0/).
Share and Cite
Guan, B.; Wu, Y.; Zhu, J.; Kong, J.; Dong, W. GC-Faster RCNN: The Object Detection Algorithm for Agricultural Pests Based on Improved Hybrid Attention Mechanism. Plants 2025, 14, 1106. https://doi.org/10.3390/plants14071106
Guan B, Wu Y, Zhu J, Kong J, Dong W. GC-Faster RCNN: The Object Detection Algorithm for Agricultural Pests Based on Improved Hybrid Attention Mechanism. Plants. 2025; 14(7):1106. https://doi.org/10.3390/plants14071106
Chicago/Turabian StyleGuan, Bolun, Yaqian Wu, Jingbo Zhu, Juanjuan Kong, and Wei Dong. 2025. "GC-Faster RCNN: The Object Detection Algorithm for Agricultural Pests Based on Improved Hybrid Attention Mechanism" Plants 14, no. 7: 1106. https://doi.org/10.3390/plants14071106
APA StyleGuan, B., Wu, Y., Zhu, J., Kong, J., & Dong, W. (2025). GC-Faster RCNN: The Object Detection Algorithm for Agricultural Pests Based on Improved Hybrid Attention Mechanism. Plants, 14(7), 1106. https://doi.org/10.3390/plants14071106