Article

Phenotypic Diversity and Abiotic Stress Tolerance Among Vicia ervilia (L.) Willd. Accessions

by
Sofiya Petrova
1,
Tsvetelina Stoilova
1,
Valentin Velinov
2,
Irina I. Vaseva
2 and
Lyudmila Simova-Stoilova
2,*
1
Institute of Plant Genetic Resources “Konstantin Malkov” (IPGR), Agricultural Academy, Druzhba 2, 4122 Sadovo, Bulgaria
2
Institute of Plant Physiology and Genetics, Bulgarian Academy of Sciences, Acad. G. Bonchev Str. Bl 21, 1113 Sofia, Bulgaria
*
Author to whom correspondence should be addressed.
Plants 2025, 14(7), 1008; https://doi.org/10.3390/plants14071008
Submission received: 14 February 2025 / Revised: 14 March 2025 / Accepted: 18 March 2025 / Published: 24 March 2025
(This article belongs to the Section Plant Genetic Resources)

Abstract

:
Bitter vetch (Vicia ervilia L. Willd.) is an ancient Mediterranean legume, well adapted to dry climates, that has recently gained attention for its potential in organic farming and as a suitable source of bioactive compounds. This study analyzed the agrobiological variability of 12 bitter vetch accessions from the IPGR-Sadovo genebank in two-year field trials. Yield-related traits were recorded, and grains were assessed for protein, sugar, starch, free amino acids, phenols, and antitrypsin content. Statistical analyses included variance, correlation, cluster, principal component, and path-coefficient methods. Significant variation was observed in plant branching, pod and grain numbers, and grain weight per plant. Grain yield correlated strongly with pod number (r = 0.910**), grains per pod (r = 0.867**) and per plant (r = 0.965**), and pod size. Positive direct effects on grain yield had the traits germination−50% flowering, number of seeds per plant, height to first pod, and harvest index. An indirect impact was found for the number of pods per plant, number of seeds per pod, and seed starch content. Accessions formed four main clusters. BGR6207, B9E0168, and C3000003 showed high yield potential. C3000001, C3000003, C3000007, and C3000006 exhibited early maturity. C3E0118, C3000007, and C3000003 seeds had lower amounts of phenols. BGR13526 presented lower protein and antitrypsin but higher carbohydrate and phenol levels. Tolerance to moderate osmotic stress (150 mM NaCl or 10% Polyethylene glycol 6000) varied. BGR3052, BGR13526, and A3BM0178 were found to be resistant to both stressors, while accessions C3000001 and C3000007 were identified as sensitive to both adversities. C3000006 was determined as sensitive to salinity but resistant to drought, and BGR3051and C3000003 were relatively sensitive to drought but resistant to salinity. Root elongation and thinning were observed in half of the accessions as adaptive responses to stress. These findings highlight some of the advantages of the evaluated bitter vetch accessions for breeding and reintroduction into sustainable agricultural practices.

1. Introduction

Legumes (family Fabaceae) are an indispensable source of complete food and feed, as well as of bioactive substances such as protease inhibitors, lectins, phytates, tannins, phenols, flavonoids, and others [1]. The genus Vicia (vetch) consists of about 160 annual and perennial species distributed in Europe, Asia, and America, in regions with a temperate climate [2,3]. It includes important species such as Vicia ervilia L. (bitter vetch), Vicia narbonensis (Narbonne vetch), Vicia sativa subsp. sativa (common vetch), and Vicia villosa subsp. dasycarpa (woolly vetch), which are grown for livestock feed in non-tropical dry areas. Vetch (Vicia spp.) is a unique multipurpose legume that can produce quality forage and grain. It can be incorporated into crop rotations as nitrogen fixing spp. while allowing for forage grazing, haying, and seed collection. It is also used for green manure and as a cover crop in rotation with cereals to improve their yield and soil quality [4,5,6].
Bitter vetch (Vicia ervilia (L.) Willd.) is a diploid (2n = 14), predominantly self-pollinating annual plant species of the genus Vicia, one of the earliest domesticated crops of the Fertile Crescent and one of the oldest grain legumes grown in Southern Europe, Western and Central Asia, and Northern Africa [7]. Bitter vetch was used in the past for human nutrition, and today it is mainly used for fodder and as a fortifying supplement [8,9]. Bitter vetch is used by sheep for grazing in early spring [10,11], while the grain is added in the rations of ruminants [11,12] and non-ruminants [13] as a cheap source of protein. Bitter vetch seeds have high nutritional value due to their high carbohydrate (66.2%) and protein (20.1%) content [14]. This species is regarded as an alternative crop in the context of the ongoing climate changes and the needs of organic farming and sustainable agriculture [15,16,17]. Recently, increased attention has been paid to the evaluation and improvement of bitter vetch germplasm to serve its conservation and to promote its potential for medicinal applications. Significant anti-inflammatory, analgesic, anti-ulcerogenic, antihyperglycemic, and antiviral activities have been found in the ethanol extract of bitter vetch seeds [8]. Seed extracts have been found to exert antioxidative effects and have been shown to inhibit tumor cell proliferation [9]. Several applications of bitter vetch seeds were described in a comprehensive phyto-pharmacological review [18]. For example, in traditional ethno-medicine, whole plants or decoctions are used for the treatment of digestive system pathologies and allergies, rheumatic pains, as palliatives, aphrodisiacs, or as a tonic for general weakness. Being a relatively drought-tolerant crop [4,17,19,20], bitter vetch is particularly suitable for small farming systems in arid marginal areas with neither chemical nor water input, as well as for organic agriculture and for the diversification of feed protein sources [15,16].
Little is known about the mechanisms of adaptation of Vicia ervilia L. to osmotic stress, especially drought and salinity [21]. Vegetative, reproductive, and grain-filling stages are critical for a legume’s grain quality and yield [19,22]. A linear relation has been established between grain yield in Vicia sp. and total rainfall, with critical periods—the beginning of flowering to seed formation [4]. Drought has a major impact on phenology and yield and less impact on grain quality parameters [19]. In semiarid conditions, low soil moisture at sowing causes delayed and irregular seedling emergence and establishment, which negatively affects yield [23]. The germination ability under osmotic stress in laboratory tests has been associated with water stress tolerance in field conditions [23]. Phenotypic variation was registered among common vetch genotypes in drought stress conditions [24] as well as under salt stress [25].
Local landraces are considered as a valuable material for the development of new varieties adapted for grain production, especially in arid highlands [26] and under organic agricultural systems in Southern Europe [15]. The presence of numerous accessions of local forms in seed banks worldwide enables the conservation of the genetic diversity in bitter vetch, which can be used to produce new varieties with better nutritional and yield characteristics. El Fatehi et al. [27] reported a wide range of variation in traits related to emergence, phenology, morphology, and yield among 19 bitter vetch ecotypes from northwestern Morocco. Abbasi et al. [28] assessed the genetic diversity of 126 samples from the Iranian genebank using agronomic–morphological traits and divided them into three main clusters. Russi et al. [15] characterized twenty-two Italian landraces by agro-morphological analyses as valuable material for breeding for organic farming and the use of seeds as a partial replacement of soybean in animal diets. Livanios et al. [29] assessed the phenotypic diversity among 49 bitter vetch Greek landraces covering 24 agro-morphological traits and classified them into eight distinct groups on the basis of traits related to the reproductive phase and grain yield, pointing out the importance of conservation and the reintroduction of local forms in cultivation and in breeding programs.
In Bulgaria, bitter vetch was grown in the past largely for feed for domestic animals. With the mechanization of agriculture, its cultivation has drastically diminished. Now, this crop occupies only relatively small areas in the southern parts of the country, where it is grown mainly for medicinal purposes. Having in view the potential of bitter vetch as an alternative crop to meet future climate challenges and the needs of organic farming and sustainable agriculture [15,16,17], our efforts were directed towards better characterization of local forms for their reintroduction in current agricultural practices. During numerous expeditions organized by the Institute of Plant Genetic Resources, Sadovo (IPGR) in the region of Southern Bulgaria, when examining small and large farms, no new local forms of Vicia ervilia L. were found. Therefore, this study covered only local forms from the ex situ collection of the IPGR, as well as repatriated samples from the genebanks of Gatesleben, Germany, and the USDA, USA. A comprehensive assessment of agro-morphological, biochemical, and yield-related traits as well as characterization of sensitivity to abiotic stress were conducted on a collection of twelve local bitter vetch accessions in order to evaluate their genetic variability and stress tolerance, with the goal of identifying potential donor lines for the breeding and reintroduction of bitter vetch in current sustainable agricultural practices.

2. Materials and Methods

2.1. Plant Material and Experimental Design

Twelve bitter vetch accessions were used in this study (Table 1), eleven of which were of Bulgarian origin. Five plant materials were repatriated from the USDA Germplasm Collection, USA. Five accessions were from the ex situ collection of the Bulgarian genebank, one was collected from a farmer during an expedition, and one Bulgarian local population was obtained from the IPK Gatersleben genebank, Germany. The experiments were conducted at the experimental field of IPGR-Sadovo on cinnamon forest soil, after a precursor of wheat during the years 2022 and 2023.
The experimental site is situated at longitude 24°57′ N, latitude 41°90′ E, and a 158 m altitude. Sowing was carried out manually at the optimal time (at the end of February), according to the recommendations for the cultivation of bitter vetch. Only the C3E0118 accession (autumn form) was sown at the beginning of November. The temperature and rainfall regime of the experimental site during the growth cycle are presented in Table 2. The area of Sadovo is characterized by a transitional continental climate with frequent and prolonged droughts. During the period 2022–2023 (coinciding with the plant life cycle), the mean temperature was 15.66 °C and the mean precipitation was 61.83 mm. The years 2022 and 2023 differed in meteorological conditions, especially rainfall, but this did not affect the normal development or yield of the studied crop.
The assessment of the economic traits of the accessions was performed according to the common vetch (Vicia sativa L.) descriptor list [30] and descriptor list from the IPK Gatersleben genebank, due to the absence of a descriptor list for bitter vetch. The field experiment was set as Randomized Complete Block Design (RCBD) with three replications. The grains were sown in 4 row plots, 1.5 m in length, with 0.50 m between rows and 0.25 m between plants. The distance between two plots was 100 cm. Accessions were grown under rain-fed conditions, without fertilizers, herbicides, or pesticides, and were hand-weeded when necessary.

2.2. Measurements of Traits

Several morphological and agronomical traits were measured and assessed during the two experimental years. During the growth period, the following parameters were evaluated: the start date of flowering, the days to 50% flowering and days to 80% maturing, and the duration of the whole growth cycle. Measurements were taken on 10 plants randomly selected from each plot. The estimated traits are listed in Table 3.

2.3. Biochemical Analyses of Grain Quality

Grains collected from the field trials (10 g per accession) were ground in a mill to fine powder. Seed flour (aliquots of 100 mg) was extracted with 1 mL of ice-cold 80% ethanol for 1 h on an ice bath with sonication and periodical vortexing. After centrifugation for 30 min at 14 500 rpm, 4 °C, soluble sugar, free amino acids, and phenols were analyzed in the supernatant by spectrophotometric methods modified for 96-well microplates, as described by López-Hidalgo et al. [31]. The pellets were additionally incubated in 30% perchloric acid for 1 h at 60 °C, and after centrifugation the second supernatant was used for starch content determination. Anthrone reagent was applied for the analysis of soluble sugar or hydrolyzed starch at 625 nm, using a standard curve for glucose [32]. Amino acid content was estimated with ninhydrin reagent at 520 nm with a calibration curve prepared by mixing equimolar standard solutions of L-proline and L-glycine [33]. Phenolic content was determined with Folin–Ciocalteu reagent at 720 nm using caffeic acid for the standard curve [34]. Optical density was registered using a Multiscan Spectrum (Thermo electron corporation, Waltham, MA, USA). The results were based on four independent extractions.
Trypsin inhibitory activity (TIA) was measured in the supernatant after extraction of 20 mg seed flour with 1 mL of 10 mM HCl. The method of Kakade et al. [35] was applied, consisting of preincubation of bovine trypsin with varying volumes of extract and estimation of the residual enzyme activity with benzoyl-DL-arginine-p-nitroanilide as a substrate at 410 nm. One unit of TIA was defined in the extract volume, giving 50% inhibition of bovine trypsin activity. For total soluble protein content, seed flour (50 mg) was extracted with 100 mM Tris–HCl buffer pH 7.8 containing 150 mM NaCl for 1 h in an ice bath with sonication. After centrifugation, protein content in the supernatant was determined by the method of Bradford [36] at 595 nm, with Coomassie Brilliant Blue G 250 (Sigma-Aldrich, St. Luis, MO, USA) and a standard curve for bovine serum albumin. The results for TIA and total soluble protein were based on three independent extractions.

2.4. Germination Tests in Control and Stressful Conditions

Bitter vetch seeds were surface-sterilized for 3 min in 12% sodium hypochloride, abundantly washed with distilled water, and then put to germinate in Petri dishes (9 cm diameter) on two layers of filter paper, 20 seeds per dish, with three independent replicas for each condition and 12 mL of distilled water (controls) or the same quantity of osmotically active solution (10% w/v polyethylene glycol (PEG) 6000 or 150 mM NaCl). Petri dishes were kept at constant temperature (25 °C) in the dark, and germination progress was followed daily. Seedling fresh weight (without cotyledons) and root and shoot length were registered after 120 h of germination. Data on germination are mean values from three independent experiments carried out in June 2024. The following germination parameters were registered: G%—percentage of germinated seeds (radicle ˃ 2 mm) from the total seed number; RST-G%—relative stress tolerance, expressed as the ratio GS/GC, where GS is germination percentage under stress and GC is the germination of control seeds; VI—seedling vigor index, expressed as G% × FW (mean fresh weight of the seedlings for each condition, without cotyledon); and RST-VI—relative stress tolerance expressed as the vigor index ratio under stress/control conditions.

2.5. Data Analysis

The collected data were processed using variation analysis [37] by determining a sample mean, the minimum and maximum value, the range of variation, and the coefficient of variation of each trait. The degree of variability of the traits, represented by the coefficient of variation (CV%), was indicated according to [38] as follows: up to 7.0%—very low; 7.1–12.0%—low; 12.1–20.0%—average; 20.1–40.0%—high; and over 40.1%—very high. One-way ANOVA (analysis of variance) was used to compare accessions against the control variety Rodopi or treatments against the control in germination tests. The mean values (M) were compared using three Least Significant Difference (LSD) values—0.1%, 0.05%, and 0.01%—regarding the mean value of the standard.
The relationship between the grain yield and its indices as well as the impact of some biological and biochemical traits on the grain yield were determined using correlation and path coefficient analyses. A total of 20 traits were included in these analyses (Table 4).
Correlation coefficients were established according to [37]. A weak correlation was designated when the correlation coefficient (r) was less than 0.33; at “r” values between 0.33 and 0.66, medium correlation was assigned, and a strong one was identified at “r” ranging between 0.66 and 0.99. To identify the similarity and proximity of the studied Vicia ervilia genotypes, hierarchical cluster analysis was applied [39]. The Euclidean distance among groups was used as a measure of genetic similarity. In order to overcome the difference in the dimensions of the studied traits, data were standardized beforehand. The results of the clustering are presented graphically by a dendrogram, showing the sequence of unification of the objects and the formed clusters. The studied genotypes are divided into groups, depending on the behavior of their characterizing traits relative to the average values [40]. The direct and indirect effects on the productivity of plants were expressed using path analysis [41]. The study also used factor analysis, showing the distances between genes in the genome controlling structural elements of the yield [42]. All experimental data were processed statistically using computer software SPSS for Windows Version 19.0 (IBM SPSS Statistics 19 Product Version: 19.0.0) [43].

3. Results

3.1. Morphological Evaluation

The morphological evaluation of the studied accessions is presented in Table 5 (stems and leaves) and Table 6 (flowers, pods, and grains). In all accessions, the lower petals lacked serrations and the pods were erect. Plants from all accessions exhibited strong basal branching and, except C3000001, a bushy erect growth habit. In most of the accessions, except BGR3051, BGR3052, and BGR6207, there was no anthocyanin in the stem. The flower size was medium, except in BGR13526, which has relatively small flowers, and C3000007, which was characterized with larger ones. The leaves were complex, delicate, pinnate, composed of oblong leaflets, and without tendrils at the end. The color of the leaves was of varying intensity, which grouped them in three distinct categories—green (eight accessions), yellow-green (three accessions), and light green (one accession—B9E0168). Five accessions had an elliptical leaf shape, six had a narrowly elliptical shape, and one accession (C3000007) had a broad elliptical leaf shape. The majority of the accessions had an even-pinnate leaf type, with only four accessions having odd-pinnate leaves (Table 5).
The accessions with one to three flowers in an inflorescence predominated (Table 6). Two accessions (B9E0168 and C3000007) had more than three flowers in an inflorescence. The studied samples were divided into three groups according to the standard color—pure cream (two accessions), cream with brown stripes (five accessions), light purple (three accessions), and pink (two accessions—BGR3051 and BGR13526). According to the color of the wings, the studied lines were divided into two groups—creamy (10 accessions) and pink (2 accessions).
The shape of the grains split the studied genotypes into two variants—rounded-angular (five accessions) and spherical (seven accessions). The ground color of the grains grouped the accessions into three distinct types—grains that were reddish-gray (six accessions), reddish-brown (five accessions), and reddish green brown (one accession—C3000003). Only two accessions (C3000006 and C3000001) had dot patterns on the grain testa. Overall, the studied accessions presented considerable morphological variability.

3.2. Phenotypic Variation in the Studied Parameters

The variation in twenty quantitative traits—economic, biological, and biochemical ones (described in Table 4)—was statistically assessed. Variability data were compared with the variety Rodopi (accession A3BM0178), as it is currently the only Bulgarian bitter vetch variety maintained for the market.
The results of the phenotypic variation in traits in the studied bitter vetch accessions during the two-year experimental period are presented in Table 7 (yield structure) and Table 8 (phenology and grain biochemical composition).
Plant height variation at maturity ranged from 24.7 cm to 64.2 cm, with an average height of 45.6 cm. The height of the first pod setting had amplitude of variation from 7.7 cm to 30.8 cm, with an average height of 21.9 cm. The highest plant height and height of the first pod setting was found in accession B9E0168, and the lowest in C3000001. The number of branches per plant varied from 0.7 to 4.0, being 1.9 on average. Significant variation was also found among accessions in the total number of pods per plant. The average number of productive pods for all accessions was 68.2, varying from 25.5 to 159.3. The number of grains per pod ranged from 2.1 to 4.0 on average for the two-year period, and the highest number (4.0) was in accession C3000003. The number of grains per plant had a value of 144.4 on average. The average size of the pod for the study period was 16.9 mm in length and 4.3 mm in width. The length of the pod varied from 12.5 to 22.4 mm, and accession C3000003 was characterized with the biggest pod size. The average grain weight per plant for all the studied accessions was 5.3 g. The average weight of 100 grains was 3.6 g. The average values of the harvest index ranged from 11.3% to 57.2%. The obtained harvest index, averaged over the two years, shows that 41.6% of the accessions exceed the control variety Rodopi (Table 7). Data on the yield structure showed that accession C3000003 (variety Borina, Bulgaria) was distinguished with the highest number of branches, number of pods per plant, number of grains per pod and per plant, weight of the grains per plant, and biggest pod size. Local populations BGR3051 and BGR3052 presented the lowest values of these traits as well as the lowest weight of 100 grains and lowest harvest index. The highest 100-seed weight was registered for accession C3000006, followed by C3000001, C3000003 and B9E0168. The highest harvest index was found in C3000001, followed by C3000002 and C3000006. The results obtained for the control variety Rodopi were close to the average values for most of the yield traits.
For estimating variation in phenology, the autumn form C3E0118 was excluded from the calculations as an outlier (as it has a very long growth cycle of 210 days compared to 112 days for the control variety Rodopi). The average duration of the germination–mass flowering sub-period was 64.5 days. The shortest duration (41 days) was registered for accessions C3000001 and C3000006, and the longest (83 days) for accession B9E0168 (Table 8). The shortest duration of flowering (first–last flower) (6 days) was in the Russian variety BGR13526, and the longest (14 days) was in the control accession A3BM0178, followed by C3000003 (13 days). The average duration of this sub-period was 10.3 days (Table 8). The whole growth cycle for the studied accessions varied from 83 to 162 days, with an average duration of 97.5 days, the differences between the accessions being 33 days. The variation in this parameter was within smaller limits in the early-ripening accessions, and the opposite tendency was documented for the late-ripening ones. This indicated preservation of the trait as a varietal particularity. In four forms of local origin (C3000001, C3000003, C3000007, and C3000006), a growth cycle with the minimum number of days (83 days) was recorded on average for the period, while the maximum number of days (162) was registered in B9E0168 (a local population from the village of Kondolovo).
The data on the biochemical traits of seed quality of the studied bitter vetch accessions, averaged for the two experimental years, are presented in Table 8. The average value of seed protein was 93.48 mg·g−1 FW, varying from 85.7 to 105.8 mg·g−1 FW. The highest protein content was measured in the local line B9E0168 and in the control variety Rodopi, while the lowest values were estimated for C3000007, BGR3052, BRG13526, and C3000003. Nine of the accessions had a lower total protein content compared to the control, with statistically significant differences. Regarding soluble sugars, it can be noted that the control accession had a lower content than a large number of accessions for this trait (B9E0168, BGR3051, BGR3052, BGR13526, C3000002, C3000003, and C3000007). The lowest soluble sugar content in seeds was registered in accession C3000006, while the highest was found in BGR13526. Seed starch content had an average value of 563.19 mg·g−1 FW and CV 7.7%. Negative differences compared to the control were proven only for three of the evaluated accessions (C3000002, C3000007, and C3E0118). A significantly higher seed phenolic content was detected in BGR13526. In C3E0118, C3000003, and C3000007, this parameter was lower than the one of the control variety Rodopi. The free amino acid content was in the range 0.030–0.077 mg·g−1 FW. Its lowest values were detected in the control variety, while accession C3000003 had the highest levels of free amino acids. The content of antitrypsins varied in the limits 1.220–2.550 U·mg−1 FW. Significantly higher values were registered in accessions BGR3051, BGR3052, C3000002, and C3E0118, while lower antitrypsin content was found in accessions BGR13526 and BGR6207. Data on seed biochemical composition showed that accession C3000003 (variety Borina) was distinguished, with relatively low protein but higher free amino acid content; it also had a low level of phenolics in the seeds. The accession BGR13526 (Russian variety Krasnodarskaia) presented lower protein and higher soluble sugar, starch, and phenolic content. The control variety Rodopi had high protein and lower soluble sugar levels in the seeds.
The variation summary data of the studied economic, biological, and biochemical traits in the studied accessions are presented in Figure S1 (Supplementary Material). The following traits expressed the highest variation among accessions: number of main branches (CV 60.5%), number of pods (CV 59%) and of grains per plant (CV 63.6%), and weight of grains per plant (CV 67.7%). Traits with an average degree of variability were as follows: plant height (CV 23.8%), height to first pod (CV 33.7%), time from germination to 50% flowering (CV 22.6%), duration of flowering (CV 24.3%), soluble sugars (CV 21.4%), phenols (CV 26.3%), and the content of amino acids in the grain (CV 29.4%). Seed starch and soluble protein content showed low variability (CV 7.7% and 6.8%, respectively).

3.3. Correlation Between the Studied Economic, Biological, and Biochemical Traits

The positive and negative correlations between the evaluated economic, biological, and biochemical traits in bitter vetch accessions are listed in Table 9. Traits related to yield structure displayed several strong correlations. Strong positive correlations were observed between plant height and height to the first pod and the number of pods per plant and the number of grains per pod and per plant, as well as the weight of the grains per plant. The number of grains per pod was in strong positive correlation with the number and weight of the grains per plant, the pod size, the weight of 100 seeds, and in medium-strength positive correlation with the harvest index. The number of grains per plant was in strong positive correlation with pod size. The length of the pods had a strong positive correlation with 100-seed weight and width of the pod, and a medium positive one with the harvest index. The harvest index depended positively on plant height but negatively on the height to the first pod. A medium-strength negative correlation was established between the height to the first pod and the pod size, as well as the 100-seed weight. The only trait without any significant correlations with other yield traits was the number of branches per plant.
Plant phenology traits had no significant correlations with the traits related to yield structure. Among plant cycle-related traits, a strong positive correlation existed between germination–50% flowering days and the total growth cycle duration. A medium-strength negative correlation was observed between the duration of flowering and seed soluble sugar content. Biochemical traits presented only medium-strength correlations—positive between seed amino acid content and antitrypsin activity and negative between phenolic and amino acid seed content, phenols and antitrypsins, and starch content and antitrypsins. Soluble sugar content in seeds was in a medium-strength positive correlation with the height to the first pod, starch content with pod width, and the number of grains per pod with the free amino acid content in seeds.

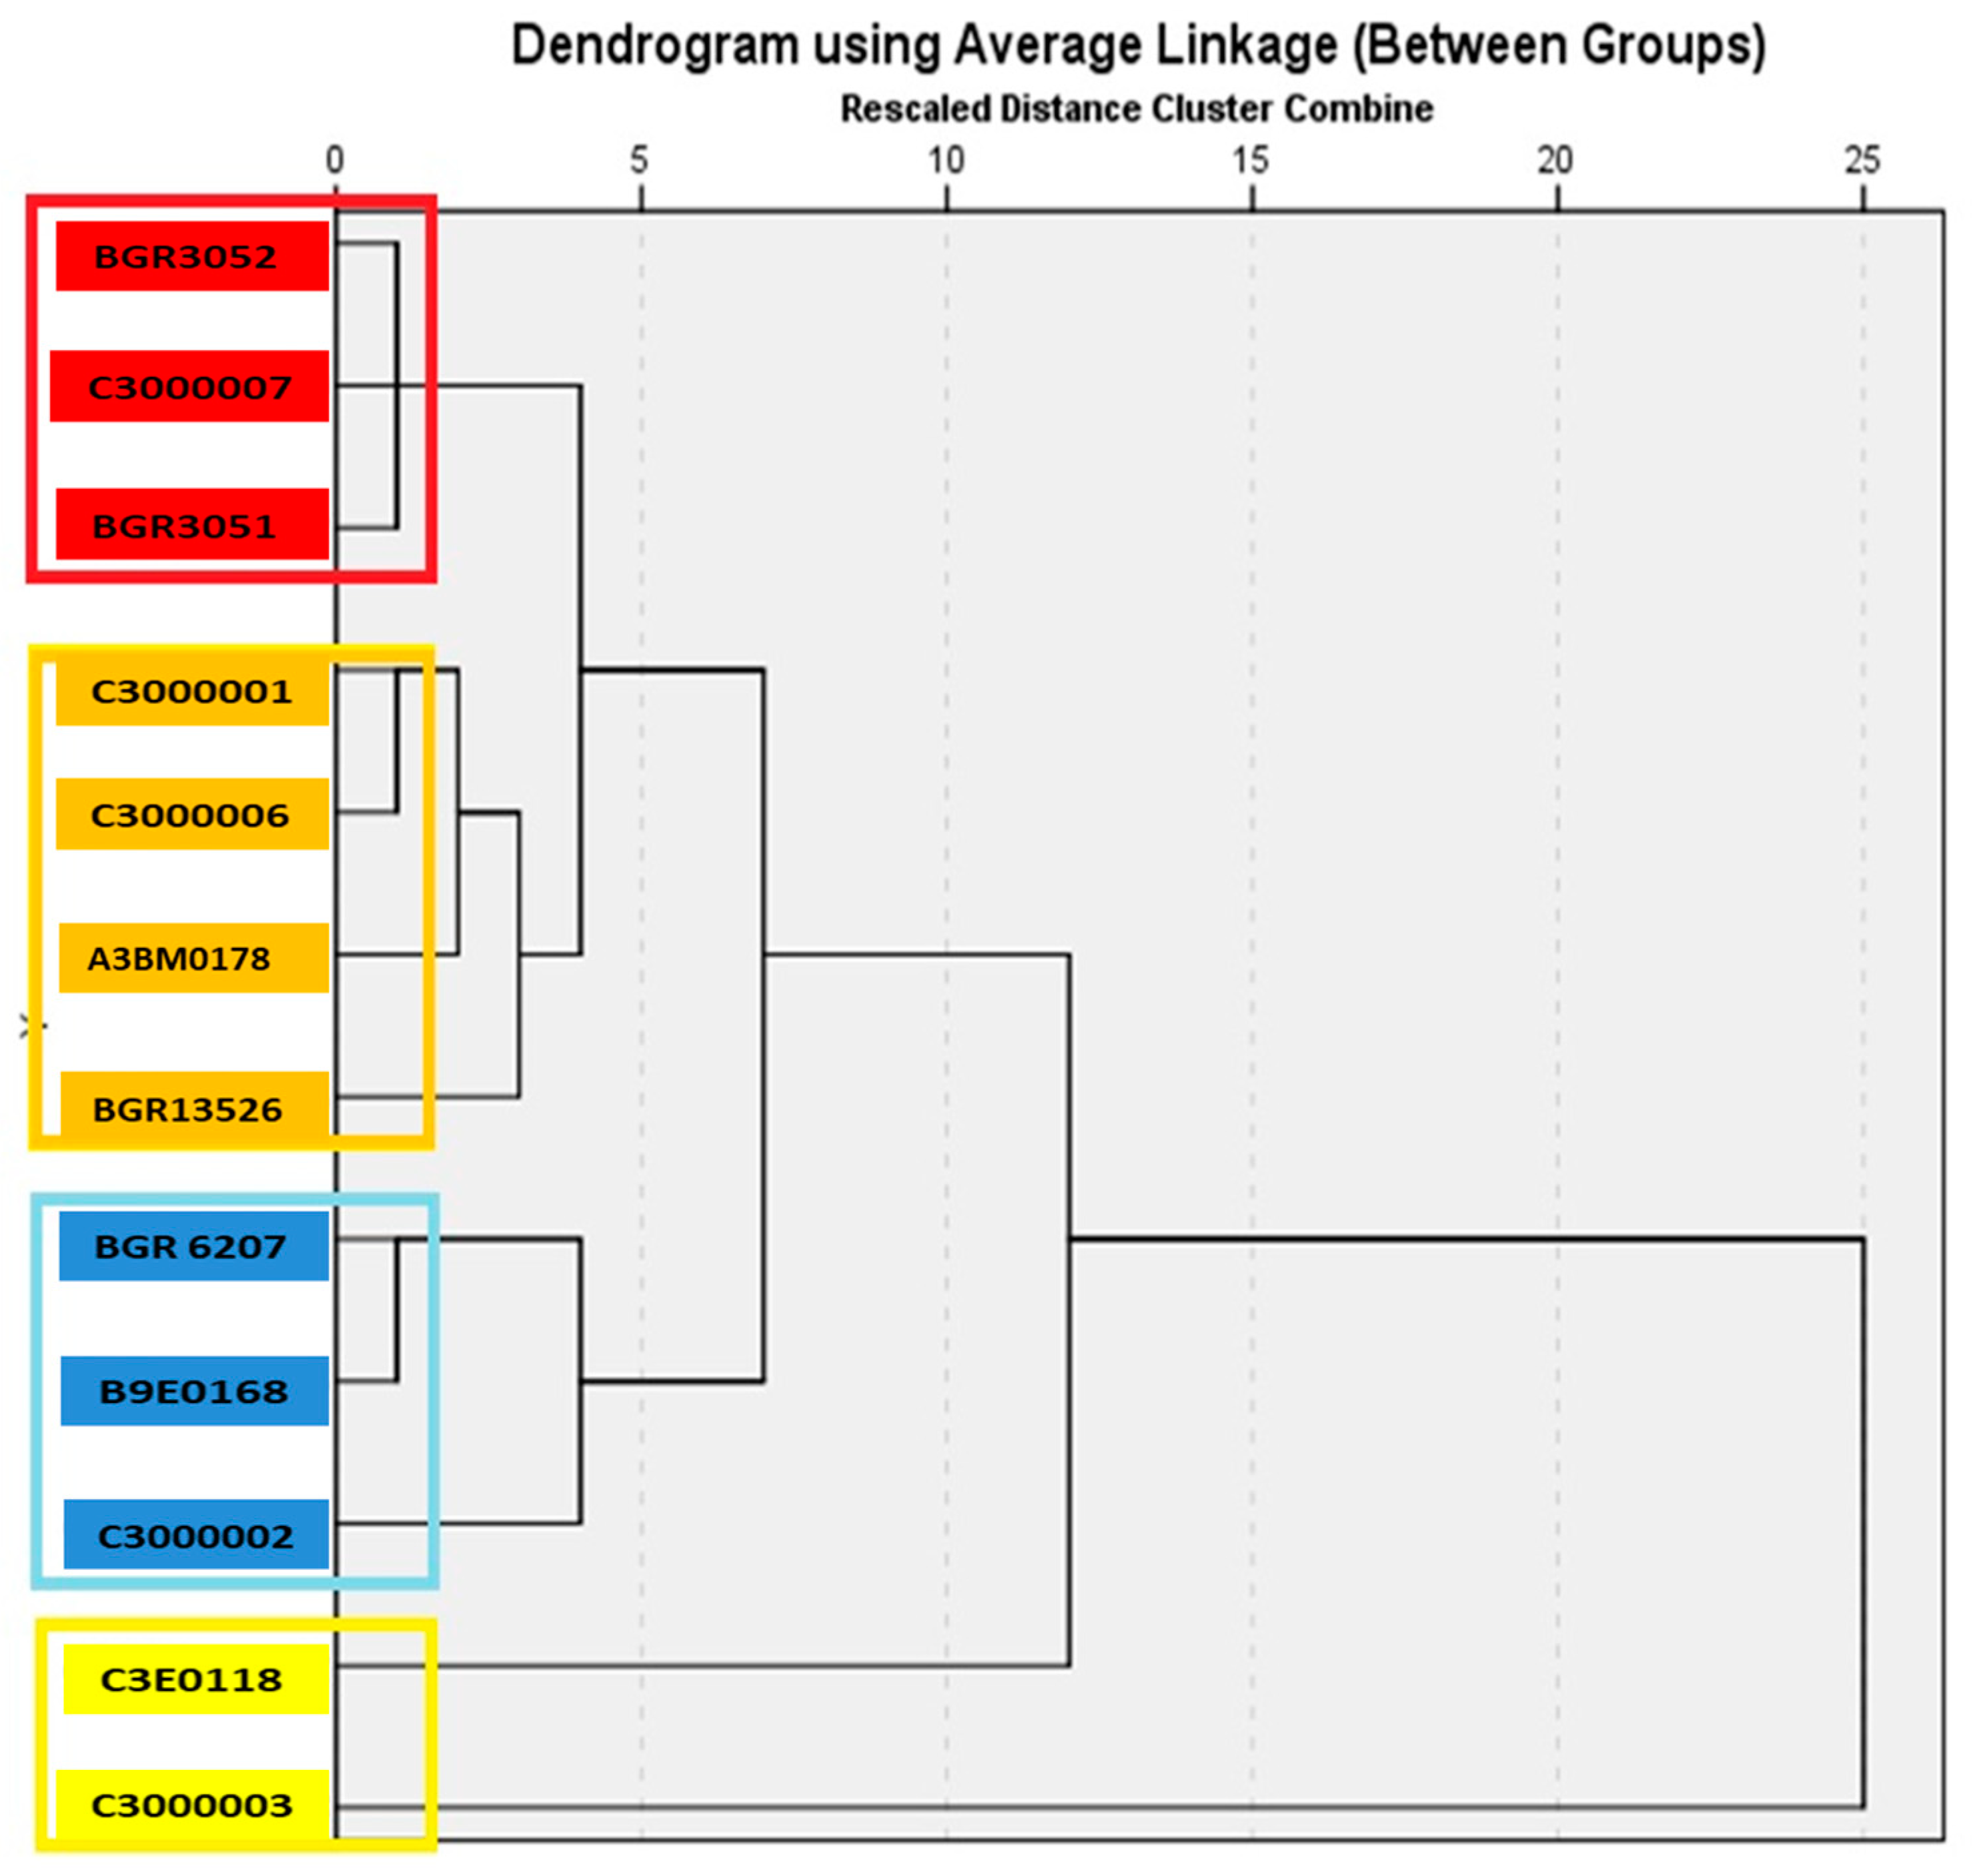
3.4. Hierarchical Cluster Analysis

The assessment of the genetic proximity between bitter vetch accessions was carried out through the complex comparison of twenty traits (Table 4). According to the analyzed characteristics, the studied bitter vetch accessions were grouped into four main clusters (Figure 1).
The first cluster is the smallest and includes two accessions—C3000003 (variety Borina) and C3E0118 (local population), which are genetically the most distant from the other accessions included in this study. Borina is distinguished by high average values for the traits number of main branches, number of pods and grains from one plant, number of grains in one pod and weight of grains from one plant, length and width of the pod, weight of 100 grains, and early maturity, and has significantly higher amounts of amino acids and soluble sugars, and less phenols in the grain. C3E0118 has a greater grain weight per plant, more branches, a smaller amount of starch and phenols in the grain, but higher amino acid content and increased antitrypsin activity.
Three accessions (B9E0168, BGR6207, and C3000002) are included in the second cluster. They have high average values for the traits plant height, number of branches, number of grains in one pod, weight of grains per plant, longer pods, weight of 100 grains, early maturity, and content of sugars and amino acids in the grain.
The third cluster includes 33.33% of the evaluated accessions, including the control variety Rodopi, the Russian variety Krasnodarskaya (BGR13526), and two breeding lines. Among them, there are accessions with the highest average values of the studied traits. For example, breeding line C3000001 has a harvest index of 57.2% and a growth cycle of 83 days. Another breeding line from this group, C3000006, has a weight of 100 grains of 4.6 g and also a short growth cycle of 83 days. The Russian variety Krasnodarskaya has relatively high contents of sugars, starch, and phenols. This cluster also includes the control variety Rodopi (A3BM0178), distinguished by high soluble protein content.
Three accessions of Bulgarian origin (BGR3051, BGR3052, and C3000007) are included in the fourth cluster. They have above-average values for the traits plant height, first pod set height, soluble sugar content, and antitrypsin activity in the grain.

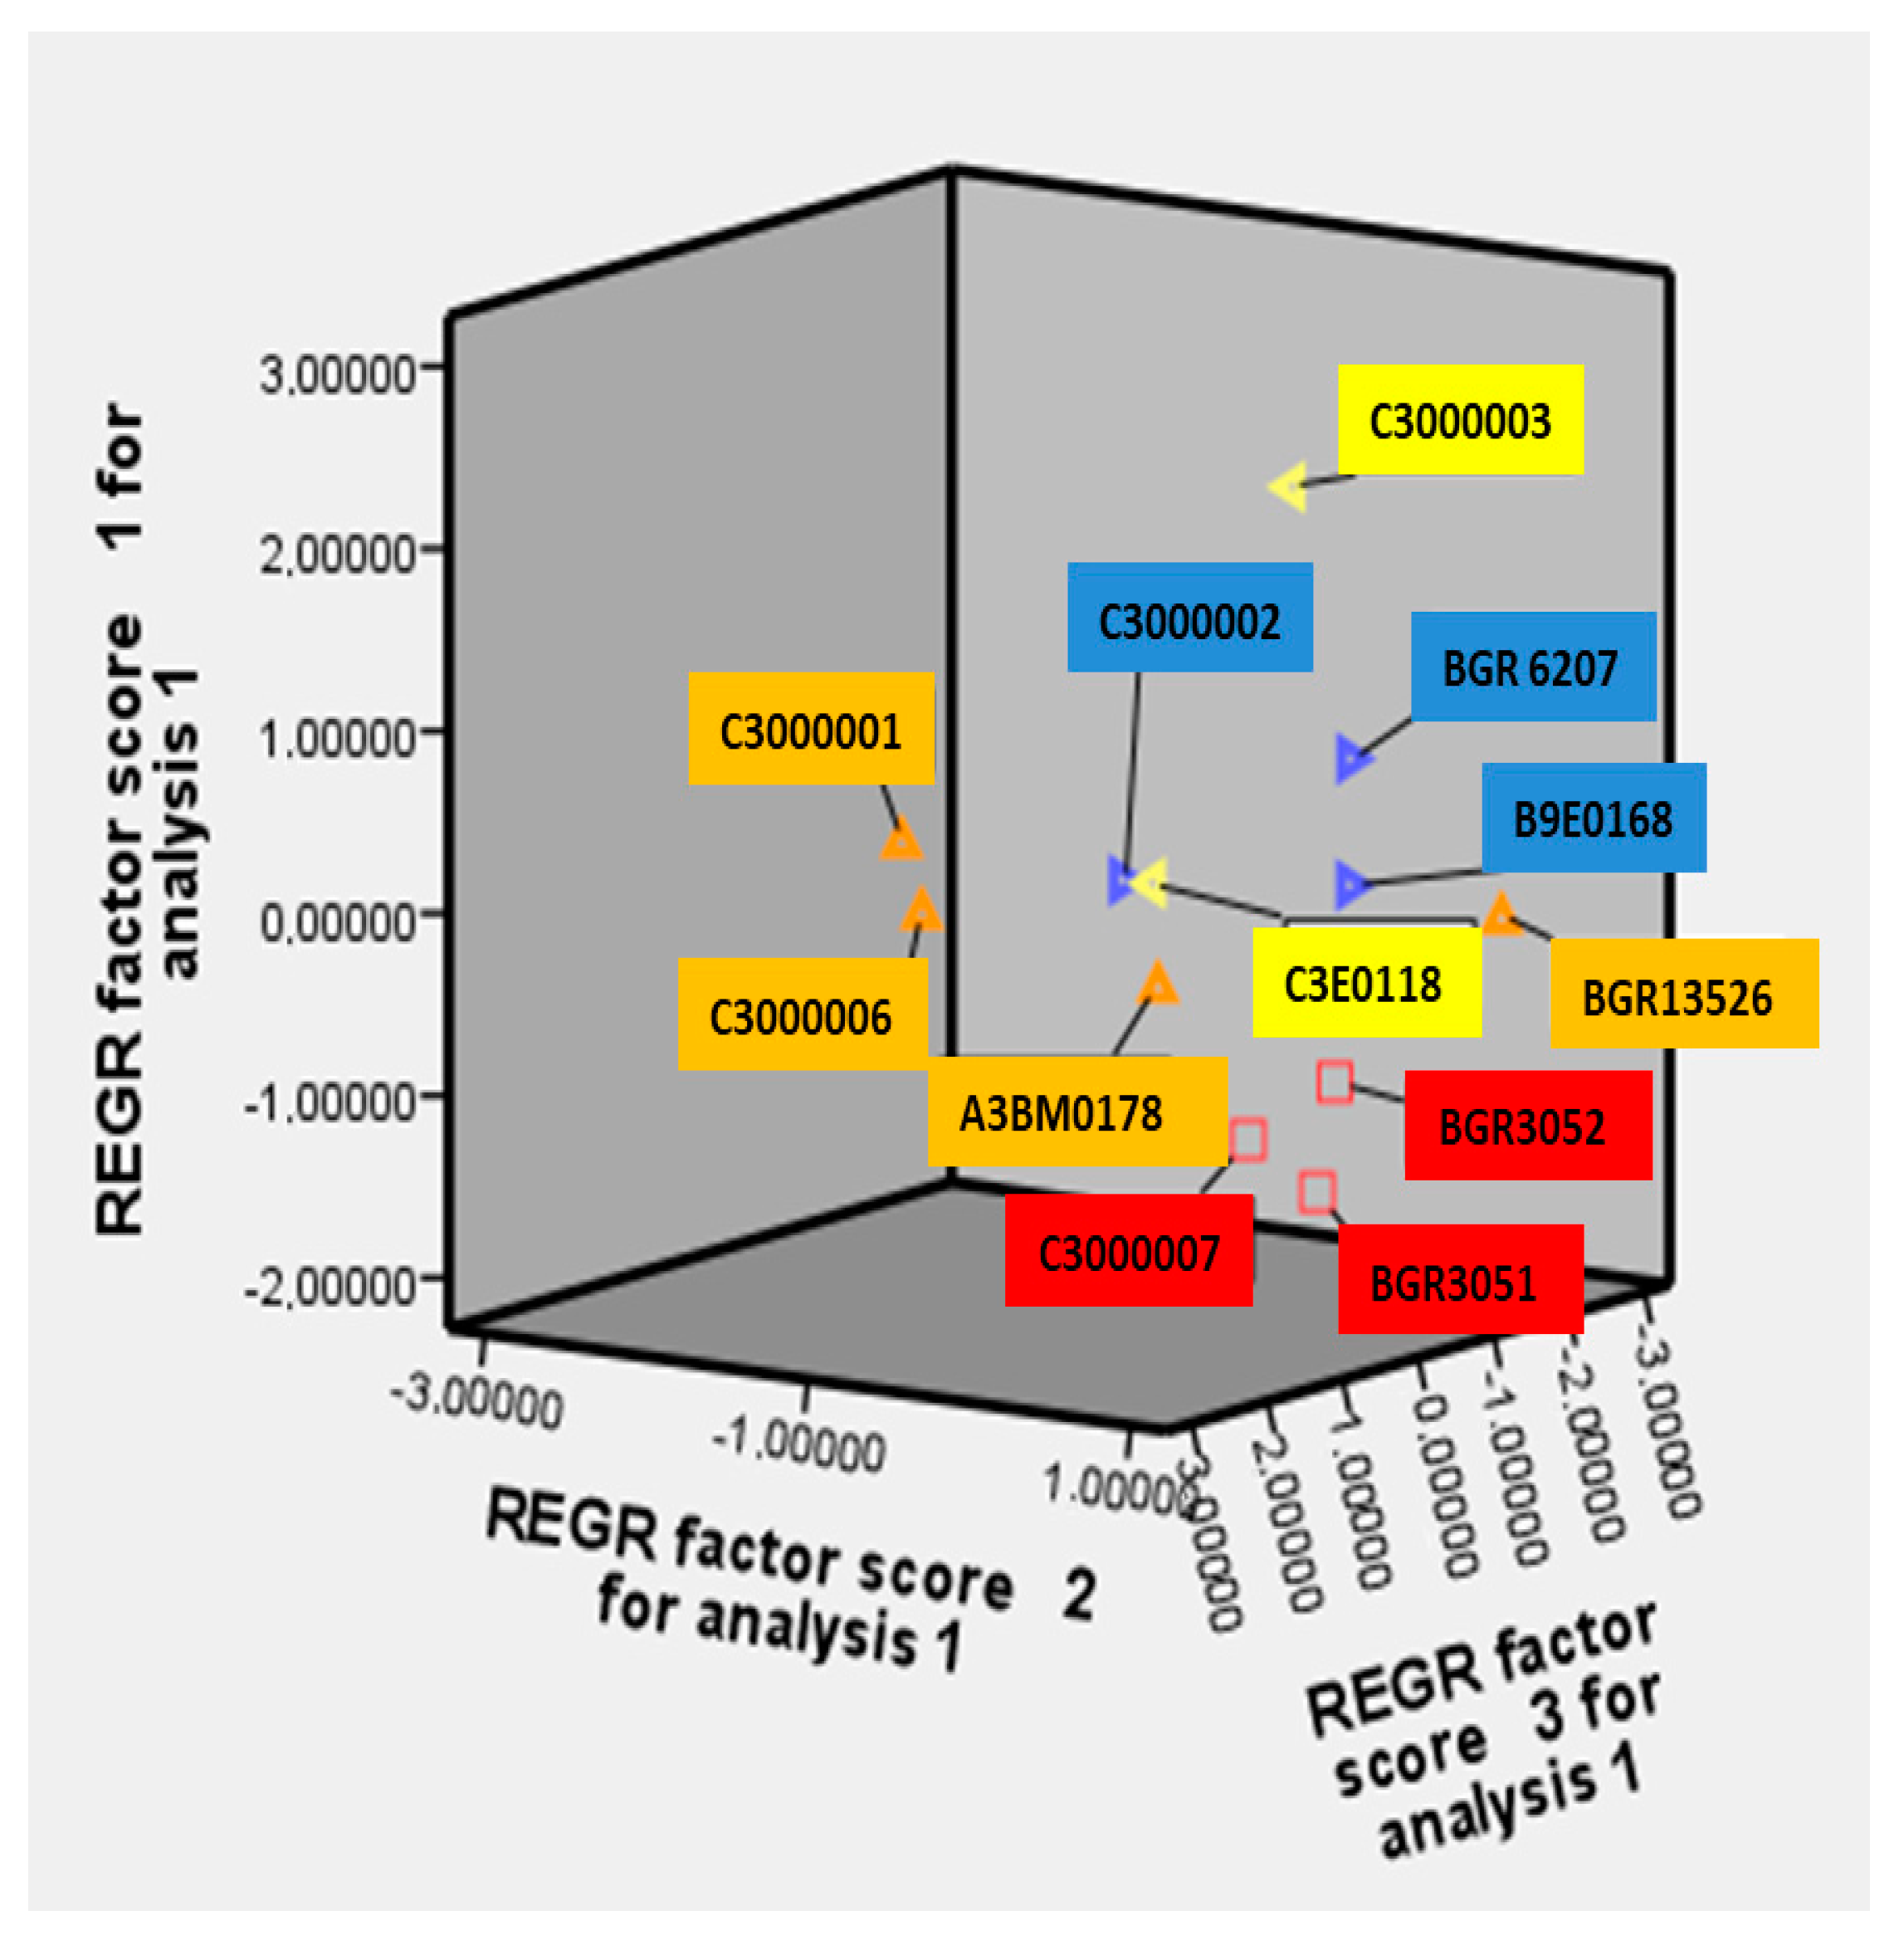
3.5. Principal Component Analysis (PCA)

PCA is a multivariate statistical technique for reducing a large number of correlated variables to a small number of principal factors. The values of the three components (PC1, PC2, and PC3) for each of the studied traits were calculated empirically (Table 10).
The analysis shows that the first component (PC1) explains 36.294% of the total variation, the second (PC2) 19.899%, and the third (PC3) 16.875%. The three factors together explain 73.068% of the total variation in the experiment, which is probably due to slightly lower levels of intrapopulation and higher levels of interpopulation diversity of the collection. This percentage illustrates the existence of complex interrelations between the studied traits. For example, the traits height to the first pod, number of pods per plant, number of grains per pod, number of grains per plant, weight of grains per plants, length of pod, width of pod, 100-grain weight, and harvest index are all related to the first component. The second component is in correlation with the traits germination–50% flowering, duration of flowering, growth cycle, starch, protein, phenols, and antitrypsin activity (Table 11). The remaining three traits—plant height, number of branches, and soluble sugars–are related to the third component.
The graphical representation of the studied traits illustrates their correlation within the frame of the studied twelve accessions (Figure S2). The results confirm the established correlation with high statistical significance and their distribution over the components PC1, PC2, and PC3. The distribution of the studied accessions in the coordinate system of PC1, PC2, and PC3 represents a grouping by similarity of the characteristics into one main group (Figure 2).
Several distinct “remote” accessions were positioned outside the group by this analytical approach. The accessions with numbers 9 (C3000001) and 11 (C3000006) fall into the negative quadrant of the first, second, and third factors, while the sample with number 8 (C3000003) falls in the negative quadrant of the third factor and in the positive part of the first and second factors (Figure 2 and Table S1). The Russian variety Krasnodarskaya with number 5 (BGR13526) is in the negative quadrant of the first and third factors and in the positive part of the second factor. The samples with numbers 9 (C3000001) and 11 (C3000006) are distinguished by short plants, a low setting of the first pod, a small number of branches, a large number of grains in one pod, a large number of grains from one plant, a large length and width of the pod, a high harvest index, short vegetation, few soluble sugars but more starch and amino acids in the grain, and increased antitrypsin activity. Sample 8 (C3000003) had the highest average values of traits, such as a high number of main branches and of pods and grains per plant, as well as a high number of grains in a pod, high weight of grains per plant, large length and width of the pod, high 100-grain weight, early maturity, higher amount of amino acids and soluble sugars, and less phenols in the grain. Sample 5 (BGR13526) has the highest content of sugars, starch, and phenols in the grain (Table S1). These accessions are also distinguished by a short growing season and are definitely of interest for hybridization according to individual characteristics and can be recommended as donors in the selection of bitter vetch.

3.6. Path Analysis of Productivity and Economic, Biological, and Biochemical Traits

With the help of path analysis, the direct and indirect effect of economic, biological, and biochemical traits on the grain productivity of a single plant can be traced. The following characteristics have the strongest direct influence on this trait: number of grains per plant (0.724); height to first pod (0.428); and harvest index (0.233) (Table 12). The number of pods per plant (0.698) and number of grains in one pod (0.566) have a strong indirect impact on the grain productivity of a single plant (Table 13).
The path analysis showed that the traits with higher positive direct effects on grain yield included germination–50% flowering, number of grains per plant, height to first pod, and harvest index, as well as amino acid, grain starch, and protein content. This implies that they can serve as indirect selection criteria to improve yield and the grain biochemical composition of bitter vetch.

3.7. Relative Stress Tolerance at Germination Stage

Information about the stress tolerance potential of the studied accessions could be additional selection criteria for including them in breeding programs. In preliminary experiments, we conducted a test with the control variety Rodopi, applying different concentrations of NaCl (75, 150, and 200 mM) and PEG 6000 (5, 10, and 15% w/v) to estimate the respective stress response and to select the most suitable stress parameters for comparative stress tolerance analyses among the accessions. The diminution in both germination rate and plant biomass was dependent on stress intensity (Figure S3). Under control conditions, the germination process of bitter vetch was almost completed after 48 h, with very fast radicle emergence in some of the accessions (C3000002, C3000003, C3E0118, and B9E0168). G% reached more than 50% in the first 24 h (Figure S4). The accessions BGR3051 and C3000006 had some germination issues, with relatively lower G% under control conditions. Diminished G% (Figures S5 and S6) and seedling vigor (Figures S7 and S8) was registered upon treatment with NaCl and PEG, with the most pronounced differences among accessions’ responses documented under moderate stress conditions. The vigor index was more severely affected by the applied stress than the germination rate. Moderate stress conditions were used for further comparison of the accessions in three independent experiments.
In Table 14 are presented the mean values for G%, VI, and RST for the studied bitter vetch accessions, measured after 120 h of germination in distilled water (controls), 10% PEG 6000, or 150 mM NaCl.
According to the calculated relative stress resistance regarding G% and VI, the following accessions were discerned: accessions sensitive to both types of stress (C3000001 and C3000007), resistant to both types of stress (BGR13526, BGR3052 and A3BM0178), and sensitive to salinity but resistant to drought (C3000006) and vice versa—relatively sensitive to drought but resistant to salinity (BGR3051 and C3000003).
The control variety Rodopi was relatively tolerant to drought stress. At moderate osmotic stress, significant elongation and thinning of the root is observed in half of the accessions as an adaptive reaction (Table 15). Accessions A3BM0178 and C3000003 presented root elongation under both PEG 6000 and NaCl stress. Accessions C3000001, C3000006, C3000007, and C3E0118 exhibited the same physiological reaction only when exposed to PEG treatment. Under salt stress conditions, accessions C3000001 and C3000007 had underdeveloped roots and arrested shoot development; therefore, they were not included in the measurements presented in Table 15. However, the observed root elongation under osmotic stress was not consistently related to genotype tolerance, as it was observed in some of the sensitive genotypes as well (accessions C3000001, C3000003, and C3000007). Also, some of the tolerant accessions (BGR13526 andBGR3052) did not show root elongation under osmotic stress.

4. Discussion

4.1. Phenotypic Variations Among the Studied Bitter Vetch Accessions

Evaluation of the phenotypic variations among bitter vetch local forms is a prerequisite for using some of them in breeding for desirable traits and reintroduction into agricultural practice. Our study established considerable variability among the studied traits in twelve bitter vetch accessions. The high genetic diversity in the studied collection is influenced by four highly variable traits (Table 7 and Table 8): number of main branches, number of pods and number of grains per plant, and weight of grains per plant. A high degree of variability was also presented for the following traits: height to the first pod, harvest index, time from germination to 50% flowering, and duration of flowering. Traits with an average degree of variability were the following: length of pod, 100-grain weight, growth cycle, and antitrypsin activity. The traits width of pod and starch content in the grain had a low degree of variability. Similar variability related to phenology, morphology, and yield was established by El Fatehi et al. [27]. Some of the evaluated traits are predominantly genetically determined, while others are highly influenced by environmental conditions. The accessions BGR3052, BGR6207, BGR13526, B9E0168, and C3000003 were distinguished by a high number of main branches per plant. This trait is genetically determined and is not significantly affected by fluctuations in the environmental conditions [44]. The correlation analysis (Table 9) did not reveal any relationship between the number of branches and the other studied traits. High-branching accessions could have different productivity—high (C300003), medium (BGR13526), and low (BGR3052).
Grain yield in bitter vetch is a quantitative trait that is influenced both by genetic factors and by changes in the environment. The number and the weight of the grains per plant, which are highly influenced by changes in the environmental conditions, are used as general traits for determining plant productive potential [4]. These traits showed the highest variability in the present study (Table 7). The harvest index depends on weather conditions, disease resistance, and agro-technical and stress factors [17]. The number of pods is also influenced by external conditions, pathogen attacks, the surface area of roots (which provide nutrients and water), and other morphological characteristics [45]. The experimental design of the present study involved comparative analyses of the tested accessions under the same environmental conditions. Therefore, the obtained results outline the accessions that exhibited high yield under local climatic conditions as potential candidates for utilization in selection programs.
According to the harvest index trait, five accessions, BGR6207, C3000002, C3000006, C3E0118, and C3000001, exceed the standard variety Rodopi. The average values of the harvest index in our study ranged from 11.3% to 57.2%. Similar intra-species variations in bitter vetch grain yield and harvest index were reported by other authors [28,29,46,47,48,49,50]. The presence of significant variation among genotypes for agro-morphological traits is indicative of the presence of a high degree of genetic variation useful for future selection, re-introduction, and/or utilization by breeding programs [29,51]. The formation of distinct clusters based on agro-morphological characteristics in local accessions of bitter vetch has also been established by other authors [28,52,53]. Saoub and Akash [4], by clustering of Jordanian vetch landraces, revealed that considerable variation for quantitative traits can exist between and within Vicia sativa and Vicia ervilia genotypes.
The duration of the entire growing period (germination–ripening) is determined both by hereditary characteristics and by environmental factors—temperature, humidity, light, etc. In our study, four accessions, C3000001, C3000003, C3000007, and C3000006, were distinguished by a short plant life cycle. Early-flowering accessions will be preferred in areas with temperate climates and low rainfall, while late-flowering forms will have higher yields in areas with high rainfall. Early flowering and pod maturity of accessions suggest that they could be used by farmers who require straw and grain for summer feeding. In addition, a shorter life cycle could favor plant reproduction in extreme climatic conditions. Two genotypes, BGR3051 and B9E0168, were distinguished by a long plant life cycle and harvest indices less than 30. Late-flowering accessions with harvest indices less than 0.30 would be suitable for spring grazing due to their long vegetative period [28]. Similar differences among bitter vetch accessions in the days from germination to the 50% flowering phase have also been reported in other studies [28,29,44,47]. The shortening or extension of this period depends on the sowing date. Later sowing usually corresponds to a shorter growing season due to the reduced time of the interphase periods [54,55]. The duration of the sub-period “germination–50% flowering” and the duration of the flowering period (first–last flower) depend on air temperature and humidity. Under cooler weather and optimal precipitation, these periods tend to be longer, while high temperatures and drought are factors that result in a relatively shortened plant life cycle. Thus, the duration of the growth cycle and the sub-periods germination–50% flowering and duration of flowering are inversely dependent on temperature and directly proportional to soil and air humidity. In our study, we established a strong positive correlation between the duration of the sub-period “germination–50% flowering” and the duration of the entire plant life cycle. However, no correlation was found between phenology traits and yield structure indices. Accessions with shorter or longer life cycles do not necessarily have an advantage in terms of productivity.
Seed biochemical composition added further variability among the studied bitter vetch accessions, discerning local forms with higher or lower protein content, higher or lower carbohydrate content, and a higher or lower level of phenols or antitrypsins, but these biochemical traits had no significant correlation with the studied yield related traits.

4.2. Yield Structure of the Studied Bitter Vetch Accessions

Indirect selection by characterizing yield-related elements can be more effective than direct selection by yield. Traditionally, correlation, regression, and path-coefficient analysis have been used to determine the relations between yield components and yield criteria in indirect selection [56,57,58]. The accessions BGR3051, BGR3052, BGR6207, BGR13526, B9E0168, C3000003, C3000007, and C3000002 were distinguished by taller plants. Plant height from a breeding point of view is an important trait for creating high-yielding varieties, with high grain quality, resistance to lodging, and suitability for mechanical harvesting [59]. The selection of bitter vetch is aimed at erect plants with reduced height in order to diminish or avoid damage from wind and rain, and these plants are therefore expected to be more resistant to lodging, as reported for other legume species [60,61]. The height of the first pod is of particular importance for mechanical harvesting [62]. According to our results, this trait is directly dependent on the total height of the plants. The number of pods on a plant correlated positively with the weight of the grains per plant, which defines it as an important trait for selection. The number of grains in a pod is a trait that has a certain role in the formation of the yield and is in a positive strong correlation with the weight of the grains per plant, which makes the trait very important for selection. The number of grains per plant determines the reproduction coefficient of the crop. It is related to the number of pods per plant and the number of grains in one pod. The correlation between the number and weight of grains per plant is particularly strong. Saoub and Akash [4], similarly to our results, established a strong correlation between grain yield and number of pods per plant and grain yield and number of grains per plant. The number of grains per plant is a very variable trait, which is strongly influenced by meteorological factors [17]. Very often, a larger number of grains in combination with a high 100-grain weight predetermine high productivity. In our study, such a potential was revealed in the old variety Borina (accession C3000003), which presented highest values of number of pods per plant, grains per pod, grains per plant, and size of pods, along with relatively high 100-seed weight. The size of the pod—length and width—is a trait that has a certain role in yield formation. The length and width of the pod are in a positive strong correlation with the number of grains per pod, which makes the trait very important for breeding. Factor analysis is a multivariate statistical technique for reducing a large number of correlated variables to a small number of principal factors [42]. The three factors together explain 73% of the total variation in our experiment, which is probably due to slightly lower levels of intrapopulation and higher levels of interpopulation diversity of the collection. Thus, our results for the traits related to the first principal component in the present study confirm previously published findings [17,28,29,63,64,65,66].

4.3. Stress Tolerance of the Studied Bitter Vetch Accessions

Screening for drought and/or salt tolerance at the germination stage has been suggested as a suitable approach to estimate large sets of germplasm for stress tolerance in general, as varieties tolerant to osmotic stress at germination were also considered to be drought-tolerant in field conditions [23]. Compared to other species of the genus Vicia, bitter vetch is less studied for stress tolerance at the germination stage [67]. Germinating Vicia faba L. has been predominantly tested in such analyses for establishing suitable grain priming protocols, highlighting the diverse response to priming among different varieties and species [67,68]. It has been reported that Vicia villosa Roth germinates well in a wide range of temperature (15–25 °C) and pH (5–10) variations, with a strong inhibition of germination at a pH below 4. This species exhibited salt tolerance but was relatively sensitive to osmotic stress [69]. Similar differential tolerance to these two osmotic stressors was reported by Perissé et al. [70]. In our study, we identified four distinct combinations in the response of Vicia ervilia L. accessions to moderate PEG osmotic stress and to salt stress—tolerance to both, sensitivity to both, tolerance to drought but sensitivity to salt, and tolerance to salt but sensitivity to drought stress. This divergent tolerance could be partially explained by the different nature of salt and drought stress, as salt stress adds ion toxicity to the osmotic effect [25]. Similar effects of osmotic stress on germination timing and percentage, as well as on seeding vigor, have been reported by other authors for bitter vetch [71] as well as for other legume species [23,72,73]. Generally, moderate osmotic stress exerts less negative effect on the germination rate but drastically reduces seedling vigor [73,74]. The mechanisms underlying the differential tolerance to salt and osmotic stress in some of the studied accessions and the correlation between stress tolerance at germination and at later plant growth stages (vegetative and reproductive) need further elucidation. However, the obtained information on the stress responses of the accessions under study could be a useful selection criterion for breeding purposes.

5. Conclusions

The results obtained from the analyses revealed a great diversity in important agro-morphological, economic, and biochemical characteristics, as well as in the drought and salt stress responses of the studied bitter vetch accessions, collected from the main areas of this geographic region that are historically known for the cultivation of this crop. The accessions BGR3051, BGR3052, BGR6207, BGR13526, B9E0168, C3000003, C3000007, and C3000002 exhibited a higher stem height compared to the control variety, without showing a tendency for lodging. Five of the accessions (BGR3051, BGR3052, BGR 6207, BGR13526, and B9E0168) had a significantly higher first pod setting than the control. Two accessions (BGR6207 and C3000003) had a large number of pods per plant, grains per pod, and grains per plant. Some of the accessions (BGR6207, BGR13526, B9E0168, C3000001, C3000002, C3000003, and C3000006) exhibited a significantly higher 100-grain weight compared to the control. Some accessions with a greater average weight of grains per plant for the study period stood out—BGR6207, C3000003, C3E0118, B9E0168, and C3000002. According to the harvest index averaged for the two years, five accessions (BGR6207, C3000002, C3000006, C3E0118, and C3000001) exceed the control variety Rodopi.
Accessions BGR6207, B9E0168, and C3000003 are characterized by a good yield potential, while the feature “earliness” was assigned to accessions C3000001, C3000003, C3000007, and C3000006. Accessions BGR3052, C3000006, C3000003, C3000001, C3000007, and C3000002 have demonstrated increased seed antitrypsin activity and reduced phenolic content. Accessions BGR3052, BGR13526, and A3BM0178 present a high tolerance to both drought and salt stress at the germination stage.
To develop varieties suitable for mechanized harvesting and that can serve as starting material for combinatory selection, the accessions BGR3051, BGR3052, BGR 6207, BGR13526, and B9E0168 could be recommended. Accessions BGR6207, C3000003, C3000002, and B9E0168 could be used as parental pairs in combinatory selection for high yield and productivity. The high frequency of highly significant variation among local forms for most of the studied traits highlights their excellent potential as a valuable bio resource for future breeding programs aimed at improving yield, its components, earliness, grain biochemical composition, and stress tolerance.

Supplementary Materials

The following supporting information can be downloaded at https://www.mdpi.com/article/10.3390/plants14071008/s1. Figure S1. Phenotypic variation in the studied parameters; Figure S2. Projection of the studied features in the PCA factor plane; Table S1. Weighted factors (PC1, PC2, and PC3) of the studied accessions; Figure S3. Germination in dependence on the stress intensity in bitter vetch variety Rodopi; Figure S4. Bitter vetch germination dynamics in control conditions; Figure S5. Bitter vetch G % in the studied accessions under osmotic stress (0, 10, 15, and 20% PEG 6000); Figure S6. Bitter vetch G % in the studied accessions under salt stress (0, 75, and 150 mM NaCl); Figure S7. Bitter vetch vigor index under osmotic stress (0, 10, 15, and 20% PEG 6000); Figure S8. Bitter vetch vigor index in the studied accessions under salt stress (0, 75, and 150 mM NaCl).

Author Contributions

Conceptualization, S.P. and L.S.-S.; methodology, S.P., V.V., and L.S.-S.; validation, T.S. and I.I.V.; investigation, S.P., V.V., and L.S.-S.; data curation, S.P.; writing—original draft preparation, S.P., I.I.V., and L.S.-S.; writing—review and editing, T.S.; visualization, S.P. and L.S.-S.; funding acquisition, T.S and L.S.-S. All authors have read and agreed to the published version of the manuscript.

Funding

This research was supported by the National Science Fund, Bulgaria, project KΠ-06-H36-2/2020, “Leguminous crops in Bulgaria—a source of useful additional proteinaceous substances”.

Data Availability Statement

The original contributions presented in this study are included in the article/Supplementary Materials.

Acknowledgments

We would like to thank the farmer Petko Angelov for providing the on-farm conserved bitter vetch material used in this study and IPK Gatersleben, USDA, and NPGS Germplasm Collection Genebanks for providing the ex situ material.

Conflicts of Interest

The authors declare no conflicts of interest.

References

  1. Champ, M.M.J. Non-nutrient bioactive substances of pulses. Brit. J. Nutr. 2002, 88 (Suppl. S3), 307–319. [Google Scholar] [CrossRef]
  2. Alkin, R.; Goyder, D.J.; Bisby, F.A.; White, R.J. Names and Synonyms of Species and Subspecies in the Viceae: Issue 3; University of Southampton: Hampshire, UK, 1986. [Google Scholar]
  3. Maxted, N. An Ecogeographical Study of Vicia subgenus Vicia. In Systematic and Ecogeographic Studies on Crop Genepools 8; Plant Genetic Resources Institute: Rome, Italy, 1995. [Google Scholar]
  4. Saoub, M.H.; Akash, W.M. Variations among two vetch landrace species in Jordan. J. Food Agricult. Environ. 2012, 10, 763–767. [Google Scholar]
  5. Christiansen, S.; Bounejmate, M.; Bahhady, F.; Thomson, E.; Mawlawi, B.; Singh, M. On-farm trials with forage legume-barley compared with fallow-barley rotation and continuous barley in north-west Syria. Exp. Agric. 2000, 36, 195–204. [Google Scholar] [CrossRef]
  6. Jones, M.J.; Singh, M. Long-term yield patterns in barley-based cropping systems in Northern Syria. 2. The role of feed legumes. J. Agric. Sci. 2000, 135, 237–249. [Google Scholar] [CrossRef]
  7. Zohary, D.; Hopf, M.; Weiss, E. Domestication of Plants in the Old World; Oxford University Press: Oxford, UK, 2012; 264p, ISBN 9780199549061. [Google Scholar]
  8. Okba, M.M.; Abdel Jaleel, G.A.; Yousif, M.F.; El Deeb, K.S.; Soliman, F.M. Vicia ervilia L. seeds newly explored biological activities. Cogent Biol. 2017, 3, 1299612. [Google Scholar] [CrossRef]
  9. Vioque, J.; Giron-Calle, J.; Torres-Salas, V.; Elamine, Y.; Alaiz, M. Characterizion of Vicia ervilia (bitter vetch) seed protein, free amino acide, and polyphenols. J. Food Biochem. 2020, 44, e13271. [Google Scholar] [CrossRef]
  10. Abd El-Moneim, A.M.; Ryan, J. Forage legumes for dryland agriculture in Central and West Asia and North Africa. In Challenges and Strategies for Dryland Agriculture; Rao, S.C., Ryan, J., Eds.; Book series CSSA Special Publications, 32; Crop Science Society of America. American Society of Agronomy: Madison, WI, USA, 2004; pp. 243–256. [Google Scholar] [CrossRef]
  11. Haddad, S.G. Bitter vetch grains as a substitute for soybean meal for growing lambs. Livest. Sci. 2006, 99, 221–225. [Google Scholar] [CrossRef]
  12. Abdullah, Y.; Muwalla, M.M.; Qudsieh, R.I.; Titi, H.H. Effect of bitter vetch (Vicia ervilia) seeds as a replacement protein source of soybean meal on performance and carcass characteristics of finishing Awassi lambs. Trop. Anim. Health Prod. 2010, 42, 293–300. [Google Scholar] [CrossRef]
  13. Sadeghi, G.H.; Mohammadi, L.; Ibrahim, S.A.; Gruber, K.J. Use of bitter vetch (Vicia ervilia) as feed ingredient for poultry. World Poult. Sci. J. 2009, 65, 51–63. [Google Scholar] [CrossRef]
  14. Petkova, Z.Y.; Antova, G.A.; Angelova-Romova, M.Y.; Petrova, A.; Stoyanova, M.; Petrova, S.; Stoyanova, A. Bitter vetch seeds (Vicia ervilia L.)—A valuable source of nutrients. Bulg. Chem. Commun. 2020, 52, 12–15. [Google Scholar] [CrossRef]
  15. Russi, L.; Acuti, G.; Trabalza-Marinucci, M.; Porta, R.; Rubini, A.; Damiani, F.; Cristiani, S.; Dal Bosco, A.; Martuscelli, G.E.; Bellucci, M.; et al. Genetic characterisation and agronomic and nutritional value of bitter vetch (Vicia ervilia), an under-utilised species suitable for low-input farming systems. Crop Past. Sci. 2019, 70, 606–614. [Google Scholar] [CrossRef]
  16. Parisi, G.; Tulli, F.; Fortina, R.; Marino, R.; Bani, P.; Dalle Zotte, A.; De Angelis, A.; Piccolo, G.; Pinotti, L.; Schiavone, A.; et al. Protein hunger of the feed sector: The alternatives offered by the plant world. Ital. J. Anim. Sci. 2020, 19, 1204–1225. [Google Scholar] [CrossRef]
  17. Boukrouh, S.; Noutfia, A.; Moula, N.; Avril, C.; Louvieaux, J.; Hornick, J.L.; Chentouf, M.; Cabaraux, J.F. Characterisation of bitter vetch (Vicia ervilia (L.) Willd) ecotypes: An ancient and promising legume. Exp. Agricult. 2024, 60, e19. [Google Scholar] [CrossRef]
  18. Salehi, B.; Abu-Reidah, I.M.; Sharopov, F.; Karazhan, N.; Sharifi-Rad, J.; Akram, M.; Daniyal, M.; Khan, F.S.; Abbaass, W.; Zainab, R.; et al. Vicia plants—A comprehensive review on chemical composition and phytopharmacology. Phytother. Res. 2021, 35, 790–809. [Google Scholar] [CrossRef]
  19. Basheer-Salimia, R.; Aloweidat, M.Y.; Al-Salimiya, M.A.; Hamdan, Y.A.S.; Sayara, T.A.S. Comparative study of five legume species under drought conditions. Legume Res. 2021, 44, 712–717. [Google Scholar] [CrossRef]
  20. Abdi, H.; Taheri, M.T.; Alizadeh, K.; Shahbazi, S. Investigating the Phenotypic Diversity of Vetch (Vicia L.) Genotypes from Different Species Under the Rain-fed Conditions of Maragheh City. Taxon. Biosystemat. 2023, 15, 19–34. Available online: https://tbj.ui.ac.ir/article_27554.html (accessed on 13 February 2025). (In Persian).
  21. Çöçü, S.; Uzun, O. Germination, seedling growth and ion accumulation of bitter vetch (Vicia ervilia (L.) Willd.) lines under NaCl stress. Afr. J. Biotechnol. 2011, 10, 15869–15874. [Google Scholar] [CrossRef]
  22. Firincioǧlu, H.K. A comparison of six vetches (Vicia spp.) for developmental rate, herbage yield and grain yield in semi-arid central Turkey. Grass Forage Sci. 2014, 69, 303–314. [Google Scholar] [CrossRef]
  23. Muscolo, A.; Sidari, M.; Anastasi, U.; Santonoceto, C.; Maggio, A. Effect of PEG-induced drought stress on seed germination of four lentil genotypes. J. Plant Interact. 2014, 9, 354–363. [Google Scholar] [CrossRef]
  24. Abbasi, A.; Mohammadi Nargesi, B.; Keshavarz Niya, R.; Ghorbanpour, E. The study of genetic variation of common vetch (Vicia sativa L.) based on morphological traits under normal and stress conditions. Iran. J. Field Crop Sci. 2014, 44, 359–370. (In Persian) [Google Scholar] [CrossRef]
  25. Benidire, L.; Daoui, K.; Fatemi, Z.A.; Bouarab, L.; Oufdou, K. Effect of salt stress on germination and seedling growth of Vicia faba L. J. Mat. Environ. Sci. 2015, 6, 840–851. (In French) [Google Scholar]
  26. Keatinge, J.D.H.; Ali, A.; Roidar Khan, B.; Abd El Moneim, A.M.; Ahmad, S. Germplasm Evaluation of Annual Sown Forage Legumes under Environmental Conditions Marginal for Crop Growth in the Highlands of West Asia. J. Agron. Crop Sci. 1991, 166, 48–57. [Google Scholar] [CrossRef]
  27. El Fatehi, S.; Bena, G.; Filali-Maltouf, A.; Ater, M. Variation in yield component, phenology and morphological traits among Moroccan bitter vetch landraces Vicia ervilia L. Willd. Afr. J. Agric. Res. 2014, 9, 1801–1809. [Google Scholar] [CrossRef]
  28. Abbasi, M.R.; Vaezi, S.; Baghaie, N. Genetic diversity of bitter vetch (Vicia ervilia) of the National Plant Gene Bank of Iran based on agro-morphological traits. Iran. J. Rangelands Forests Plant Breed. Genet. Res. 2007, 15, 113–128. (In Persian) [Google Scholar] [CrossRef]
  29. Livanios, I.; Lazaridi, E.; Bebeli, P.J. Assessment of phenotypic diversity in bitter vetch (Vicia ervilia (L.) Willd.) populations. Genet. Resour. Crop. Evol. 2017, 65, 355–371. [Google Scholar] [CrossRef]
  30. International Union for the Protection of New Varieties of Plants. Common Vetch (Vicia sativa L.) Guidelines for the Conduct of Tests for Distinctness Uniformity and Stability; International Union for the Protection of New Varieties of Plants: Geneva, Switzerland, 2011. [Google Scholar]
  31. López-Hidalgo, C.; Meijón, M.; Lamelas, L.; Valledor, L. The rainbow protocol: A sequential method for quantifying pigments, sugars, free amino acids, phenolics, flavonoids and MDA from a small amount of sample. Plant Cell Environ. 2021, 44, 1977–1986. [Google Scholar]
  32. Hansen, J.; Møller, I.B. Percolation of starch and soluble carbohydrates from plant tissue for quantitative determination with anthrone. Analyt. Biochem. 1975, 68, 87–94. [Google Scholar] [CrossRef]
  33. Moore, S.; Stein, W.H. A modified ninhydrin reagent for the photometric determination of amino acids and related compounds. J. Biol. Chem. 1954, 211, 907–913. [Google Scholar] [CrossRef]
  34. Ainsworth, E.A.; Gillespie, K.M. Estimation of total phenolic content and other oxidation substrates in plant tissues using Folin-Ciocalteu reagent. Nat. Protoc. 2007, 2, 875–877. [Google Scholar] [CrossRef]
  35. Kakade, M.L.; Rackis, J.J.; McGhee, J.E.; Puski, G. Determination of trypsin inhibitor activity of soy products: A collaborative analysis of an improved procedure. Cereal Chem. 1974, 51, 376–382. [Google Scholar]
  36. Bradford, M.M. A Rapid and Sensitive Method for the Quantification of Microgram Quantities of Protein Utilizing the Principle of Protein-Dye Binding. Analyt. Biochem. 1976, 72, 248–254. [Google Scholar] [PubMed]
  37. Lidanski, T. Statistical Methods in Biology and Agriculture; Zemizdat: Sofia, Bulgaria, 1988; 160p. (In Bulgarian) [Google Scholar]
  38. Arora, J.S. Chapter 20—Additional Topics on Optimum Design. In Introduction to Optimum Design, 3rd ed.; Academic Press: Cambridge, MA, USA, 2012; pp. 731–784. ISBN 9780123813756. [Google Scholar] [CrossRef]
  39. Ward, J.H. Hierarchical grouping to optimize an objective function. J. Amer. Stat. Assoc. 1963, 58, 236–244. [Google Scholar] [CrossRef]
  40. Rachovska, G.; Dimova, D. Evaluation of selection effectiveness for productivity in mutant populations of common bread wheat. Bulg. J. Agric. Sci. 2002, 8, 473–478. [Google Scholar]
  41. Williams, W.A.; Jones, M.B.; Demment, M.W. A concise table for path analysis statistics. Agron. J. 1990, 82, 1022–1024. [Google Scholar] [CrossRef]
  42. Cattel, R.B. Factor analysis: An introduction to essentials. I. The purpose and underlying models. Biometrics 1965, 21, 190–215. [Google Scholar] [CrossRef]
  43. IBM Corp. IBM SPSS Statistics for Windows, Version 19.0; IBM Corp: Armonk, NY, USA, 2009. [Google Scholar]
  44. Larbi, A.; Abd El Moneim, A.M.; Nakkoul, H.; Jammal, B.; Hassan, S. Intra-species variations in yield and quality determinants in Vicia species: 1. bitter vetch (Vicia ervilia L.). Anim. Feed. Sci. Technol. 2011, 65, 278–287. [Google Scholar] [CrossRef]
  45. Mihov, M.; Atanasova, D.; Mekhanjiev, A. Advances in productivity and stress resistance selection in chickpea (Cicer arietinum L.). Sci. Work. Nat. Acad. Sci. 2005, 3, 150–157. [Google Scholar]
  46. Abd El-Moneim, A.M. Agronomic potential of three vetches (Vicia spp.) under rainfed conditions. J. Agron. Crop Sci. 1993, 170, 113–120. [Google Scholar] [CrossRef]
  47. Seydoșoğlu, S.; Saruhan, V.; Kokten, K. Researches on determination yield and yield components of some bitter vetch (Vicia ervilia (L.) Willd.) genotypes in ecological conditions of Diyarbakır. Gaziosmanpaşa Üniversitesi Ziraat Fakültesi Derg. 2015, 32, 107–115. [Google Scholar]
  48. Turk, M. Effects of sowing rate and irrigation on dry biomass and grain yield of bitter vetch (Vicia ervilia) and narbon vetch (Vicia narbonensis). Indian J. Agic. Sci. 1999, 69, 438–443. Available online: https://epubs.icar.org.in/index.php/IJAgS/article/view/26807 (accessed on 13 February 2025).
  49. Ayan, I.; Acar, Z.; Basaran, U.; Asci, O.O.; Mut, H. Determination of forage and grain yields of some Vicia ervilia L. lines in Samsun ecological conditions. OMÜ Ziraat Fakültesi Derg. 2006, 21, 318–322. [Google Scholar]
  50. ICARDA. IRAN/ICARDA collaboration, Highlights of Achievements 2005–2006; ICARDA and Agricultural Research and Education Organization, Ministry of Jihad-e-eAgriculture, Islamic Republic of Iran (AEERO), Project Report; International Center for Agricultural Research in the Dry Areas: Aleppo, Syria, 2008; pp. 47–49. [Google Scholar]
  51. Mekonnen, F.; Mekbib, F.; Kumar, S.; Ahmed, S.; Sharma, T.R. Agromorphological traits variability of the ethiopian lentil and exotic genotypes. Adv. Agric. 2014, 2014, 870864. [Google Scholar] [CrossRef]
  52. Fotovat, R.; Moghadam, M.; Bozorgzadeh, M. Study of genetic diversity of bitter vetch landraces. In Proceedings of the 5th National Iranian Crop Science Congress, University of Tehran, Tehran, Iran, 31 August–4 September 1998; pp. 67–68. [Google Scholar]
  53. Hassanpour, F.; Sahhaf, R.S. Genetic variation in some Iranian bitter vetch (Vicia ervilia L.) landraces based on agronomic-morphological traits for use in breeding program in Rafsanjan. Genet. Resour. Crop. Evol. 2020, 67, 2087–2100. [Google Scholar] [CrossRef]
  54. Sachanski, S. Study on the Biological Requirements and Economic Qualities of Some Annual Leguminous Fodder Plants. Ph.D. Thesis, Publication of the NGO for Cattle and Sheep Breeding, Sofia, Bulgaria, Institute of Forages, Pleven, Bulgaria, 1983. [Google Scholar]
  55. Ganeva, D.; Angelova, S.; Kostov, K.; Matsov, B. Results of studying a collection of overwintering varieties and forms of fodder pea. Plant Sci. 1985, 22, 46–53. [Google Scholar]
  56. Dewey, D.I.; Lu, K.H. A Correlation and Path-Coefficient Analysis of Components of Crested Wheatgrass Grain Production. Agron. J. 1959, 51, 515–518. [Google Scholar] [CrossRef]
  57. Yücel, D.; Anlarsal, A.E.; Yücel, C. Genetic variability, correlation and path analysis of yield and yield components in chickpea (Cicer arietinum L.). Turk. J. Agric. Forestry 2006, 30, 183–188. Available online: https://journals.tubitak.gov.tr/agriculture/vol30/iss3/2/ (accessed on 13 February 2025).
  58. Tu, B.; Zhang, Q.; Liu, X.; Yu, S.; Xu, N.; Liu, J.; Liu, C. Agronomic and pod traits in relation to pod shattering in cultivated soybeans. Czech J. Genet. Plant Breed. 2025, 61, 2. [Google Scholar] [CrossRef]
  59. Podolska, G. Plant lodging, effects, and control. In Encyclopedia of Agrophysics; Glin’ski, J., Horabik, J., Lipiec, J., Eds.; Part of the series encyclopedia of Earth Sciences Series; Springer: Berlin/Heidelberg, Germany, 2014; pp. 609–610. [Google Scholar] [CrossRef]
  60. Warkentin, T.; Smykal, P.; Coyne, C.J.; Weeden, N.; Domoney, C.; Bing, D.; Leonforte, T.; Zong, X.; Dixit, G.; Boros, L.; et al. Pea (Pisum sativum L.). In Handbook of Plant Breeding 10: Grain Legumes; De Ron, A., Ed.; Springer Science and Business Media: New York, NY, USA, 2015; pp. 37–83. [Google Scholar] [CrossRef]
  61. Kujur, A.; Upadhyaya, H.D.; Bajaj, D.; Gowda, C.L.L.; Sharma, S.; Tyagi, A.K.; Parida, S.K. Identification of candidate genes and natural allelic variants for QTLs governing plant height in chickpea. Sci. Rep. 2016, 6, 27968. [Google Scholar] [CrossRef]
  62. Kuzbakova, M.; Khassanova, G.; Oshergina, I.; Ten, E.; Jatayev, S.; Yerzhebayeva, R.; Bulatova, K.; Khalbayeva, S.; Schramm, C.; Anderson, P.; et al. Height to first pod: A review of genetic and breeding approaches to improve combined harvesting in legume crops. Front. Plant Sci. 2022, 13, 948099. [Google Scholar] [CrossRef]
  63. Siwale, J.; Labuschagne, M.; Gerrano, A.S.; Mbuma, N.W. Phenotypic Diversity and Characterization of the Southern African Bambara Groundnut Germplasm Collection for Grain Yield and Yield Components. Agronomy 2022, 12, 1811. [Google Scholar] [CrossRef]
  64. Gil, J.; Cubero, J.I. Multivariate analysis of the Vicia sativa L. aggregate. Bot. J. Linn. Soc. 1993, 113, 389–400. [Google Scholar] [CrossRef]
  65. Terzopoulos, P.J.; Kaltsikes, P.J.; Bebeli, P.J. Collection, evaluation and classification of Greek populations of faba bean (Vicia faba L.). Genet. Resour. Crop. Evol. 2003, 50, 373–381. [Google Scholar] [CrossRef]
  66. Firincioǧlu, H.K.; Ünal, S.; Erbektas¸, E.; Doǧruyol, S.U.L. Relationships between grain yield and yield components in common vetch (Vicia sativa ssp. sativa) populations sown in spring and autumn in central Turkey. Field Crop. Res. 2010, 116, 30–37. [Google Scholar] [CrossRef]
  67. Moghaddam, S.S.; Pourakbar, L.; Rahimi, A.; Jangjoo, F. Mitigation of salinity effects by salicylic acid priming on germination and physiological characteristics of bitter vetch (Vicia ervilia L.). Yuzuncu Yil Univ. J. Agricult. Sci. 2021, 31, 98–110. [Google Scholar] [CrossRef]
  68. Kka, N.M.; Sharif, K.N.; Mohammed, S.F.; AbdulHamid, K.A. Interactions between Halopriming and Hormopriming in Regulating the Vegetative Growth and Grain Quality of Vicia faba L. Basrah J. Agricult. Sci. 2022, 35, 1–23. [Google Scholar] [CrossRef]
  69. Yang, C.; Sun, R.; Lu, X.; Jin, T.; Peng, X.; Zhang, N.; Wang, J.; Wang, H.; Liu, W. Seed germination ecology of Vicia villosa Roth, a cover crop in orchards. Agronomy 2022, 12, 2488. [Google Scholar] [CrossRef]
  70. Perissé, P.; Arias, C.V.; Nogués, M.S. Germination, hydrotime and isotopic analysis of Vicia villosa Roth. under water and salinity stress. AgriScientia 2021, 38, 89–101. [Google Scholar] [CrossRef]
  71. Hojjat, S.S.; Hornyak, L.G. TiO2 Nanoparticle Improve germination and seedling parameters and enhance tolerance of bitter vetch (Vicia ervilia L.) plants under salinity and drought stress. Nanotechnol. Russ. 2022, 17, 411–419. [Google Scholar] [CrossRef]
  72. Aydinoğlu, B.; Shabani, A.; Safavi, S.M. Impact of priming on seed germination, seedling growth and gene expression in common vetch under salinity stress. Cell. Molec. Biol. 2019, 65, 18–24. [Google Scholar] [CrossRef]
  73. Pratap, V.; Sharma, Y.K. Impact of osmotic stress on seed germination and seedling growth in black gram (Phaseolus mungo). J. Environ. Biol. 2010, 31, 721–726. Available online: http://jeb.co.in/journal_issues/201009_sep10/paper_29.pdf (accessed on 13 February 2025).
  74. Tlahig, S.; Bellani, L.; Karmous, I.; Barbieri, F.; Loumerem, M.; Muccifora, S. Response to salinity in legume species: An insight on the effects of salt stress during seed germination and seedling growth. Chem. Biodivers. 2021, 18, e2000917. [Google Scholar] [CrossRef]
Figure 1. Dendogram for 12 bitter vetch (Vicia ervilia L.) accessions clustered by the average linkage method using economic, biological, and biochemical traits. The accessions on a yellow background are from the first cluster; those with a blue background are from the second cluster; those with an orange background are from the third cluster; and those with a red background are from the fourth cluster.
Plants 14 01008 g001
Figure 2. Distribution of the studied accessions in the factor plane. The accessions on a yellow background are from the first cluster; those on a blue background are from the second cluster; those on an orange background are from the third cluster; and those on a red background are from the fourth cluster.
Plants 14 01008 g002
Table 1. Passport information of the tested Vicia ervilia (L.) accessions.
AccessionNameBiological StatusOriginSource
A3BM0178RodopiVarietyBulgarianIPGR genebank
BGR3051 Local populationBulgarianIPGR genebank
BGR3052 Local populationBulgarianIPGR genebank
BGR 6207 Local populationBulgarianIPGR genebank
BGR13526KrasnodarskaiaVarietyRussianIPGR genebank
C3000001CPI 10385Breeding lineBulgarianUSDA, USA genebank
C3000002SH B7-3-3-1Breeding lineBulgarianUSDA, USA genebank
C3000003BorinaVarietyBulgarianUSDA, USA genebank
C3000006B92-198Breeding lineBulgarianUSDA, USA genebank
C3000007B92-200Breeding lineBulgarianUSDA, USA genebank
C3E0118 Local populationBulgarianUstrem village, Topolovgrad
B9E0168 Local populationBulgarianIPK Gatersleben genebank
Table 2. Meteorological data at the experimental region during plant life cycle.
7 Feb–7 March8 March–5 April6 April–
4 May
5 May–
2 June
3 June–
1 July
2–31 July
Year 2022
Minimum temp. (°C)−0.733.985.3910.1415.5115.53
Maximum temp. (°C)9.1011.3618.2725.4727.7931.32
Mean temp. (°C)4.956.7114.0119.5323.0025.65
Rainfall (mm)62.809.5053.1069.80116.50116.50
Year 2023
Minimum temp. (°C)−0.512.696.7010.4414.4218.09
Maximum temp. (°C)11.1914.5116.5720.2626.7732.81
Mean temp. (°C)6.339.5512.5416.3322.0727.20
Rainfall (mm)17.0044.0031.2078.8080.2062.50
Table 3. Morphological and agronomical traits studied in the accessions of bitter vetch.
TraitAbbreviationClasses
Vegetative phase
Serration of lower leavesSLL1: serrate; 2: dentate; 3: entire
Stem anthocyaninsSA1: absent; 2: present
Plant BranchingPB1: strong basal; 2: only in the upper part
Presence of tendrilsPT1: absent; 2: present
Presence of leavesPL1: absent; 2: present
Leaves colorLC1: yellow green; 2: green; 3: light green
Leaves shapeLSh1: narrow elliptic; 2: elliptic; 3: broad elliptic; 4: narrow ovate; 5: ovate; 6: broad ovate
Type of leavesTL1: even pinnate; 2: odd pinnate; 3: acacia-like leaflets
Growth habitGH1: bushy; 2: tall
Reproductive phase
Flowering durationFDRecord at the beginning to end of flowering (days)
Flower: color of standard and wings FCS/
FCW
1: white; 2: creamy; 3: greenish; 4: pink; 5: reddish; 6: carmine; 7: light violet;
8: violet; 9: dark violet; 10: brown
Number of flowers in one inflorescence NFI1: one; 2: one or two; 3: two; 4: two or three; 5: three or more
Flower sizeFS1: small; 2: medium; 3: large
Pod traits
Pod shatteringPShat1: non-shattering; 2: shattering
Pod shapePSh1: straight; 2: slightly curved; 3: markedly curved
Pod length and widthPL, PWThe observations on well-developed green pods; the width is assessed from suture to suture on unopened pods.
Seed traits
Ground color of testaGCT1: yellow; 2: green; 3: yellow and green; 4: yellow to greenish gray; 5: green-grey to brown-grey; 6: reddish brown-grey; 7: dark brown, brownish-yellow; 8: carmine
Pattern of the seeds PS0: absent; 1: present
Color of pattern of testaCPT0: absent; 1: violet; 2: brown; 3: violet and brown
Seeds shape SSh1: round, globular; 2: roundish-angular; 3: angular to compressed; 4: angular; 5: wrinkled; 6: granular surface
Grain yield
Height to the first pod HFPRecord at the height of first pod/ten plants per accession
Number of pods/plant NPPRecord number of harvested pods/ten plants per accession
Number of grains/pod NGPRecord number of seeds per pod/ten plants per accession
Number of grains/plant NGPlRecord number of grains per plant/ten plants per accession
Weight of grains/plant WGPlRecord weight of grains per plant//ten plants per accession
100-seed weight (g)SWRecord the mass of 100 randomly taken seeds per accession
Harvest index (%)HIgrain yield/total biomass × 100
Table 4. List of the twenty traits evaluated by correlation, cluster, PCA, and path analyses.
TraitAbbreviationUnit s
Economic traits—Yield structure
Plant heightPlHcm
Height to the first podHFPcm
Number of branchesNB
Number of pods per plantNPPl
Number of grains per podNGP
Number of grains per plantNGPl
Weight of grains per plantsWGPlg
Length of podPLmm
Width of podPWmm
100-seed weightSWg
Harvest index,HI%
Biological traits—phenology
Germination–50% floweringG-Fldays
Duration of floweringDFldays
Growth cycleGCdays
Biochemical traits—seed components
Soluble proteinPrmg·g−1 FW
Soluble sugarsSSmg·g−1 FW
StarchStmg·g−1 FW
PhenolsPhemg·g−1 FW
Free amino acidsAAsmg·g−1 FW
Antitrypsin activityATU·mg−1 FW
Table 5. Morphological evaluation of bitter vetch accessions—growth habit, stem, and leaves.
AccessionAnthocyaninsGrowth HabitPlant Branching Leaf ColorLeaf ShapeType of Leaf
A3BM0178nobushystrongly from the basegreennarrow ellipticeven pinnate
BGR3051yesbushystrongly from the basegreennarrow ellipticodd pinnate
BGR3052yesbushystrongly from the basegreennarrow ellipticeven pinnate
BGR6207yesbushystrongly from the basegreennarrow ellipticodd pinnate
BGR13526nobushystrongly from the basegreennarrow ellipticeven pinnate
C3000001notallonly in the upper partgreenellipticeven pinnate
C3000002nobushystrongly from the basegreenellipticeven pinnate
C3000003nobushystrongly from the baseyellow greenellipticeven pinnate
C3000006nobushystrongly from the baseyellow greenellipticodd pinnate
C3000007nobushystrongly from the basegreenbroad ellipticodd pinnate
C3E0118nobushystrongly from the baseyellow greenellipticeven pinnate
B9E0168nobushystrongly from the baselight greennarrow ellipticeven pinnate
Table 6. Morphological evaluation of bitter vetch accessions—flowers and grains.
AccessionFlower
Size
Flowers in InflorescenceFlowers: Color of StandardFlowers: Color of WingsGrain
Shape
Ground Color of TestaTesta
Pattern
A3BM0178medium1–2creamycreamyroundish-angularreddish brownno
BGR3051medium2–3pinkpinkroundish-angularreddish grayno
BGR3052medium2–3creamy brown streakscreamyroundish-angularreddish grayno
BGR6207medium1–2creamy brown streakscreamyroundish-angularreddish brownno
BGR13526small1–2pinkpinkround-globularreddish brownno
C3000001medium1–2creamy brown streakscreamyround-globularreddish browndots
C3000002medium2–3light violetcreamyround-globularreddish grayno
C3000003medium2–3light violetcreamyround-globularreddish green brownno
C3000006medium1–2creamy brown streakscreamyround-globularbrownish graydots
C3000007large3 or morelight violetcreamyround-globularreddish grayno
C3E0118medium2–3creamy brown streakscreamyround-globularreddish grayno
B9E0168medium3 or morecreamycreamyroundish-angularreddish brownno
Table 7. Yield structure of the studied bitter vetch accessions, averaged for the years 2022 and 2023.
AccessionPlant
Height, cm
Height to
First pod, cm
Number
of Branches
Number of Pods/PlantNumber of Grains/PodNumber of
Grains/Plant
Weight of Grains/PlantSize of Pod100-Seed Weight,
g
Harvest
Index, %
Length, mmWidth, mm
MDMMDMMDMMDMMDMMDMMDMMDMMDMMDMMDM
A3BM017841.3 19.8 1.0 73.2 2.8 137.2 4.0 14.7 4.3 3.3 37.2
BGR305150.79.4***30.710.8***1.20.232.8−40.3***2.1−0.7***55.0−82.2***1.1−2.9***12.5−2.3***3.9−0.4***2.2−1.1***11.3−26.0***
BGR305250.08.7***28.18.3***3.62.6***25.5−47.7***2.80.049.6−87.6***1.2−2.9***14.2−0.53.9−0.4***2.6−0.8***19.8−17.5***
BGR 620757.015.8***24.04.2**2.01.0**10531.3***3.30.5***22689.2***9.05.0***18.84.1***4.40.14.00.7***41.13.9*
BGR1352646.85.6**24.64.8**3.42.4***41.4−31.8***2.80.063.3−73.9**2.3−1.717.62.8***4.50.23.80.5***24.1−13.1***
B9E016864.222.9***30.811.0***1.70.7*97.524.3*2.90.119457.0**6.22.1*16.31.5**4.2−0.14.10.8***26.4−10.8***
C300000243.32.117.7−2.21.30.365.3−7.83.30.5***18042.86.22.2*18.33.6***4.50.23.90.6***42.04.8*
C300000345.74.4*20.00.24.03.0***15986.2***4.01.2***367230.2***139.4***22.47.6***5.00.7***4.10.8***31.8−5.4**
C300000124.7−16.6***7.7−12.2***1.30.350.3−22.83.20.4***131−6.26.72.7**20.05.3***4.50.24.41.0***57.220.0***
C300000747.36.1**27.37.5***1.00.039.0−34.2***2.2−0.6***76.3−60.8**2.2−1.813.1−1.6***3.8−0.5***3.1−0.220.8−16.4***
C300000628.3−12.9***10.3−9.5***0.7−0.330.0−43.2***3.30.5***83.7−53.5**4.30.318.53.7***4.60.3**4.61.2***41.64.4**
C3E011848.37.0**21.71.91.30.399.726.5*3.30.5***16931.56.92.9***16.21.5**4.1−0.23.50.238.10.9
average45.621.91.968.23.0144.45.316.94.33.632.6
min24.77.70.725.52.149.61.112.53.82.211.3
max64.230.84.0159.34.0367.313.422.45.04.657.2
R39.5023.13.3133.81.9317.712.39.91.22.445.9
CV, %23.833.760.5 59.217.363.667.717.58.220.039.0
Significant difference compared to the standard A3BM0178 at p = 0.1% *; p = 0.05% **; p = 0.01% ***; M—mean value; DM—difference regarding the mean value of the standard; CV—coefficient of variation; R—range of variation.
Table 8. Phenological data and grain biochemical composition of bitter vetch accessions, averaged for the years 2022 and 2023.
AccessionGermination to 50% Flowering, DaysDuration of Flowering, DaysGrowth Cycle,
Days
Soluble
Protein,
mg·g−1 FW
Sugars,
mg·g−1 FW
Starch,
mg·g−1 FW
Phenols,
mg·g−1 FW
Amino Acids,
mg·g−1 FW
TIA,
Units mg−1 FW
MMDMMDMMDMMDMMDMMDMMDMMDMMD
A3BM017873 14 112 105.4 28.73 571.13 0.219 0.030 1.967
BGR305179612−21164100.84.6035.55−6.82**561.759.380.210−0.0090.0300.0012.224−0.590***
BGR305266−78−6101−1186.0519.35***34.6−5.87**525.6345.50.2560.0370.060−0.022***2.387−1.293***
BGR 6207807113108−492.213.20***33.55−4.82615.00−43.870.2600.0410.040−0.0051.699−0.502***
BGR1352659−146−894−1886.0519.35***49.68−20.95***627.75−56.620.3290.110***0.040−0.0111.220.502***
B9E0168831011−31623105.8−0.4035.43−6.70**565.505.630.206−0.0140.050−0.0012.178−0.053
C300000254−298−684−2895.99.50***38.40−9.67***506.7364.4**0.197−0.0220.060−0.027***2.550−0.308***
C300000367−613−183−2988.117.30***36.20−7.47***591.77−20.640.145−0.074***0.077−0.044***2.370−0.133
C300000141−3210−483−2992.712.70***26.072.66598.90−27.770.180−0.0400.068−0.035***2.390−0.153
C300000767−68−683−2985.719.70***41.33−12.6***502.6368.5**0.142−0.078***0.056−0.023***2.1400.100
C300000641−3212−283−2993.8511.55***21.677.06**581.70−10.570.211−0.0090.061−0.0280***2.0800.158**
C3E01181621211402109889.216.20***29.87−1.14509.7361.4**0.147−0.072***0.072−0.039***2.500−0.263***
average64.5 10.3 97.5 93.48 34.26 563.19 0.209 0.054 2.142
min41 6 83 85.70 21.67 502.63 0.142 0.030 1.220
max83 14 162 105.8 49.68 627.75 0.329 0.077 2.550
R42 8 33 20.10 28.01 125.12 0.187 0.047 1.330
CV, %22.6 24.3 14.7 6.8 21.4 7.7 26.3 29.4 17.6
Significant difference compared to the standard A3BM0178 at p = 0.05% **; p = 0.01% ***; M—mean value; DM—difference regarding the mean value of the standard; CV—coefficient of variation; R—range of variation.
Table 9. Phenotypic correlation of different characters in bitter vetch.
PlHHFPNBNPPlNGPNGPlWGPlPLPWSWHIG-FlDFlGCPrSSStPheAAsAT
PlH10.898**0.2860.337−0.2220.1950.017−0.333−0.372−0.3710.602*0.466−0.0420.3190.1520.509−0.1320.189−0.328−0.163
HFP 10.2710.015−0.554−0.136−0.332−0.627*−0.613*−0.682*−0.869**0.370−0.1660.2370.1340.600*−0.2330.214−0.444−0.181
NB 10.3210.3380.3120.2560.3420.316−0.055−0.298−0.077−0.301−0.171−0.3680.4960.3120.3600.214−0.206
NPPl 10.695*0.963**0.910**0.583*0.5380.3690.2330.3800.5130.239−0.074−0.0140.178−0.3630.3270.145
NGP 10.782**0.867**0.907**0.839**0.719**0.640*0.0210.3080.007−0.241−0.3040.269−0.1910.639*0.209
NGPl 10.965**0.711**0.661*0.4740.3420.1660.4350.028−0.089−0.0670.191−0.3940.4120.225
WGPl 10.828**0.734**0.617*0.5210.1320.4310.032−0.171−0.1940.273−0.3980.5170.219
PL 10.933**0.828**0.664*−0.2560.096−0.266−0.181−0.1630.514−0.0800.5440.009
PW 10.771**0.560−0.3460.165−0.343−0.029−0.130.581*0.0090.349−0.112
SW 10.758**−0.2750.066−0.2360.033−0.2950.444−0.0640.426−0.105
HI 10.1400.220−0.036−0.11−0.5760.222−0.2000.3960.178
G-Fl 10.4720.964**−0.07−0.025−0.369−0.2800.0990.198
DFl 10.4960.193−0.671*0.035−0.4860.0520.318
GC 10.022−0.167−0.313−0.1900.0610.19
Pr 1−0.0880.0810.070−0.3970.046
SS 10.0020.367−0.241−0.443
St 10.530−0.288−0.677*
Phe 1−0.584*−0.756**
AAs 10.611*
AT 1
** Correlation is significant at the 0.01 level (2-tailed); * Correlation is significant at the 0.05 level (2-tailed). Significant correlations are in bold. Abbreviations: PlH—plant height, cm; HFP—height to the first pod, cm; NB—number of branches; NPPl—number of pods per plant; NGP—number of grains per pod; NGPl—number of grains per plant; WGPl—weight of grains per plants, g; PL—size of pod, length, mm; PW—size of pod, width, mm; SW—weight of 100 seeds, g; HI—harvest index, %; G-Fl—germination−50% flowering, days; DFl—duration of flowering, days; GC—growth cycle, days; Pr—protein, mg g−1 FW; SS—soluble sugars, mg·g−1 FW; St—starch, mg·g−1 FW; Phe—phenols, mg·g−1 FW; AAs—amino acids, mg·g−1 FW; AT—antitrypsin activity, U·mg−1 FW.
Table 10. Distribution of the total variation among components.
ComponentTotalInitial Eigenvalues
% of VarianceCumulative %
PC17.25936.29436.294
PC23.9819.89956.193
PC33.37516.87573.068
The contribution of each component in the total variation is marked in bold.
Table 11. Factor loadings derived from PCA performed on 12 bitter vetch accessions based on 20 agro-morphological and biochemical traits.
Traits/ComponentsPC1PC2PC3
Plant height, cm−0.3980.3000.773
Height to the first pod, cm−0.7060.2320.633
Number of branches0.129−0.3230.721
Number of pods per plant0.6620.3720.609
Number of grains per pod0.9360.0210.191
Number of grains per plant0.7740.2580.500
Weight of grains per plants, g0.8880.1970.364
length of pod, mm0.933−0.2840.158
width of pod, mm0.867−0.3700.152
Weight of 100 grains, g0.812−0.290−0.107
Harvest index, %0.765−0.065−0.435
Germination−50% flowering, days−0.1030.7940.316
Duration of flowering, days0.3740.642−0.068
Growth cycle, days−0.1070.7420.146
Protein,mg·g−1 FW %−0.0560.233−0.124
Soluble sugars, mg·g−1 FW−0.419−0.3280.641
Starch, mg·g−1 FW0.334−0.6430.25
Phenols, mg·g−1 FW−0.348−0.7010.268
Amino acids, mg·g−1 FW0.6230.265−0.106
Antitrypsin activity, U·mg−1 FW0.2330.673−0.347
Extraction Method: Principal Component Analysis.
a. 3 components extracted.
The bolded values determine which factor the traits fall into.
Table 12. Direct and indirect effects of economic traits on grain yield per plant in bitter vetch.
Direct and Indirect EffectTotal Indirect EffectTotal Phenotypic Correlation with WGPl
Plant HeightHeight to First PodNumber of Main BranchesNumber of Pods/PlantNumber of Grains per PodNumber of Grains per Plant100-Seed WeightHarvest Index
PlH−0.324−0.291−0.093−0.1090.072−0.0630.1200.195−0.1690.017
HFP0.3840.4280.1160.006−0.237−0.058−0.292−0.372−0.452−0.332
NB−0.003−0.003−0.010−0.003−0.003−0.0030.0010.003−0.0120.256
NPPl0.0360.0020.0340.1060.0730.1020.0390.0250.3100.910**
NGP−0.038−0.0950.0580.1190.1720.1340.1230.1100.4120.867**
NGPl0.141−0.0990.2260.6980.5660.7240.5210.2482.3010.965**
SW−0.039−0.071−0.0060.0390.0750.0500.1050.0790.1270.617*
HI−0.140−0.203−0.0690.0540.1490.0800.1770.2330.0480.521
** Correlation coefficient is significant at the 0.01 level (2-tailed); * correlation is significant at the 0.05 level (1-tailed); underlined and bolded values are direct effects and all other values are indirect effects of economic traits on grain yield per plant. Abbreviations: PlH—plant height; HFP—height to the first pod; NB—number of branches; NPPl—number of pods per plant; NGP—number of grains per pod; NGPl—number of grains per plant; SW—weight of 100 seeds, g; HI—harvest index, WGPl—weight of the grains per plant.
Table 13. Direct and indirect effects of biological and biochemical traits on grain yield per plant in bitter vetch.
Direct and Indirect Effect Total
Indirect Effect
Total Phenotypic Correlation with WGPl
Germination-
50%fl.
Flower durationGrowth CycleProteinSugarsStarchPhenolsAmino AcidsAnti-
trypsins
G-Fl2.2621.0682.181−0.025−0.057−0.835−0.6330.2240.4482.3710.132
DFl0.1280.2710.1340.099−0.1820.009−0.1320.0140.0860.1570.431
GC−2.074−1.067−2.152−0.1230.3590.6730.409−0.131−0.409−2.3620.032
Pr−0.0020.0820.0130.224−0.0640.012−0.010−0.0890.036−0.022−0.005
SS0.0020.0530.0130.023−0.0790.000−0.0290.0190.0350.116−0.194
St−0.2330.022−0.1980.0350.0010.6310.334−0.182−0.427−0.6470.273
Phe−0.053−0.093−0.036−0.0080.0700.1010.191−0.112−0.144−0.275−0.398
AAs0.0650.0340.040−0.260−0.158−0.189−0.3830.6550.400−0.4500.517
AT0.0380.0610.0370.031−0.086−0.131−0.1460.1180.193−0.0770.219
Underlined and bolded values are direct effects and all other values are indirect effects of biological and biochemical traits on grain yield per plant. Abbreviations: G-Fl—germination−50% flowering; DFl—duration of flowering; GC—growth cycle; Pr—seed soluble protein; SS—seed soluble sugars; St—starch; Phe—Phenols; AAs—free amino acids; AT—antitrypsin activity, WGPl—weight of the grains/plant.
Table 14. Germination percentage, vigor index (VI), and relative stress tolerance (RST) among the twelve studied bitter vetch accessions.
AccessionGermination %RST-G %Seedling VIRST-VI %
H2OdPEGNaClPEGNaClH2OdPEGNaClPEGNaCl
A3BM017883.1786.9155.841.0450.6716.826.160.95***0.9030.139
BGR305142.2429.60*30.470.7010.7212.881.661.20***0.5760.417
BGR305293.9491.1682.580.9700.8796.854.53**1.83***0.6610.267
BGR 620771.8667.5944.380.9410.6175.283.64*1.36***0.6890.258
BGR1352670.9172.4032.07**1.0210.4525.226.182.28***1.1840.437
C300000179.9261.3915.00**0.7680.1885.444.010.11***0.7370.020
C300000295.0098.0463.49*1.0320.6688.265.47***1.54***0.6620.186
C300000395.9673.4469.34*0.7650.7237.524.30*2.23***0.5720.297
C300000656.1566.575.83**1.1860.1043.133.54nd1.131nd
C300000780.5853.70*0.00***0.6660.0007.513.09**nd0.411nd
C3E011893.6580.3252.38*0.8570.5597.294.77*1.62***0.7430.222
B9E016888.4779.3350.84*0.8970.5756.034.48***1.17***0.7440.194
average79.3271.7041.850.9040.5136.024.321.190.7510.203
CV%15.9818.5143.6814.2242.7522.8421.8862.0622.0455.66
Values are mean from 3 independent experiments. Significant differences (one way ANOVA) compared to control (distilled water) for each accession are marked with asterisk (at p = 0.1% *; p = 0.05% **; p = 0.01% ***), nd—not determined.
Table 15. Growth parameters of the germinated bitter vetch plants.
AccessionRoot Length (mm)Shoot Length (mm)Root/Shoot Ratio
H2OdPEGNaClH2OdPEGNaClH2OdPEGNaCl
A3BM01784859***15***37306***1. 5112.266***2.778***
BGR30514372**17**505421**0.9031.401*0.905
BGR3052495312***494610***1.0801.2791.341
BGR 6207364114***354414***1.0321.0181.235
BGR135262566**242746*361.1041.5520.703
C30000013555**nd2926nd1.2562.410***nd
C300000249439***33386***1.6491.232*1.303
C30000034580***20***404112***1.2552.233***2.207*
C30000064053222425151.7912.2671.470
C30000075353nd3724*nd1.4852.091*nd
C3E01182840**10***302314**1.0842.045**0.847
B9E0168435310***424410***1.1031.2481.200
average4156153637141.2461.7531.399
CV%17162818254017.5726.5232.36
Values are the means from independent measurements of all germinated plants that had developed roots and shoots upon the respective treatment in one representative experiment; nd—not determined. Significant differences (one-way ANOVA) compared to control (distilled water) for each accession are marked with asterisk (at p = 0.05% *; p = 0.01% **; p = 0.001% ***).
Disclaimer/Publisher’s Note: The statements, opinions and data contained in all publications are solely those of the individual author(s) and contributor(s) and not of MDPI and/or the editor(s). MDPI and/or the editor(s) disclaim responsibility for any injury to people or property resulting from any ideas, methods, instructions or products referred to in the content.

