Article

Transcriptomic Analysis of Broussonetia papyrifera Fruit Under Manganese Stress and Mining of Flavonoid Synthesis Genes

1
Hunan Provincial Key Lab of Dark Tea and Jin-Hua, School of Materials and Chemical Engineering, Hunan City University, Yiyang 413000, China
2
College of Life and Environmental Sciences, Central South University of Forestry & Technology, Changsha 410004, China
3
College of Forestry, Northwest A & F University, Yangling 712100, China
*
Author to whom correspondence should be addressed.
Plants 2025, 14(6), 883; https://doi.org/10.3390/plants14060883
Submission received: 30 December 2024 / Revised: 1 March 2025 / Accepted: 10 March 2025 / Published: 12 March 2025
(This article belongs to the Section Plant Genetics, Genomics and Biotechnology)

Abstract

:
Broussonetia papyrifera is a deciduous tree with significant economic and medicinal value. It demonstrates notable physiological adaptability to mining areas with severe manganese contamination and is a pioneering species in the field of ecological restoration. Flavonoids are vital secondary metabolites that improve plant resilience to environmental stresses. In the study presented herein, immature and mature fruits of B. papyrifera grown in normal and high manganese environments were used as the test materials. B. papyrifera fruit was subjected to transcriptome sequencing via high-throughput sequencing technology to analyze its flavonoid metabolic pathways and related genes. Transcriptome sequencing identified a total of 46,072 unigenes, with an average length of 1248 bp and a percentage of Q30 bases ranging from 92.45 to 93.17%. Furthermore, 31,792 unigenes (69% of the total) were annotated using eight databases, including the GO and KEGG. Analysis of KEGG metabolic pathways and flavonoid content trends in B. papyrifera fruits revealed four unigenes with strong links to the flavonoid biosynthesis pathway under manganese stress: flavone 3-hydroxylase, flavonoids 3′,5′-O-methyltransferase, chalcone synthase, and flavonol synthase. These unigenes may play important roles in regulating flavonoid synthesis in B. papyrifera fruits under manganese stress. This study lays the groundwork for functional gene research in B. papyrifera.

1. Introduction

Paper mulberry (Broussonetia papyrifera) is an ecologically, economically, and medicinally important tree species belonging to the family Moraceae [1,2]. Because of its long fibers and ease of preparation, this tree has been cultivated as a prime source of high-quality paper and is distributed worldwide [3]. In addition, B. papyrifera has been used to feed livestock for thousands of years owing to its high crude protein content and improved muscle quality [4]. The adaptability of B. papyrifera to the environment facilitates its colonization and expansion in local areas. B. papyrifera is a pioneer plant species in heavy metal-contaminated areas and is considered a candidate plant for phytoremediation [5,6,7]. B. papyrifera is a traditional Chinese medicine with positive effects on cardiovascular and neuropathic diseases [8]. The medicinal effects of B. papyrifera are mainly due to its rich secondary metabolites, of which flavonoids are the major functional components. To date, more than 70 flavonoids, including broussoflavone and kazinol, with antioxidant, anti-inflammatory, and antineoplastic activities have been identified in B. papyrifera, such as broussoflavone and kazinol [8,9]. Comparative genomic analysis has revealed an expansion in flavonoid biosynthetic gene families, accounting for the enhanced flavonoid biosynthesis in B. papyrifera [10].
Soil environmental pollution, particularly heavy metal toxicity, poses a major challenge to global ecosystem health. Heavy metals in soil are toxic to organisms and threaten human health through the food chain and other pathways [11]. Although B. papyrifera has potential as both a phytoremediator and livestock feed, its tendency to accumulate heavy metals in edible tissues raises significant concerns regarding food chain contamination. Field studies have demonstrated that manganese (Mn) accumulation in fruits derived from contaminated soils surpasses the safe consumption thresholds for livestock [12]. Therefore, further research is required to optimize these strategies for sustainable utilization. Faced with heavy metal stress, plants develop various defense strategies, with the synthesis of secondary metabolites being a key mechanism to regulate environmental stress, including phenolic compounds, sulfur-containing secondary metabolites, and nitrogen-containing secondary metabolites [13,14]. Under salt and drought stress, cotton exhibits elevated callose, chitinase, flavonoid, and phenol contents and higher secondary metabolism-related enzyme activities and transcript levels [15]. Plant secondary metabolites (PSMs) are not only regulatory substances for plants to cope with environmental stress but also the material basis for plants as food [16]. With rich secondary metabolites, Gynostemma pentaphyllum and Houttuynia cordata medicinal plants have been developed into healthy foods, such as Jiaosu [17]. Furthermore, PSMs are associated with abiotic stress tolerance, plant metabolite production, biostimulants, and functional foods [18].
Flavonoids are phenolic compounds that are important for plants to resist adverse environments and are functional substances. Flavonoid synthesis is an effective strategy against reactive oxygen species (ROS) [19]. Flavonoids may mediate ultraviolet protection in plants either by screening for harmful radiation or by minimizing the resulting oxidative stress [20]. Flavonoids play an important role in heavy metal tolerance [21]. Potent antioxidants from plants are of great interest as alternatives to synthetic antioxidants. In humans, flavonoids decrease organic hydroperoxide formation, induce antioxidant enzymes, such as superoxide dismutase and catalase, and inhibit enzymes that participate in oxidative processes [22]. In recent years, omics technology has been widely used to better understand the mechanisms underlying flavonoid synthesis [23]. Eight biosynthesis branches and four important intermediate metabolites have been identified [24]. Transcriptomics plays an important role in the analysis of key genes involved in flavonoid synthesis, and studies have shown that genes closely related to the flavonoid metabolism pathway are concentrated in v-myb avian myeloblastosis viral oncogene homolog (MYB), basic Helix-Loop-Helix (Bhlh), and tryptophan-aspartic acid 40 (WD40) families [24].
Currently, research on flavonoids in B. papyrifera has mainly focused on the leaves [25] and root bark [26], with researchers paying less attention to the fruits. Integrative metabolome and transcriptomic analyses of B. papyrifera leaves have identified several key genes regulating flavonoid accumulation, such as those encoding chalcone synthase (CHS), chalcone isomerase (CHI), and dihydroflavonol-4-reductase (DFR) [27]. As a dioecious tree with globose syncarps, B. papyrifera is dispersed by birds and small mammals [28]. The fruit of B. papyrifera is rich in flavonoids and other secondary metabolites [12]. It is not only an important food source for animals but can also be used to make many kinds of food, such as juice. Although transcriptomic analysis has been used to analyze flavonoid synthesis and stress resistance response mechanisms in B. papyrifera leaves [29], few studies have reported on its application to fruits. To more effectively develop the fruit of B. papyrifera and understand its response to environmental stress, this study is the first attempt to use transcriptomic technology to explore the key genes regulating flavonoid synthesis in the fruit and establish the gene associations between flavonoid synthesis and stress resistance.

2. Results

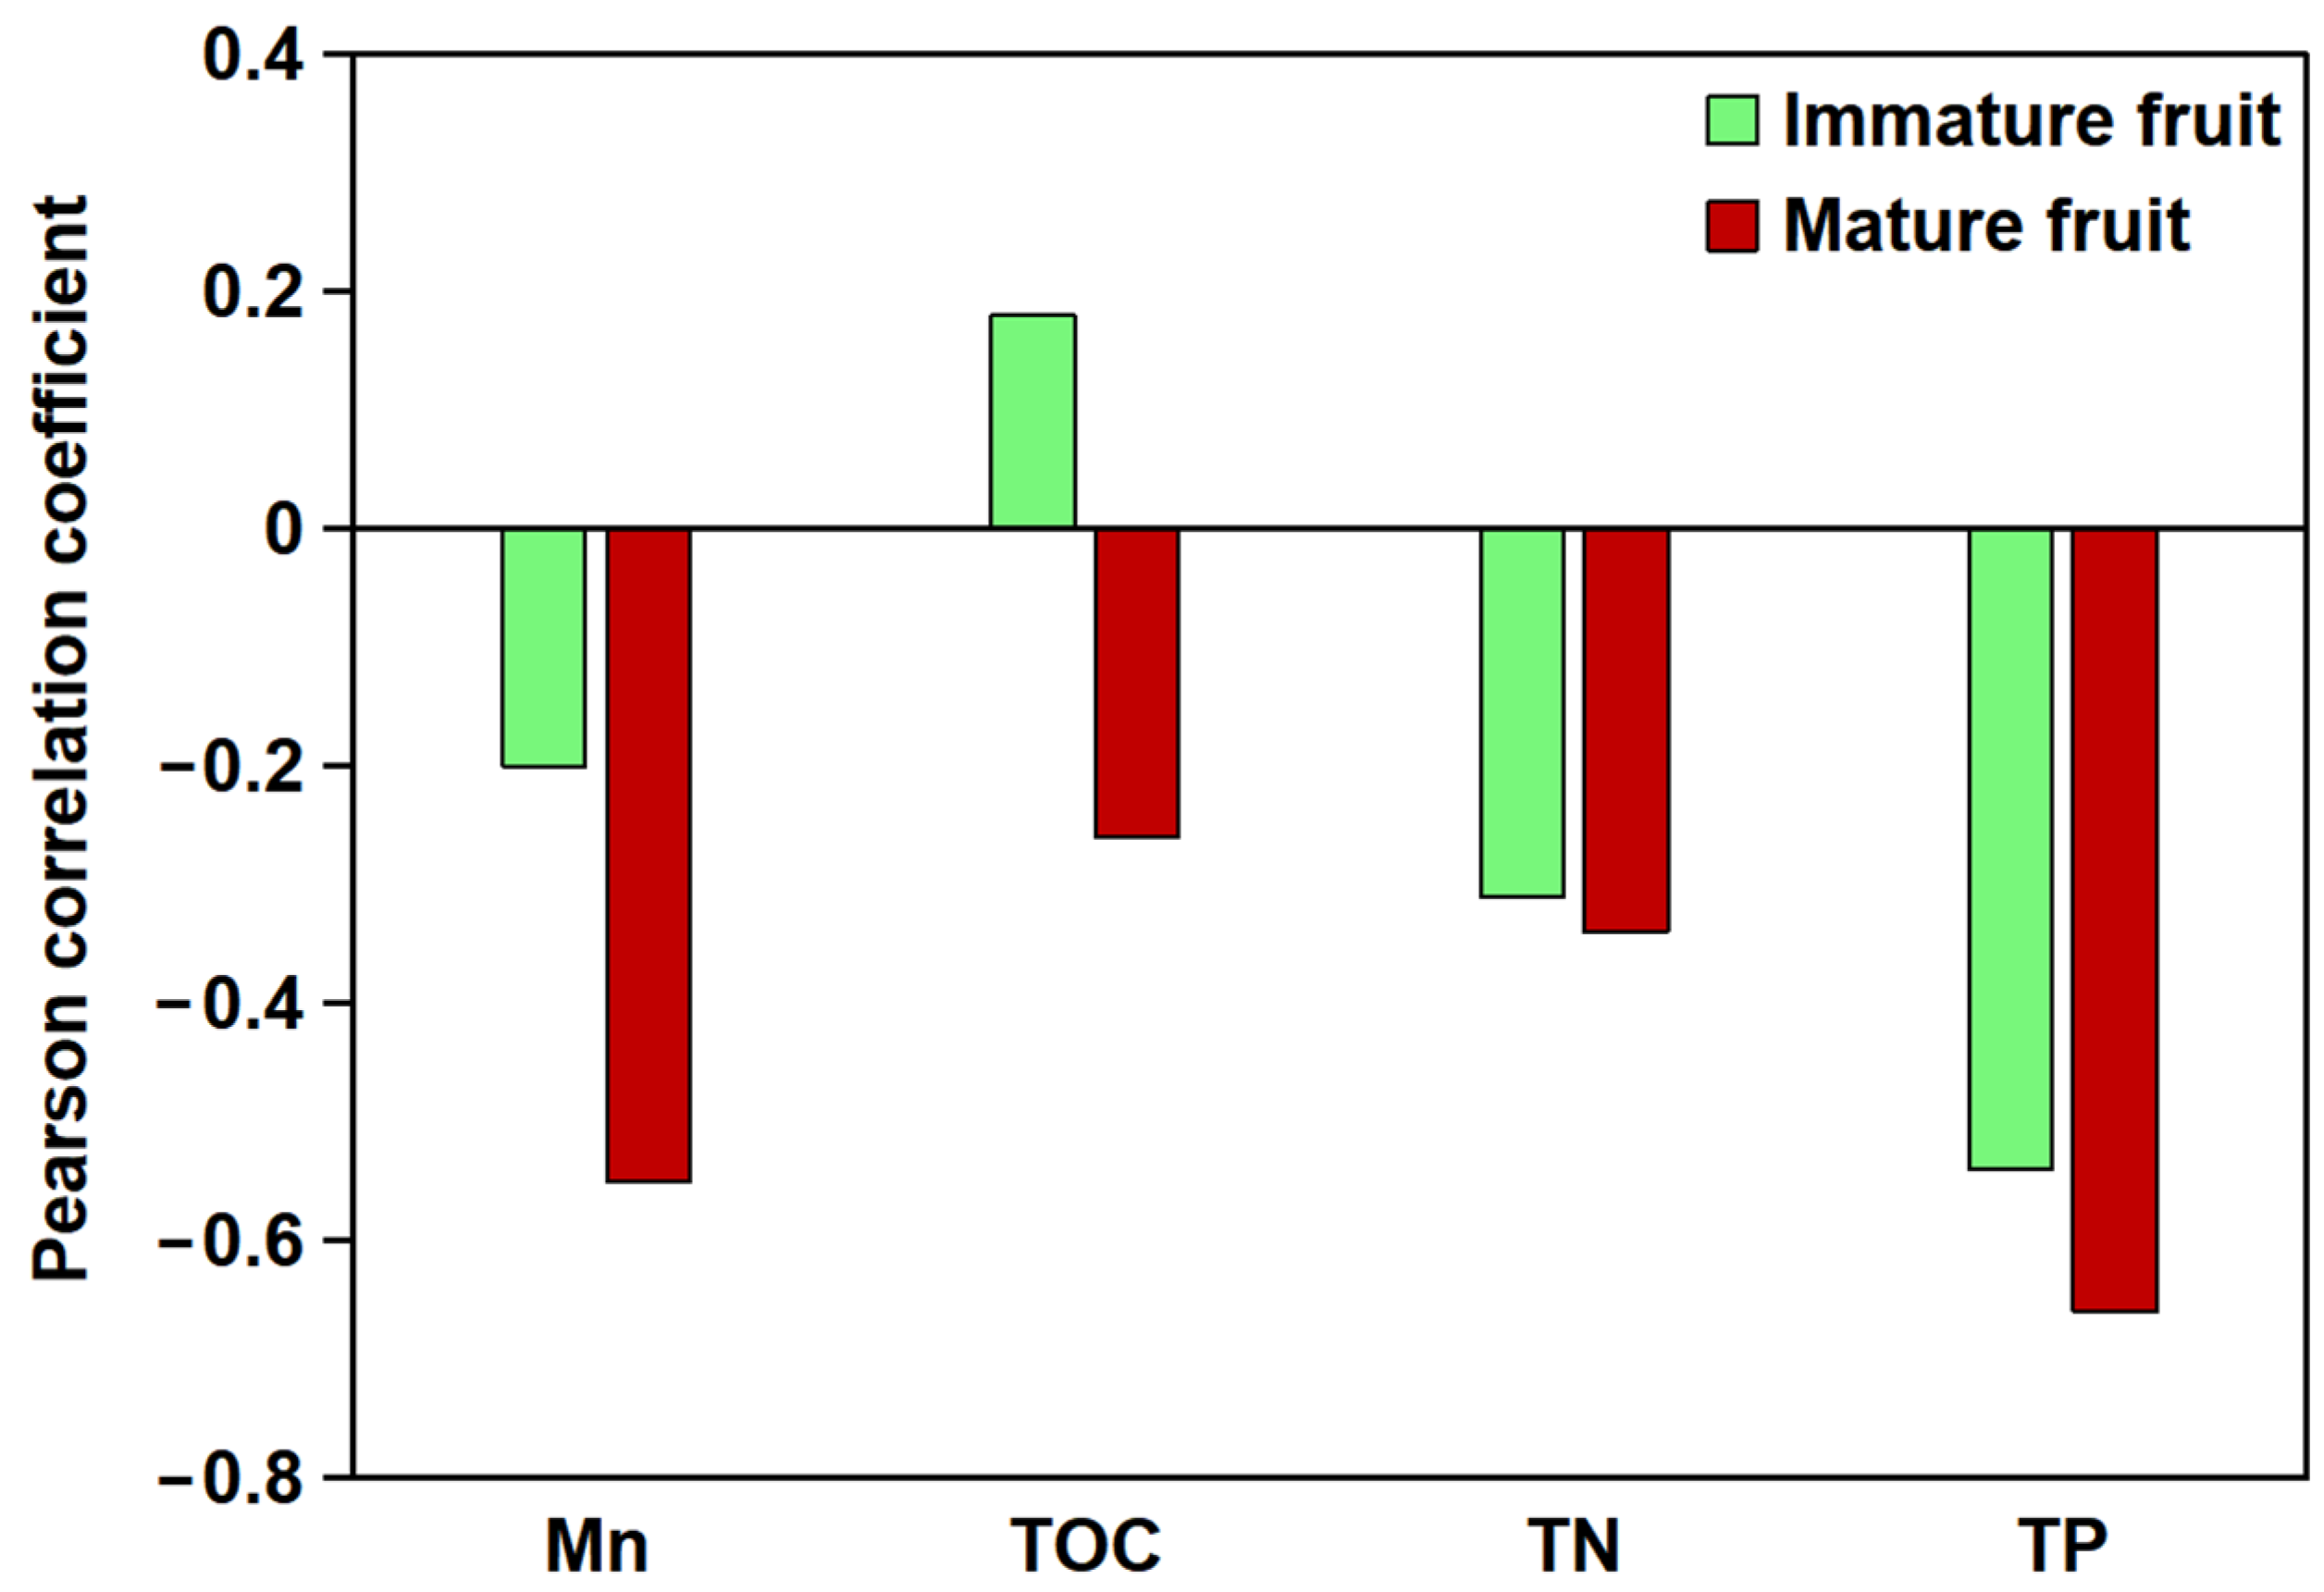
2.1. The Relationship Between the Flavonoid Content of B. papyrifera Fruit and the Soil Environment

In this study, B. papyrifera fruits were collected from areas with and without manganese contamination. In each area, fruits were collected at two different development stages: immature and completely mature. Thus, the samples used in this study encompassed four different types: contaminated immature fruit (CIF), contaminated mature fruit (CMF), garden immature fruit (GIF), and garden mature fruit (GMF).
The relationship between the total flavonoid content in B. papyrifera fruits and soil parameters at different developmental stages and soil carbon, nitrogen, phosphorus, and Mn content was analyzed (Figure 1). The results showed that the total flavonoid content of B. papyrifera fruits was highly correlated with soil Mn content. A negative correlation was observed between the total flavonoid content of immature fruits and soil Mn content (p > 0.05), whereas a significant negative correlation was evident between the flavonoid content of mature fruits and soil Mn content (p < 0.01). Furthermore, the effect of soil nutrient composition on the flavonoid content of B. papyrifera fruit was pronounced, with the following correlation strengths: total phosphorus (TP) > total nitrogen (TN) > total organic carbon (TOC).

2.2. Transcriptomic Data Analysis

Immature and mature fruits of B. papyrifera from the Mn mining and control areas were selected for transcriptome sequencing, and four cDNA libraries were constructed from the four samples. The sequencing results, as presented in Table 1, demonstrated that a total of 27.04 Gb of clean data were obtained, with CIF, CMF, GIF, and GMF yielding 21,185,851, 22,811,605, 24,414,219, and 22,202,511 clean reads, respectively. The percentage of Q30 bases was 92.45% or higher, and the GC content was above 47.02%. The raw sequencing reads exhibited an average length of 150 bp (paired-end), with 85.3% of the reads exceeding 100 bp. Sequencing revealed that immature and mature fruit samples of B. papyrifera were of high quality and suitable for analysis. A total of 46,072 unigenes were obtained from the four groups of samples following assembly, with an average length of 1248 bp. Of these, 26,394 unigenes were shorter than 900 bp, representing 57.29% of the total unigenes, and the longest was 17,072 bp (Figure S1). The high-quality assembly (N50 = 1248 bp) and Q30 results (>92.45%) further confirmed that minimal RNA degradation occurred during sample processing.

2.3. Annotation of Gene Functions

A comparative analysis of the 46,072 unigenes was performed using the Non-Redundant Protein Sequence Database (NR), Protein family (Pfam), euKaryotic Orthologous Groups (KOG), Clusters of Orthologous Groups (COG), Orthologous Groups of protein (eggNOG), a manually annotated and reviewed protein sequence database (Swiss-Prot), Kyoto Encyclopedia of Genes and Genomes (KEGG), and Gene Ontology (GO) databases. This resulted in the annotation of 31,792 unigenes in eight databases, representing 69% of the total (Table 2). The eggNOG and Pfam databases were the most heavily utilized, with 62.88% and 51.01% of the unigenes annotated in these databases, respectively.
The high annotation rate and sequencing quality indicated robust data integrity, providing a solid foundation for downstream comparative analysis. Leveraging this high-quality transcriptome dataset, we subsequently analyzed DEGs (differentially expressed genes) between the Mn-exposed and control groups.

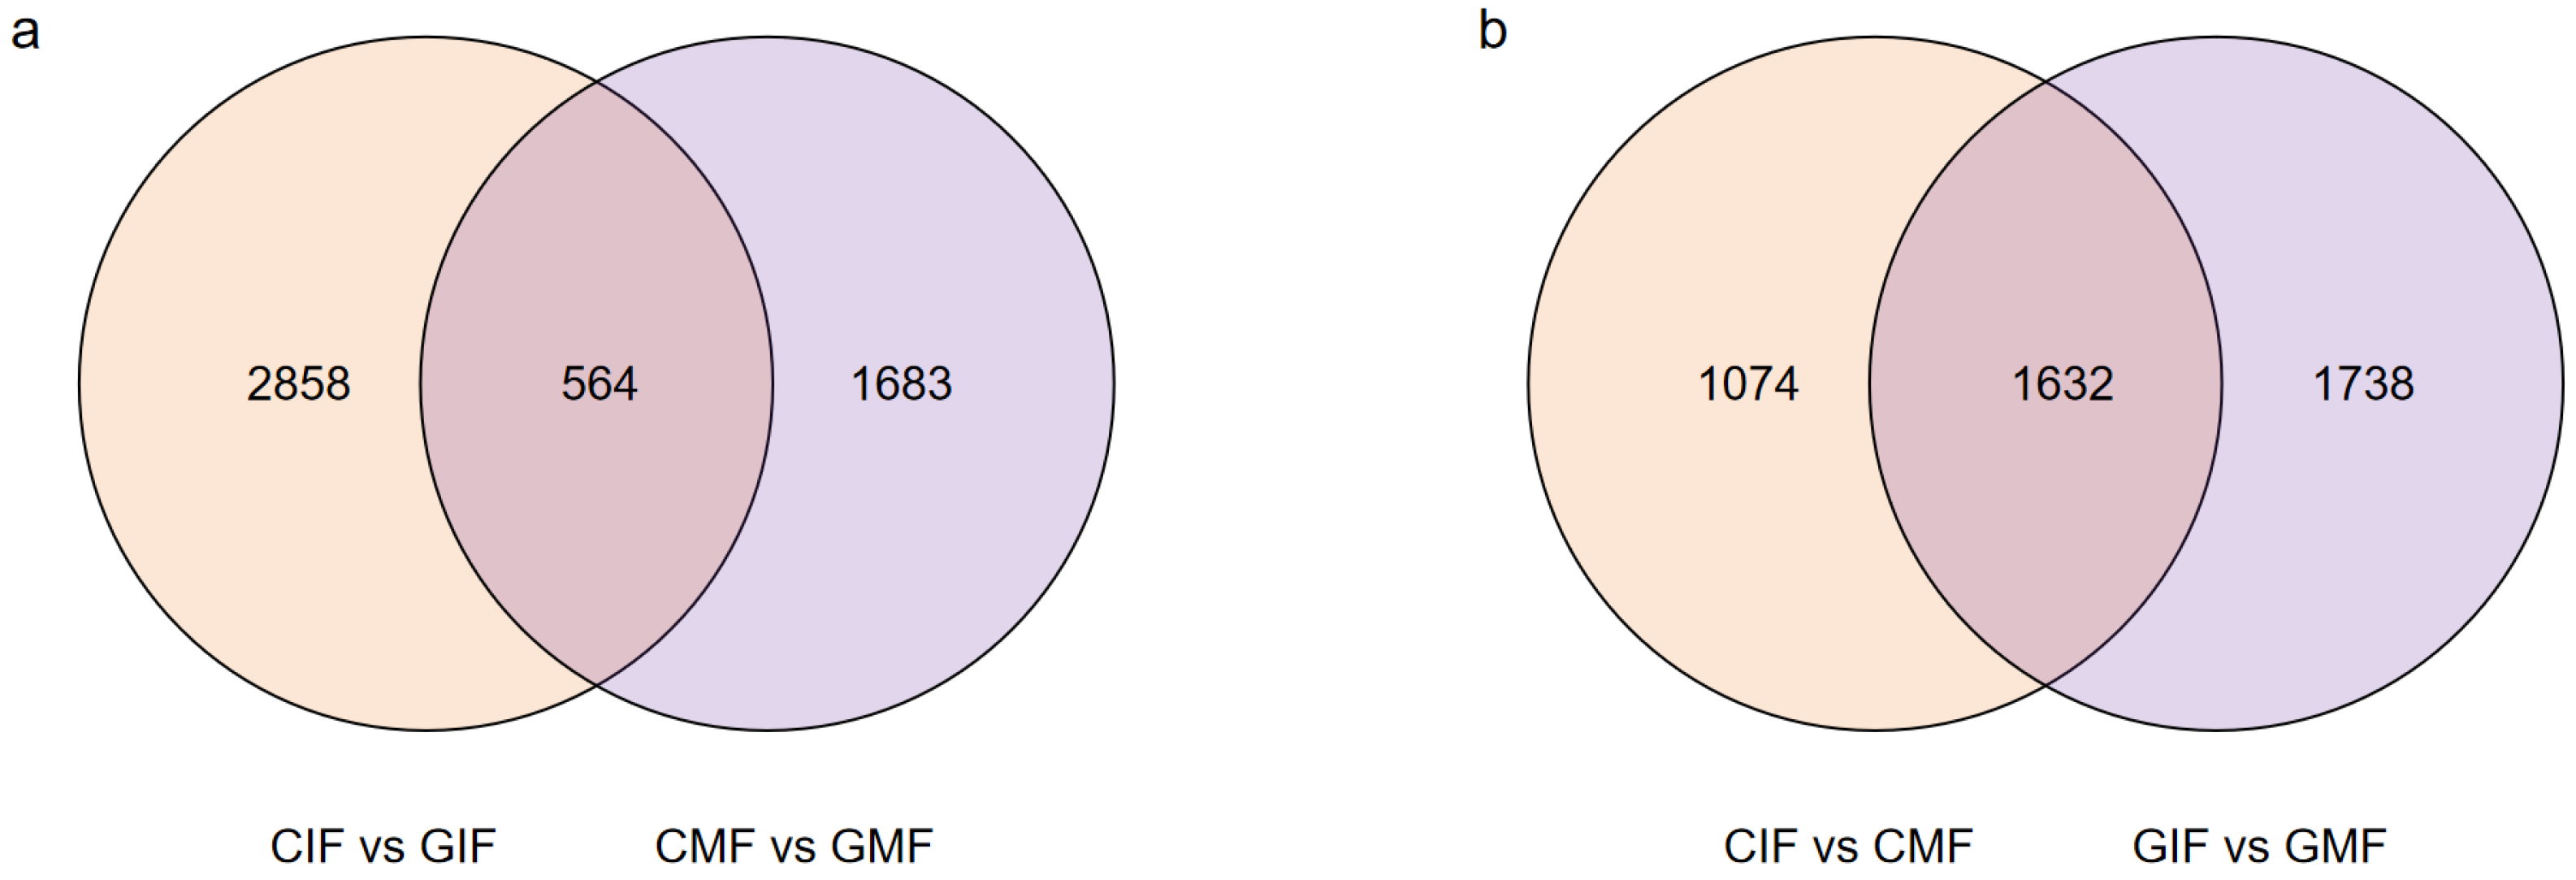
2.4. Screening of DEGs

DEGs were screened based on the criteria of False Discovery Rate (FDR) < 0.01 and Fold Change (FC) ≥ 2, and pairwise comparisons of DEGs were conducted for immature and mature fruits from Mn mining and control areas. The comparison between CIF and GIF revealed a total of 3422 DEGs (Figure 2a), including 2168 upregulated and 1254 downregulated DEGs. The comparison between CMF and GMF revealed 2247 DEGs (Figure 2a), including 944 upregulated and 1303 downregulated DEGs. The comparison between CIF and CMF revealed 2706 DEGs (Figure 2b), including 1670 upregulated and 1036 downregulated DEGs. Similarly, the comparison between GIF and GMF revealed 3370 DEGs (Figure 2b), including 2055 upregulated and 1315 downregulated DEGs.
Among the DEGs, some were identified in the comparisons between CIF and GIF and CMF and GMF. These included 345 upregulated and 219 downregulated genes. Similarly, some were in the comparisons between CIF and CMF and GIF and GMF. These included 1081 upregulated and 551 downregulated genes. The DEGs were functionally annotated using the following eight databases: NR, SwissProt, KEGG, COG, KOG, Egg-NOG, GO, and Pfam. The results are summarized in Table 3. Among the comparisons between CIF and GIF, CMF and GMF, CIF and CMF, and GIF and GMF, 2989, 2053, 2451, and 3016 DEGs were annotated in the eight databases, respectively.

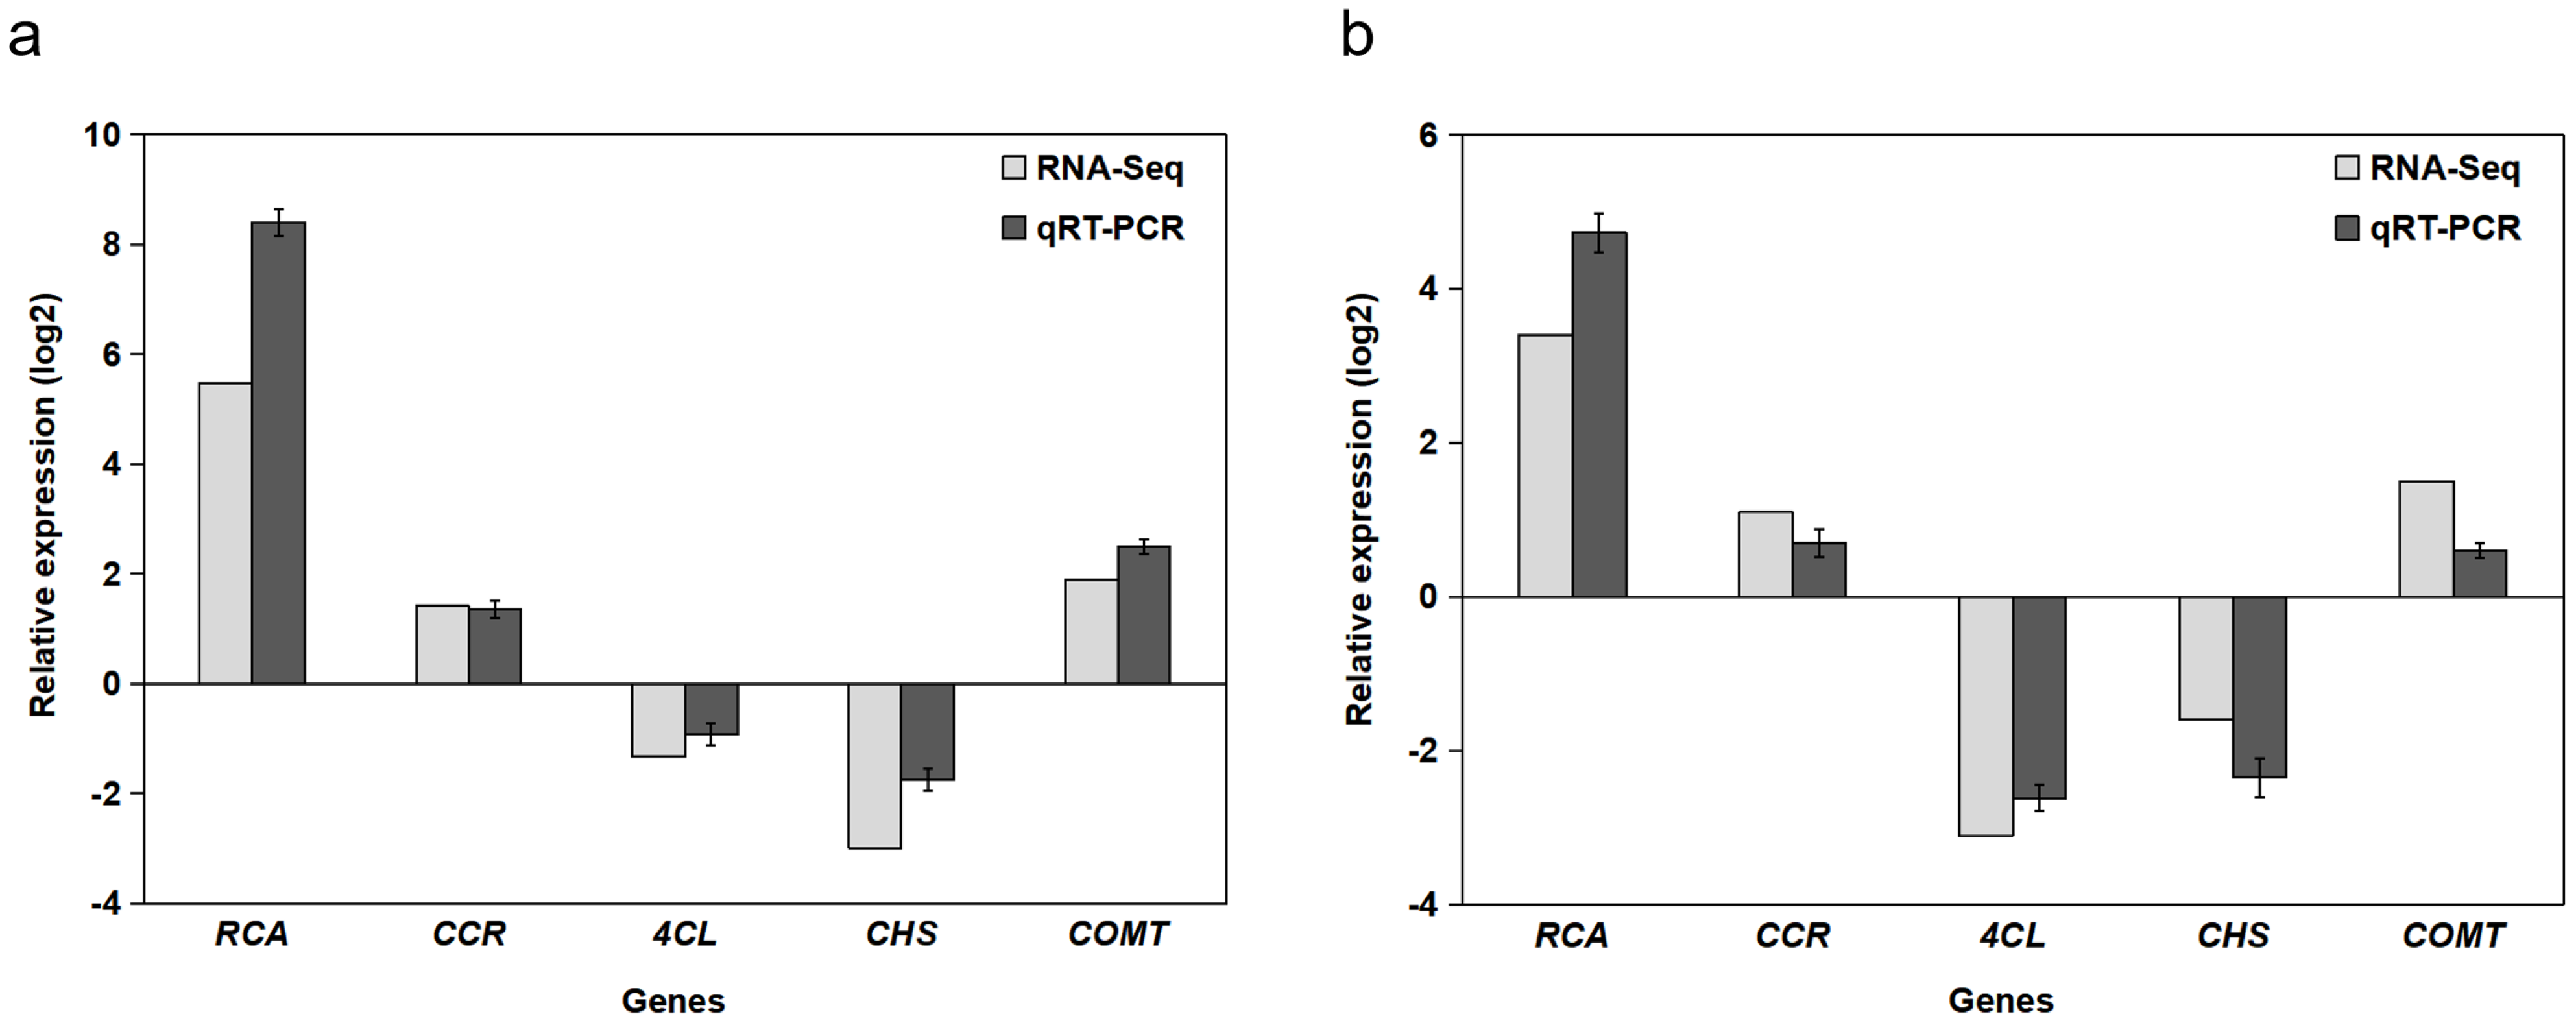
2.5. RT-qPCR Validation of DEGs

Five genes were randomly selected for transcriptome sequencing and expression level verification using RT-qPCR. Figure 3a illustrates the expression of these five genes in the immature fruit of B. papyrifera, and Figure 3b depicts their expression in mature fruit. The results demonstrated that the expression levels of the same gene under both Illumina sequencing and RT-qPCR were largely consistent. This suggests that the transcriptome sequencing data in this study are accurate and reliable and can be utilized for further analysis.

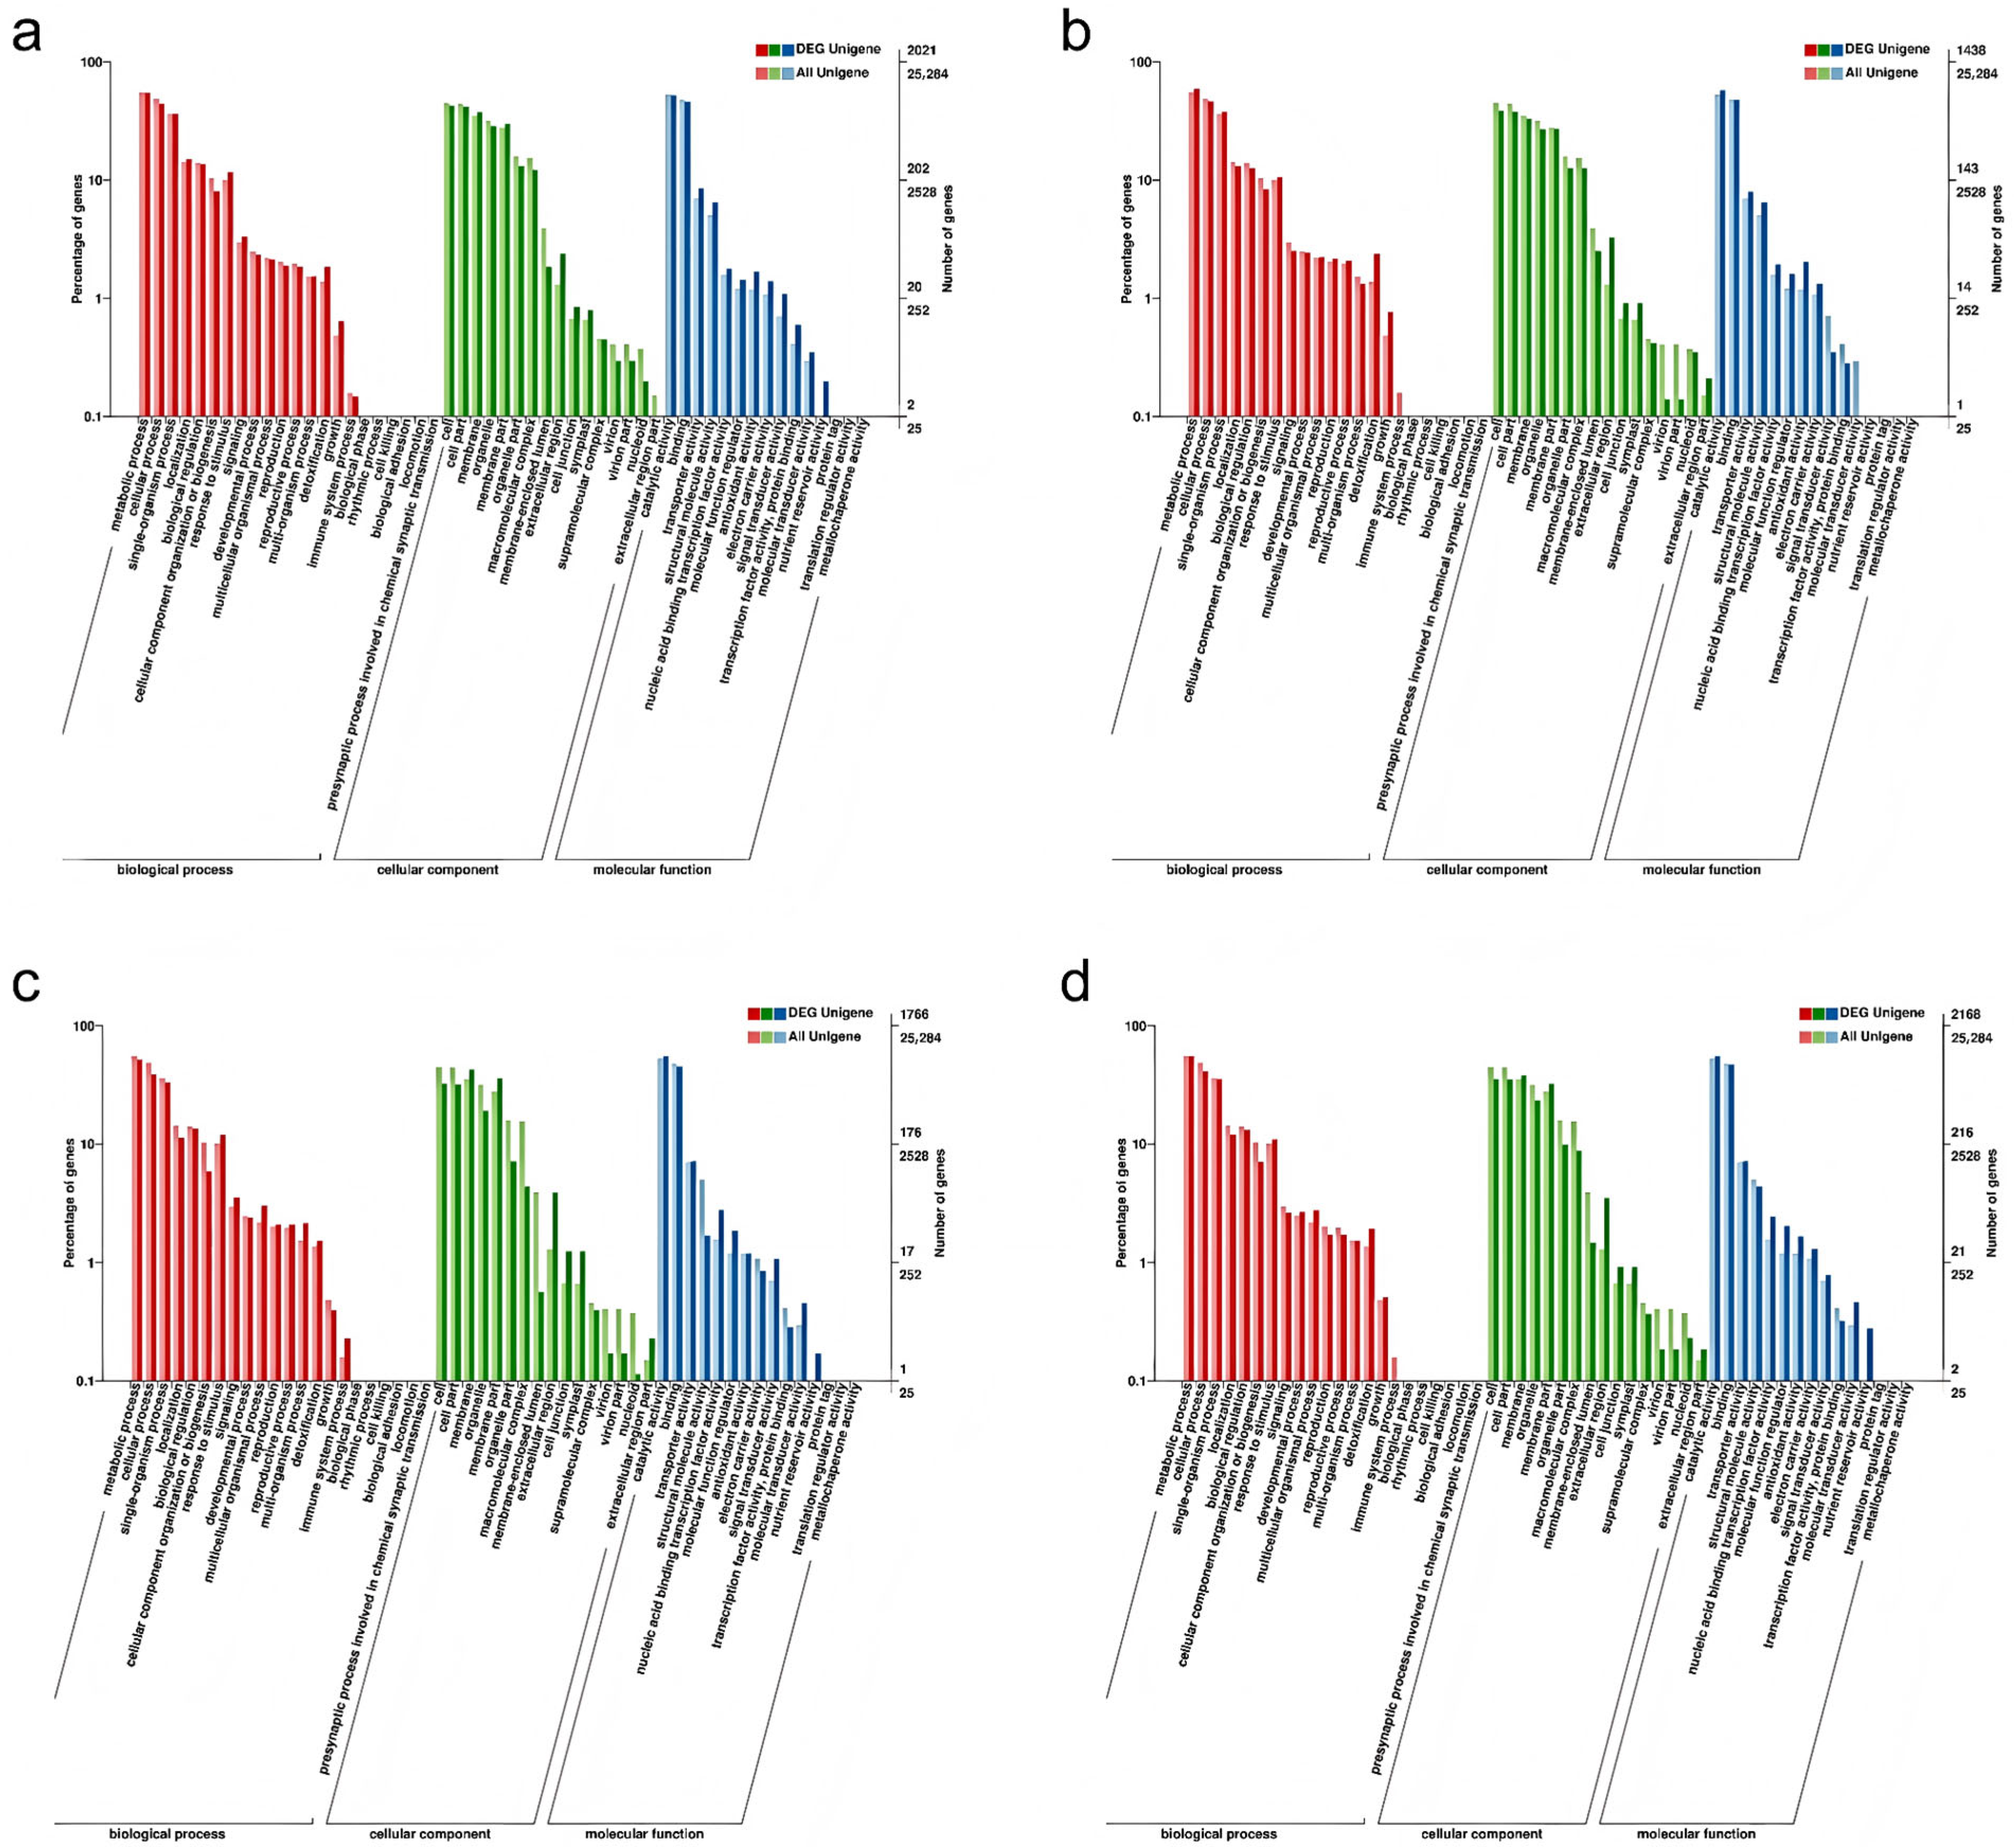
2.6. GO Annotation of DEGs

To provide a comprehensive description of the functional attributes of the DEGs, a GO systematic functional classification of the DEGs was conducted. A total of 2021 DEGs were annotated to the GO database for CIF vs. GIF (Figure 4a), of which 1647 were annotated to molecular functions, 1358 were annotated to cellular components, and 1499 were annotated to biological processes. In the CMF vs. GMF comparison, 1438 DEGs were annotated in the GO database (Figure 4b), of which 1217 were annotated to molecular functions, 885 were annotated to cellular components, and 1113 were annotated to biological processes. A total of 1766 DEGs were annotated in the GO database for CIF vs. CMF (Figure 4c), of which 1413 were annotated to molecular functions, 1112 were annotated to cellular components, and 1274 were annotated to biological processes. In total, 2168 DEGs were annotated in the GO databases for GIF and GMF (Figure 4d), of which 1799 were annotated as molecular function, 1364 were annotated as cellular components, and 1617 were annotated as biological processes.
These three groupings can be subdivided independently into different functional subterms, each corresponding to an attribute. As shown in Figure 4, the differential genes of CIF vs. GIF, CMF vs. GMF, CIF vs. CMF, and GIF vs. GMF were enriched in 48, 42, 45, and 45 different taxa, respectively, in which metabolic processes, cellular processes, and single-organism processes were dominant in the biological process; cell parts and cells were most significantly enriched in cellular composition; and catalytic activity and binding were the dominant taxa in molecular function.

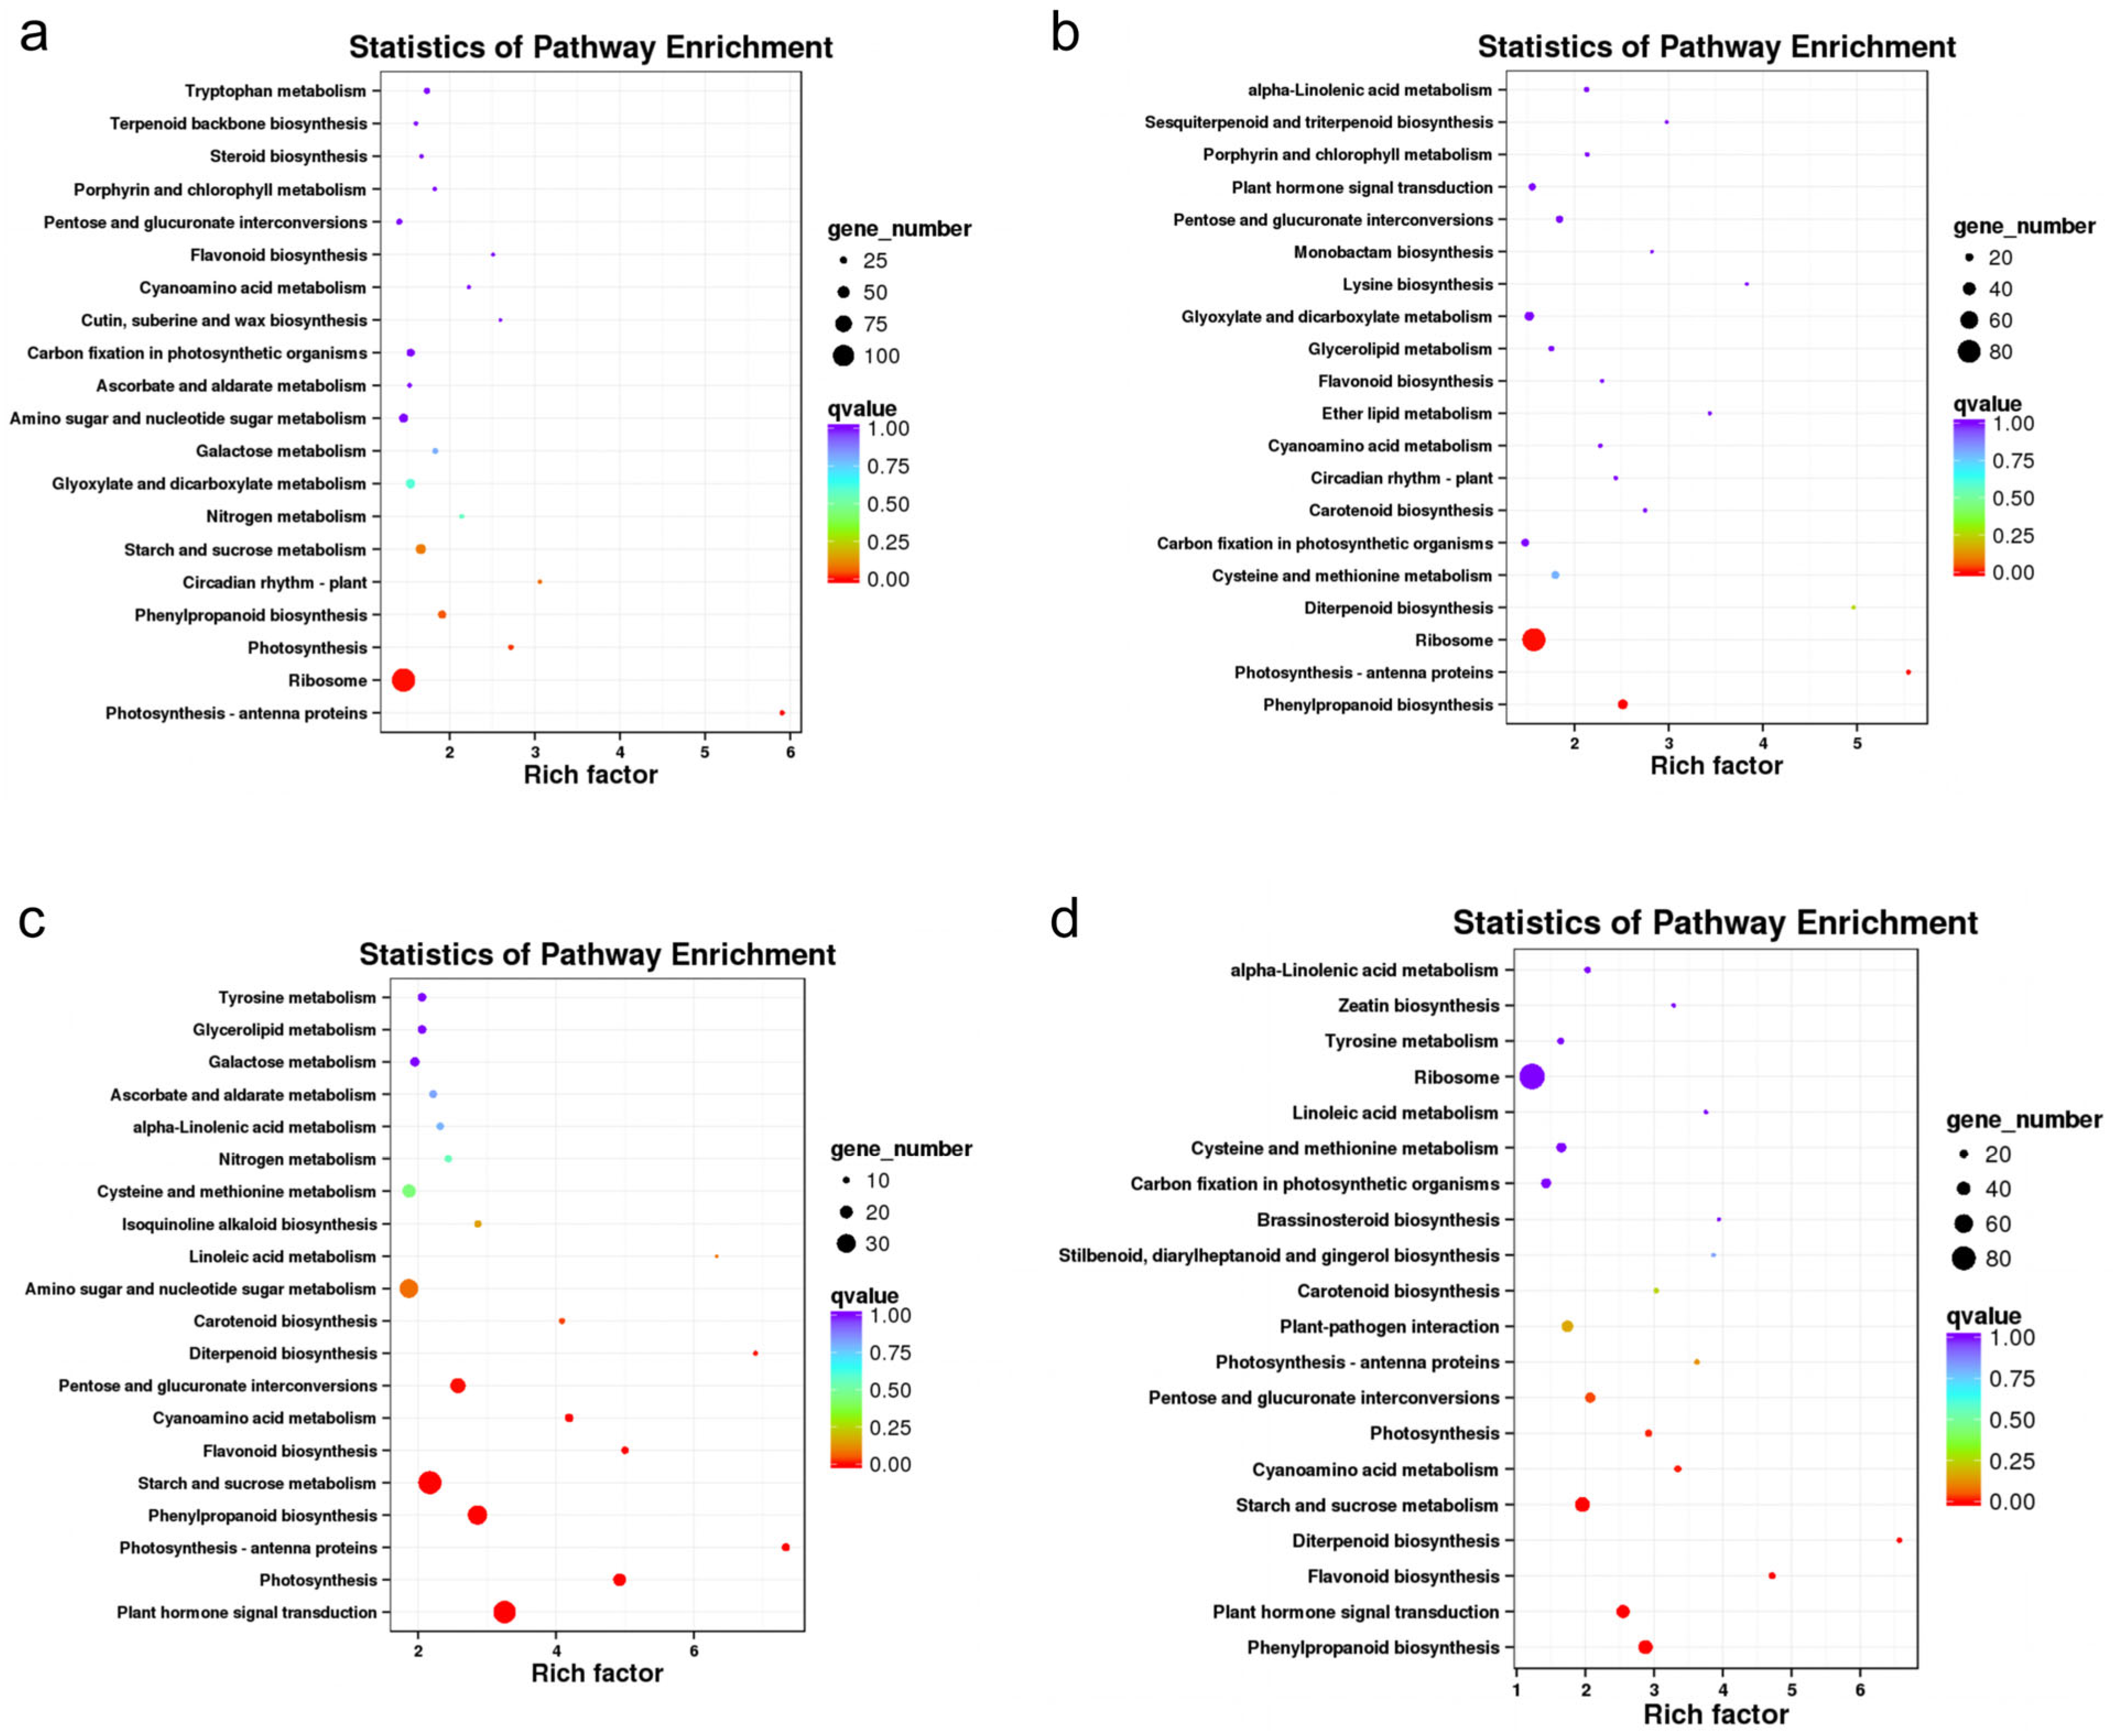
2.7. KEGG Pathway Analysis of DEGs

KEGG pathway analysis showed that 1128, 750, 828, and 1069 DEGs were annotated to KEGG pathways in the CIF vs. GIF, CMF vs. GMF, CIF vs. CMF, and GIF vs. GMF comparisons, respectively; these DEGs were annotated to 113, 102, 109, and 115 KEGG pathways, respectively. Figure 5 shows the 20 most significantly enriched KEGG pathways in the four comparison groups. In the comparison between CIF and GIF (Figure 5a), the three most significantly enriched KEGG pathways were photosynthesis–antenna proteins, ribosomes, and photosynthesis pathways. Similarly, in the comparison between CMF and GMF (Figure 5b), the top three pathways were phenylpropanoid biosynthesis, photosynthesis–antenna proteins, and ribosomes. In the comparison between CIF and CMF (Figure 5c), the top three KEGG pathways were plant hormone signal transduction, photosynthesis, and photosynthesis–antenna proteins. In the comparison between GIF and GMF (Figure 5d), the top three KEGG pathways were phenylpropanoid biosynthesis, plant hormone signal transduction, and flavonoid biosynthesis.

2.8. Analysis of DEGs Related to Flavonoid Synthesis

Analysis of the significantly enriched DEGs in the flavonoid biosynthesis pathway (Table 4) revealed that in the comparison between CIF and GIF, the DEGs CYP and DFR were upregulated while F3H and FAOMT were downregulated; in the comparison between CMF and GMF, CYP was upregulated while CHS and FLS were downregulated; in the comparison between CIF and CMF, BAHD, CCoAOMT, CHI, F3H, FLS, ANR, and CYP were upregulated, and in the comparison between GIF and GMF, CHI, CCoAOMT, DFR, and FLS were upregulated.

3. Discussion

Our transcriptomic and biochemical analyses collectively revealed that Mn stress reprograms flavonoid metabolism in B. papyrifera fruits, which has both ecological and economic ramifications. The dual regulatory role of Mn in plant flavonoid metabolism, in which biosynthesis is facilitated at low concentrations and metabolic homeostasis is disrupted at elevated levels, is prominently exemplified in B. papyrifera fruits. Under optimal Mn availability, flavonoid synthesis is enhanced through the function of Mn as a cofactor for pivotal enzymes, including phenylalanine ammonia-lyase (PAL) and CHS, which drive the phenylpropanoid pathway [30,31,32]. In contrast, excessive Mn accumulation in mining-exposed B. papyrifera fruits induces systemic toxicity, which is characterized by oxidative stress, impaired stomatal conductance (reducing CO2 assimilation), and antagonistic interactions with essential micronutrients (e.g., Fe and Mg) [33,34,35,36]. These physiological perturbations are directly correlated with the downregulation of core flavonoid biosynthetic genes (F3H, CHS, FAOMT, and FLS), mirroring the Mn toxicity patterns observed in litchi (pericarp darkening) [35] and grape (oxidative suppression of PAL/CHS) [31]. Notably, the inhibition of F3H and CHS aligns with diminished flavonoid content, suggesting that Mn overload disrupts carbon allocation to flavonoid precursors (e.g., naringenin) and compromises the synthesis of stress-mitigating flavonols [37,38]. These factors likely contribute to the reduced flavonoid content observed in B. papyrifera fruits from Mn mining areas.
Transcriptomic profiling of B. papyrifera fruit revealed a multifaceted adaptive strategy to Mn stress. DEGs were enriched in biological processes such as detoxification, antioxidant response, and transcription factor activity, indicating a concerted effort to counteract Mn-induced oxidative damage and restore metabolic equilibrium. For instance, novel compounds have been detected in B. papyrifera branches, and these compounds can inhibit ROS production in THP-1 cells [39]. Furthermore, B. papyrifera has been shown to maintain ROS homeostasis through symbiosis with arbuscular mycorrhizal fungi, a process that enhances catalase (CAT), peroxidase (POD), and superoxide dismutase (SOD) activities in the roots [40]. This reprogramming starkly contrasts with the maturation-associated flavonoid dynamics in the control fruits, where CHI and DFR upregulation drives flavonoid diversification, underscoring the plasticity of the pathway under developmental versus environmental cues. The observation that flavonoid-related genes are suppressed in a conserved manner across Mn-stressed species, including B. papyrifera, litchi, and grape, suggests a shared ROS-mediated inhibition mechanism [35,36]. In B. papyrifera, the reduced activity of 2-oxoglutarate-dependent dioxygenases (e.g., F3H and FLS) under excess Mn may reflect competitive inhibition by Mn2+ substitution for Fe2+ in enzyme active sites [41], a hypothesis that requires validation through kinetic assays. Furthermore, Mn-induced dysregulation of FAOMT, which methylates flavonoid glycosides at the 3′-OH and 5′-OH positions to promote generation [42], could accelerate flavonoid degradation in fruits from mining areas, thereby compounding the loss of bioactive metabolites.
By synthesizing phenotypic and molecular data, this study has established a mechanistic framework linking Mn toxicity to flavonoid metabolism in B. papyrifera. The suppression of structural genes (CHS and F3H) and auxiliary regulators (FAOMT and FLS) not only reduces flavonoid diversity but also weakens the plant’s capacity to mitigate oxidative stress, thus creating a feedback loop that exacerbates Mn toxicity. These insights align with the broader patterns of Mn phytotoxicity in non-hyperaccumulator species, where disrupted micronutrient homeostasis and enzyme dysfunction converge to impair specialized metabolism [34,43,44,45]. Future studies should prioritize the functional characterization of candidate DEGs (e.g., F3H, FAOMT, CHS, and FLS) to elucidate their roles in Mn detoxification and flavonoid regulation, particularly in perennial species adapted to metalliferous environments. Notably, the comparison between immature and mature control fruits (GIF vs. GMF) revealed that CHI, CCoAOMT, DFR, and FLS were upregulated, suggesting that fruit maturation itself could also drive flavonoid pathway activation.
In addition to elucidating molecular responses, our findings have practical implications for phytoremediation. B. papyrifera’s ability to thrive in Mn-contaminated soils [5] and modulate flavonoid synthesis under stress positions it as a dual-purpose candidate capable of (1) stabilizing heavy metals via rhizosphere interactions [7] and (2) producing value-added metabolites for biorefinery. For example, Mn-stressed fruits, despite having reduced flavonoid content, may still serve as raw materials for antioxidant extracts, whereas high-biomass foliage aids in soil remediation. Future field trials should evaluate the tradeoffs between Mn accumulation and metabolite yields to optimize phytomanagement strategies. Modulation of flavonoid synthesis genes under Mn stress also leads to functional food development. B. papyrifera fruits are traditionally used in fermented beverages, such as Jiaosu [17], where flavonoids contribute to its antioxidant and anti-inflammatory properties. Our identification of FLS and FAOMT as Mn-responsive genes suggests that soil Mn levels could be strategically managed to enhance specific flavonoid subclasses (e.g., flavonols or methylated derivatives) in cultivated populations. Such targeted cultivation along with postharvest processing (e.g., microbial fermentation to hydrolyze glycosides) may maximize the nutraceutical potential of these fruits in heavy metal-affected regions. In addition, the dual role of B. papyrifera as a phytoremediator and fodder source necessitates careful risk–benefit analysis. It is imperative to implement strategies aimed at mitigating the associated risks. For example, farmers in heavy metal-polluted regions often reserve B. papyrifera biomass for non-feed purposes, such as bioenergy production [46], and use uncontaminated plantations for fodder. Additionally, agronomic intervention measures, such as co-cultivation with metal-immobilizing plants (e.g., Pennisetum purpureum Schum and Melia azedarach linnaeus), can suppress metal uptake by B. papyrifera without hindering its phytoremediation efficacy, further mitigating contamination risks [6].

4. Materials and Methods

4.1. Plant Materials and Soil Analysis

B. papyrifera is found in various habitats. In this study, we selected wild-type B. papyrifera populations growing naturally in the Xiangtan manganese mining area (27°53′ N, 112°45′ E) and the campus of Central South Forestry University (28°08′ N, 113°00′ E) as the study material. The distance between the two sites was approximately 25 km, and the climatic conditions were the same. The Xiangtan manganese mine was once an important mining area, and manganese, cadmium, and other metals in the soil significantly exceeded the standards [47]. B. papyrifera is a pioneering plant in the Xiangtan manganese mine. Compared to the campus, B. papyrifera in the Xiangtan manganese mine faces severe heavy metal stress [12]. The fruits of B. papyrifera have a long maturation process, and fruits at different developmental stages would coexist on the same tree. In July 2019 and September 2019, we collected CIF and CMF of B. papyrifera from the Xiangtan manganese mining area, respectively, and collected GIF and GMF of B. papyrifera on campus at the same stage as the controls. Freshly harvested fruits were immediately cut into small pieces (approximately 0.5 cm) and flash-frozen in liquid nitrogen for 5 min to preserve RNA integrity. The frozen samples were then transferred to a −80 °C freezer for long-term storage until RNA extraction. Additionally, soil samples were taken from the 0 to 20 cm layer within a 50 cm radius centered on the sampled B. papyrifera trunk. The samples were air-dried, ground, and sieved using a 100-mesh sieve for subsequent analyses.
The soil organic carbon content was determined using spectrophotometry, total nitrogen content was determined using the Kjeldahl method, total phosphorus content was determined using the molybdenum–antimony anti-colorimetric method, and Mn content was determined using flame atomic absorption spectroscopy. The total flavonoid content of B. papyrifera fruit was determined using the aluminum ion complexation method. For further details on the testing of the plant and soil samples, please refer to our previous report [12].

4.2. RNA Extraction, Library Construction, and Sequencing

Total RNA was extracted from each sample using an EASYspin Plus Plant RNA Rapid Extraction Kit (Aidlab Biotech, Beijing, China). The extracted RNA was subjected to 1.0% agarose gel electrophoresis to detect potential degradation or contamination [48]. RNA purity was determined using a nucleic acid protein analyzer spectrophotometer (Implen, Westlake Village, CA, USA) [49], and RNA concentration and integrity were analyzed using the Qubit RNA Assay Kit (Life Technologies, Carlsbad, CA, USA) and RNA Nano 6000 Assay Kit (Agilent Technologies, Santa Clara, CA, USA) [50].

4.3. Data Assembly and Gene Function Annotation

Raw RNA-seq reads were subjected to quality control using FastQC [51] to assess sequence quality, GC content, and potential adapter contamination. Low-quality reads (Phred score < 20), adapter sequences, and reads shorter than 50 bp were trimmed using Trimmomatic [52]. rRNA contamination was identified and removed using SortMeRNA [53] against the SILVA rRNA database using SortMeRNA. High-quality reads were assembled de novo using Trinity [54] with the default parameters (k-mer size = 25, min_contig_length = 200). Redundant transcripts were clustered using CD-HIT-EST [55] at a 95% sequence identity threshold to generate a non-redundant unigene set. The accuracy of the assembled transcripts was validated by remapping raw reads in the final assembly using Bowtie2 [56]. Transcript abundance was quantified via Salmon [57] in alignment-based mode. Potential misassemblies were identified and rectified using Pilon [58] with iterative polishing.
Open reading frames were predicted using TransDecoder [59] with a minimum length of 100 amino acids. Following this, the unigenes were compared to the NR, Pfam, KOG, COG, eggNOG, Swiss-Prot (manually annotated and reviewed protein sequence database), KEGG, and GO. Functional classification of the unigenes in KEGG was performed using KOBAS [60]. Following the prediction of the amino acid sequences of the unigenes, HMMER software (v3.3.2) was employed for comparisons with the Pfam database to obtain annotation information for the unigenes [61].

4.4. Quantitative Gene Expression Level and Differential Expression Analysis

Bowtie was used to align the sequenced reads with the unigene library [62]. Because RSEM (https://github.com/deweylab/RSEM, accessed on 9 March 2025) is compatible with de novo transcriptomes and does not require a reference genome [63], it has high reliability among similar software [64]. Therefore, RSEM was used to quantify the gene expression levels in this study. First, the reference transcripts were preprocessed using the scripts rsem-prepare-reference with genome annotations or de novo assemblies. Second, rsem-calculate-expression aligns reads and employs an expectation–maximization (EM) algorithm to estimate transcript abundance and probabilistically resolve ambiguous reads. Bayesian Gibbs sampling was employed to compute 95% credibility intervals and posterior mean estimates. The expression abundance of each unigene was represented as Fragments Per Kilobase of transcript per Million mapped reads (FPKM).
Differentially expressed genes (DEGs) between two samples were analyzed using EBSeq [65]. Significant p-values obtained from the original hypothesis test were corrected using the Benjamini–Hochberg method, and the final corrected p-value, that is, the False Discovery Rate (FDR), was used as the key indicator for DEG screening. In the screening process, FDR < 0.01 and differential multiple fold change (FC) ≥ 2 were used as the screening criteria [66].

4.5. RT-qPCR to Verify DEGs

The expression levels of the DEGs in the samples were validated using quantitative real-time polymerase chain reaction (RT-qPCR) [67]. Total RNA was extracted from the samples using the CTAB method, and reverse transcription amplification was performed using a Goldenstar RT6 cDNA Synthesis Kit Ver 2 (Tsingke Biotech, Beijing, China). The RNA template, gDNA remover, 10 × gDNA remover buffer, and RNase-free water were combined and incubated at 42 °C for 2 min, followed by incubation at 60 °C for 5 min. The mixture was then rapidly cooled. Following brief centrifugation, dNTP Mix (1 µL), Randomer primer (1 µL), 5 × Goldenstar TM Buffer (4 µL), DTT (2 M) (1 µL), and Goldenstar TM RT6 enzyme (a volume of 1 µL) were combined with 2 µL of RNase-free water, and the mixture was incubated at 25 °C for 10 min, 50 °C for 30 min, and 85 °C for 5 min. The cDNA obtained through reverse transcription was diluted and used as a template for RT-qPCR. Considering that the Actin gene of B. papyrifera is a stable reference gene for RT-PCR [2,68], it was selected as an internal reference for PCR amplification. RT-qPCR was performed using an FQD-96A fluorescence quantitative PCR instrument (Tsingke Biotech, Beijing, China). The primers are shown in Table S1. The components of the amplification system were as follows: 2 × T5 Fast qPCR Mix (10 μL), 10 μM Primer F (0.8 μL), 10 μM Primer F (0.8 μL), cDNA Template (1 μL), and ddH2O (7.4 μL), a total of 20 µL. The specific amplification steps are shown in Table S2. Relative expression levels were calculated using the 2−ΔΔCT method [69]. Briefly, the Ct values of target genes were normalized to BpACT2, and fold changes were derived by comparing the ΔCt values between the Mn-exposed and control groups. The final expression values were log2-transformed for visualization.

4.6. Statistical Analysis

The experimental data were statistically analyzed using SPSS 23 software. Pearson’s coefficient was used to analyze the correlation between the flavonoid content of B. papyrifera fruit and the soil element content [70]. Standard deviations were used to represent the variability of the samples. Differences were considered statistically significant at p < 0.05.

5. Conclusions

Transcriptomic analysis of B. papyrifera fruits from Mn mining and control areas was performed. The results demonstrated that in the context of disparate Mn environments, the DEGs in B. papyrifera fruits were predominantly associated with functions such as response to stimuli, detoxification, growth, signaling, and transcription factor activity. Furthermore, examination of the DEGs involved in the flavonoid synthesis pathway revealed that F3H, FAOMT, CHS, and FLS may be pivotal genes influencing flavonoid synthesis in the fruit of B. papyrifera. Further research is required to elucidate the effect of Mn on the specific mechanism of flavonoid synthesis and to ascertain how the content and quality of flavonoids in plants can be enhanced by regulating the Mn content in the soil. Additionally, the potential of genetic engineering techniques to develop new plant varieties with higher flavonoid content should be considered to meet the demand for healthy foods.

Supplementary Materials

The following supporting information can be downloaded at: https://www.mdpi.com/article/10.3390/plants14060883/s1. Figure S1. Length distribution of unigenes in the B. papyrifera fruit transcriptome. The X-axis represents the length intervals of unigenes, and the Y-axis represents the number of unigenes of different lengths. Table S1. Primers used for RT-qPCR analysis. Table S2. PCR amplification system components and amplification steps.

Author Contributions

Conceptualization, Z.H.; data curation, Y.T. and G.Y.; formal analysis, Z.X.; investigation, Y.W.; methodology, Y.T. and J.Z.; project administration, Y.Z.; software, T.L.; supervision, Z.X.; validation, Y.H.; writing—original draft, Z.H. and Y.T.; writing—review and editing, Z.H. and Z.X. All authors have read and agreed to the published version of the manuscript.

Funding

This research was funded by the National Natural Science Foundation of China (U20A20118), the Project of Science and Technology Commission Serving Rural Revitalization (2024RC8220), the Natural Science Foundation of Hunan Province (2024JJ5064), and the National Undergraduate Innovation and Entrepreneurship Training Program (S202411527026).

Data Availability Statement

The transcriptome data of B. papyrifera fruit have been uploaded to the China National Center for Bioinformation (https://www.cncb.ac.cn/) under accession number PRJCA011809. Other data are contained within the article and Supplementary Materials.

Conflicts of Interest

The authors declare no conflicts of interest.

References

  1. Xu, Z.; Yang, S.; Li, C.; Xie, M.; He, Y.; Chen, S.; Tang, Y.; Li, D.; Wang, T.; Yang, G. Characterization of metallothionein genes from Broussonetia papyrifera: Metal binding and heavy metal tolerance mechanisms. BMC Genom. 2024, 25, 563. [Google Scholar] [CrossRef]
  2. Zhou, F.; Xu, L.; Shi, C.; Wu, F.; Yang, S. Identification of the Optimal Quantitative RT-PCR Reference Gene for Paper Mulberry (Broussonetia papyrifera). Curr. Issues Mol. Biol. 2024, 46, 10779–10794. [Google Scholar] [CrossRef]
  3. Lin, J.; Zhang, B.; Zou, J.; Luo, Z.; Yang, H.; Zhou, P.; Chen, X.; Zhou, W. Induction of tetraploids in Paper Mulberry (Broussonetia papyrifera (L.) L’Hér. ex Vent.) by colchicine. BMC Plant Biol. 2023, 23, 574. [Google Scholar] [CrossRef]
  4. Tang, T.; Bai, J.; Ao, Z.; Wei, Z.; Hu, Y.; Liu, S. Effects of dietary paper mulberry (Broussonetia papyrifera) on growth performance and muscle quality of grass carp (Ctenopharyngodon idella). Animals 2021, 11, 1655. [Google Scholar] [CrossRef] [PubMed]
  5. Nong, H.; Liu, J.; Chen, J.; Zhao, Y.; Wu, L.; Tang, Y.; Liu, W.; Yang, G.; Xu, Z. Woody plants have the advantages in the phytoremediation process of manganese ore with the help of microorganisms. Sci. Total Environ. 2023, 863, 160995. [Google Scholar] [CrossRef] [PubMed]
  6. Wang, X.-H.; Xiao, X.-Y.; Guo, Z.-H.; Peng, C.; Wang, X.-Y. Potential of Intercropping Pennisetum purpureum Schum with Melia azedarach L. and Broussonetia papyrifera for Phytoremediation of Heavy-metal Contaminated Soil around Mining Areas. Huan Jing Ke Xue Huanjing Kexue 2023, 44, 426–435. [Google Scholar] [PubMed]
  7. Xu, Z.; Wang, T.; Hou, S.; Ma, J.; Li, D.; Chen, S.; Gao, X.; Zhao, Y.; He, Y.; Yang, G. A R2R3-MYB, BpMYB1, from paper mulberry interacts with DELLA protein BpGAI1 in soil cadmium phytoremediation. J. Hazard. Mater. 2024, 463, 132871. [Google Scholar] [CrossRef]
  8. Pang, S.; Huang, B.; Zhang, Q. Advances in research on chemical constituents of Broussonetia plants and their pharmacological activities. Pharm. Care Res. 2006, 6, 98. [Google Scholar]
  9. Guo, P.; Huang, Z.; Li, X.; Zhao, W.; Wang, Y. Transcriptome Sequencing of Broussonetia papyrifera Leaves Reveals Key Genes Involved in Flavonoids Biosynthesis. Plants 2023, 12, 563. [Google Scholar] [CrossRef]
  10. Peng, X.; Liu, H.; Chen, P.; Tang, F.; Hu, Y.; Wang, F.; Pi, Z.; Zhao, M.; Chen, N.; Chen, H.; et al. A Chromosome-Scale Genome Assembly of Paper Mulberry (Broussonetia papyrifera) Provides New Insights into Its Forage and Papermaking Usage. Mol. Plant 2019, 12, 661–677. [Google Scholar] [CrossRef]
  11. Hou, D.; O’Connor, D.; Igalavithana, A.D.; Alessi, D.S.; Luo, J.; Tsang, D.C.W.; Sparks, D.L.; Yamauchi, Y.; Rinklebe, J.; Ok, Y.S. Metal contamination and bioremediation of agricultural soils for food safety and sustainability. Nat. Rev. Earth Environ. 2020, 1, 366–381. [Google Scholar] [CrossRef]
  12. Zhenggang, X.; Yiwang, T.; Jiaying, W.; Chongxuan, H.; Tianyu, W.; Jiakang, Z.; Guiyan, Y. Broussonetia papyrifera fruits as a potential source of functional materials to develop the phytoremediation strategy. Environ. Chall. 2022, 7, 100478. [Google Scholar] [CrossRef]
  13. Kumar, S.; Korra, T.; Thakur, R.; Arutselvan, R.; Kashyap, A.S.; Nehela, Y.; Chaplygin, V.; Minkina, T.; Keswani, C. Role of plant secondary metabolites in defence and transcriptional regulation in response to biotic stress. Plant Stress 2023, 8, 100154. [Google Scholar]
  14. Al-Khayri, J.M.; Rashmi, R.; Toppo, V.; Chole, P.B.; Banadka, A.; Sudheer, W.N.; Nagella, P.; Shehata, W.F.; Al-Mssallem, M.Q.; Alessa, F.M. Plant secondary metabolites: The weapons for biotic stress management. Metabolites 2023, 13, 716. [Google Scholar] [CrossRef] [PubMed]
  15. Ibrahim, W.; Zhu, Y.-M.; Chen, Y.; Qiu, C.-W.; Zhu, S.; Wu, F. Genotypic differences in leaf secondary metabolism, plant hormones and yield under alone and combined stress of drought and salinity in cotton genotypes. Physiol. Plant. 2019, 165, 343–355. [Google Scholar] [CrossRef]
  16. Ngo, V.-D.; Jang, B.-E.; Park, S.-U.; Kim, S.-J.; Kim, Y.-J.; Chung, S.-O. Estimation of functional components of Chinese cabbage leaves grown in a plant factory using diffuse reflectance spectroscopy. J. Sci. Food Agric. 2019, 99, 711–718. [Google Scholar] [CrossRef]
  17. Yanzi, L.; Peng, L.; Yan, Z.; Kangkang, J.; Meng, D.; Zhiyuan, H.; Yunlin, Z.; Guiyan, Y.; Zhenggang, X. Utilization of Gynostemma pentaphyllum and Houttuynia cordata medicinal plants to make Jiaosu: A healthy food. CyTA-J. Food 2022, 20, 143–148. [Google Scholar] [CrossRef]
  18. Teklić, T.; Parađiković, N.; Špoljarević, M.; Zeljković, S.; Lončarić, Z.; Lisjak, M. Linking abiotic stress, plant metabolites, biostimulants and functional food. Ann. Appl. Biol. 2021, 178, 169–191. [Google Scholar] [CrossRef]
  19. Karmakar, R.; Mukhopadhyay, C. Green synthesis of bioactive flavonoids as cardioprotective and anticancer drug agents. In Green Approaches in Medicinal Chemistry for Sustainable Drug Design; Elsevier: Amsterdam, The Netherlands, 2024; pp. 305–343. [Google Scholar]
  20. Rao, M.J.; Duan, M.; Eman, M.; Yuan, H.; Sharma, A.; Zheng, B. Comparative Analysis of Citrus Species’ Flavonoid Metabolism, Gene Expression Profiling, and Their Antioxidant Capacity under Drought Stress. Antioxidants 2024, 13, 1149. [Google Scholar] [CrossRef]
  21. Yang, H.; Zhang, X.; Cui, D.; Zhu, Y.G.; Zhang, Y.; Zhang, Z. Mechanism of flavonols on detoxification, migration and transformation of indium in rhizosphere system. Sci. Total Environ. 2024, 929, 172693. [Google Scholar] [CrossRef]
  22. Oluwole, O.; Fernando, W.B.; Lumanlan, J.; Ademuyiwa, O.; Jayasena, V. Role of phenolic acid, tannins, stilbenes, lignans and flavonoids in human health—A review. Int. J. Food Sci. Technol. 2022, 57, 6326–6335. [Google Scholar] [CrossRef]
  23. Gupta, R.; Min, C.W.; Kramer, K.; Agrawal, G.K.; Rakwal, R.; Park, K.-H.; Wang, Y.; Finkemeier, I.; Kim, S.T. A Multi-Omics Analysis of Glycine max Leaves Reveals Alteration in Flavonoid and Isoflavonoid Metabolism Upon Ethylene and Abscisic Acid Treatment. Proteomics 2018, 18, 1700366. [Google Scholar] [CrossRef] [PubMed]
  24. Liu, W.; Feng, Y.; Yu, S.; Fan, Z.; Li, X.; Li, J.; Yin, H. The Flavonoid Biosynthesis Network in Plants. Int. J. Mol. Sci. 2021, 22, 12824. [Google Scholar] [CrossRef]
  25. Wang, F.; Su, Y.; Chen, N.; Shen, S. Genome-wide analysis of the UGT gene family and identification of flavonoids in Broussonetia papyrifera. Molecules 2021, 26, 3449. [Google Scholar] [CrossRef] [PubMed]
  26. Tian, J.-L.; Liu, T.-L.; Xue, J.-J.; Hong, W.; Zhang, Y.; Zhang, D.-X.; Cui, C.-C.; Liu, M.-C.; Niu, S.-L. Flavanoids derivatives from the root bark of Broussonetia papyrifera as a tyrosinase inhibitor. Ind. Crops Prod. 2019, 138, 111445. [Google Scholar] [CrossRef]
  27. Jiao, P.; Chaoyang, L.; Wenhan, Z.; Jingyi, D.; Yunlin, Z.; Zhenggang, X. Integrative Metabolome and Transcriptome Analysis of Flavonoid Biosynthesis Genes in Broussonetia papyrifera Leaves from the Perspective of Sex Differentiation. Front. Plant Sci. 2022, 13, 900030. [Google Scholar] [CrossRef]
  28. Chang, C.-S.; Liu, H.-L.; Moncada, X.; Seelenfreund, A.; Seelenfreund, D.; Chung, K.-F. A holistic picture of Austronesian migrations revealed by phylogeography of Pacific paper mulberry. Proc. Natl. Acad. Sci. USA 2015, 112, 13537. [Google Scholar] [CrossRef]
  29. Xu, Z.; Dong, M.; Peng, X.; Ku, W.; Zhao, Y.; Yang, G. New insight into the molecular basis of cadmium stress responses of wild paper mulberry plant by transcriptome analysis. Ecotoxicol. Environ. Saf. 2019, 171, 301–312. [Google Scholar] [CrossRef]
  30. Vidović, N.; Pasković, I.; Lukić, I.; Žurga, P.; Majetić Germek, V.; Grozić, K.; Cukrov, M.; Marcelić, Š.; Ban, D.; Talhaoui, N. Biophenolic profile modulations in olive tissues as affected by manganese nutrition. Plants 2021, 10, 1724. [Google Scholar] [CrossRef]
  31. Chen, H.; Yang, J.; Deng, X.; Lei, Y.; Xie, S.; Guo, S.; Ren, R.; Li, J.; Zhang, Z.; Xu, T. Foliar-sprayed manganese sulfate improves flavonoid content in grape berry skin of Cabernet Sauvignon (Vitis vinifera L.) growing on alkaline soil and wine chromatic characteristics. Food Chem. 2020, 314, 126182. [Google Scholar] [CrossRef]
  32. Li, J.; Ackah, M.; Amoako, F.K.; Cui, Z.; Sun, L.; Li, H.; Tsigbey, V.E.; Zhao, M.; Zhao, W. Metabolomics and physio-chemical analyses of mulberry plants leaves response to manganese deficiency and toxicity reveal key metabolites and their pathways in manganese tolerance. Front. Plant Sci. 2024, 15, 1349456. [Google Scholar] [CrossRef] [PubMed]
  33. Xiao, Z.; Pan, G.; Li, X.; Kuang, X.; Wang, W.; Liu, W. Effects of exogenous manganese on its plant growth, subcellular distribution, chemical forms, physiological and biochemical traits in Cleome viscosa L. Ecotoxicol. Environ. Saf. 2020, 198, 110696. [Google Scholar] [CrossRef] [PubMed]
  34. Santos, E.F.; Santini, J.M.K.; Paixão, A.P.; Júnior, E.F.; Lavres, J.; Campos, M.; Dos Reis, A.R. Physiological highlights of manganese toxicity symptoms in soybean plants: Mn toxicity responses. Plant Physiol. Biochem. 2017, 113, 6–19. [Google Scholar] [CrossRef] [PubMed]
  35. Liu, S.; Xiao, Y.; Bai, C.; Liu, H.; Su, X.; Jin, P.; Xu, H.; Cao, L.; Yao, L. The physiological and biochemical responses to dark pericarp disease induced by excess manganese in litchi. Plant Physiol. Biochem. 2024, 206, 108269. [Google Scholar] [CrossRef]
  36. Bai, Y.; Zhou, Y.; Gong, J. Physiological mechanisms of the tolerance response to manganese stress exhibited by Pinus massoniana, a candidate plant for the phytoremediation of Mn-contaminated soil. Environ. Sci. Pollut. Res. 2021, 28, 45422–45433. [Google Scholar] [CrossRef]
  37. Chen, Q.; Song, D.; Sun, X.; Tian, Y.; Yan, Z.; Min, T.; Wang, H.; Wang, L. Functional Characterization of F3H Gene and Optimization of Dihydrokaempferol Biosynthesis in Saccharomyces cerevisiae. Molecules 2024, 29, 2196. [Google Scholar] [CrossRef]
  38. Dai, M.; Kang, X.; Wang, Y.; Huang, S.; Guo, Y.; Wang, R.; Chao, N.; Liu, L. Functional characterization of Flavanone 3-Hydroxylase (F3H) and its role in anthocyanin and flavonoid biosynthesis in mulberry. Molecules 2022, 27, 3341. [Google Scholar] [CrossRef]
  39. Malaník, M.; Treml, J.; Leláková, V.; Nykodýmová, D.; Oravec, M.; Marek, J.; Šmejkal, K. Anti-inflammatory and antioxidant properties of chemical constituents of Broussonetia papyrifera. Bioorg. Chem. 2020, 104, 104298. [Google Scholar] [CrossRef]
  40. Liang, J.; Wang, Z.; Ren, Y.; Jiang, Z.; Chen, H.; Hu, W.; Tang, M. The alleviation mechanisms of cadmium toxicity in Broussonetia papyrifera by arbuscular mycorrhizal symbiosis varied with different levels of cadmium stress. J. Hazard. Mater. 2023, 459, 132076. [Google Scholar] [CrossRef]
  41. Beyer Jr, W.F.; Fridovich, I. In vivo competition between iron and manganese for occupancy of the active site region of the manganese-superoxide dismutase of Escherichia coli. J. Biol. Chem. 1991, 266, 303–308. [Google Scholar] [CrossRef]
  42. Katayama-Ikegami, A.; Sakamoto, T.; Shibuya, K.; Katayama, T.; Gao-Takai, M. Effects of abscisic acid treatment on berry coloration and expression of flavonoid biosynthesis genes in grape. Am. J. Plant Sci. 2016, 7, 1325. [Google Scholar] [CrossRef]
  43. Costa, G.B.; Simioni, C.; Ramlov, F.; Maraschin, M.; Chow, F.; Bouzon, Z.L.; Schmidt, É.C. Effects of manganese on the physiology and ultrastructure of Sargassum cymosum. Environ. Exp. Bot. 2017, 133, 24–34. [Google Scholar] [CrossRef]
  44. He, L.; Su, R.; Chen, Y.; Zeng, P.; Du, L.; Cai, B.; Zhang, A.; Zhu, H. Integration of manganese accumulation, subcellular distribution, chemical forms, and physiological responses to understand manganese tolerance in Macleaya cordata. Environ. Sci. Pollut. Res. 2022, 29, 39017–39026. [Google Scholar] [CrossRef]
  45. Thiesen, L.A.; Brunetto, G.; Trentin, E.; da Silva, A.A.K.; Tabaldi, L.A.; Schwalbert, R.; Birck, T.P.; Machado, L.C.; Nicoloso, F.T. Subcellular distribution and physiological responses of native and exotic grasses from the Pampa biome subjected to excess manganese. Chemosphere 2023, 310, 136801. [Google Scholar] [CrossRef] [PubMed]
  46. Han, Z.; Guo, Z.; Zhang, Y.; Xiao, X.; Peng, C. Potential of Pyrolysis for the Recovery of Heavy Metals and Bioenergy from Contaminated Broussonetia papyrifera Biomass. BioResources 2018, 13, 2932–2944. [Google Scholar] [CrossRef]
  47. Xu, Z.; Ding, Y.; Huang, H.; Wu, L.; Zhao, Y.; Yang, G. Biosorption Characteristics of Mn (II) by Bacillus cereus Strain HM-5 Isolated from Soil Contaminated by Manganese Ore. Pol. J. Environ. Stud. 2019, 28, 463–472. [Google Scholar] [CrossRef]
  48. Yue, Y.; Wang, H.; Wang, T.; Zheng, D.; Thomas, H.R.; Yang, X.; Wang, L. Integrated physiological, hormonal, and transcriptomic analyses reveal a novel E3 ubiquitin ligase-mediated cold acclimation mechanism for the acquisition of cold tolerance in sweet osmanthus. Ind. Crops Prod. 2024, 220, 119171. [Google Scholar] [CrossRef]
  49. Almalki, S.; Kiss-Toth, E.; Ridger, V. BS07 Micro RNA sequencing analysis of neutrophil derived microvesicles produced in response to proatherogenic stimuli. Heart 2024, 110, 248–249. [Google Scholar]
  50. Xu, L.; Berninger, A.; Lakin, S.M.; O’Donnell, V.; Pierce, J.L.; Pauszek, S.J.; Barrette, R.W.; Faburay, B. Direct RNA sequencing of foot-and-mouth disease virus genome using a flongle on MinION. Bio-Protocol 2024, 14, e5017. [Google Scholar] [CrossRef]
  51. de Sena Brandine, G.; Smith, A.D. Falco: High-speed FastQC emulation for quality control of sequencing data. F1000Research 2021, 8, 1874. [Google Scholar] [CrossRef]
  52. Bolger, A.M.; Lohse, M.; Usadel, B. Trimmomatic: A flexible trimmer for Illumina sequence data. Bioinformatics 2014, 30, 2114–2120. [Google Scholar] [CrossRef] [PubMed]
  53. Kopylova, E.; Noé, L.; Touzet, H. SortMeRNA: Fast and accurate filtering of ribosomal RNAs in metatranscriptomic data. Bioinformatics 2012, 28, 3211–3217. [Google Scholar] [CrossRef]
  54. Nasiri, J.; Soorni, A.; van Dijk, A.; Naghavi, M. Terpenoid Biosynthetic Pathway in Ferula persica Using Transcriptome Analysis and Metabolome Data. J. Agric. Sci. Technol. (JAST) 2024, 26, 177–192. [Google Scholar]
  55. Li, W.; Godzik, A. Cd-hit: A fast program for clustering and comparing large sets of protein or nucleotide sequences. Bioinformatics 2006, 22, 1658–1659. [Google Scholar] [CrossRef]
  56. Langdon, W.B. Performance of genetic programming optimised Bowtie2 on genome comparison and analytic testing (GCAT) benchmarks. BioData Min. 2015, 8, 1. [Google Scholar] [CrossRef]
  57. Patro, R.; Duggal, G.; Love, M.I.; Irizarry, R.A.; Kingsford, C. Salmon provides fast and bias-aware quantification of transcript expression. Nat. Methods 2017, 14, 417–419. [Google Scholar] [CrossRef]
  58. Walker, B.J.; Abeel, T.; Shea, T.; Priest, M.; Abouelliel, A.; Sakthikumar, S.; Cuomo, C.A.; Zeng, Q.; Wortman, J.; Young, S.K. Pilon: An integrated tool for comprehensive microbial variant detection and genome assembly improvement. PLoS ONE 2014, 9, e112963. [Google Scholar] [CrossRef] [PubMed]
  59. Grabherr, M.G.; Haas, B.J.; Yassour, M.; Levin, J.Z.; Thompson, D.A.; Amit, I.; Adiconis, X.; Fan, L.; Raychowdhury, R.; Zeng, Q. Full-length transcriptome assembly from RNA-Seq data without a reference genome. Nat. Biotechnol. 2011, 29, 644–652. [Google Scholar] [CrossRef]
  60. Liu, L.; Wen, J.; Liu, J.; Li, D.; Zhang, T.; Peng, C.; He, Y. Rhizosphere metagenomics provides insights into the environmental effect on the secondary metabolism of Ligusticum chuanxiong. Ind. Crops Prod. 2024, 217, 118779. [Google Scholar] [CrossRef]
  61. Amalfitano, A.; Stocchi, N.; Atencio, H.M.; Villarreal, F.; Ten Have, A. Seqrutinator: Scrutiny of large protein superfamily sequence datasets for the identification and elimination of non-functional homologues. Genome Biol. 2024, 25, 230. [Google Scholar] [CrossRef]
  62. Sami, A.; El-Metwally, S.; Rashad, M. MAC-ErrorReads: Machine learning-assisted classifier for filtering erroneous NGS reads. BMC Bioinform. 2024, 25, 61. [Google Scholar] [CrossRef] [PubMed]
  63. Li, B.; Dewey, C.N. RSEM: Accurate transcript quantification from RNA-Seq data with or without a reference genome. BMC Bioinform. 2011, 12, 323. [Google Scholar] [CrossRef] [PubMed]
  64. Zhang, C.; Zhang, B.; Lin, L.-L.; Zhao, S. Evaluation and comparison of computational tools for RNA-seq isoform quantification. BMC Genom. 2017, 18, 583. [Google Scholar] [CrossRef]
  65. Leng, N.; Dawson, J.A.; Thomson, J.A.; Ruotti, V.; Rissman, A.I.; Smits, B.M.; Haag, J.D.; Gould, M.N.; Stewart, R.M.; Kendziorski, C. EBSeq: An empirical Bayes hierarchical model for inference in RNA-seq experiments. Bioinformatics 2013, 29, 1035–1043. [Google Scholar] [CrossRef]
  66. Hoyer, A.; Chakraborty, S.; Lilienthal, I.; Konradsen, J.R.; Katayama, S.; Söderhäll, C. The functional role of CST1 and CCL26 in asthma development. Immun. Inflamm. Dis. 2024, 12, e1162. [Google Scholar] [CrossRef]
  67. Cai, M.M.; He, Z.H.; Lin, Z.R.; Nie, G.B.; Li, X.Y.; Liu, H.S.; Ma, Q. Comparative physiological, transcriptome, and qRT-PCR analysis provide insights into osmotic adjustment in the licorice species Glycyrrhiza inflata under salt stress. Crop Sci. 2023, 63, 1442–1457. [Google Scholar] [CrossRef]
  68. Chen, M.; Wang, Z.; Hao, Z.; Li, H.; Feng, Q.; Yang, X.; Han, X.; Zhao, X. Screening and Validation of Appropriate Reference Genes for Real-Time Quantitative PCR under PEG, NaCl and ZnSO4 Treatments in Broussonetia papyrifera. Int. J. Mol. Sci. 2023, 24, 15087. [Google Scholar] [CrossRef]
  69. Livak, K.J.; Schmittgen, T.D. Analysis of relative gene expression data using real-time quantitative PCR and the 2−ΔΔCT method. Methods 2001, 25, 402–408. [Google Scholar] [CrossRef] [PubMed]
  70. Zhang, F.; Ma, Z.; Qiao, Y.; Wang, Z.; Chen, W.; Zheng, S.; Yu, C.; Song, L.; Lou, H.; Wu, J. Transcriptome sequencing and metabolomics analyses provide insights into the flavonoid biosynthesis in Torreya grandis kernels. Food Chem. 2022, 374, 131558. [Google Scholar] [CrossRef]
Figure 1. Pearson correlation analysis between soil elements (Mn, TOC, TN, and TP) and total flavonoid content in B. papyrifera fruits. The X-axis denotes various soil elements, while the Y-axis indicates the correlation coefficient.
Plants 14 00883 g001
Figure 2. Pairwise comparison of DEGs between the sample groups. (a) CIF vs. GIF and CMF vs. GMF. (b) CIF vs. CMF and GIF vs. GMF. Venn diagrams display overlaps of DEGs between comparisons.
Plants 14 00883 g002
Figure 3. Validation of transcriptome data using RT-qPCR for five randomly selected genes. (a) Immature fruit and (b) mature fruit. “Relative expression log2” on the Y-axis represents log2-transformed fold changes normalized to the reference gene Actin and calibrated against the respective control group. Error bars indicate the standard deviation (n = 3 biological replicates).
Plants 14 00883 g003
Figure 4. GO enrichment analysis of DEGs in three categories: biological process, cellular component, and molecular function. (a) CIF vs. GIF. (b) CMF vs. GMF. (c) CIF vs. CMF. (d) GIF vs. GMF. The most significantly enriched terms for each category are presented. Bar length represents the number of DEGs assigned to each term.
Plants 14 00883 g004
Figure 5. KEGG pathway enrichment analysis of DEGs. (a) CIF vs. GIF. (b) CMF vs. GMF. (c) CIF vs. CMF. (d) GIF vs. GMF. The top 20 enriched pathways are ranked by p-value. Circle size indicates the number of DEGs in each pathway; color intensity represents the enrichment significance.
Plants 14 00883 g005
Table 1. RNA sequencing results of B. papyrifera fruit.
SampleRead NumberBase NumberGC Content%≥Q30
CIF21,185,8516,325,128,36847.37%92.77%
GIF22,811,6056,813,841,94247.02%92.45%
CMF24,414,2197,279,736,05048.12%93.17%
GMF22,202,5116,625,058,02047.88%92.88%
Read Number: Total number of pair-end reads in clean data; Base Number: Total number of bases in clean data; GC Content: GC content in clean data; %≥Q30: Percentage of bases with a quality value greater than or equal to 30 in clean data. CIF: contaminated immature fruit; CMF: contaminated mature fruit; GIF: garden immature fruit; GMF: garden mature fruit.
Table 2. Annotation results of B. papyrifera fruit unigenes in the different databases.
DatabaseNumber of UnigenesPercentage (%)
GO21,38946.43
KEGG10,04821.81
KOG16,67036.18
Pfam23,50151.01
Swiss-Prot18,85440.92
NR14,27530.98
COG12,04426.14
Egg-NOG28,97262.88
Total unigenes46,072100
Note: KEGG, Kyoto Encyclopedia of Genes and Genomes; GO, Gene Ontology.
Table 3. Functional annotation of DEGs in the eight databases.
DEG SetAnnotatedCOGGOKEGGKOGPfamnrSwiss-ProteggNOG
CIF vs. GIF298913882021112816372427292320472775
CMF vs. GMF2053941143875010251661204214131934
CIF vs. CMF2451991176682811261954244118532308
GIF vs. GMF301613142168106914462455297822322851
Table 4. DEGs related to flavonoid biosynthesis.
GroupingTendencyGenesNameKo ID
CIF vs. GIFUpCytochrome P450CYPK05280
UpDihydroflavonol/flavanone 4-reductaseDFRK13082
DownFlavone 3-hydroxylaseF3HK00475
DownFlavonoid 3′,5′-O-methyltransferaseFAOMTK00588
CMF vs. GMFUpCytochrome P450CYPK00487
DownChalcone synthaseCHSK00660
DownFlavonol synthaseFLSK05278
CIF vs. CMFUpBAHD acyltransferaseBAHDK13065
UpCytochrome P450CYPK00487
UpCaffeoyl-CoA-O-methyltransferaseCCoAOMTK00588
UpChalcone isomeraseCHIK01859
UpFlavone 3-hydroxylaseF3HK00475
UpFlavonol synthaseFLSK05278
UpAnthocyanidin reductaseANRK08695
GIF vs. GMFUpChalcone isomeraseCHIK01859
UpCaffeoyl-CoA-O-methyltransferaseCCoAOMTK00588
UpDihydroflavonol/flavanone 4-reductaseDFRK13082
UpFlavonol synthaseFLSK05278
Disclaimer/Publisher’s Note: The statements, opinions and data contained in all publications are solely those of the individual author(s) and contributor(s) and not of MDPI and/or the editor(s). MDPI and/or the editor(s) disclaim responsibility for any injury to people or property resulting from any ideas, methods, instructions or products referred to in the content.

