Article

Genome-Wide Identification, Characterization, and Expression Analysis of Orphan Genes Within Coriander

1
School of Agriculture, Jilin Agricultural Science and Technology University, Jilin 132101, China
2
Institute of Agricultural Biotechnology, Jilin Academy of Agricultural Sciences (Northeast Agricultural Research Center of China), Changchun 130033, China
3
Molecular Biology of Vegetable Laboratory, College of Horticulture, Shenyang Agricultural University, Shenyang 110866, China
*
Authors to whom correspondence should be addressed.
These authors contributed equally to this work.
Plants 2025, 14(5), 778; https://doi.org/10.3390/plants14050778
Submission received: 4 February 2025 / Revised: 21 February 2025 / Accepted: 1 March 2025 / Published: 3 March 2025
(This article belongs to the Special Issue The Growth and Development of Vegetable Crops—2nd Edition)

Abstract

Orphan genes (OGs) are genes that have no significant sequence similarity with known genes from other species or lineages. Identifying and characterizing OGs have become more feasible with the increasing availability of plant transcriptomes and genome sequences. OGs play important roles in response to both biotic and abiotic stresses, contributing to biological functions and lineage-specific traits. This study aimed to identify and characterize OGs in Coriandrum sativum (coriander) using the BLAST method. A total of 941 C. sativum OGs (CsOGs), 1298 Apiaceae-specific genes (ASGs), and 38,508 evolutionarily conserved genes (ECGs) were identified through comparative genomics. Genic feature analyses revealed that CsOGs and ASGs, although part of different gene sets, had shorter gene lengths, a lower proportion of multi-exon genes, and higher GC content than ECGs. OGs were distributed across all 11 chromosomes, with the highest proportion of CsOGs and ASGs found on chromosome A11. RNA-Seq analysis revealed 71 CsOGs uniquely expressed in four different tissues, 61 CsOGs specifically expressed across three growth stages, and five CsOGs with specific expression patterns in different tissues and growth stages. Notably, as determined via qRT-PCR analysis, these five CsOGs presented general or specific expression patterns under normal conditions, but their expression significantly increased after exposure to cold stress, suggesting that they may play a critical role in cold stress response. This study comprehensively identified, characterized, and analyzed the expression of OGs within coriander, which provides a foundation for further research on the functions of coriander OGs in influencing species-specific trait formation and stress response.

1. Introduction

Orphan genes (OGs) are defined as genes that have no significant similarity to other sequences in other species [1,2]. Genetic mechanisms contributing to the emergence of OGs include gene fusion and fission, gene duplication, retroposition, lateral gene transfer, and exon shuffling [3]. However, gene exaptation and duplication were identified from transposable elements (TEs) as the primary mechanisms for OG emergence [4]. OGs may evolve from non-coding sequences or derive from older coding sequences. Their emergence and fixation in the genome, along with their participation in regulatory networks, indicate evolutionary maturity [5]. Over 50% of OGs in Arabidopsis thaliana resemble non-coding regions in A. lyrata, suggesting de novo formation [4]. De novo gene creation in a species’ gene pool may be more common than sporadic gene copying and is a primary mechanism of OG formation [6,7]. Although the origin and evolution of OGs are not fully understood, their emergence provides insights into species evolution, so genome and transcriptome data have been widely used to accelerate OG identification [8]. OGs have been identified in various species or lineages, including A. thaliana [9], Oryza sativa [10,11], Vigna unguiculata [12], Aegiceras corniculatum [13], Triticeae [14], and Brassica rapa [2]. Phylogenetically, OGs participate in species-specific evolution, stress response, and metabolic regulation [2,8,15,16], playing a vital role in species divergence [14]. Most OG functions are unknown, likely due to the absence of homologous sequences or identifiable functional domains.
Despite the challenges in studying the functions of OGs, some studies have provided insights into their roles. For example, B. rapa OG BOLTING RESISTANCE 1 (BR1) regulates flowering time in Arabidopsis, potentially involving vernalization and photoperiodic pathways [17]. The mutant form of B. rapa OG1 (BrOG1) presents increased sucrose synthase (SUS) activity and sucrose content, whereas invertase activity remains unchanged, indicating its role in soluble sugar metabolism [18]. The Arabidopsis OG Qua-Quine Starch (QQS) regulates carbon and nitrogen allocation in soybean. When QQS is transferred to soybean, lines expressing QQS show a 60% increase in leaf protein and an 80% decrease in leaf starch [9]. OG BOLTING RESISTANCE 2 (BR2) is associated with bolting resistance, and its overexpression significantly delays flowering in Arabidopsis transgenic plants while also affecting leaf and flower development [19]. The Poaceae-specific Male Sterility 1 (Ms1) gene encodes a phospholipid-binding protein involved in male sterility, variation, and pollen outer wall development. It is specifically expressed in microspore cells and plays a vital role in microgametogenesis [20]. Similarly, the OG Male Sterility 2 (Ms2) in grass species induces male sterility in Brachypodium, barley, and wheat, with its expression in anthers related to the insertion of a reverse transcription element in the promoter [21]. These findings provide a theoretical basis for the functional identification of OGs. However, the functions of these OGs remain unidentified in newly sequenced genomes, such as those of C. sativum.
Several species from the Apiaceae family are cultivated globally for vegetable or medicinal purposes, including Apium graveolens (celery), C. sativum, and Daucus carota (carrot) [22]. Coriandrum sativum, also known as Chinese parsley or coriander, is an important crop used as a spice, fragrance, vegetable, and traditional medicine [23]. Coriander, a well-known herb distributed across North Africa, Central Europe, and other regions, contains bioactive compounds such as polyphenols, phenolic acids, flavonoids, and essential oils. All parts of coriander can be used as seasonings or essential for oil extraction [24,25]. Coriander is widely used in the pharmaceutical and food industries, with recent studies demonstrating its antioxidant, antibacterial, antidiabetic, antimutagenic, and anticancer properties [26,27]. Low-temperature stress affects coriander plant growth, yield components, and metabolic activities [28]. Gene families such as heat shock transcription factors (Hsf) and TEOSINTE BRANCHED 1/CYCLOIDEA/PROLIFERATING CELL FACTOR 1/2 (TCP) have been identified and characterized in coriander, facilitating functional and comparative genomics studies [22,24]. Furthermore, interaction networks between pathway-related genes (tyrosine, porphyrins and chlorophyll, and vitamin E metabolic pathways) and transcription factors (TFs) have been constructed, supporting the activation of genes related to the nutritional and medicinal value of coriander [29]. As an important seasoning vegetable, coriander’s flavor, disease resistance, and environmental adaptability are important breeding goals. OGs may be involved in regulating these traits, so studying these OGs can provide new targets and tools for the molecular breeding of coriander. However, OGs have not yet been identified in coriander. Genome sequencing of C. sativum [23], D. carota [30], and A. graveolens [31,32] from the Apiaceae family provides a foundation for screening OGs within coriander.
In this study, Apiaceae-specific genes (ASGs), C. sativum OGs (CsOGs), and evolutionary-conserved genes (ECGs) were identified and characterized from the coriander genome via stringent homologous sequence criteria compared with previous comparative analyses of OGs [2]. To explore CsOG functions, published RNA sequencing data [23] and qRT-PCR analysis were used to investigate the expression patterns of CsOGs across different tissues, at different growth stages, and under cold stress treatments. This study serves as a valuable resource for further exploration of the biological functions of OGs in coriander.

2. Results

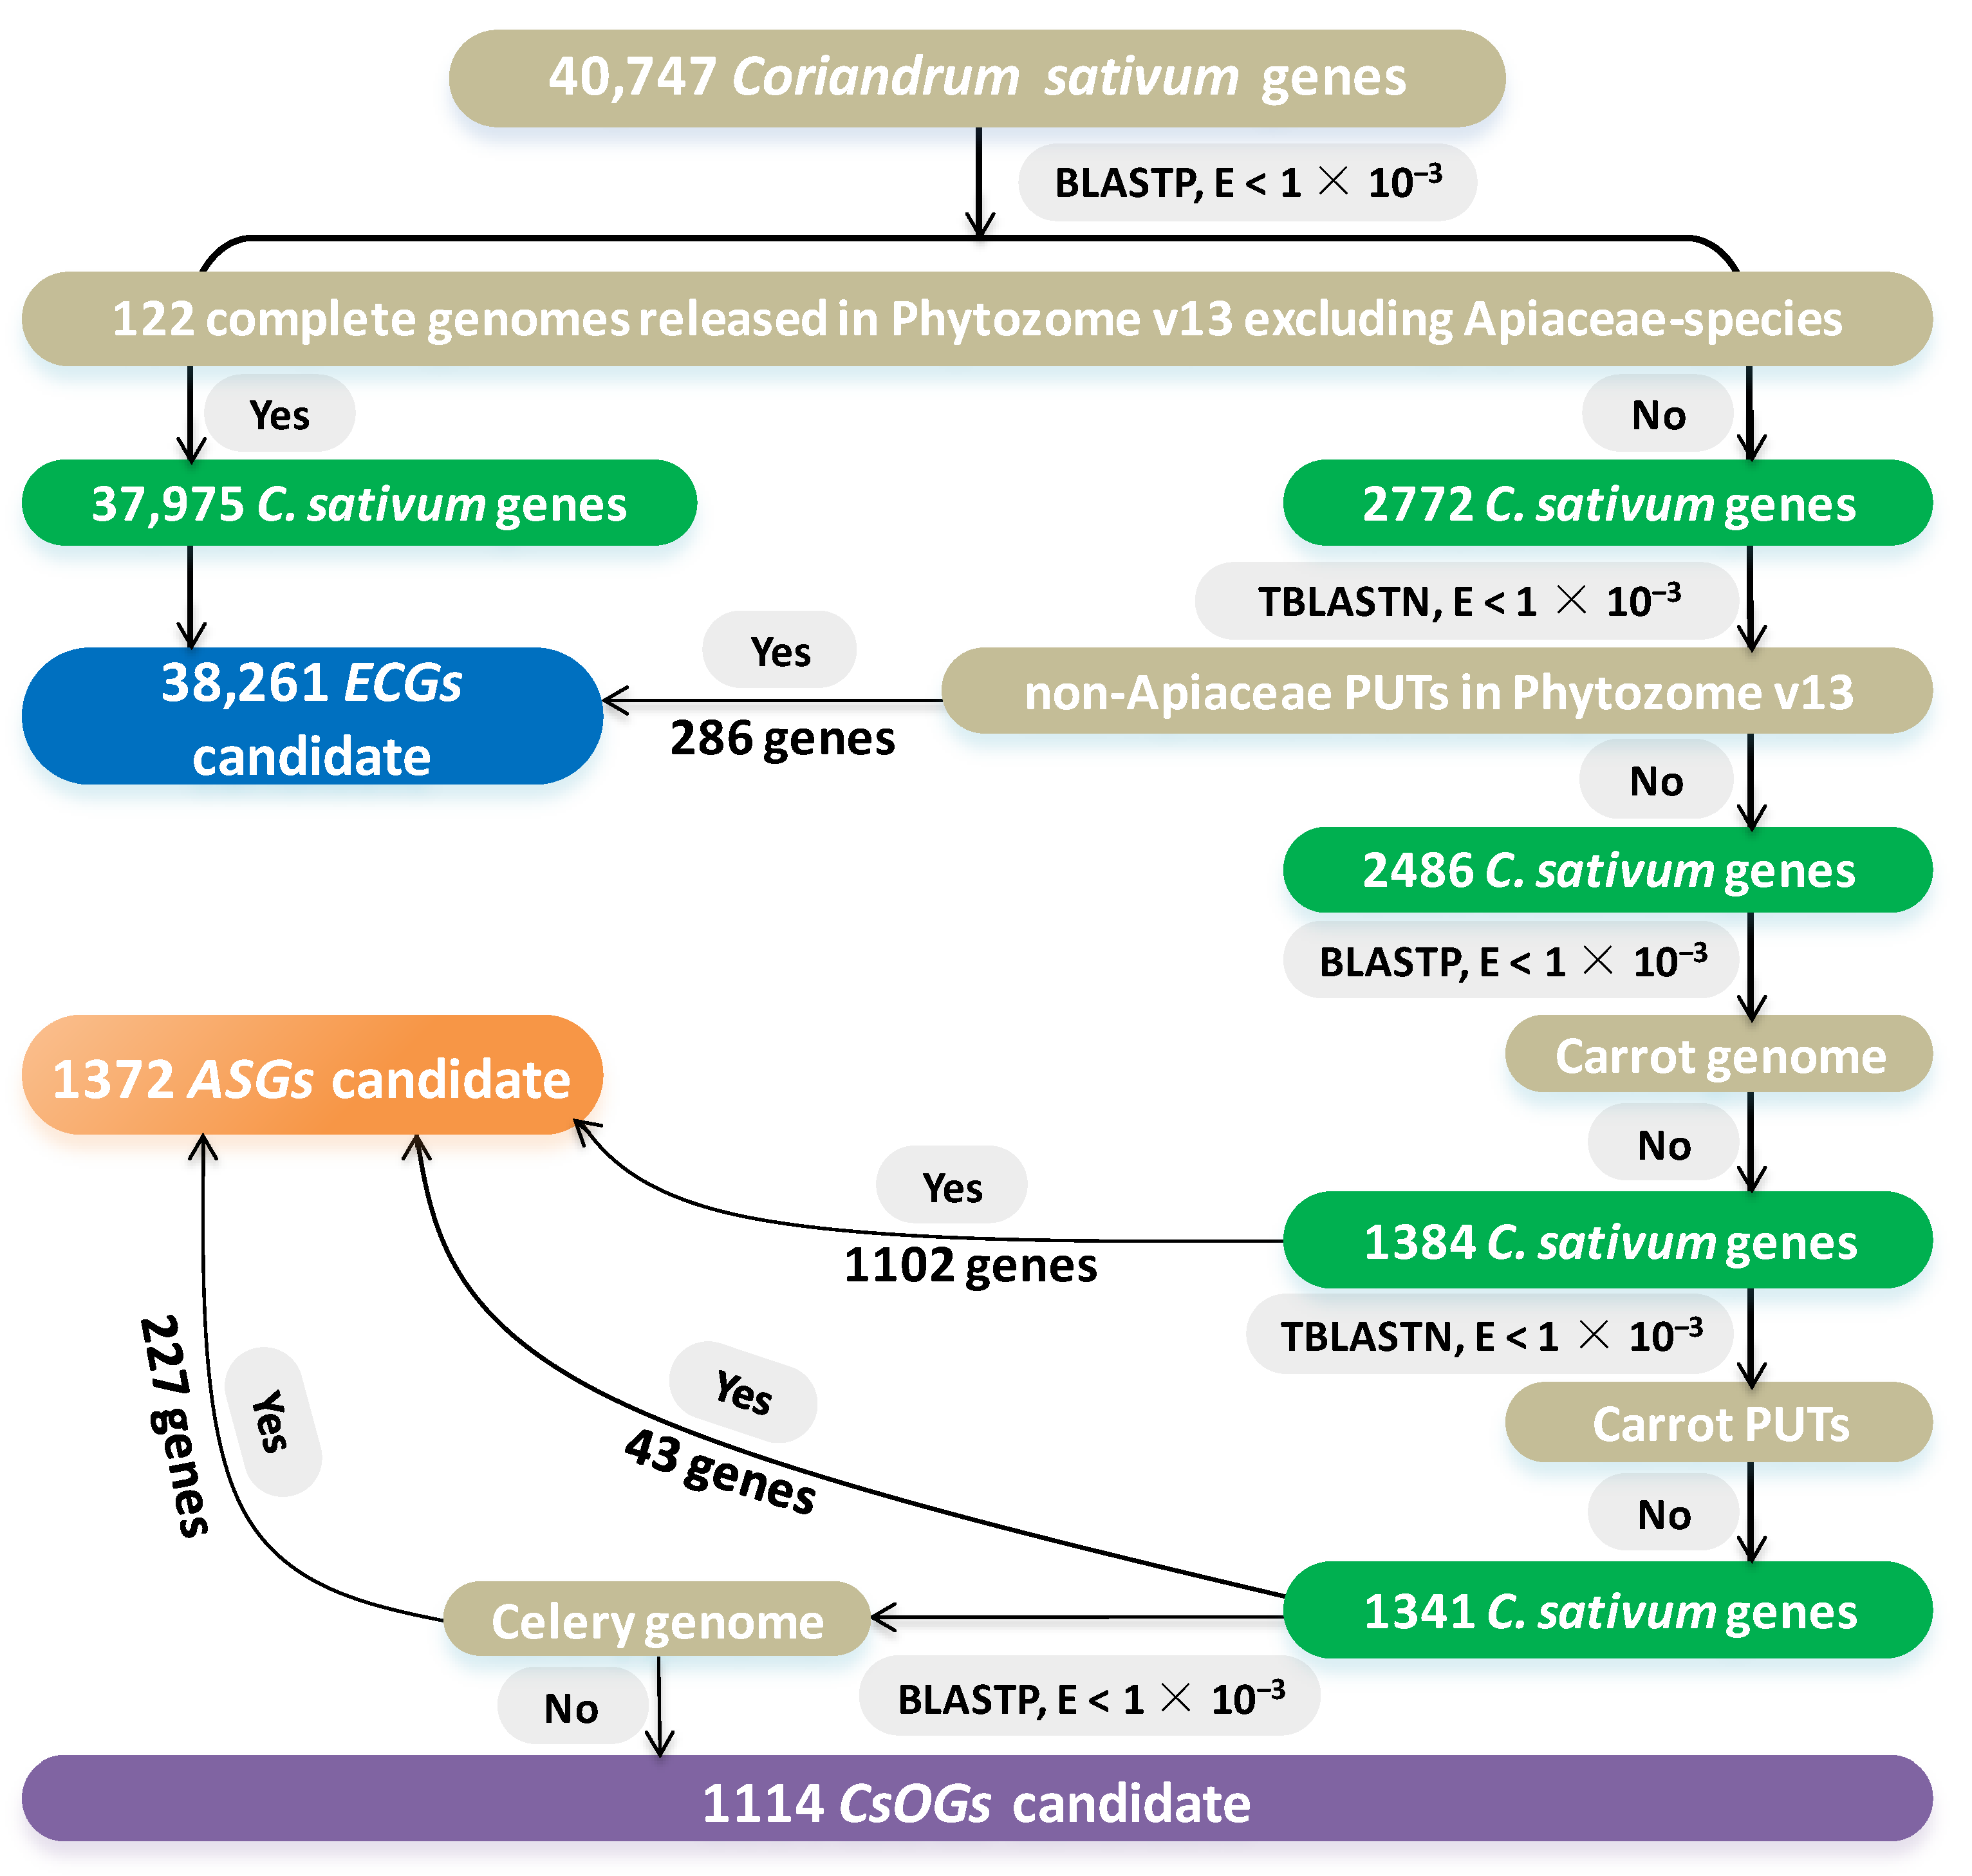
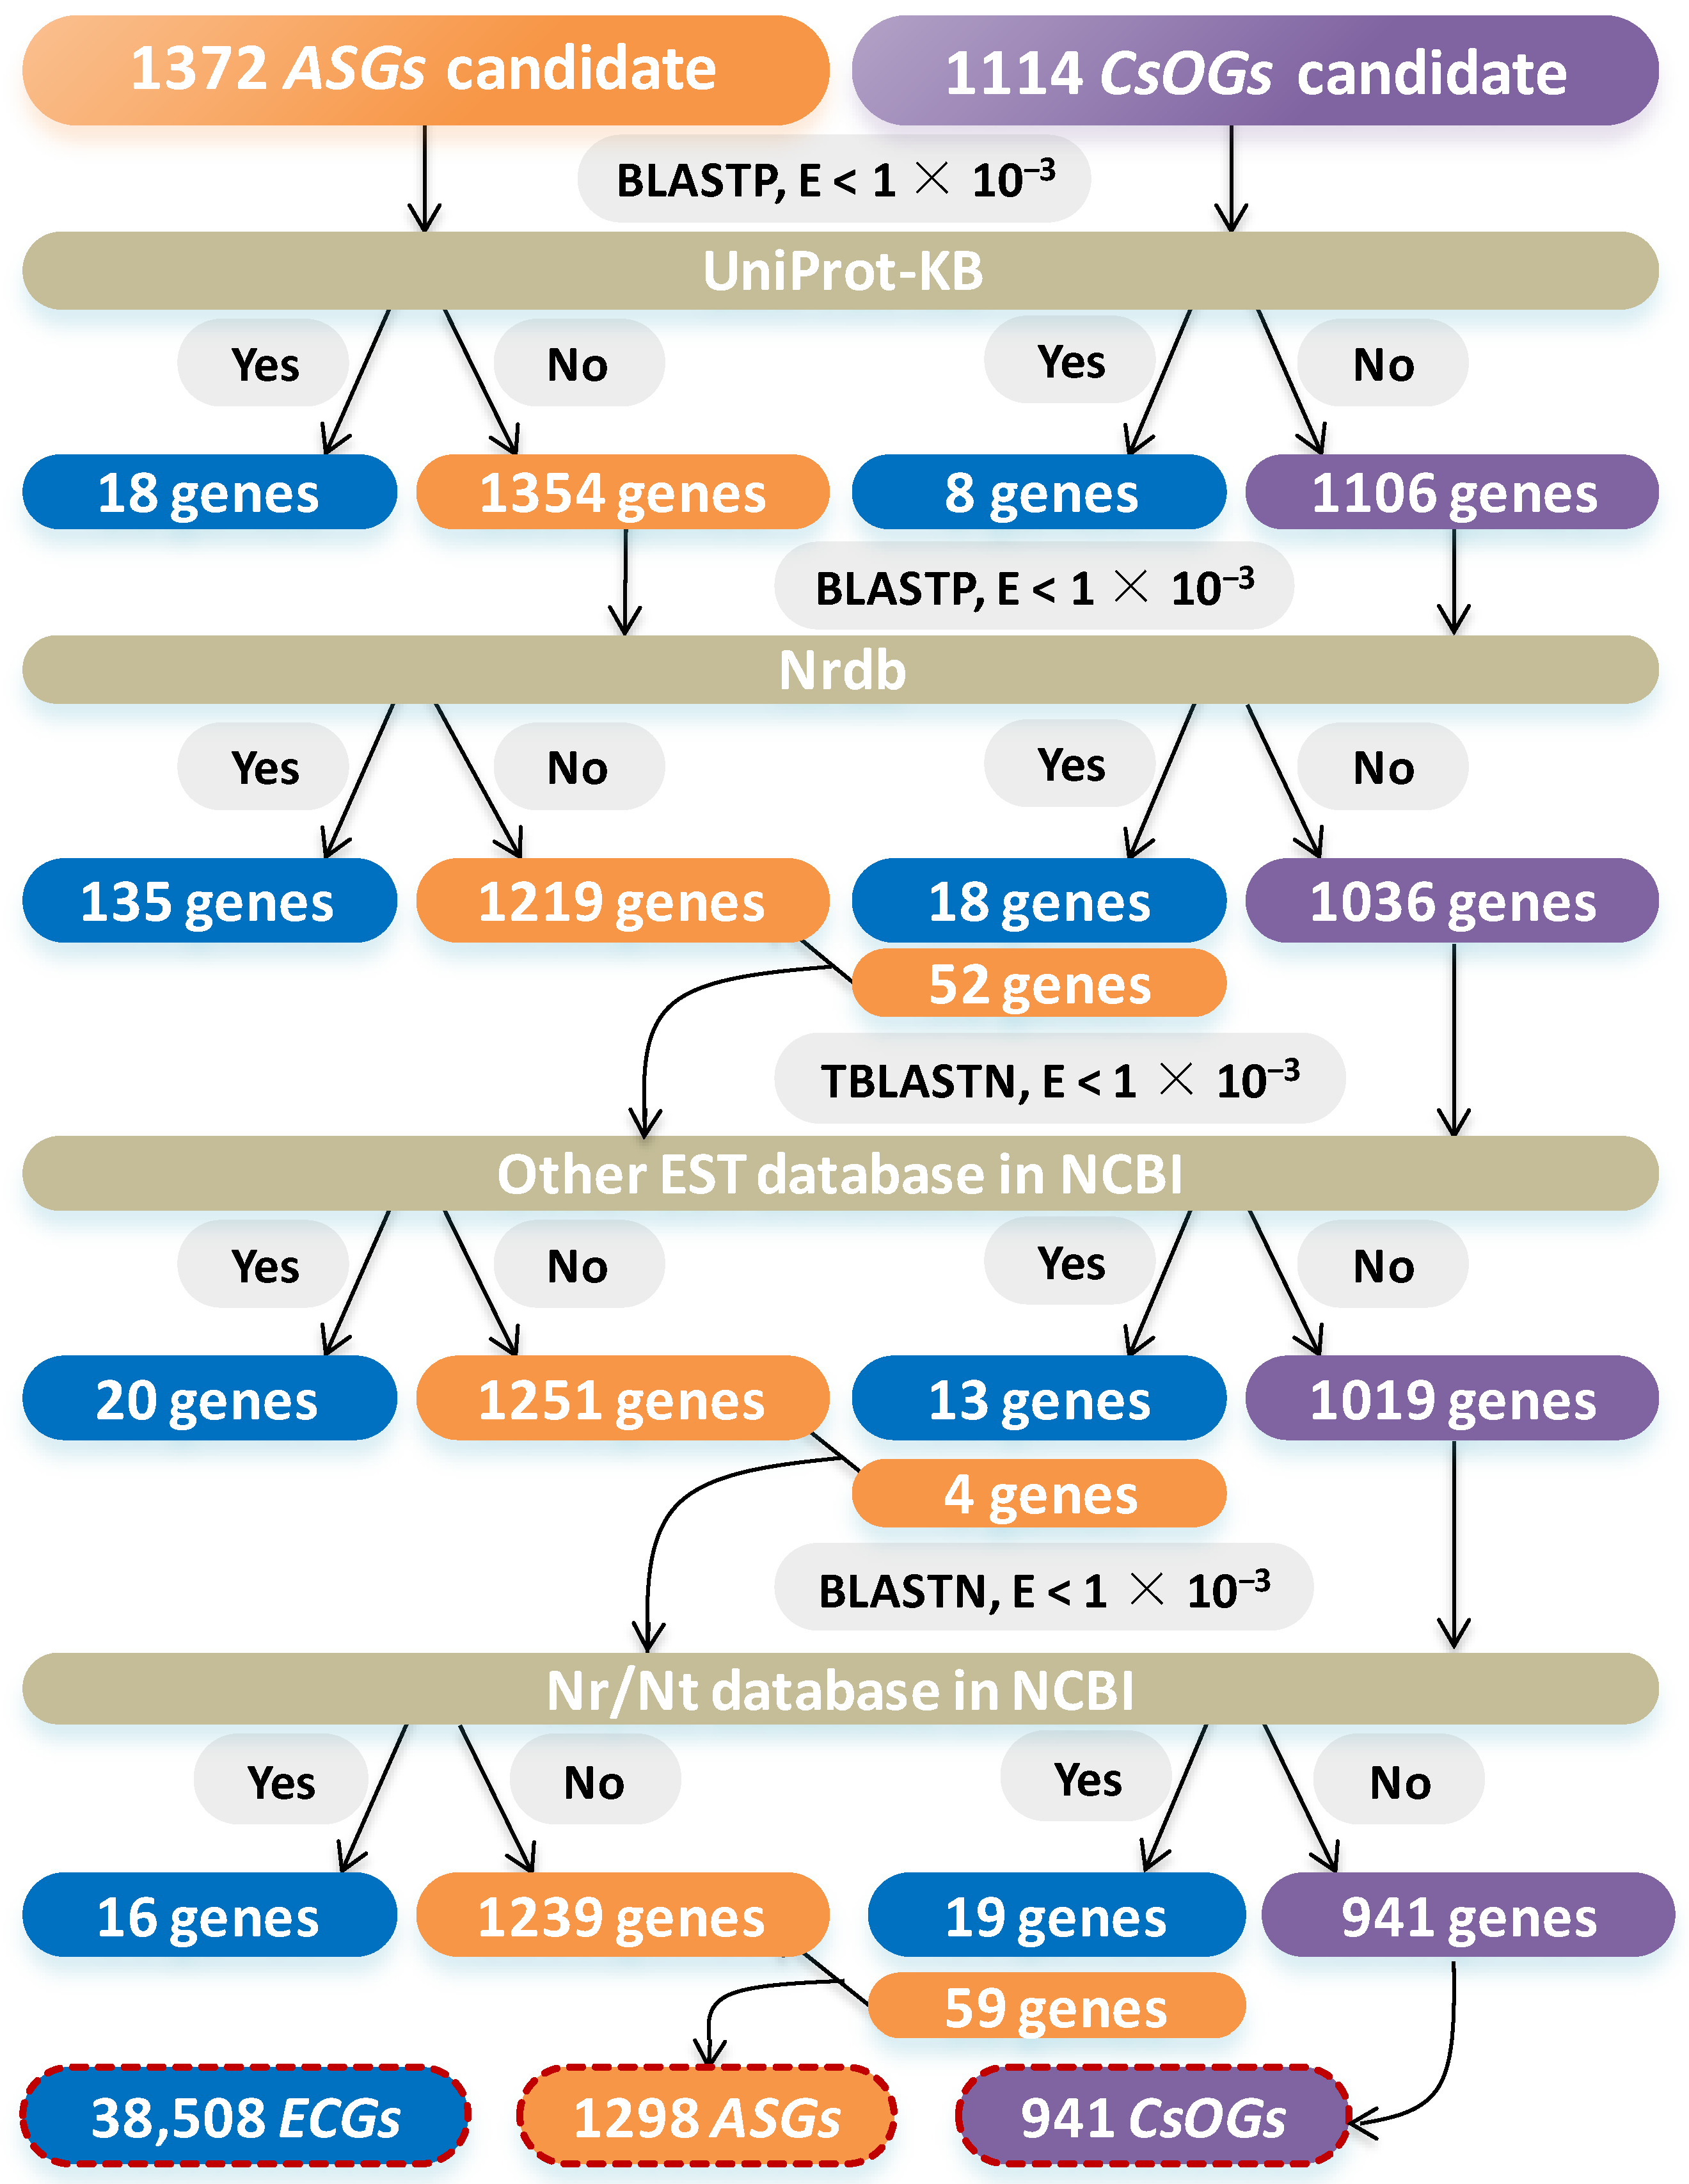
2.1. Identification of CsOGs and ASGs in C. sativum

A method of introducing stricter manual inspection incorporating transcriptome and plant genome sequences was employed to screen ECGs, ASGs, and CsOGs [2,33,34,35,36,37]. A total of 40,747 C. sativum genes were compared against 122 complete genomes available in Phytozome v13, excluding Apiaceae species, using BLASTP v2.2.31. Among these genes, 37,975 genes showed significant sequence similarity (E-value < 1 × 10⁻³) with at least one species outside the Apiaceae family and were classified as ECG candidates; thus, these genes were excluded from further analysis (Figure 1). The remaining 2772 C. sativum genes with no significant similarity to non-Apiaceae genomes were compared against non-Apiaceae PlantGDB-generated unique transcripts (PUTs) in Phytozome v13 using TBLASTN. Among them, 286 genes had significant similarity (E-value < 1 × 10⁻³) to at least one non-Apiaceae PUT, classifying them as additional ECG candidates and removing them from further analyses. The remaining 2486 C. sativum genes presented no significant similarity with non-Apiaceae PUTs. Further comparisons with Daucus carota (carrot) identified 1102 genes with significant similarity (E-value < 1 × 10⁻³), which were defined as ASG candidates and excluded from further analyses (Figure 1). The remaining 1384 C. sativum genes were compared with carrot PUTs using TBLASTN, resulting in 43 genes identified as ASG candidates. In the next step, 1341 genes were compared with the celery genome, revealing 227 genes with significant similarity (E-value < 1 × 10⁻³). The remaining 1114 C. sativum genes, which lacked significant similarity across all comparisons, were classified as CsOG candidates (Figure 1).
To improve accuracy and minimize false positives, the Non-redundant protein database (Nrdb) and UniProt-KB were used in BLASTP to compare candidate CsOGs and ASGs (Figure 2). After blast (E-value < 1 × 10⁻³), 26 genes (18 ASGs and 8 CsOGs) were classified as ECGs. BLASTP analysis of 1354 ASGs and 1106 CsOGs against Nrdb identified 153 genes (135 ASGs and 18 CsOGs) as ECGs, while 52 CsOGs with significant similarity (E-value < 1 × 10⁻³) were reclassified as ASGs. TBLASTN comparison of 1271 ASGs and 1036 CsOGs against other EST databases in NCBI identified 33 genes (20 ASGs and 13 CsOGs) as ECGs, with 4 CsOGs redefined as ASGs. Moreover, BLASTN comparison of 1255 ASGs and 1019 CsOGs against the Nr/Nt database in NCBI identified 35 genes (16 ASGs and 19 CsOGs) as ECGs, while 59 CsOGs showed significant similarity (E-value < 1 × 10⁻³) and were redefined as ASGs. In summary, a total of 38,508 ECGs, 1298 ASGs, and 941 CsOGs were identified.

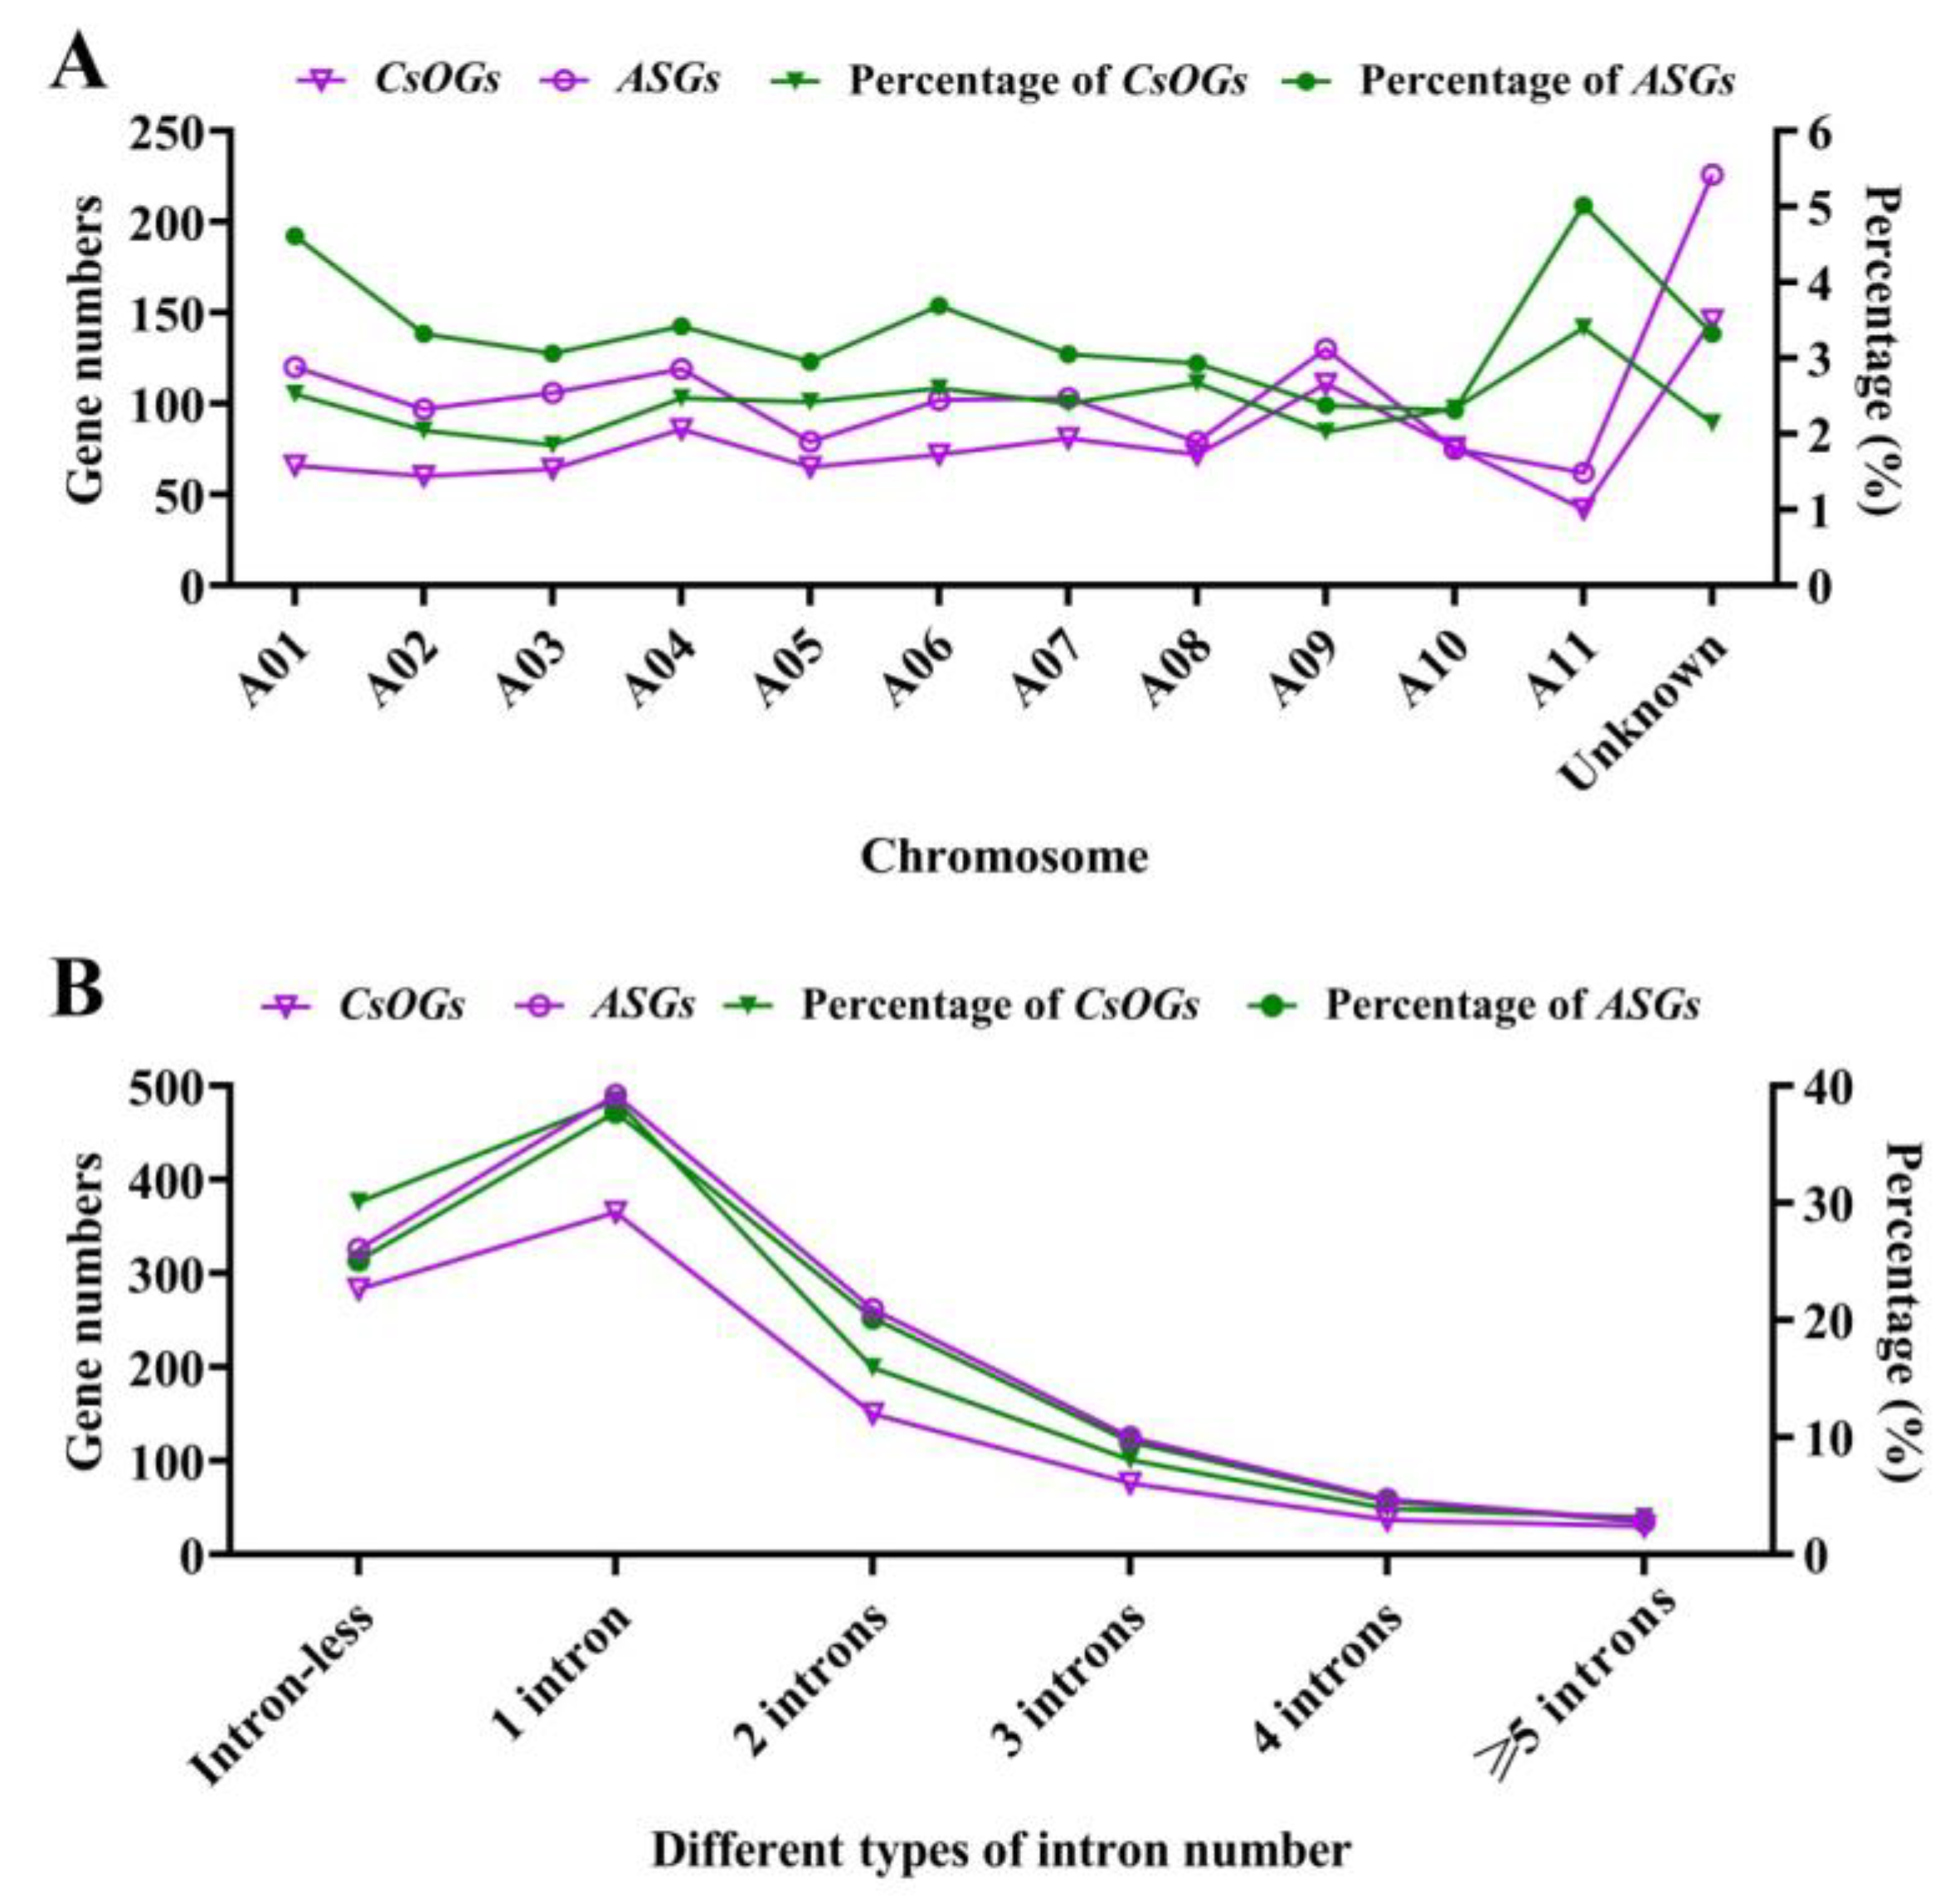
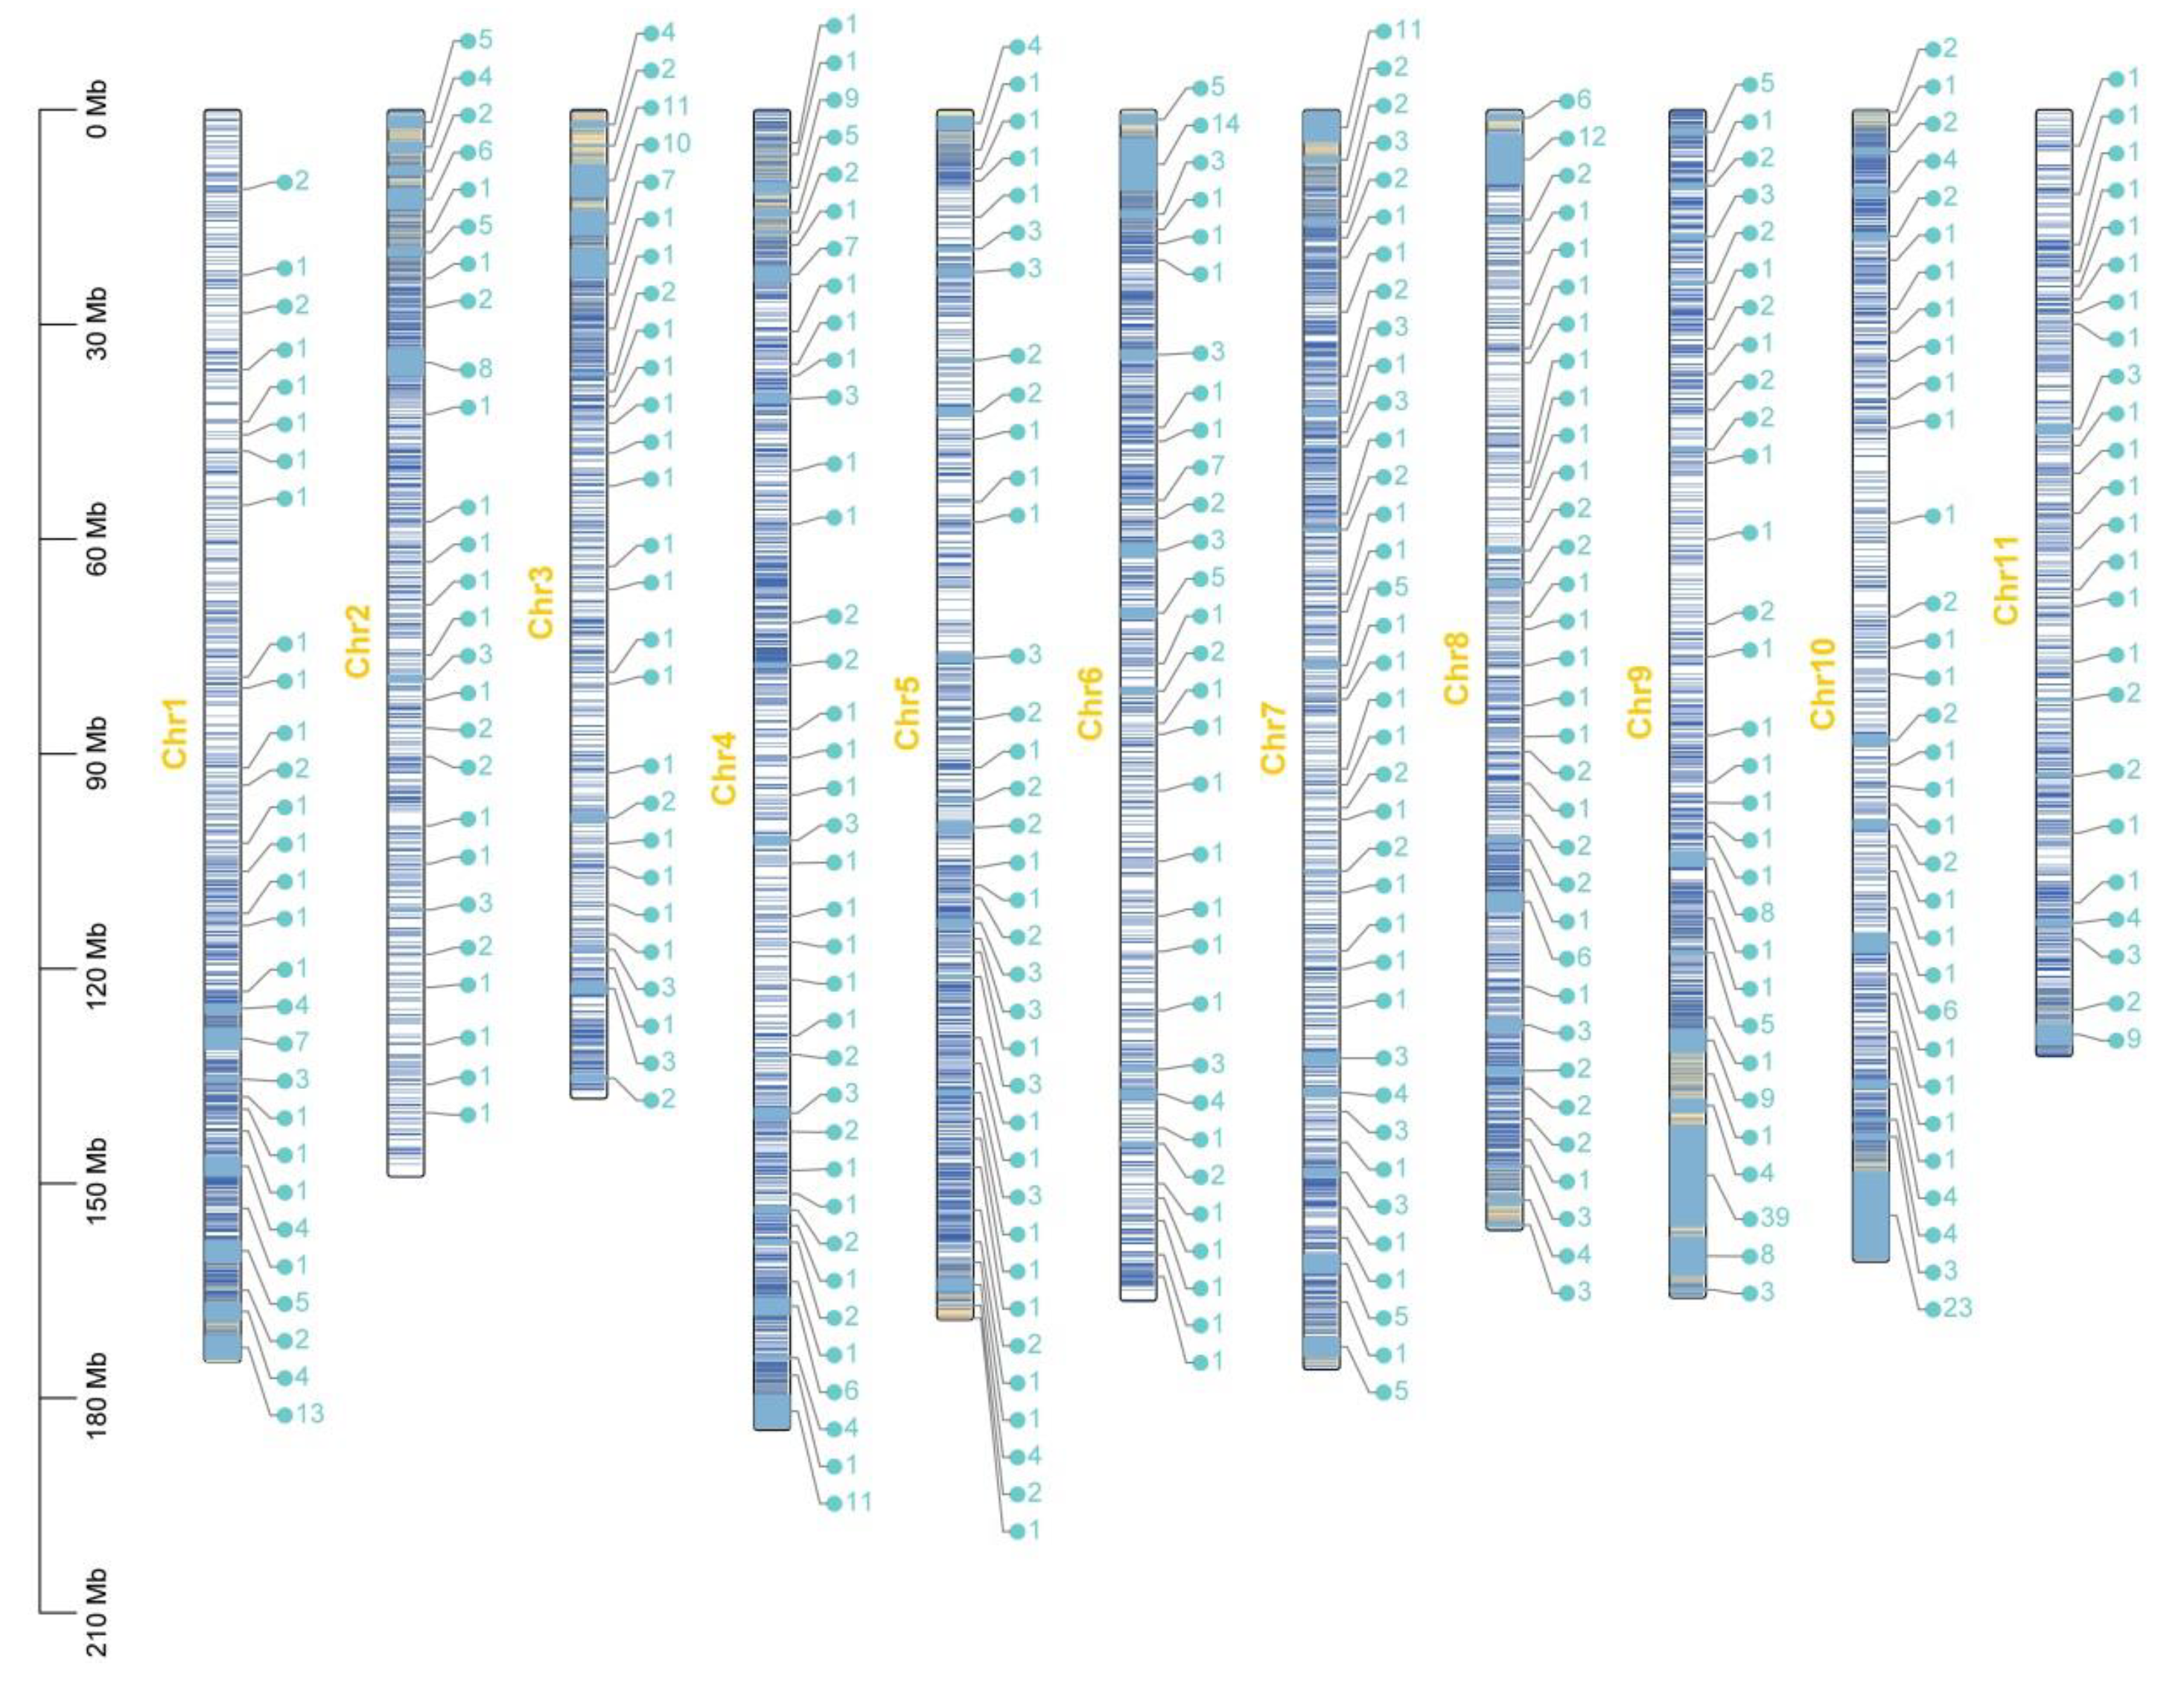
2.2. Genic Features of the CsOGs and ASGs in C. sativum

The genic characteristics of the CsOGs, ASGs, and ECGs were compared to determine potential differences (Table 1). The results indicated that the average protein coding sequence (CDS) and gene lengths of the CsOGs and ASGs were significantly shorter than those of the ECGs. Moreover, the average number of exons per gene in the CsOGs and ASGs was lower than that in the ECGs, while the intron lengths in the CsOGs and ASGs were longer than that in ECGs. The GC content of CDS, intron, and whole-gene regions did not significantly differ among the CsOGs, ASGs, and ECGs.
The gene numbers and percentage of ASGs and CsOGs were calculated, and physical maps of CsOGs across 11 chromosomes were constructed on the basis of the C. sativum genome (Figure 3A and Figure 4). CsOGs were evenly distributed among the chromosomes, with the highest concentrations of CsOGs (3.4%) and ASGs (5.02%) observed on chromosome A11. Spearman’s correlation analysis indicated a significant positive relationship between the number of CsOGs on each chromosome and chromosome length (p = 0.000000003, r = 0.926). A similar correlation was observed for ASGs after excluding scaffold-associated genes. Thus, the longer chromosomes contained more ASGs or CsOGs. The intron–exon structure of the CsOGs and ASGs was further examined by categorizing genes into six groups based on the number of introns: intron-less, one intron, two introns, three introns, four introns, and five or more introns per gene (Figure 3B). The results revealed that 30.07% of the CsOGs and 25.12% of the ASGs were intron-less, while 38.79% of the CsOGs and 37.75% of the ASGs had one intron. The proportions of genes with two introns were 15.94% for CsOGs and 20.18% for ASGs, with fewer than 16% of CsOGs and 17% of ASGs falling into the other intron categories. The percentage of different types of intron number of ASGs and CsOGs were higher than that in ECGs (Table S1). Analysis of coding potential revealed that the percentage of coding genes within CsOGs and ASGs was lower than that of non-coding genes (Figure S1). Specifically, coding genes accounted for 19.23% of the CsOGs and 46.15% of the ASGs, while non-coding genes accounted for 80.77% of the CsOGs and 53.85% of the ASGs. These findings suggest that CsOGs and ASGs belong to distinct gene sets compared to ECGs.

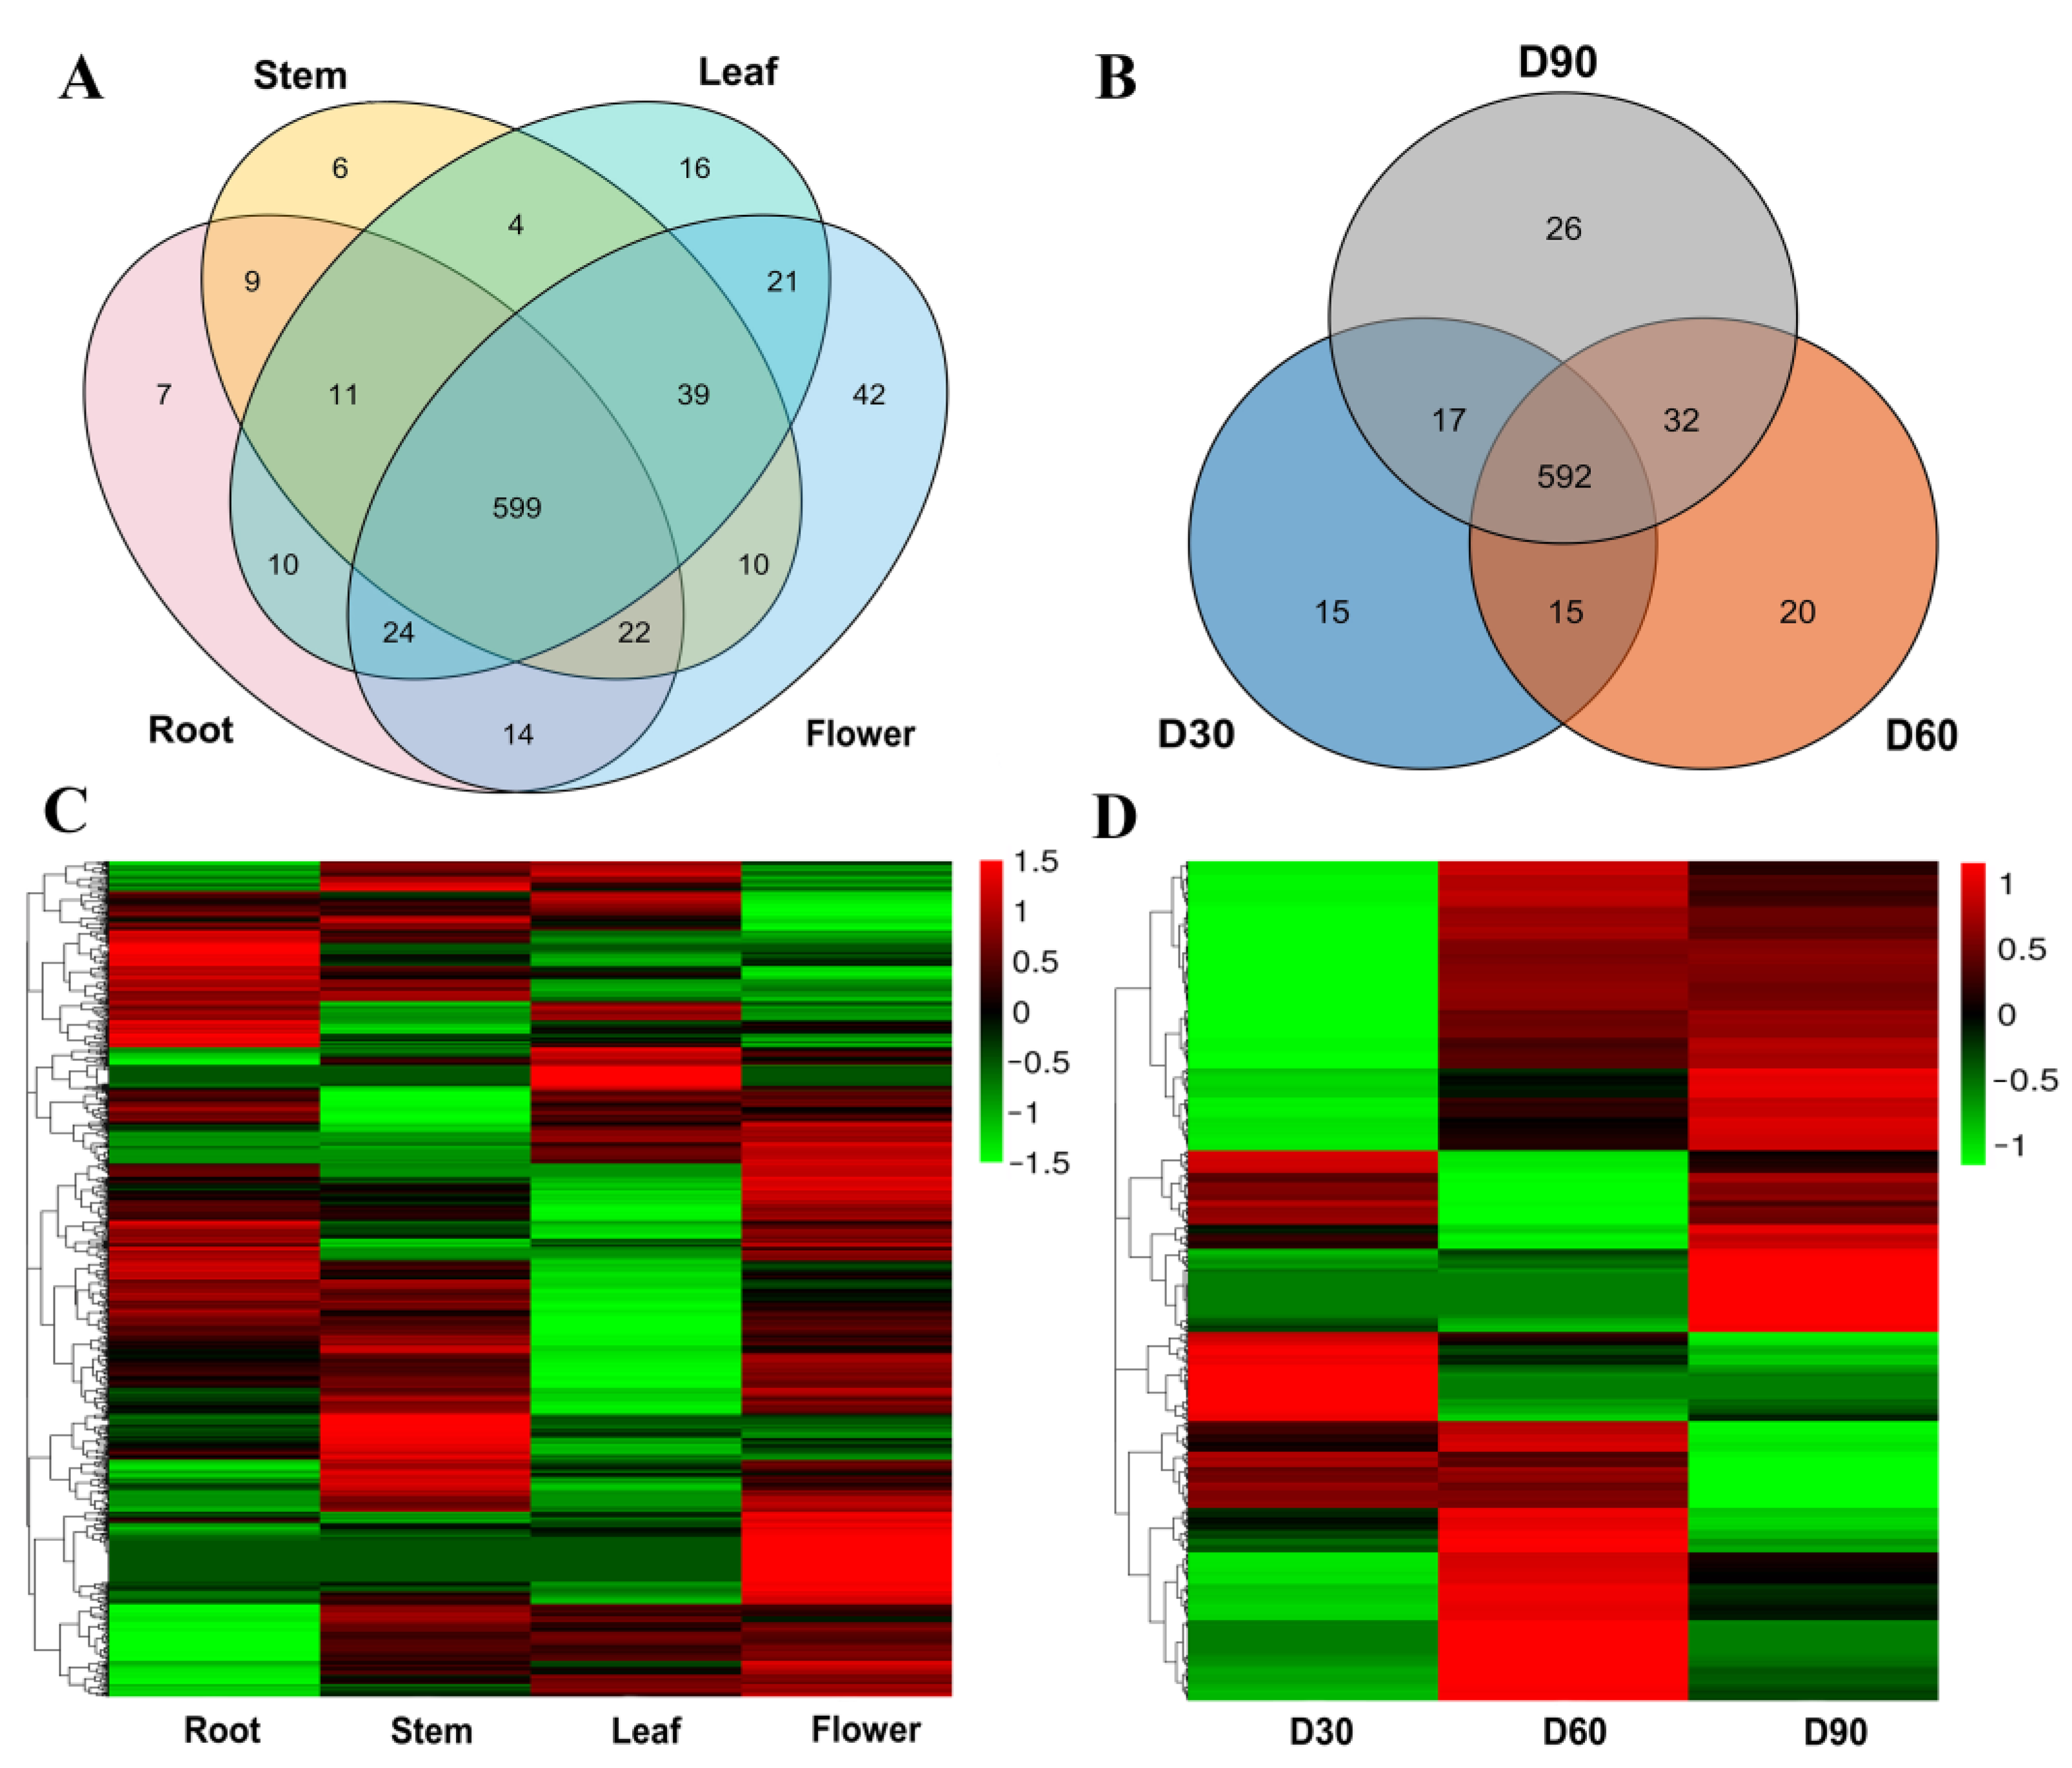
2.3. Expression Patterns During Different Growth Stages and in Different Tissues

Gene expression patterns often provide insights into gene functions [37]. The expression patterns of the CsOGs were analyzed to predict their potential functions. The protein sequences of 941 CsOGs were blasted with C. sativum ESTs and PUTs using TBLASTN (E-value cut-off: 1 × 10⁻³; query coverage and recognition rate: 70%). Considering the incomplete nature of PUTs and ESTs, transcriptome sequencing data from different growth stages and tissues were obtained from a previous study [23]. These datasets were subsequently used to analyze the expression patterns of the CsOGs (Figure 5). The RNA-Seq data confirmed that 834 CsOGs were expressed (Fragments Per Kilobase of exon model per Million mapped fragments (FPKM) > 0 in at least one tissue), with 44 CsOGs having functional annotations. Specifically, one gene was annotated in the KEGG database, five in the IPRSCAN database, and eleven in the NCBI Nrdb (Figure S2). Moreover, seventy-one CsOGs presented unique expression patterns: seven in roots, six in stems, sixteen in leaves, and forty-two in flowers (Figure 5A,C). In terms of growth stages, 61 CsOGs were uniquely expressed: 15 in the CS30 stage, 20 in the CS60 stage, and 26 in the CS90 stage (Figure 5B,D). Five genes (Cs01G02001, Cs05G02239, Cs07G00515, Cs08G00942, and Cs11G00260) were specifically expressed across different tissues (Table S2) or growth stages (Table S3), suggesting that CsOGs may play distinct roles in different growth stages and tissues.
The expression patterns of five CsOGs across three growth stages (CS30, CS60, and CS90) and four tissues (flower, leaf, stem, and root) were further analyzed via qRT-PCR. The results revealed that these CsOGs presented low expression levels across different growth stages (Figure 6A–E). In the tissue-specific analysis, Cs11G00260, Cs08G00942, and Cs01G02001 were highly expressed in roots, had low expression in the leaves and flowers, and were not expressed in the stems (Figure 6F–J). Similarly, Cs05G02239 and Cs07G00515 were highly expressed in the roots, showed low expression in the leaves, and were not expressed in the stems or flowers. In conclusion, the expression analysis of these five CsOGs showed general or specific patterns in different tissues and developmental stages.

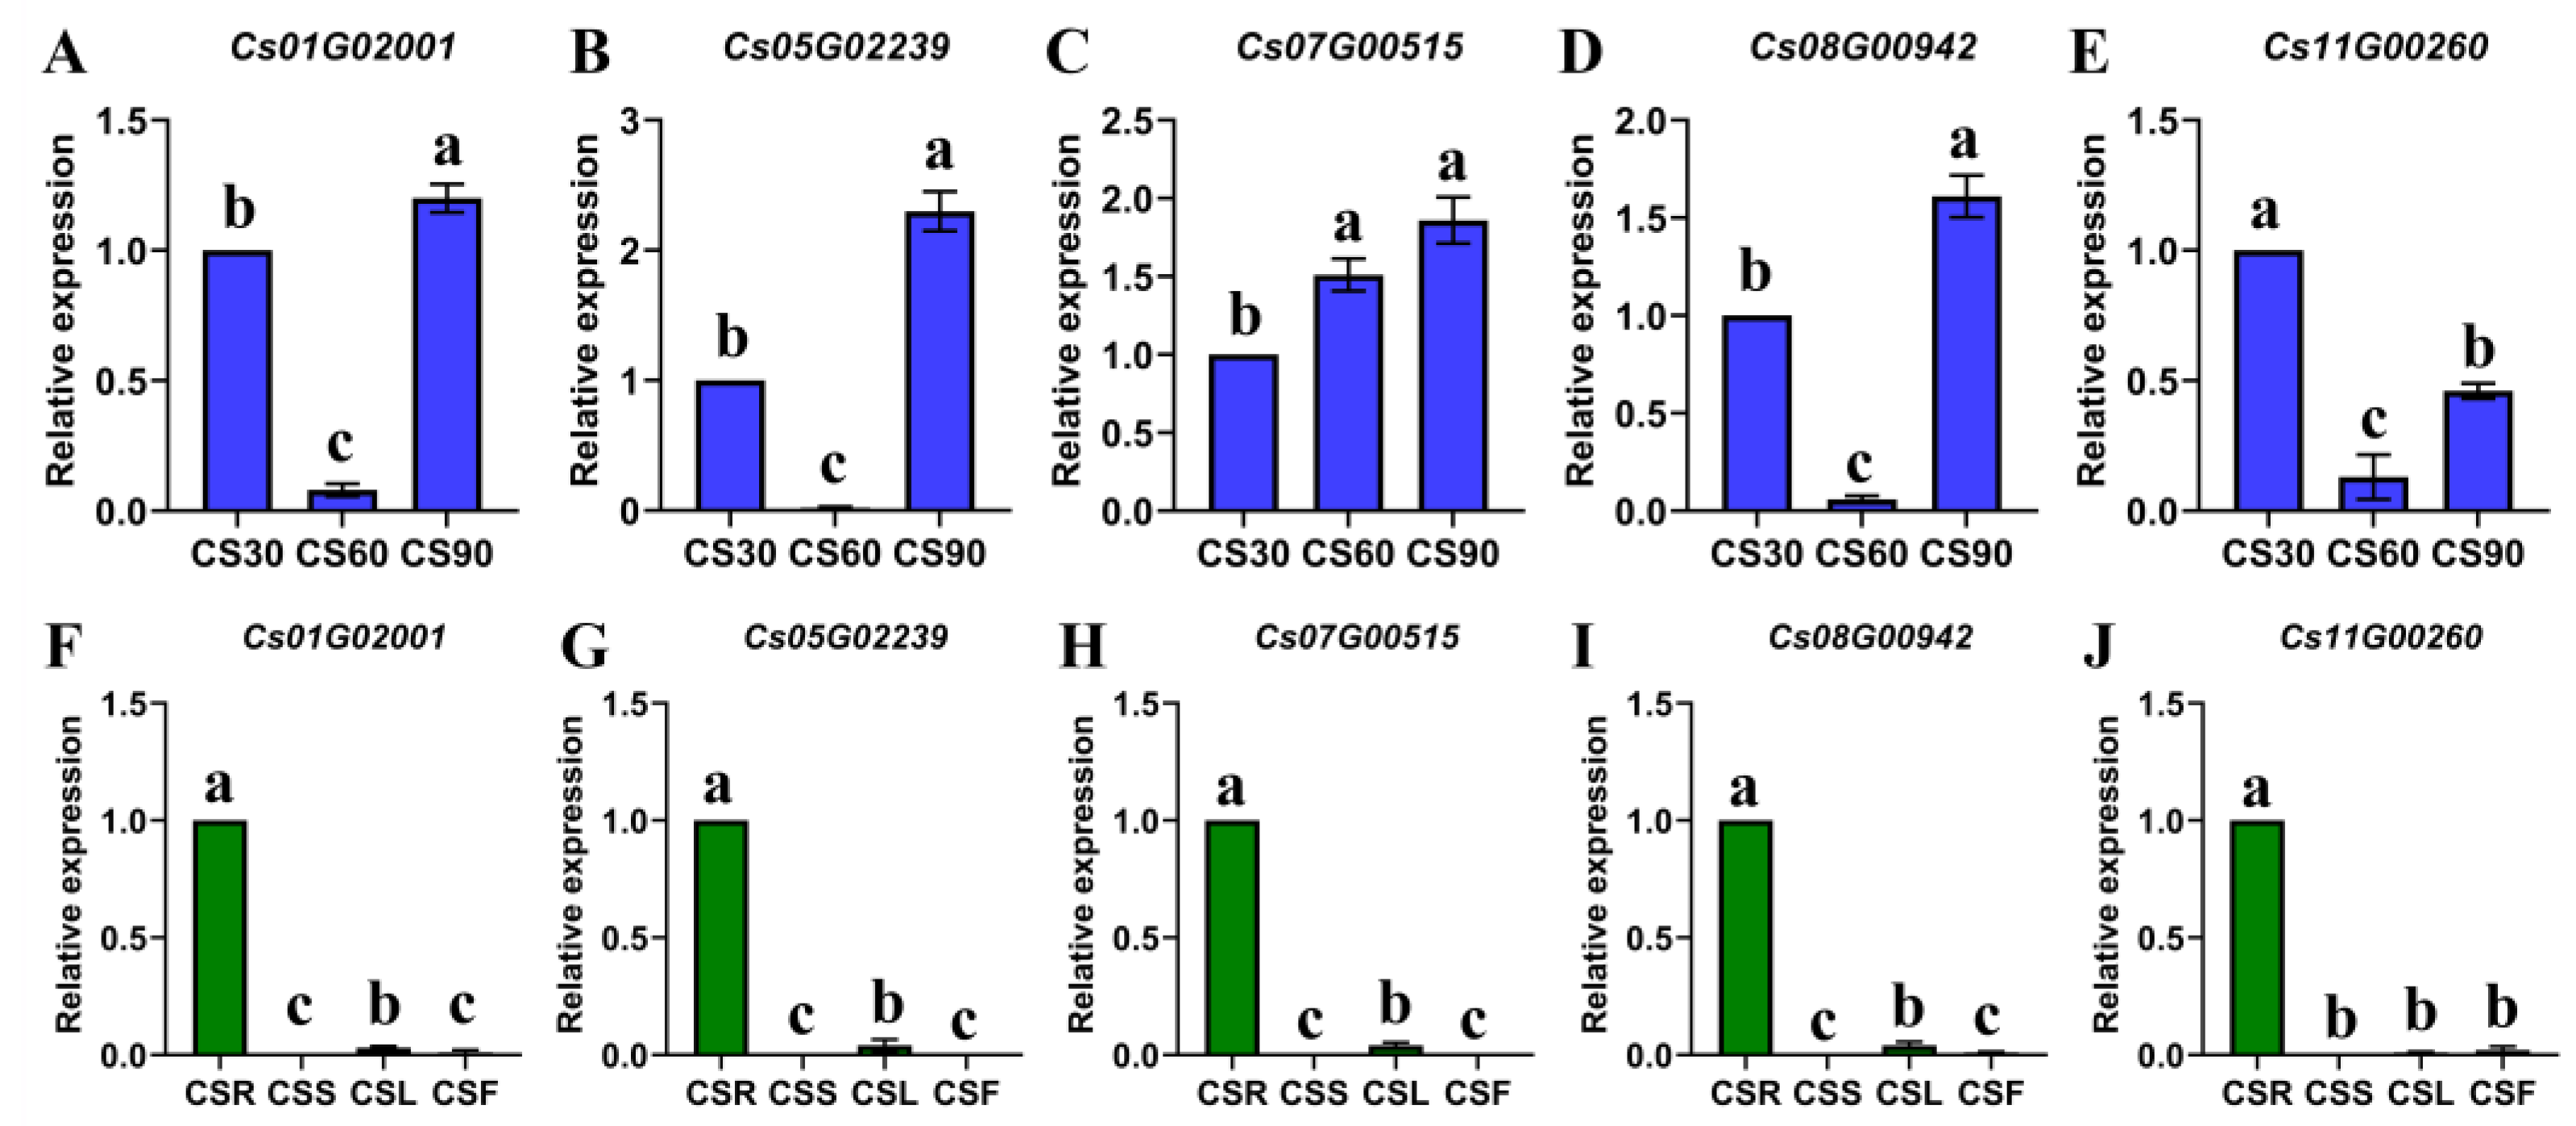
2.4. Expression Patterns of CsOGs in C. sativum After Cold Stress

OGs are frequently associated with responses to biotic and abiotic stresses and often participate in stress–response signal transduction pathways [2,5]. Previous studies have shown that cold stress adversely affects coriander growth [28]. Therefore, it was hypothesized that CsOGs may play an important role in the response of leaves to cold stress. To test this hypothesis, 55-day-old C. sativum plants were exposed to 4 °C, and leaf samples were collected hourly (D1 to D4). The expression patterns of five CsOGs in leaves following cold stress were analyzed using qRT-PCR (Figure 7). Results indicated that the expression levels of Cs01G02001, Cs05G02239, Cs08G00942, and Cs11G00260 were significantly upregulated compared to the control group. Notably, Cs11G00260 had a 700-fold increase under cold stress compared with that under normal conditions. In contrast, Cs07G00515 showed a significant decrease in expression in response to cold stress. These findings suggest that the five CsOGs may play roles in the cold stress response of C. sativum, potentially contributing to cold stress resistance mechanisms.

3. Discussion

A total of 38,508 ECGs, 1298 ASGs, and 941 CsOGs were identified in the C. sativum genome via stringent BLAST search criteria (Figure 1 and Figure 2). The analysis incorporated genomes from Phytozome v13, PUTs from plantGDB, and comparisons with databases such as UniProt-KB and Nrdb, Nr/Nt, and ESTs in NCBI. In previous studies, 165 Arabidopsis-specific genes and 1324 lineage-specific genes under TAIR7 and TAIR8 releases were identified, respectively [34,38]. These findings highlight how advancements in genome databases and the release of new plant genomes improve the accuracy of OG identification. The current study used an updated C. sativum genome containing 40,747 genes, improving the screening of CsOGs and ASGs. Although the potential for false positives exists, this approach represents an important step in refining OG identification within C. sativum. Previous research, with a BLAST E-value cut-off < 1 × 10⁻¹, identified 165 Arabidopsis-specific genes [38]. In comparison, the more stringent criteria used in this study led to a greater number of CsOGs. Earlier studies may have missed potential positive OGs because of the use of less stringent criteria. By using multiple databases and stricter parameters, this study was able to identify a greater number of OGs than earlier research.
The results indicated that OGs generally have fewer exons and a lower proportion of multi-exon genes, making CsOGs and ASGs shorter than ECGs (Table 1, Figure 3B, and Table S1), which is consistent with previous reports [2]. The GC content of the CsOGs and ASGs did not significantly differ from that of the ECGs, which contrasts with observations in Populus trichocarpa [36] and A. thaliana [34]. Moreover, the proportion of intron-less genes was significantly higher in the CsOGs (30.07%) and ASGs (25.12%) than in the ECGs (19.91%) (Figure 3B and Table S1). The increased proportion of intron-less genes in CsOGs and ASGs may result from recent lineage-specific amplification, potentially driven by retro-transposition, which contributes to new gene creation [2,37]. Furthermore, intron-less genes may play a crucial role in biodiversity during species evolution [2,39]. Studies suggest that gene emergence and gene loss reflect a dynamic balance in gene evolution, where the addition of introns helps retain some OGs while others are lost over time [40]. However, further studies are needed to verify these evolutionary mechanisms. Chromosome distribution analysis revealed that 2.14% of CsOGs and 3.32% of the ASGs remained unannotated; thus, we hypothesized that these sequences may represent genuine genes rather than C. sativum genome annotation artifacts. These findings align with observations in sweet orange [37] and B. rapa [2]. Moreover, the highest concentrations of CsOGs and ASGs were observed on chromosome A11, and this may be related to the fact that longer chromosomes contain more genes, which is similar to a previous finding [2]. In conclusion, the CsOGs and ASGs in C. sativum appear to have undergone more rapid evolution compared with the ECGs.
Gene expression patterns are often associated with gene function, making them useful predictors of potential gene roles [2]. In this study, the expression patterns of 941 CsOGs were preliminarily assessed using RNA-Seq data. The analysis revealed that most CsOGs presented low expression levels in coriander, similar to observations in A. thaliana [4]. The comparison of genes expressed across growth stages and tissues identified five genes (Cs01G02001, Cs05G02239, Cs07G00515, Cs08G00942, and Cs11G00260) with specific expression patterns across both conditions. Further validation using qRT-PCR revealed that these five genes presented low expression levels across different growth stages (Figure 6A–E). Tissue-specific analysis indicated that five genes possess much lower expression levels in leaves, flowers, and stems than in roots (Figure 6F–J). Notably, the qRT-PCR results differed from the RNA-Seq findings (Tables S2 and S3), which initially suggested the specific expression of these genes across growth stages and tissues. This discrepancy may be attributed to differences in coriander varieties, sample collection times, or the limited and conditional expression of CsOGs. Additionally, the low expression levels of CsOGs may have hindered detection using conventional transcriptional analysis methods [34].
Studies have shown that OGs, which may be involved in stress–response signal transduction pathways, are often associated with biotic and abiotic stresses [5,8,41,42]. Given previous findings that cold stress impacts growth, yield, and metabolism in coriander [28], C. sativum plants were treated at 4 °C, and leaf samples were collected hourly (D1-D4) to explore the potential role of five genes under cold stress using qRT-PCR. The expression of these genes significantly changed in response to cold stress, particularly that of Cs11G00260, whose expression increased 700-fold compared with that under normal temperature conditions (Figure 7). These results suggest that Cs01G02001, Cs05G02239, Cs07G00515, Cs08G00942, and Cs11G00260 may play a role in the cold stress response in coriander. A previous study showed that the OG PpARDT increases the abscisic acid (ABA) response in Physcomitrium patens, contributing to drought resistance [43]. In cowpea, the drought-induced gene UP12_8740 showed significant differences in root expression under drought stress and increased drought resistance in transgenic plants [12]. In Arabidopsis, 1007 genes with unknown functions were analyzed for their response to various abiotic stresses, such as hypoxia, cold, salt, heat, osmotic, and oxidation stress, with 832 mutants showing sensitivity to treatments, indicating potential roles in signal transduction or adaptation mechanisms [14,44]. Cold stress also inhibited OG BR2 expression and accelerated bolting and flowering in Chinese cabbage [19]. High stress-specificity has been highlighted as a characteristic associated with OGs [4,45,46]. Therefore, these research results on the response of OGs to stress strongly support the findings of this study.
Although the use of multiple databases and stricter parameters allowed for the identification of more OGs than earlier research did, some CsOGs may be eliminated as the number of genome-sequenced species in Apiaceae and the genus Coriandrum increases. The expression levels of many CsOGs may not be comprehensive by traditional transcription analysis methods, resulting in many CsOGs not being screened, and some important CsOGs may be missed. CsOGs respond to cold stress, but whether they are affected by other stresses is still unclear, and the molecular mechanism of their participation in cold stress needs to be thoroughly studied. Therefore, the next step of this study is to expand the screening conditions on the basis of RNA-Seq data, obtain more important CsOGs, and continue to study the molecular mechanism of these five genes involved in cold stress further.

4. Materials and Methods

4.1. Genome Datasets

The proteomic sequence of C. sativum was retrieved from the Coriander Genome Database (CGDB, http://cgdb.bio2db.com/) on 10 February 2022. A total of 124 complete genomes, including 122 non-Apiaceae genomes and two Apiaceae genomes (excluding Coriandrum species), were downloaded from Phytozome v13 (https://phytozome-next.jgi.doe.gov/) and CGDB for the identification of ECGs, ASGs, and CsOGs on 11 March 2022. The Plant Genome Database (PlantGDB) (http://www.plantgdb.org/prj/ESTCluster/progress.php) was used to retrieve PlantGDB-generated unique transcripts (PUTs) that were downloaded on 13 April 2022. The UniProt knowledgebase (UniProt-KB) was accessed from the Universal protein resource (UniProt) (http://ftp.ebi.ac.uk/pub/databases/uniprot/knowledgebase/) on 18 April 2022. Other databases, including expressed sequence tags (ESTs), nucleotide collection (Nr/Nt), and the Non-redundant protein database (Nrdb), were analyzed via the National Center for Biotechnology Information (NCBI) (https://www.ncbi.nlm.nih.gov/) on 15 June 2022.

4.2. Homology Search

The homology search was based on previous methods [2], screening three gene sets in coriander with an E-value cut-off of 1 × 10⁻³. BLASTP, TBLASTN, and BLASTN were used as the sequence alignment tools, and manual inspection of the resulting alignments was performed throughout the homology search. The genes were categorized into CsOGs, ASGs, and ECGs. CsOGs included genes with no homologs in non-Coriandrum species, ASGs contained genes with at least one homolog in Apiaceae species (excluding Coriandrum), and ECGs had at least one homolog outside the Apiaceae family.

4.3. Genic Features and Physical Mapping

Complete genome data for C. sativum were obtained from the CGDB. The length of protein, CDS, gene, and intron, the GC content of CDS, intron, and gene, and the number of exons per gene of CsOGs, ASGs, and ECGs were analyzed. The significant differences in different genic features among three gene sets were identified using one-way ANOVA. Chromosome localization data were extracted from chromosome sequences. Spearman’s correlation analysis was performed to assess the relationships between the percentages of CsOGs and ASGs on each chromosome and chromosome length. The physical map was constructed via R.

4.4. Gene Functional Annotation and Expression Evidence

The protein sequences of the CsOGs were compared with the ESTs and PUTs via TBLASTN, following the methods described in a previous study to confirm the expression data of the CsOGs [2]. RNA-Seq data from four C. sativum tissues (flowers, leaves, stems, and roots) and three growth stages (CS30, CS60, and CS90) were downloaded from the Genome Sequence Archive (GSA, https://ngdc.cncb.ac.cn/gsa/) under accession numbers CRA001658 and CRA001656 on 25 June 2022, respectively [23]. The analysis of the RNA-Seq data was performed according to previous methods [2,17,19]. The drawing of heat maps referred to previous studies [2,17].

4.5. Sampling and Expression Analysis

The C. sativum inbred line ‘NAXC3’ was provided by the vegetable research group of the School of Agriculture, Jilin Agricultural Science and Technology University, China. For different growth stages, leaves were collected at 30, 60, and 90 days (CS30, CS60, and CS90, respectively), with three biological replicates of three plants each. For tissue-specific analysis, roots, stems, leaves, and flowers were sampled at 85 days (CSR, CSS, CSL, and CSF, respectively), with three biological replicates of three plants each. The cold stress treatment involved exposure to 4 °C. Leaves weighing 1 g were obtained from 55-day-old coriander plants that were grown in nutrient bowls at 4 °C; CK, D1, D2, D3, and D4 represent exposure to 4 °C for 0 h, 1 h, 2 h, 3 h, and 4 h, respectively (three biological replicates, three plants per replicate). Coriander about 50-day-old showed higher physiological activity, which can more clearly reflect the effect of stress treatment [29,47,48]. All the samples were immediately frozen in liquid nitrogen and stored at −80 °C. Plant total RNA extraction, first-strand cDNA synthesis, and qRT-PCR were conducted according to previously described methods [17], and expression levels were calculated using the 2−ΔΔCt method [49]. The primers used in this study are listed in Table S4.

4.6. Statistical Analysis

The qRT-PCR data were analyzed using one-way ANOVA in IBM SPSS Software v26 (Chicago, IL, USA). Results are presented as means ± SE. Spearman’s correlation analysis was performed to calculate the relationship between the number of CsOGs on each chromosome and chromosome length via the formula in Microsoft Excel v2010 (Redmond, WA, USA).

5. Conclusions

In this study, a total of 1298 ASGs and 941 CsOGs were identified in coriander genome. Compared with the ECGs, the CsOGs and ASGs presented a greater GC content, shorter gene lengths, and fewer multi-exon genes. ASGs and CsOGs were evenly distributed across 11 chromosomes, with the highest concentrations observed on chromosome A11. RNA-Seq analysis revealed five CsOGs with specific expression patterns across various tissues and growth stages. qRT-PCR analysis revealed that these five CsOGs generally presented specific patterns under normal conditions, but their expression significantly increased under cold stress. In particular, the expression of Cs11G00260 increased 700-fold under cold stress conditions, suggesting that Cs11G00260 may play a certain role in the cold stress response. These findings provide valuable insights into the function of CsOGs in coriander, laying the groundwork for further functional analyses.

Supplementary Materials

The following supporting information can be downloaded at https://www.mdpi.com/article/10.3390/plants14050778/s1, Figure S1: Coding capability analysis of CsOGs and ASGs. The Y-axis marks the percentage of coding and non-coding. The purple bar chart shows the percentage of coding; the green bar chart shows the percentage of non-coding. Figure S2: Analysis of specific gene annotation. KEGG indicates Kyoto Encyclopedia of Genes and Genomes. IPRSCAN indicates a non-redundant database, integrating domains, functional sites, and protein families. Swissprot indicates a high-quality, manually annotated, non-redundant protein sequence database. Nr indicates a non-redundant database. Table S1: Gene numbers and percentage of different types of intron number of ECGs. Table S2: FPKM values of CsOGs in different tissues of coriander. Table S3: FPKM values of CsOGs in different growth stages of coriander. Table S4: Primers used for qRT-PCR analysis.

Author Contributions

Conceptualization, X.L. and M.J.; methodology, M.Z. (Meidi Zhang), M.Z. (Mo Zhu) and H.L.; software, W.W.; validation, H.L. and M.J.; formal analysis, M.Z. (Meidi Zhang), M.Z. (Mo Zhu), H.L. and W.W.; investigation, H.L. and M.J.; resources, M.J.; data curation, X.L. and M.J.; writing—original draft preparation, M.Z. (Meidi Zhang), M.Z. (Mo Zhu) and H.L.; writing—review and editing, X.L. and M.J.; visualization, M.Z. (Mo Zhu) and H.L.; supervision, X.L. and M.J.; project administration, X.L. and M.J.; funding acquisition, M.J. All authors have read and agreed to the published version of the manuscript.

Funding

This research was funded by the National Natural Science Foundation of China, grant number 32302568.

Data Availability Statement

All data supporting the findings of this study are available within the paper and within its Supplementary Materials published online.

Acknowledgments

We would like to thank Xiaoming Song at the School of Life Sciences/Library, North China University of Science and Technology, for providing the complete genome gene sequence of coriander.

Conflicts of Interest

The authors declare that they have no known competing financial interests or personal relationships that could have appeared to influence the work reported in this paper.

Abbreviations

The following abbreviations are used in this manuscript:
ABAAbscisic acid
ASGsApiaceae-specific genes
CGDBCoriander Genome Database
CsOGsC. sativum OGs
ECGsEvolutionarily conserved genes
ESTsExpressed sequence tags
FPKMFragments Per Kilobase of exon model per Million mapped fragments
GSAGenome Sequence Archive
KEGG Kyoto Encyclopedia of Genes and Genomes
NCBINational Center for Biotechnology Information
NrdbNon-redundant protein database
Nr/NtNucleotide collection
OGsOrphan genes
PUTsPlantGDB-generated unique transcripts
SUSSucrose synthase
TEsTransposable elements
TFsTranscription factors
UniProtUniversal protein resource
UniProt-KBUniProt knowledgebase

References

  1. Li, L.; Zheng, W.; Zhu, Y.; Ye, H.; Tang, B.; Arendsee, Z.W.; Jones, D.; Li, R.; Ortiz, D.; Zhao, X.; et al. QQS orphan gene regulates carbon and nitrogen partitioning across species via NF-YC interactions. Proc. Natl. Acad. Sci. USA 2015, 112, 14734–14739. [Google Scholar] [CrossRef]
  2. Jiang, M.; Dong, X.; Lang, H.; Pang, W.; Zhan, Z.; Li, X.; Piao, Z. Mining of Brassica-Specific Genes (BSGs) and Their Induction in Different Developmental Stages and under Plasmodiophora brassicae Stress in Brassica rapa. Int. J. Mol. Sci. 2018, 19, 2064. [Google Scholar] [CrossRef]
  3. Kaessmann, H. Origins, evolution, and phenotypic impact of new genes. Genome Res. 2010, 20, 1313–1326. [Google Scholar] [CrossRef]
  4. Donoghue, M.T.; Keshavaiah, C.; Swamidatta, S.H.; Spillane, C. Evolutionary origins of Brassicaceae specific genes in Arabidopsis thaliana. BMC Evol. Biol. 2011, 11, 47–59. [Google Scholar] [CrossRef]
  5. Arendsee, Z.W.; Li, L.; Wurtele, E.S. Coming of age: Orphan genes in plants. Trends Plant Sci. 2014, 19, 698–708. [Google Scholar] [CrossRef]
  6. Carvunis, A.-R.; Rolland, T.; Wapinski, I.; Calderwood, M.A.; Yildirim, M.A.; Simonis, N.; Charloteaux, B.; Hidalgo, C.A.; Barbette, J.; Santhanam, B.; et al. Proto-genes and de novo gene birth. Nature 2012, 487, 370–374. [Google Scholar] [CrossRef] [PubMed]
  7. Singh, U.; Wurtele, E.S. How new genes are born. eLife 2020, 9, e55136. [Google Scholar] [CrossRef] [PubMed]
  8. Jiang, M.; Li, X.; Dong, X.; Zu, Y.; Zhan, Z.; Piao, Z.; Lang, H. Research Advances and Prospects of Orphan Genes in Plants. Front. Plant Sci. 2022, 13, 947129. [Google Scholar] [CrossRef] [PubMed]
  9. Li, L.; Wurtele, S.E. The QQS orphan gene of Arabidopsis modulates carbon and nitrogen allocation in soybean. Plant Biotechnol. J. 2015, 13, 177–187. [Google Scholar] [CrossRef]
  10. Cui, X.; Lv, Y.; Chen, M.; Nikoloski, Z.; Twell, D.; Zhang, D. Young Genes out of the Male: An Insight from Evolutionary Age Analysis of the Pollen Transcriptome. Mol. Plant 2015, 8, 935–945. [Google Scholar] [CrossRef] [PubMed]
  11. Jin, G.; Zhou, Y.; Yang, H.; Hu, Y.; Shi, Y.; Li, L.; Siddique, A.N.; Liu, C.; Zhu, A.; Zhang, C.; et al. Genetic innovations: Transposable element recruitment and de novo formation lead to the birth of orphan genes in the rice genome. J. Syst. Evol. 2019, 59, 341–351. [Google Scholar] [CrossRef]
  12. Li, G.; Wu, X.; Hu, Y.; Muñoz-Amatriaín, M.; Luo, J.; Zhou, W.; Wang, B.; Wang, Y.; Wu, X.; Huang, L.; et al. Orphan genes are involved in drought adaptations and ecoclimatic-oriented selections in domesticated cowpea. J. Exp. Bot. 2019, 70, 3101–3110. [Google Scholar] [CrossRef] [PubMed]
  13. Ma, D.; Ding, Q.; Guo, Z.; Zhao, Z.; Wei, L.; Li, Y.; Song, S.; Zheng, H. Identification, characterization and expression analysis of lineage-specific genes within mangrove species Aegiceras corniculatum. Mol. Genet. Genom. 2021, 296, 1235–1247. [Google Scholar] [CrossRef]
  14. Ma, S.; Yuan, Y.; Tao, Y.; Jia, H.; Ma, Z. Identification, characterization and expression analysis of lineage-specific genes within Triticeae. Genom. 2020, 112, 1343–1350. [Google Scholar] [CrossRef]
  15. Mukherjee, S.; Panda, A.; Ghosh, T.C. Elucidating evolutionary features and functional implications of orphan genes in Leishmania major. Infect. Genet. Evol. 2015, 32, 330–337. [Google Scholar] [CrossRef] [PubMed]
  16. Zhang, Y.; Jiang, M.; Sun, S.; Zhan, Z.; Li, X.; Piao, Z. Chinese cabbage orphan gene BR3 confers bolting resistance to Arabidopsis through the gibberellin pathway. Front. Plant Sci. 2025, 15, 1518962. [Google Scholar] [CrossRef]
  17. Jiang, M.; Zhang, Y.; Yang, X.; Li, X.; Lang, H. Brassica rapa orphan gene BR1 delays flowering time in Arabidopsis. Front. Plant Sci. 2023, 14, 1135684. [Google Scholar] [CrossRef] [PubMed]
  18. Jiang, M.; Zhan, Z.; Li, H.; Dong, X.; Cheng, F.; Piao, Z. Brassica rapa orphan genes largely affect soluble sugar metabolism. Hortic. Res. 2020, 7, 181. [Google Scholar] [CrossRef]
  19. Zu, Y.; Jiang, M.; Zhan, Z.; Li, X.; Piao, Z. Orphan gene BR2 positively regulates bolting resistance through the vernalization pathway in Chinese cabbage. Hortic. Res. 2024, 11, uhae216. [Google Scholar] [CrossRef]
  20. Wang, Z.; Li, J.; Chen, S.; Heng, Y.; Chen, Z.; Yang, J.; Zhou, K.; Pei, J.; He, H.; Deng, X.W. Poaceae-specific MS1 encodes a phospholipid-binding protein for male fertility in bread wheat. Proc. Natl. Acad. Sci. USA 2017, 114, 12614–12619. [Google Scholar] [CrossRef]
  21. Ni, F.; Qi, J.; Hao, Q.; Lyu, B.; Luo, M.C.; Wang, Y.; Chen, F.; Wang, S.; Zhang, C.; Epstein, L. Wheat Ms2 encodes for an orphan protein that confers male sterility in grass species. Nat. Commun. 2017, 8, 15121. [Google Scholar] [CrossRef]
  22. Pei, Q.; Li, N.; Bai, Y.; Wu, T.; Yang, Q.; Yu, T.; Wang, Z.; Liu, Z.; Li, Q.; Lin, H. Comparative analysis of the TCP gene family in celery, coriander and carrot (family Apiaceae). Veg. Res. 2021, 1, 5. [Google Scholar] [CrossRef]
  23. Song, X.; Wang, J.; Li, N.; Yu, J.; Meng, F.; Wei, C.; Liu, C.; Chen, W.; Nie, F.; Zhang, Z.; et al. Deciphering the high-quality genome sequence of coriander that causes controversial feelings. Plant Biotechnol. J. 2020, 18, 1444–1456. [Google Scholar] [CrossRef]
  24. Pei, Q.; Yu, T.; Wu, T.; Yang, Q.; Gong, K.; Zhou, R.; Cui, C.; Yu, Y.; Zhao, W.; Kang, X.; et al. Comprehensive identification and analyses of the Hsf gene family in the whole-genome of three Apiaceae species. Hortic. Plant J. 2021, 7, 457–468. [Google Scholar] [CrossRef]
  25. Sowmya, R.S.; Warke, V.G.; Mahajan, G.B.; Annapure, U.S. Effect of amino acids on growth, elemental content, functional groups, and essential oils composition on hydroponically cultivated coriander under different conditions. Ind. Crops Prod. 2023, 197, 116577. [Google Scholar]
  26. Msaada, K.; Hosni, K.; Taarit, M.B.; Chahed, T.; Kchouk, M.E.; Marzouk, B. Changes on essential oil composition of coriander (Coriandrum sativum L.) fruits during three stages of maturity. Food Chem. 2007, 102, 1131–1134. [Google Scholar] [CrossRef]
  27. Grosso, C.; Ferraro, V.; Figueiredo, A.C.; Barroso, J.G.; Coelho, J.A.; Palavra, A.M. Supercritical carbon dioxide extraction of volatile oil from Italian coriander seeds. Food Chem. 2008, 111, 197–203. [Google Scholar] [CrossRef]
  28. Hassanein, R.A.; Hussein, O.S.; Abdelkader, A.F.; Farag, I.A.; Ibrahim, M. Metabolic activities and molecular investigations of the ameliorative impact of some growth biostimulators on chilling-stressed coriander (Coriandrum sativum L.) plant. BMC Plant Biol. 2021, 21, 361. [Google Scholar] [CrossRef]
  29. Wu, T.; Feng, S.-y.; Yang, Q.-h.; Bhetariya, P.J.; Gong, K.; Cui, C.-l.; Song, J.; Ping, X.-r.; Pei, Q.-y.; Yu, T.; et al. Integration of the metabolome and transcriptome reveals the metabolites and genes related to nutritional and medicinal value in Coriandrum sativum. J. Int. Agric. 2021, 20, 1807–1818. [Google Scholar] [CrossRef]
  30. Iorizzo, M.; Ellison, S.; Senalik, D.; Zeng, P.; Satapoomin, P.; Huang, J.; Bowman, M.; Iovene, M.; Sanseverino, W.; Cavagnaro, P. A high-quality carrot genome assembly provides new insights into carotenoid accumulation and asterid genome evolution. Nat. Genet. 2016, 48, 657–666. [Google Scholar] [CrossRef]
  31. Li, M.Y.; Feng, K.; Hou, X.L.; Jiang, Q.; Xiong, A.S. The genome sequence of celery (Apium graveolens L.), an important leaf vegetable crop rich in apigenin in the Apiaceae family. Hortic. Res. 2020, 7, 223–253. [Google Scholar] [CrossRef]
  32. Song, X.; Sun, P.; Yuan, J.; Gong, K.; Li, N.; Meng, F.; Zhang, Z.; Li, X.; Hu, J.; Wang, J.; et al. The celery genome sequence reveals sequential paleo-polyploidizations, karyotype evolution and resistance gene reduction in apiales. Plant Biotechnol. J. 2021, 19, 731–744. [Google Scholar] [CrossRef] [PubMed]
  33. Johnson, B.R.; Tsutsui, N.D. Taxonomically restricted genes are associated with the evolution of sociality in the honey bee. BMC Genom. 2011, 12, 164. [Google Scholar] [CrossRef]
  34. Lin, H.; Moghe, G.; Ouyang, S.; Iezzoni, A.; Shiu, S.H.; Gu, X.; Buell, C.R. Comparative analyses reveal distinct sets of lineage-specific genes within Arabidopsis thaliana. BMC Evol. Biol. 2010, 10, 41. [Google Scholar] [CrossRef]
  35. Yang, L.; Zou, M.; Fu, B.; He, S. Genome-wide identification, characterization, and expression analysis of lineage-specific genes within zebrafish. BMC Genom. 2013, 14, 65. [Google Scholar] [CrossRef]
  36. Lin, W.L.; Cai, B.; Cheng, Z.M. Identification and characterization of lineage-specific genes in Populus trichocarpa. Plant Cell Tiss. Organ Cult. 2014, 116, 217–225. [Google Scholar] [CrossRef]
  37. Xu, Y.; Wu, G.; Hao, B.; Chen, L.; Deng, X.; Xu, Q. Identification, characterization and expression analysis of lineage-specific genes within sweet orange (Citrus sinensis). BMC Genom. 2015, 16, 995. [Google Scholar] [CrossRef]
  38. Yang, X.; Jawdy, S.; Tschaplinski, T.J.; Tuskan, G.A. Genome-wide identification of lineage-specific genes in Arabidopsis, Oryza and Populus. Genom. 2009, 93, 473–480. [Google Scholar] [CrossRef]
  39. Zou, M.; Guo, B.; He, S. The Roles and Evolutionary Patterns of Intronless Genes in Deuterostomes. Comp. Funct. Genomics 2011, 2011, 680673. [Google Scholar] [CrossRef] [PubMed]
  40. Tautz, D.; Domazet-Lošo, T. The evolutionary origin of orphan genes. Nat. Rev. Genet. 2011, 12, 692–702. [Google Scholar] [CrossRef] [PubMed]
  41. Perochon, A.; Jianguang, J.; Kahla, A.; Arunachalam, C.; Scofield, S.R.; Bowden, S.; Wallington, E.; Doohan, F.M. TaFROG Encodes a Pooideae Orphan Protein That Interacts with SnRK1 and Enhances Resistance to the Mycotoxigenic Fungus Fusarium graminearum. Plant Physiol. 2015, 169, 2895–2906. [Google Scholar] [CrossRef]
  42. Jiang, M.; Zhan, Z.; Li, X.; Piao, Z. Construction and evaluation of Brassica rapa orphan genes overexpression library. Front. Plant Sci. 2025, 16, 1532449. [Google Scholar] [CrossRef] [PubMed]
  43. Dong, X.M.; Pu, X.J.; Zhou, S.Z.; Li, P.; Luo, T.; Chen, Z.X.; Chen, S.L.; Liu, L. Orphan gene PpARDT positively involved in drought tolerance potentially by enhancing ABA response in Physcomitrium (Physcomitrella) patens. Plant Sci. 2022, 319, 111222. [Google Scholar] [CrossRef] [PubMed]
  44. Luhua, S.; Hegie, A.; Suzuki, N.; Shulaev, E.; Luo, X.; Cenariu, D.; Ma, V.; Kao, S.; Lim, J.; Gunay, M.B. Linking genes of unknown function with abiotic stress responses by high-throughput phenotype screening. Physiol. Plant. 2013, 148, 322–333. [Google Scholar] [CrossRef]
  45. Bosch, T.C.G.; Augustin, R.; Anton-Erxleben, F.; Fraune, S.; Hemmrich, G.; Zill, H.; Rosenstiel, P.; Jacobs, G.; Schreiber, S.; Leippe, M.; et al. Uncovering the evolutionary history of innate immunity: The simple metazoan Hydra uses epithelial cells for host defence. Dev. Comp. Immunol. 2008, 33, 559–569. [Google Scholar] [CrossRef]
  46. Guo, W.J.; Li, P.; Ling, J.; Ye, S.P. Significant Comparative Characteristics between Orphan and Nonorphan Genes in the Rice (Oryza sativa L.) Genome. Comp. Funct. Genom. 2007, 2007, 21676. [Google Scholar] [CrossRef] [PubMed]
  47. Zhang, X.; Li, W.; Zhu, S.; Sun, Y.; Wang, C.; Yan, X.; Zhou, Z. Identification and analysis of PAT gene family in three kinds of Apiaceae vegetable crops. Acta Agric. Zhejiangensis 2023, 35, 1315–1327. [Google Scholar]
  48. Xu, Z.; Huang, S.; Xie, Y.; Wang, S.; Jin, N.; Jin, L.; Tie, J.; Meng, X.; Li, Z.; Lyu, J.; et al. Physiological responses of coriander (Coriandrum sativum L.) to exogenous 2,4-epibrassinolide at different concentrations. BMC Plant Biol. 2023, 23, 649. [Google Scholar] [CrossRef] [PubMed]
  49. Livak, K.J.; Schmittgen, T. Analysis of relative gene expression data using real-time quantitative PCR and the 2−ΔΔCt method. Methods 2001, 25, 402–408. [Google Scholar] [CrossRef]
Figure 1. Procedure for identifying candidate ASGs, CsOGs, and ECGs in the coriander genome. The gray boxes represent plant genomes and PlantGDB-assembled unique transcripts (PUTs). The green boxes represent coriander genes. The blue boxes indicate coriander genes identified as ECG candidates, whereas the orange and purple boxes represent coriander genes identified as ASG and CsOG candidates, respectively.
Plants 14 00778 g001
Figure 2. Procedure for identifying CsOGs, ASGs, and ECGs in coriander genome. Nrdb indicates Non-redundant protein database, ESTs represents expressed sequence tags, and Nr/Nt indicates nucleotide collection. The blue, orange, and purple boxes bordered by red dotted lines represent coriander genes identified as ECGs, ASGs, and CsOGs, respectively.
Plants 14 00778 g002
Figure 3. Analysis of the chromosome distribution and intron numbers of CsOGs and ASGs in coriander. (A) Chromosome distribution of CsOGs and ASGs in coriander, showing both numbers and percentages. The X-axis represents the eleven chromosomes and scaffold (represented by unknown) of the coriander. The left Y-axis indicates the number of CsOGs (purple line with triangles) and ASGs (purple line with circles) on each chromosome, while the right Y-axis represents the percentage of CsOGs (green line with triangles) and ASGs (green line with circles) per chromosome. (B) Intron number analysis of CsOGs and ASGs. Intron numbers are classified into six categories, as indicated on the X-axis. The left Y-axis shows the number of CsOGs (purple line with triangles) and ASGs (purple line with circles) for each intron category, while the right Y-axis represents the percentage of CsOGs (green line with triangles) and ASGs (green line with circles) for each intron category.
Plants 14 00778 g003
Figure 4. Physical map of the CsOGs on each chromosome of the coriander genome. The physical map of the CsOGs was constructed based on the chromosomal position of each gene, starting from the beginning of each chromosome. Chr1–Chr11 represents the 11 chromosomes of the coriander genome. The black oblongs indicate different chromosomes. The numbers on the right side of each chromosome indicate the number of CsOGs, while lines within black oblongs represent the chromosomal positions of each CsOG. Genes located on scaffold are not included in this figure.
Plants 14 00778 g004
Figure 5. Expression patterns of CsOGs across different tissues and growth stages of coriander (C. sativum). (A) Venn diagram showing the distribution of 941 CsOGs across different tissues of C. sativum. (B) Venn diagram showing the distribution of 941 CsOGs across different growth stages of C. sativum. (C) Heat map of CsOG expression (FPKM > 0) across different tissues of C. sativum. The columns represent different tissues, with FPKM values indicating expression changes. (D) Heat map of CsOG expression (FPKM > 0) across different growth stages of C. sativum. The columns represent different growth stages, with FPKM values indicating expression changes. The red color in the heat map indicates high expression, while the green color indicates low expression.
Plants 14 00778 g005
Figure 6. Expression levels of CsOGs across different tissues and growth stages of coriander (C. sativum). (AE) Expression levels of CsOGs at different growth stages of coriander, with CS30, CS60, and CS90 representing leaves at 30 days, 60 days, and 90 days, respectively. (FJ) Expression levels of CsOGs in various tissues of coriander, with CSR, CSS, CSL, and CSF representing the roots, stems, leaves, and flowers, respectively. Y-axis indicates the relative expression level of standardized genes, and the qRT-PCR reactions were normalized using the Actin gene as reference for all comparisons. The data are presented as means ± SE from three independent measurements. Significant differences, as determined by one-way ANOVA, are indicated by different letters above the bars (p < 0.05).
Plants 14 00778 g006
Figure 7. Expression patterns of five CsOGs in coriander (C. sativum) leaves after cold stress. (AE) Expression levels of five CsOGs under cold stress. D1, D2, D3, and D4 represent 55-day-old C. sativum plants exposed to 4 °C, with leaf samples collected at 1 h intervals. Y-axis indicates the relative expression level of standardized genes, and the qRT-PCR reactions were normalized using the Actin gene as reference for all comparisons. The data are presented as means ± SE from three independent measurements. Significant differences, as determined by one-way ANOVA, are indicated by different letters above the bars (p < 0.05).
Plants 14 00778 g007
Table 1. Genic features of the CsOGs, ASGs, and ECGs.
Features941 CsOGs1298 ASGs38,508 ECGs
Mean (SD)Mean (SD)Mean (SD)
Protein length115.72 (52.80)171.00 (102.65)371.21 (281.89)
CDS length350.04 (158.40)515.93 (308.00)1116.60 (845.67)
Gene length1778.90 (3229.96)1666.62 (2721.17)3729.82 (4891.99)
Intron length646.41 (1385.30)583.73 (2157.20)536.15 (1305.61)
CDS GC (%)42.59 (5.54)42.79 (5.04)42.69 (3.26)
Intron GC (%)23.44 (16.15)24.71 (15.12)25.69 (13.20)
Gene GC (%)37.64 (5.15)38.64 (5.04)37.22 (3.64)
Exons/gene2.30 (1.42)2.42 (1.37)4.98 (4.71)
Disclaimer/Publisher’s Note: The statements, opinions and data contained in all publications are solely those of the individual author(s) and contributor(s) and not of MDPI and/or the editor(s). MDPI and/or the editor(s) disclaim responsibility for any injury to people or property resulting from any ideas, methods, instructions or products referred to in the content.

