
Association Between Gall Structural and Metabolic Complexity: Evidence from Pistacia palaestina

 ,
,  ,
,  and
and
Abstract
1. Introduction
- Banana-like (in shape and size) galls induced by B. pistaciae, which can house thou-sands of aphids and significantly impact the entire shoot (Figure 1a).
- Spherical galls induced by Geoica spp. on leaflet midribs, supporting hundreds of aphids (Figure 1b).
- Flat, open galls induced by P. cimiciformis on leaflet margins, with minimal impact on the plant and housing fewer than 100 aphids (Figure 1c).
2. Results
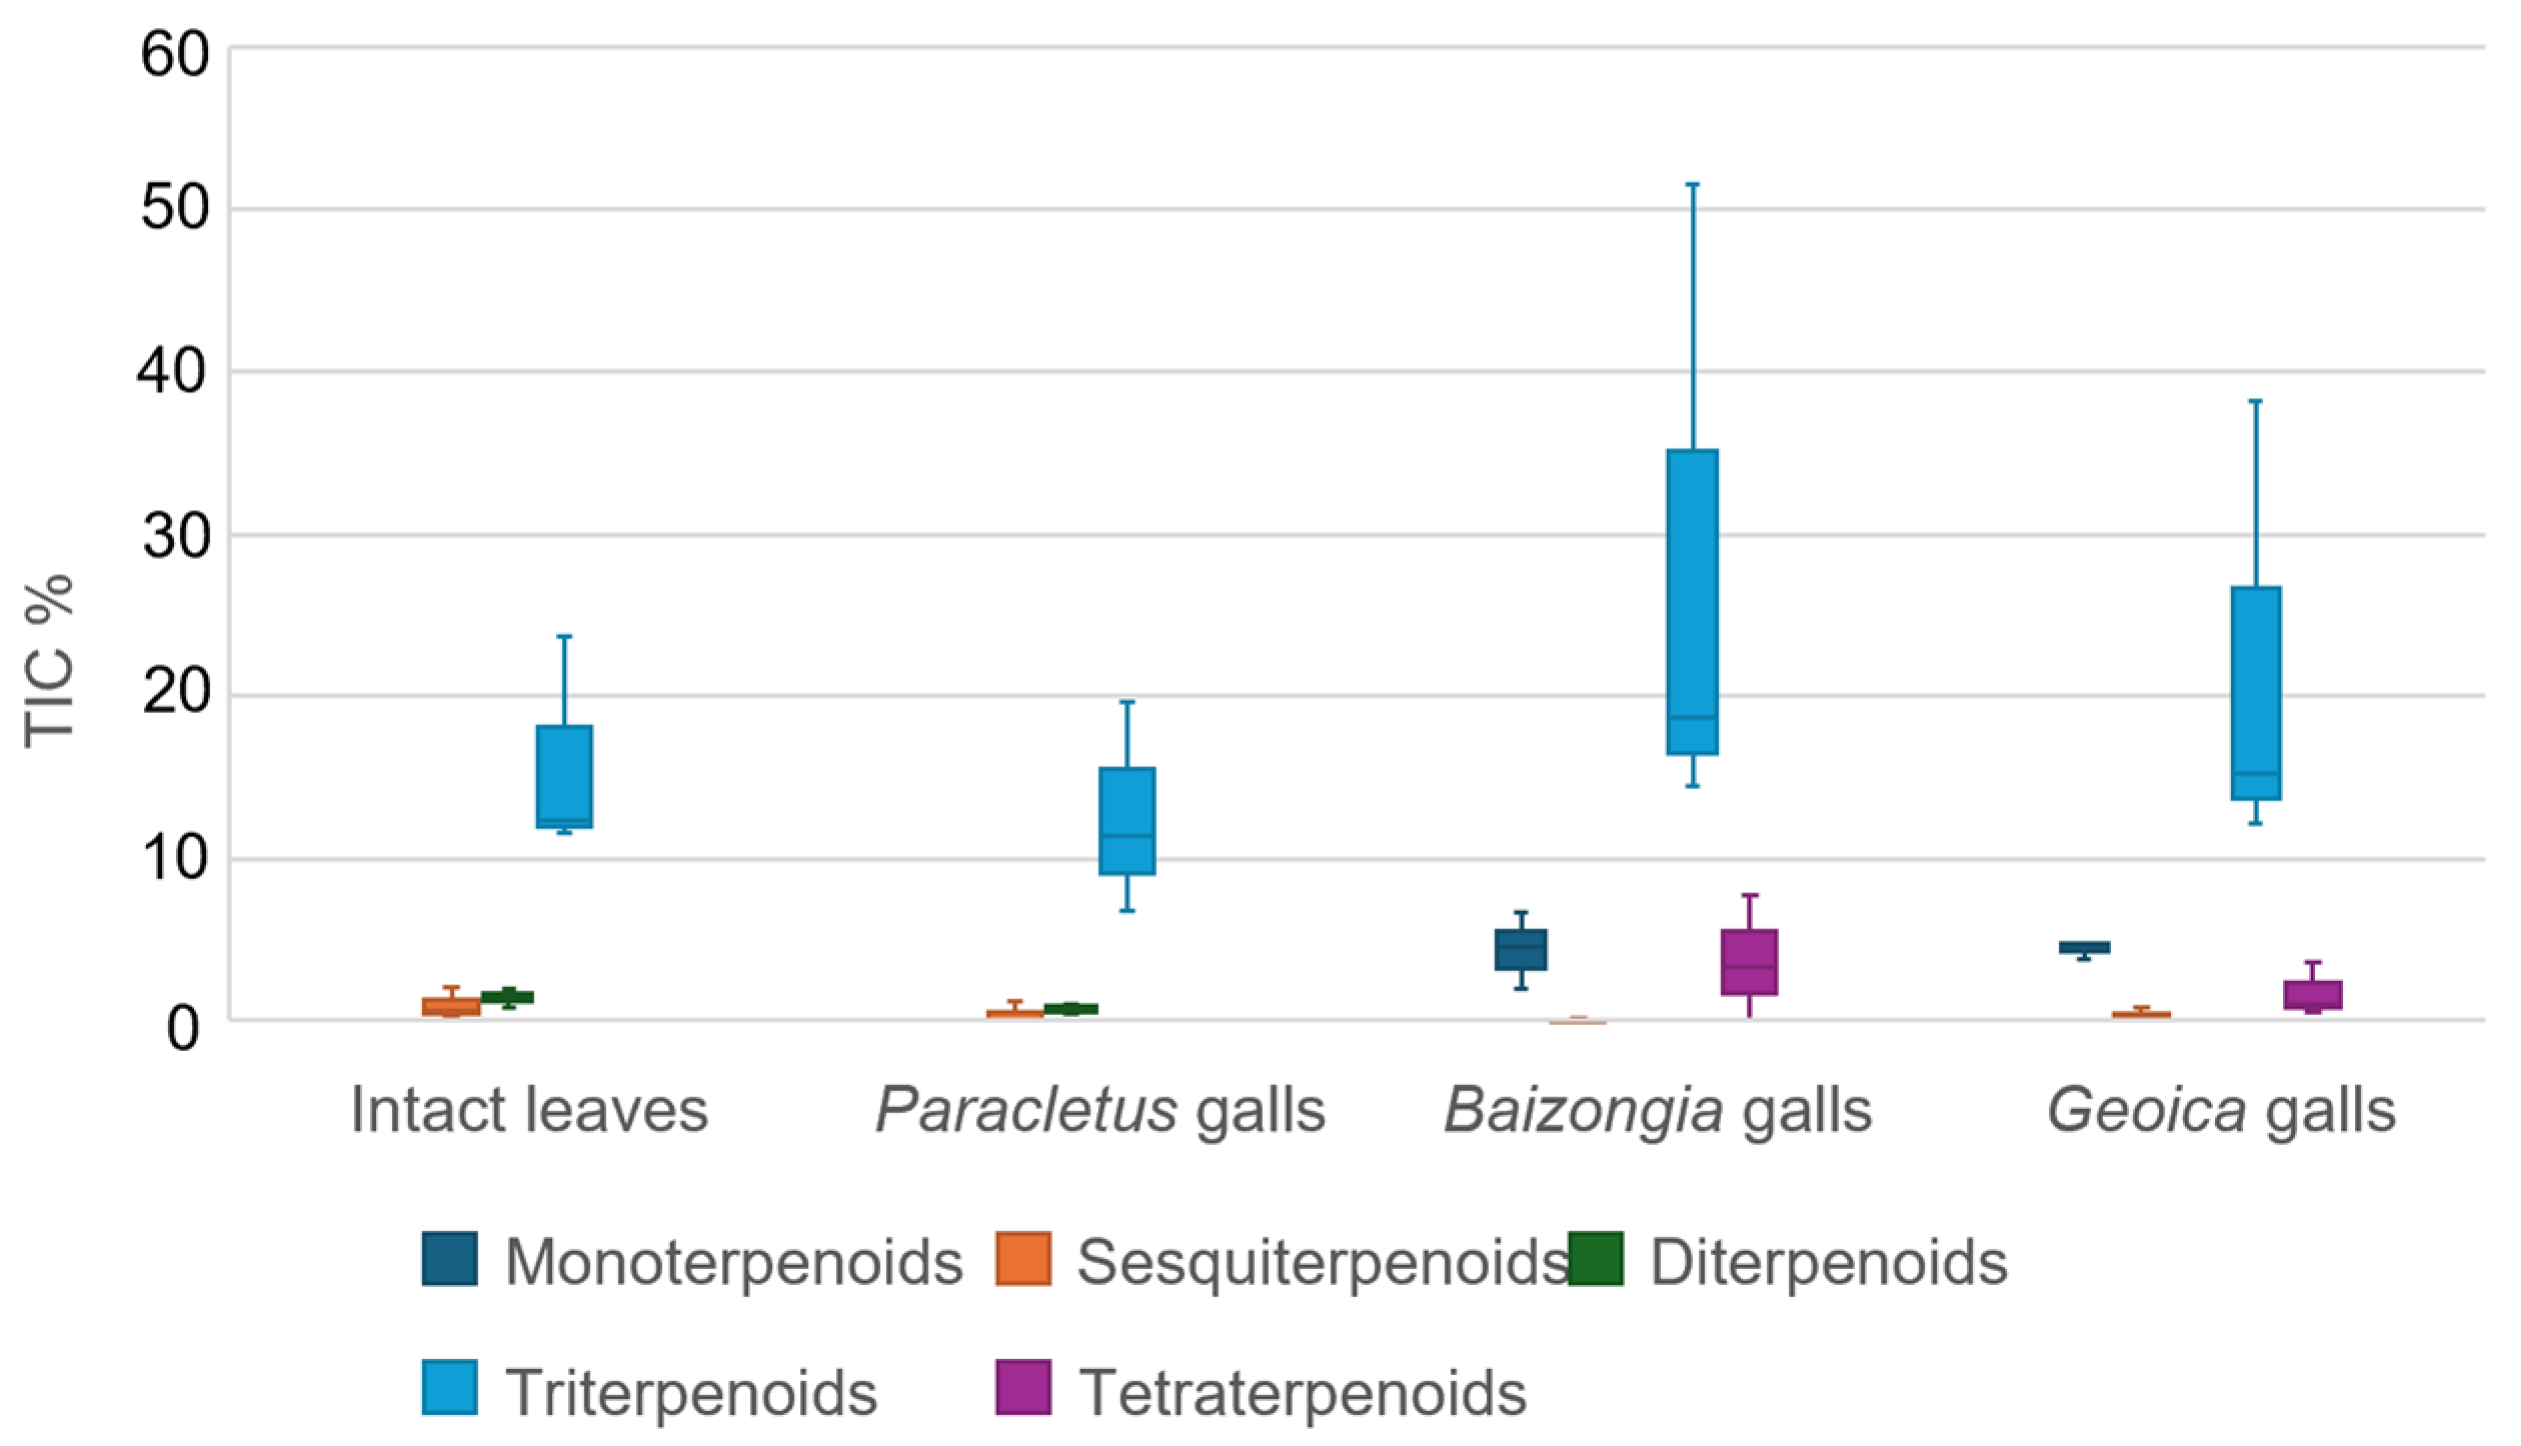
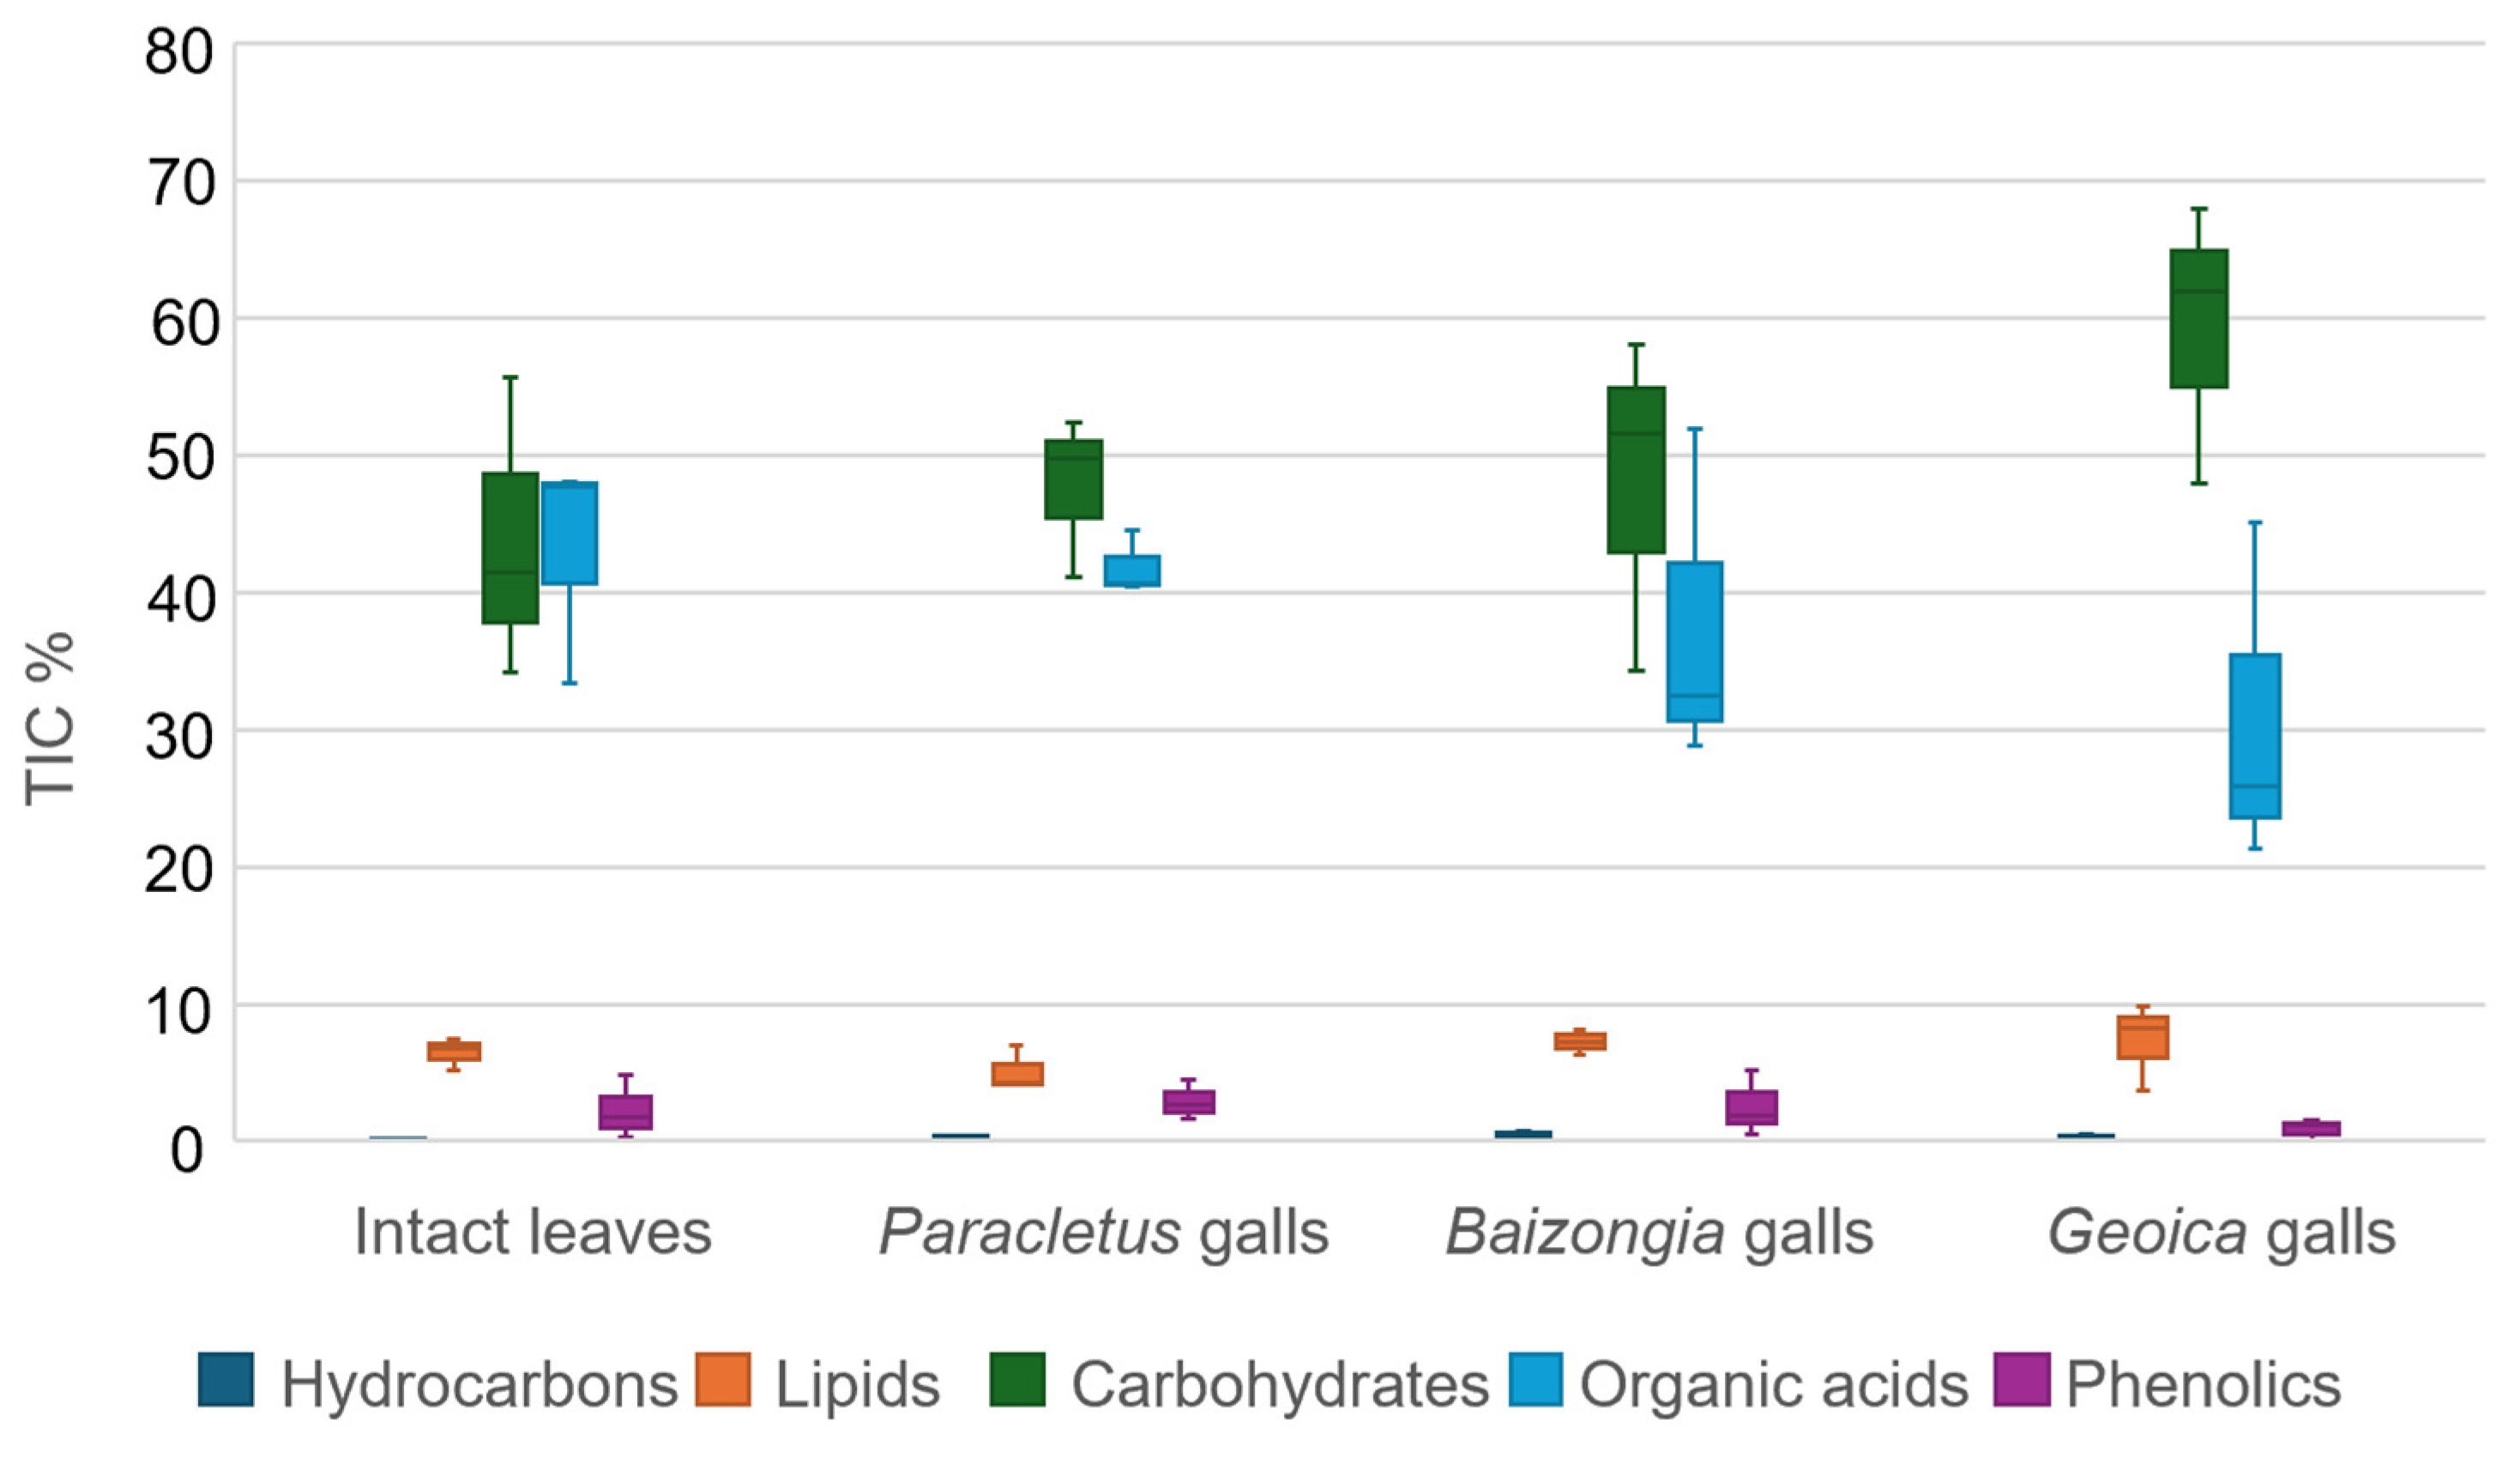
2.1. Metabolic Profiles of EtOAc Extracts from Galls and Leaves
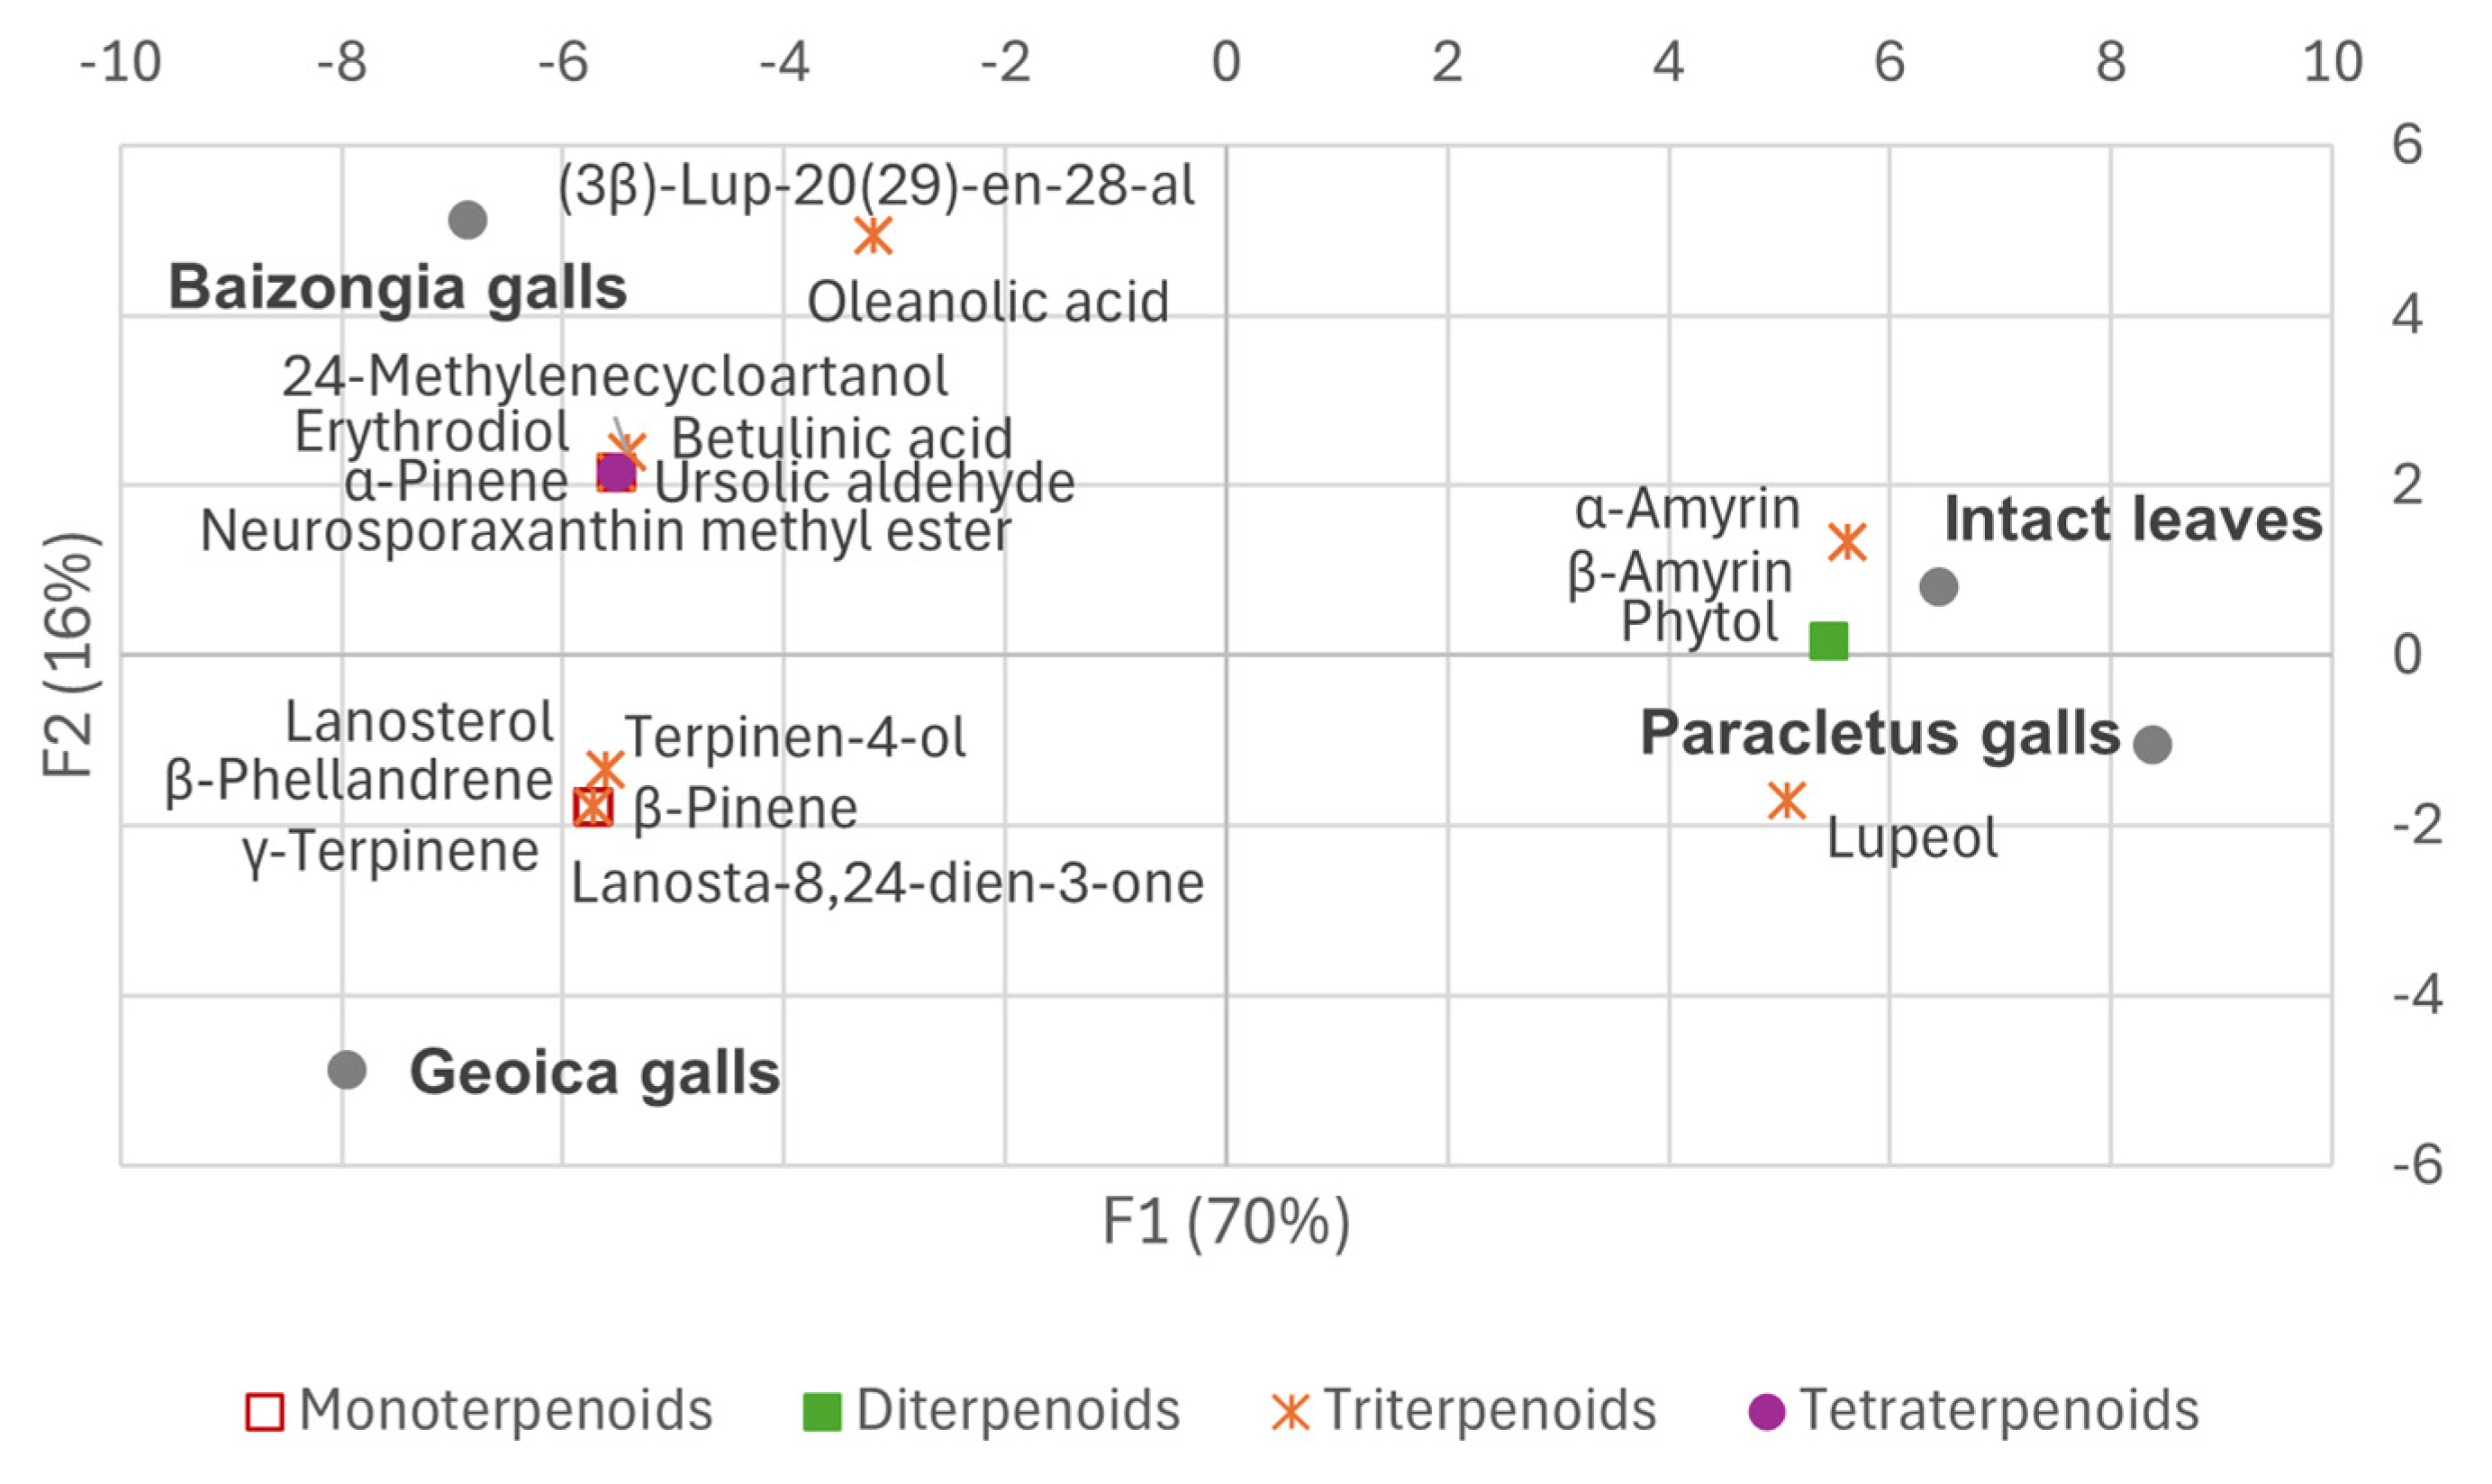
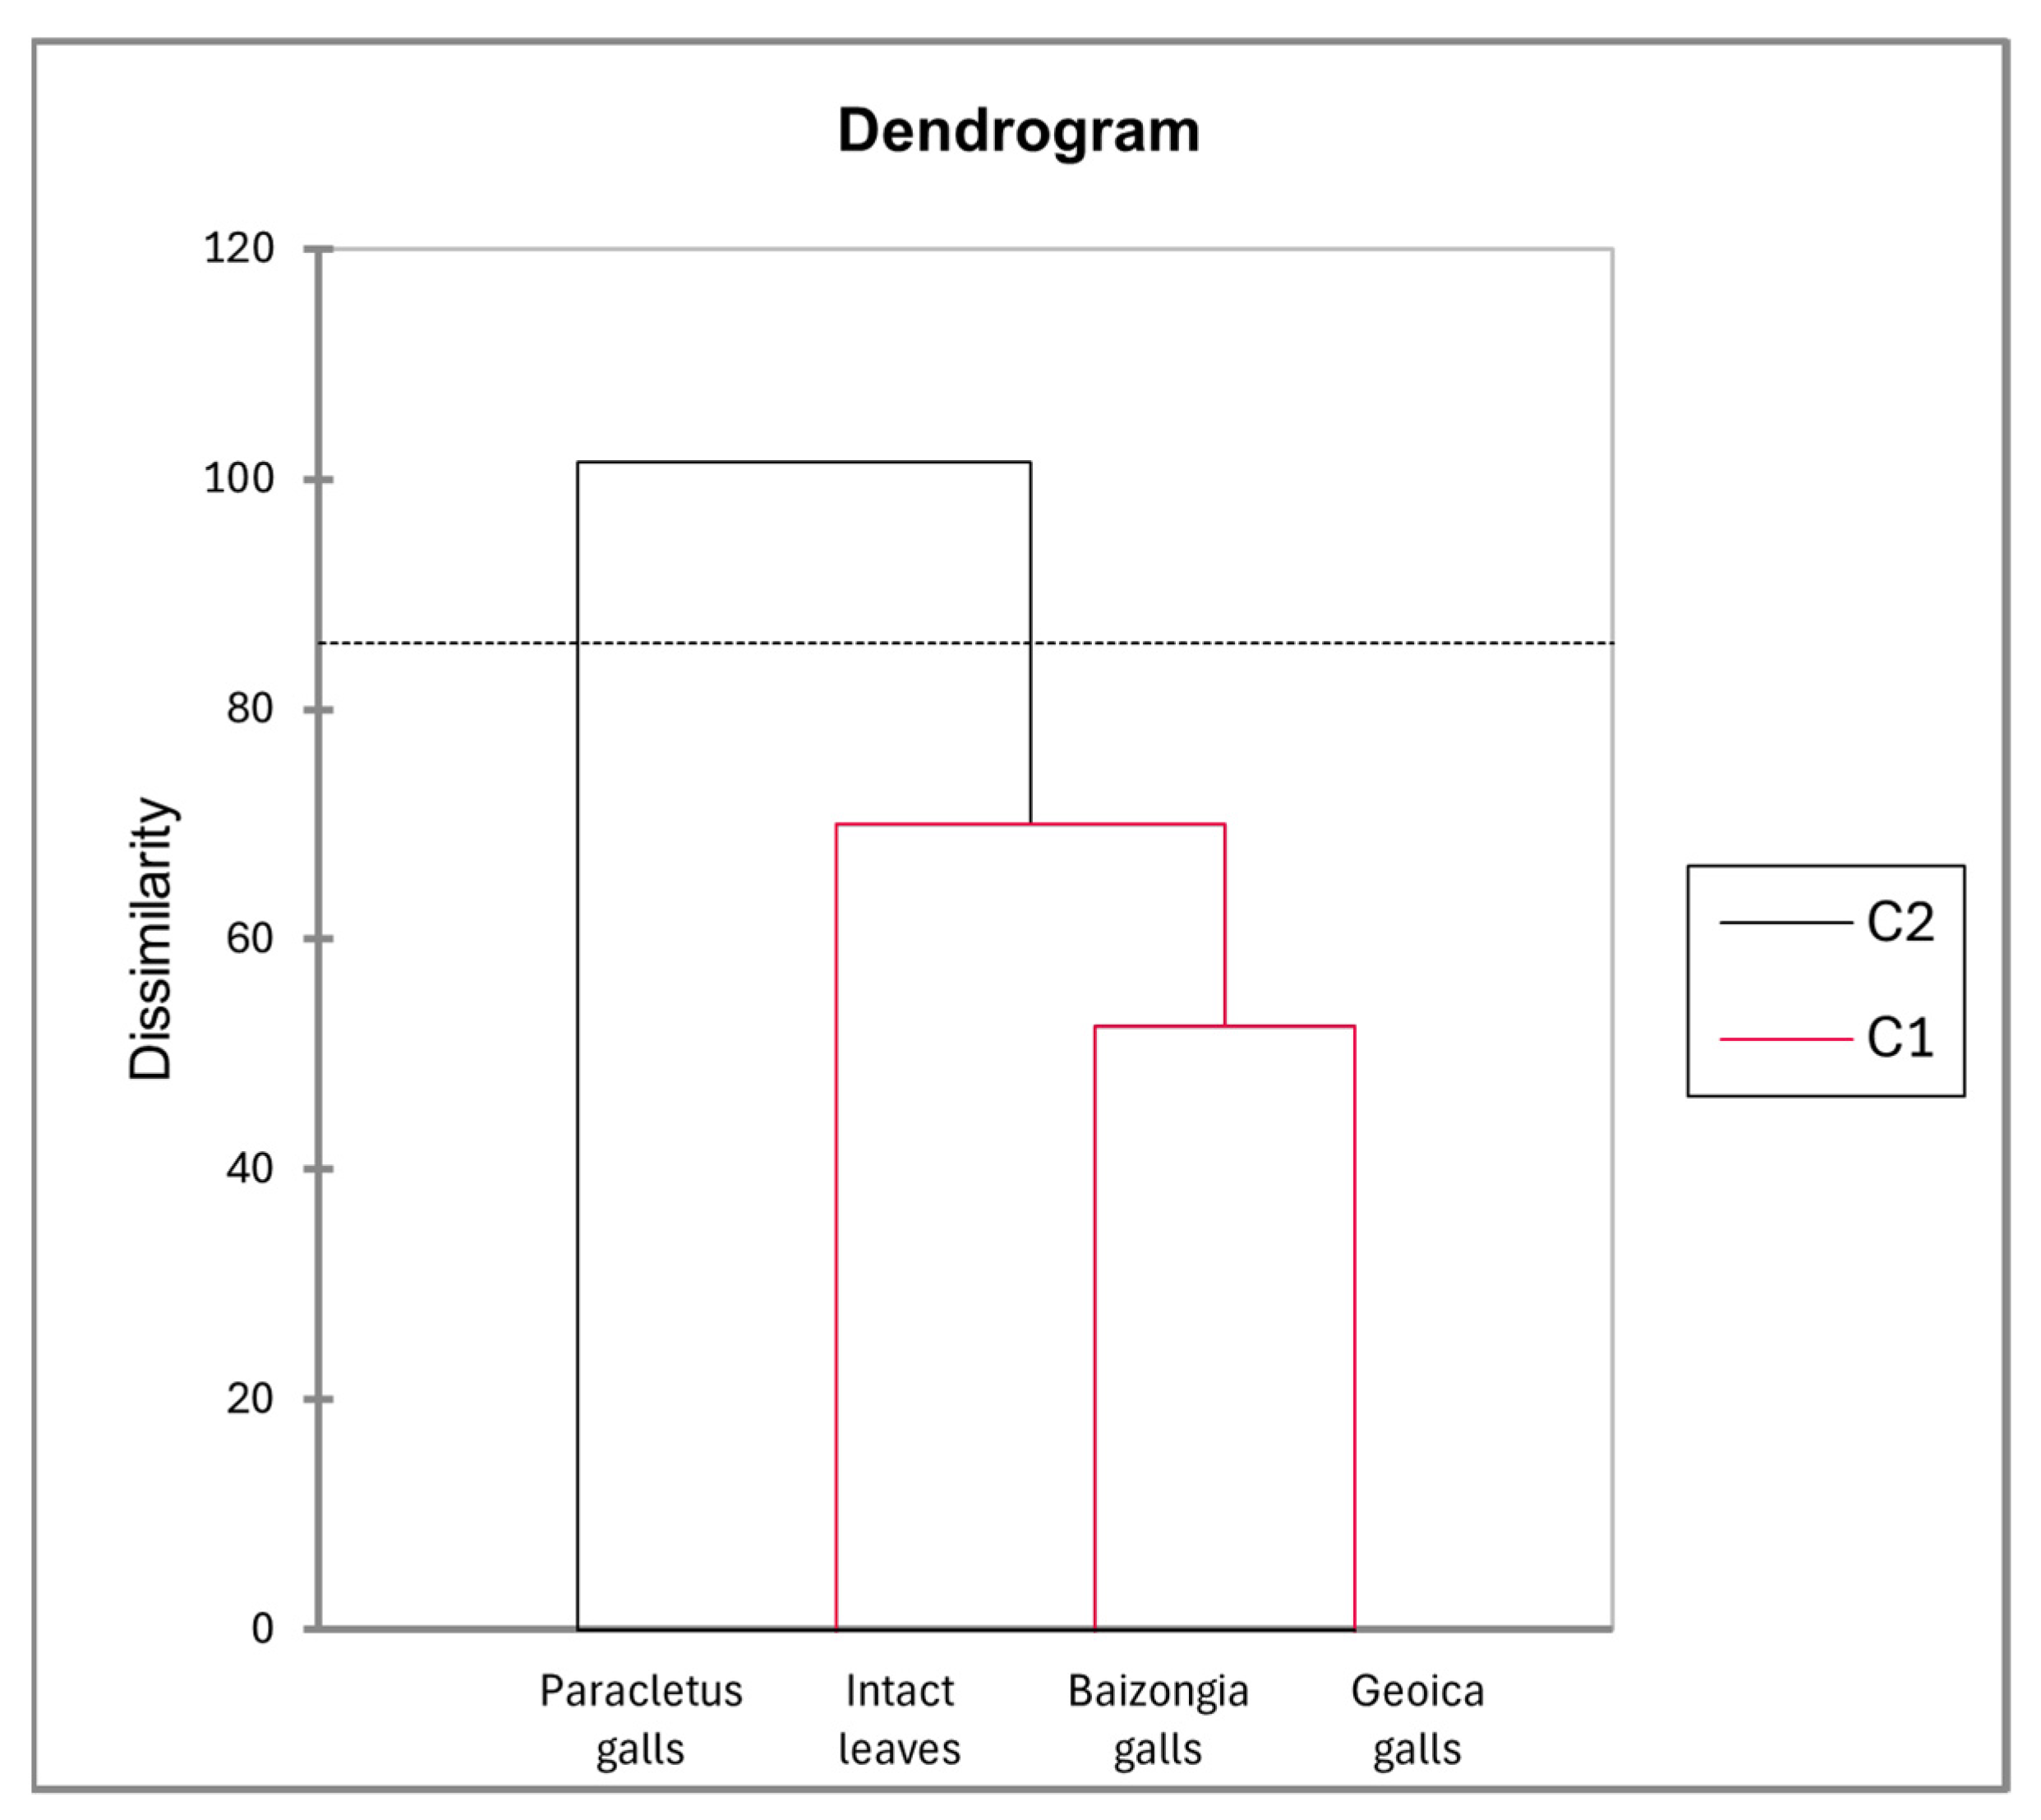
2.1.1. Metabolic Variations in EtOAc Extracts Between Galls and Leaves
- F1: Metabolites with high positive loadings were predominant in intact leaves and Paracletus galls, while negative loadings were associated with Baizongia and Geoica galls.
- F2: This axis reflected the accumulation of α-terpinene, zonarene, and galactose/galactinol isomers in Geoica samples and gallic acid in Paracletus, Baizongia, and Geoica galls from Tree 1.
- F3: Negative loadings corresponded to higher fructose isomer levels in Paracletus galls and ursolic acid in Baizongia (Tree 2) and all Geoica samples.
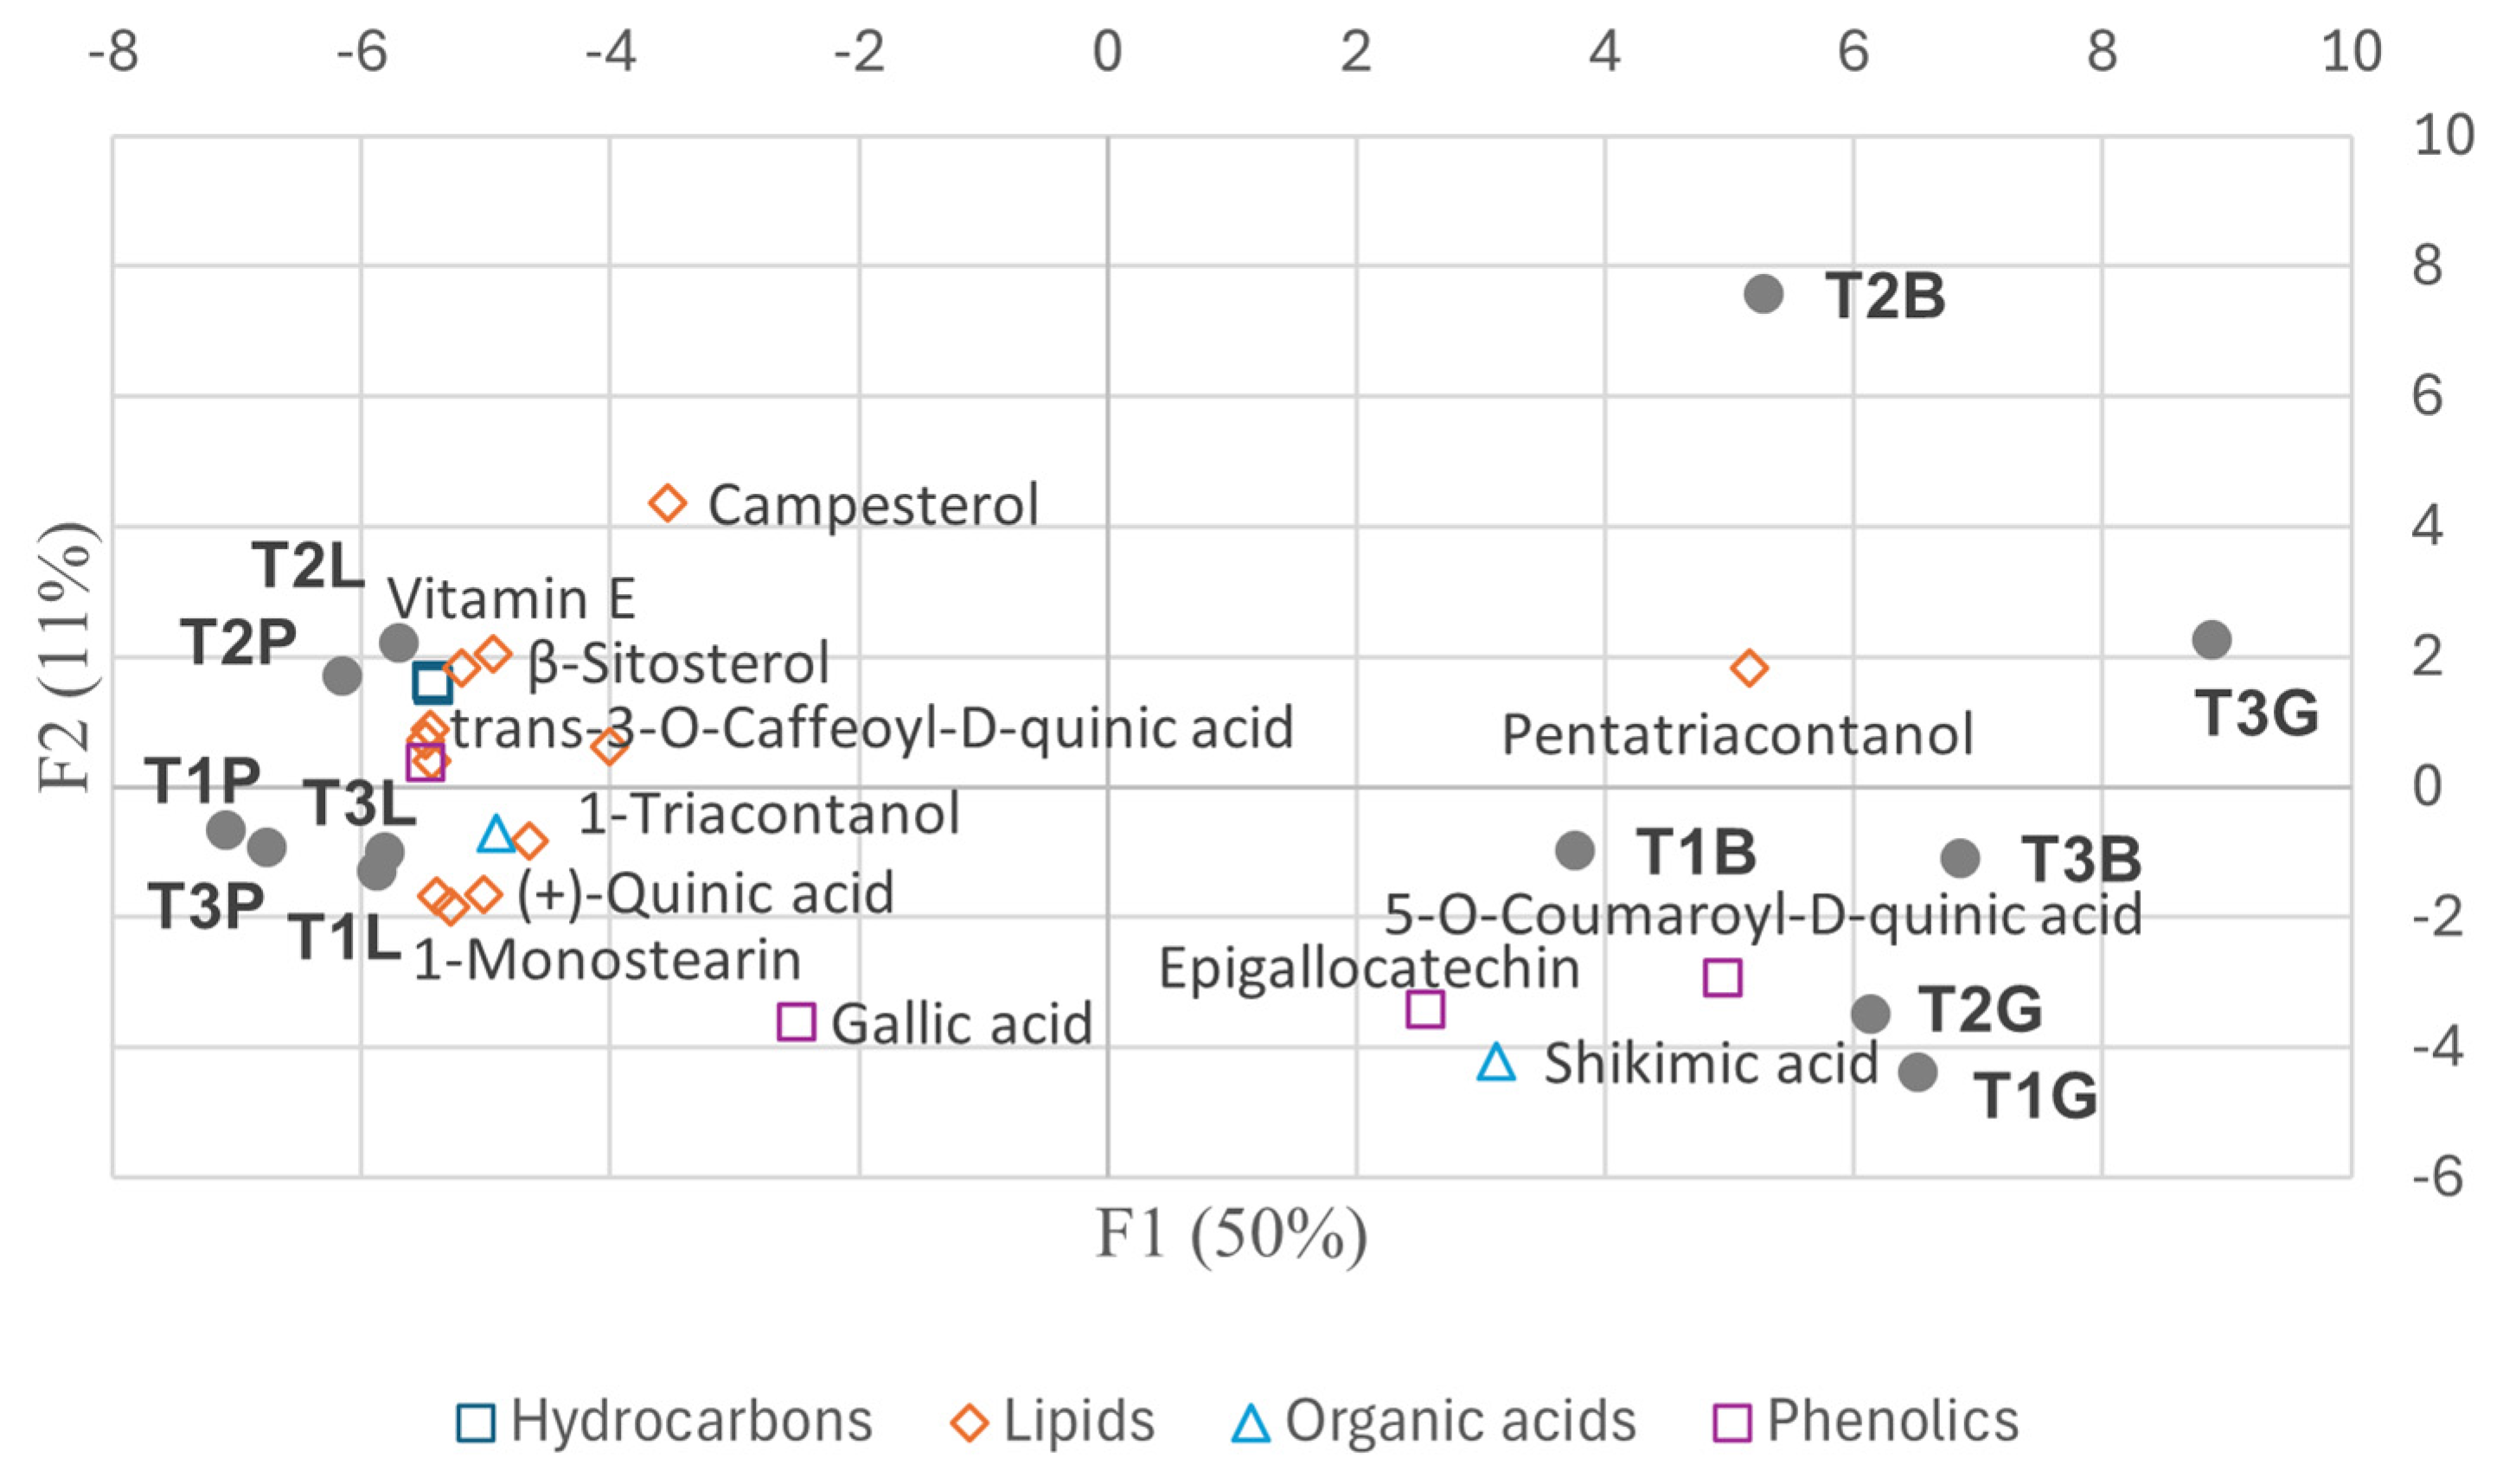
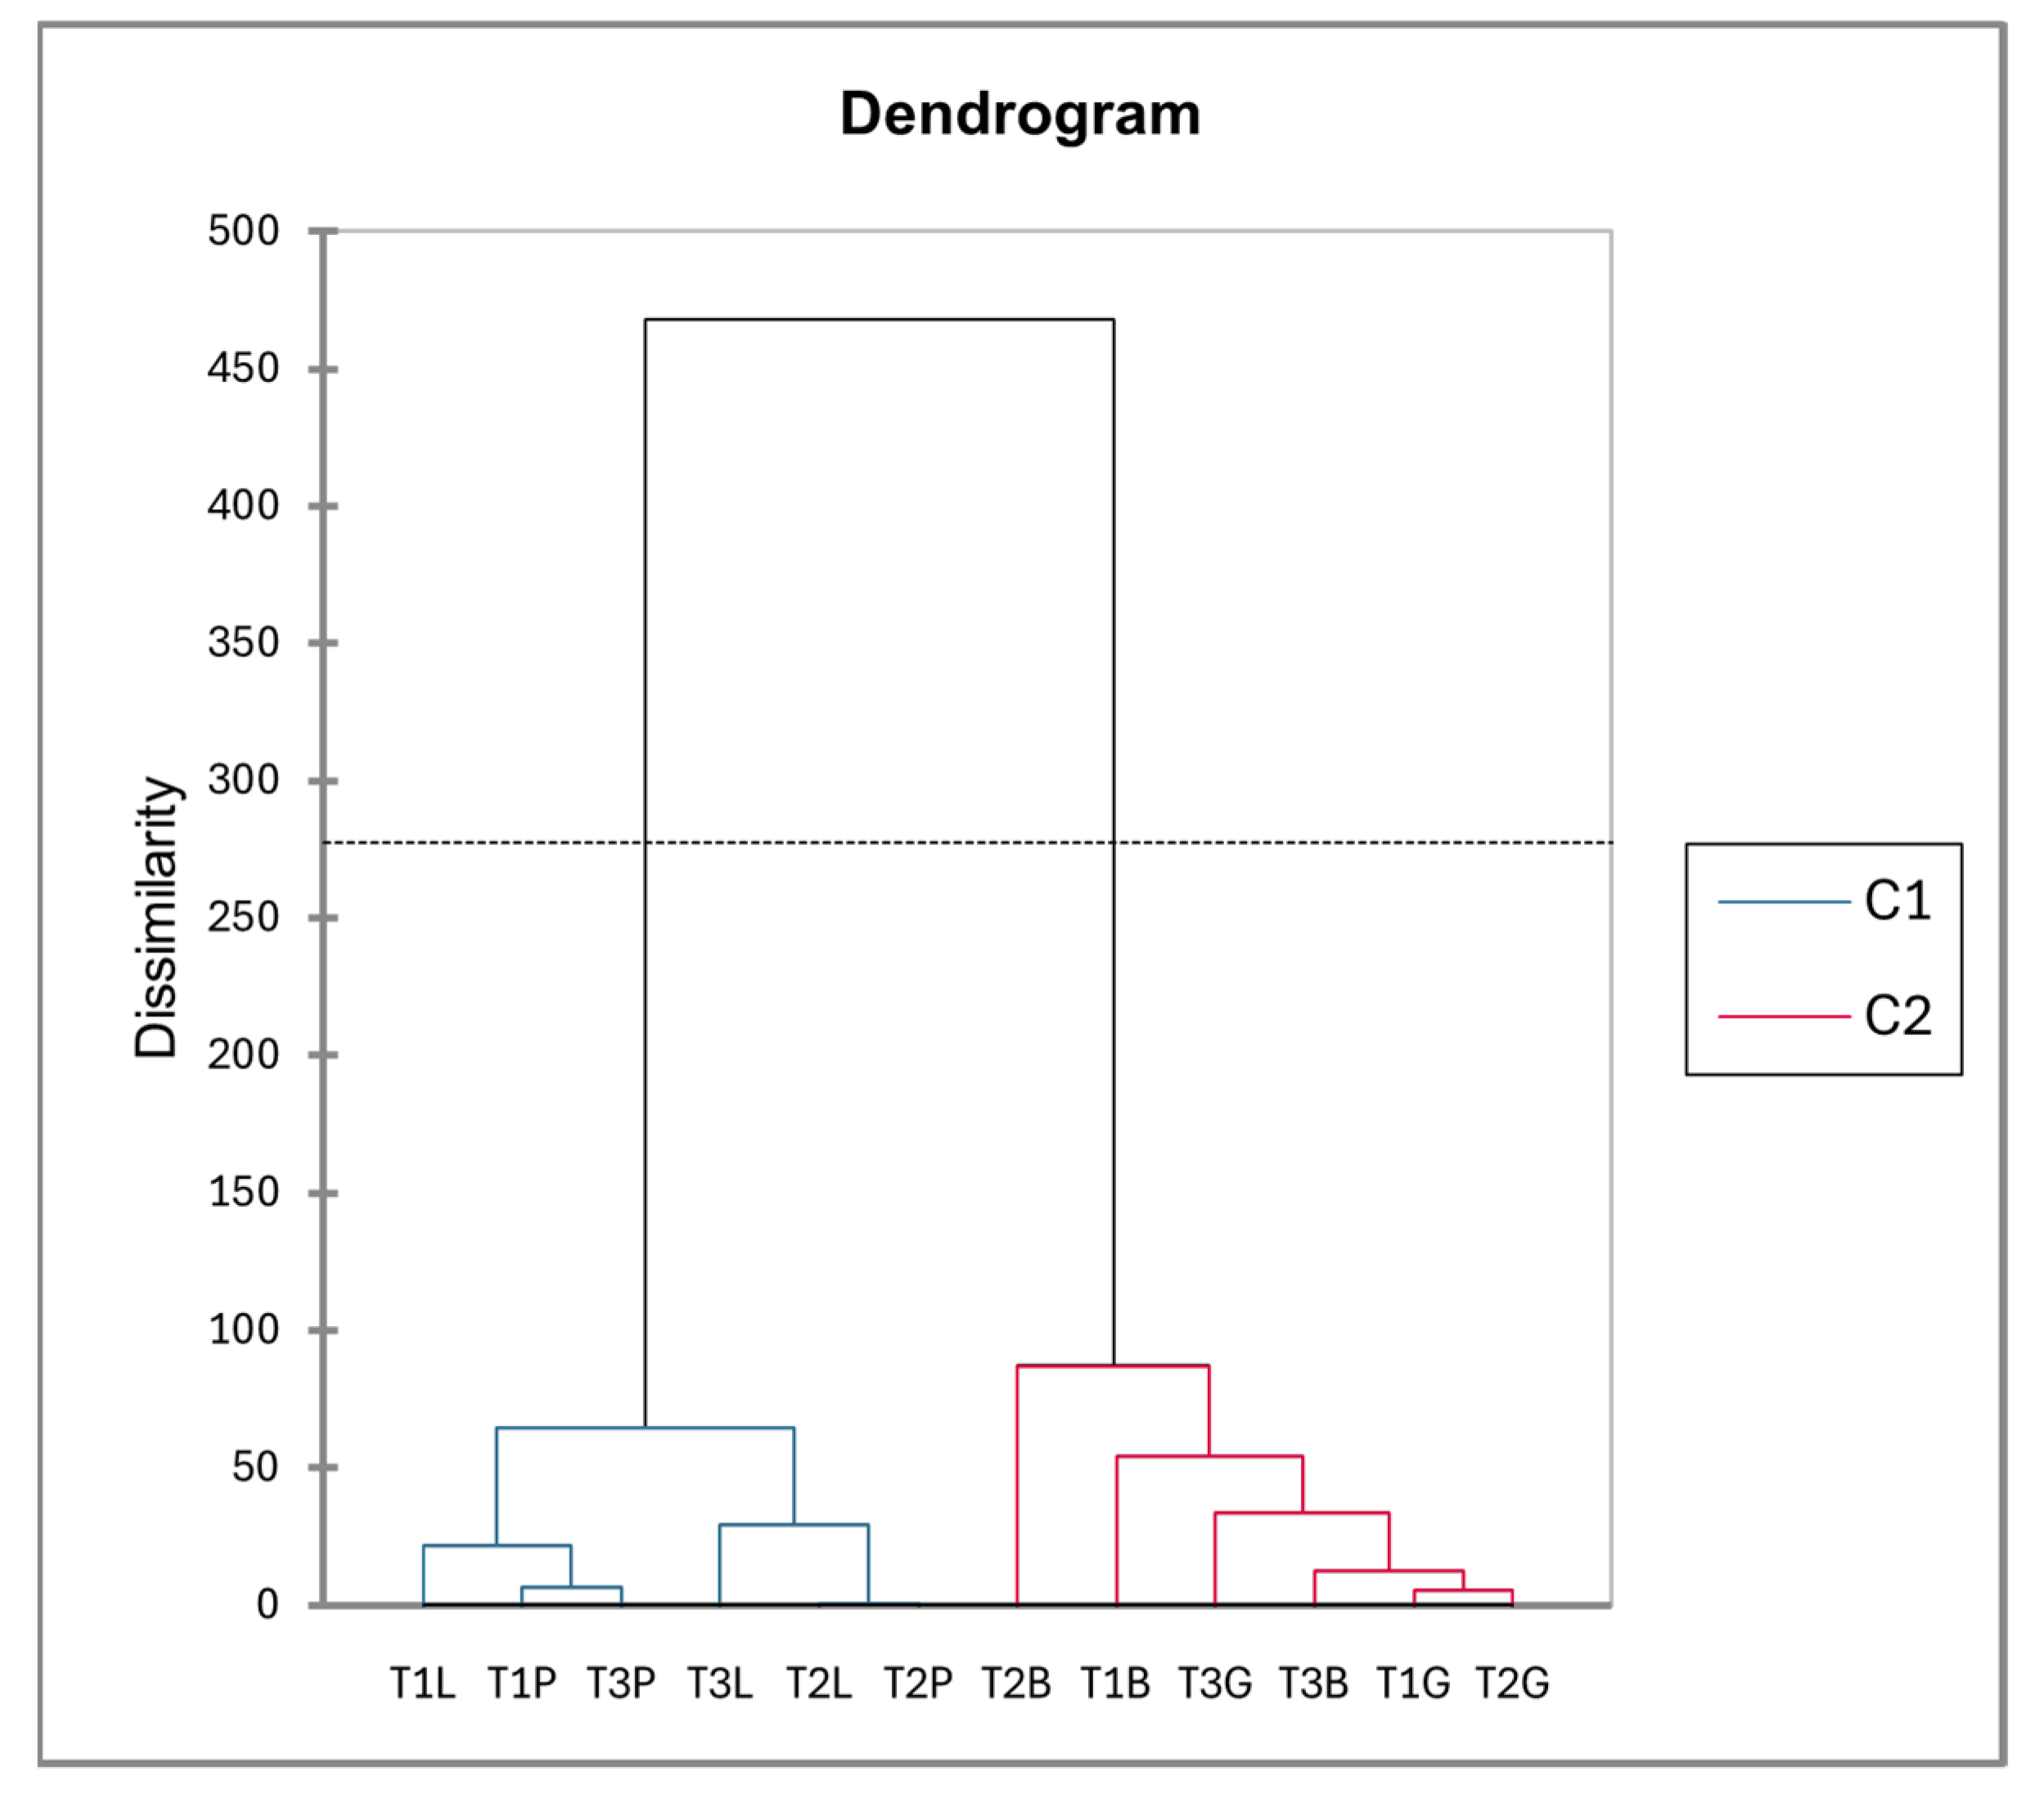
2.1.2. Tree-Specific Variations in the Metabolites of EtOAc Extracts from Galls and Leaves
- F1: Terpenoids were enriched in Baizongia (T1B, T2B, T3B) and Geoica galls (T1G, T2G, T3G), whereas lipids were more abundant in Paracletus galls (T1P, T2P, T3P) and in-tact leaves (T1L, T2L, T3L). Additionally, moderate positive loadings were associated with terpenoids, including α-terpinene, terpinene-4-ol, lanosta-7,9,24-trien-3β-ol, and the sugar alcohol galactinol (isomer 2), which accumulated specifically in Geoica galls.
- F2: This axis lacked clear patterns, though negative loadings reflected certain com-pound accumulations in Baizongia and Geoica galls across trees. A strong positive loading corresponded to campesterol accumulation in Paracletus galls and leaves from all trees.
2.2. Metabolic Profiles of MeOH Extracts from Galls and Leaves
2.2.1. Metabolic Variations in MeOH Extracts Between Galls and Leaves
- F1: Metabolites with high positive loadings were mainly enriched in intact leaves and Paracletus galls, with some also present in Baizongia galls. Negative loadings corresponded to metabolites predominantly found in Baizongia and Geoica galls.
- F2: Positive loadings highlighted 2-monopalmitin and 1-monostearin in leaves, 2-keto-L-gluconic acid in Baizongia galls, and gluconic acid in Paracletus galls. Negative loadings corresponded to n-heptadecane, malic acid, pyrogallol, and coniferyl alcohol in Paracletus galls, and palmitic acid in Geoica galls.
- F3: Positive loadings indicated n-eicosane, galactose, methyl galactoside, sucrose, and caffeic acid in Baizongia galls, and fructose in Geoica galls. Negative loadings were linked to methyl glucoside, predominantly in leaves and Paracletus galls, and 4-O-methyl-myo-inositol in Geoica and Paracletus galls.
2.2.2. Tree-Specific Variations in the Metabolites of MeOH Extracts from Galls and Leaves
- F1 captures a complex distribution of metabolites, with some enriched in a single tree, while others are shared between two. Negative loadings include shikimic acid and methyl linolenate, both enriched in Tree 3, and melibiose, which is more abundant in Tree 1.
- F2 primarily reflects metabolites associated with Tree 1, with the only negative loading corresponding to methyl glucoside, which is enriched in Tree 2.
- F3 differentiates Tree 2 and Tree 3, where positive loadings correspond to metabolites enriched in Tree 2, while negative loadings represent compounds predominantly found in Tree 3.
3. Discussion
3.1. Limited Host Impact and Subtle Manipulation by P. cimiciformis
3.2. Manipulation of Host Terpenoid Metabolism by B. pistaciae and Geoica spp.
3.3. Shikimate and Phenylpropanoid Pathway Shifts Induced by Baizongia and Geoica Aphids
3.4. Metabolic Variation Across Aphid Species and Host Trees
3.5. Interplay Between Aphid Species, Host Genotype, and Environment
3.6. Comparison of EtOAc and MeOH Extracts
4. Materials and Methods
4.1. Plant Material
4.2. Extraction
4.3. Sample Preparation for GC–MS Analysis
4.4. GC–MS Analysis
4.5. Data Analysis
4.5.1. Descriptive Statistics and Outlier Detection
4.5.2. Normality Assessment
4.5.3. Kruskal–Wallis Test
4.5.4. Correlation Test
4.5.5. Data Standardization
4.5.6. PCA
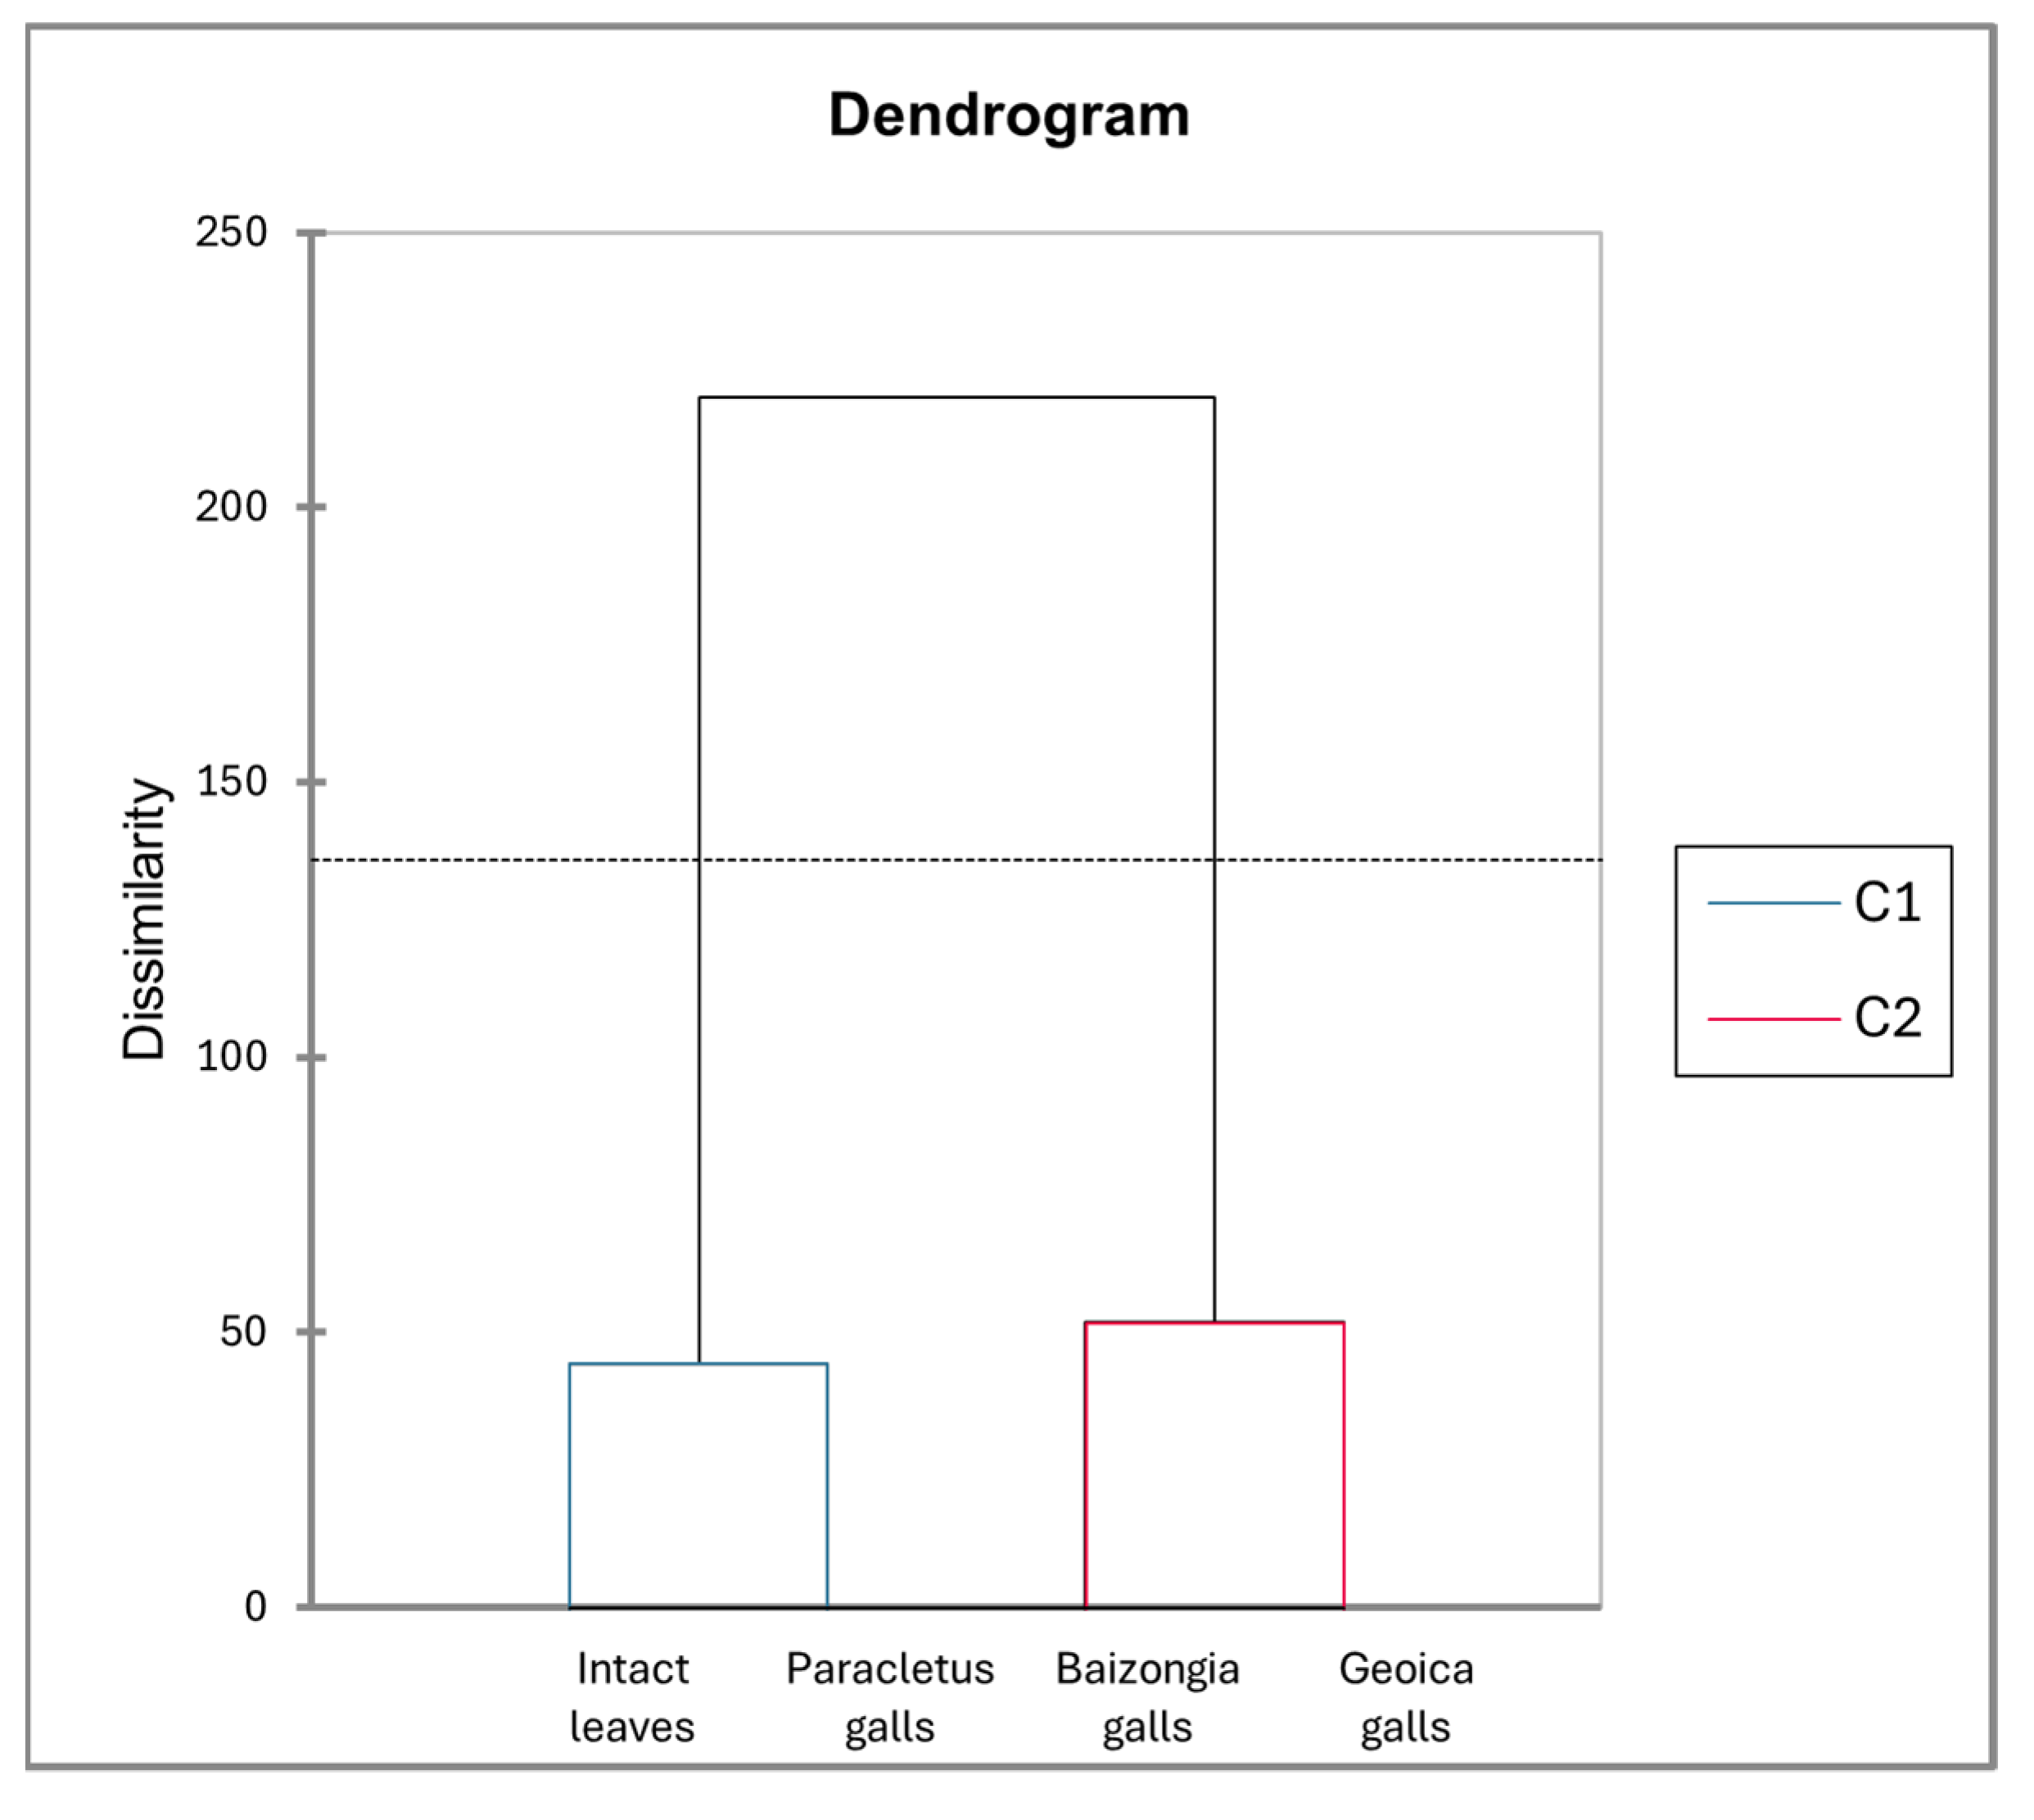
4.5.7. AHC
5. Conclusions
Supplementary Materials
Author Contributions
Funding
Data Availability Statement
Conflicts of Interest
References
- Inbar, M.; Wool, D. Phloem-Feeding Specialists Sharing a Host Tree: Resource Partitioning Minimizes Interference Competition among Galling Aphid Species. Oikos 1995, 73, 109–119. [Google Scholar] [CrossRef]
- Wool, D. Aphid-Induced Galls on Pistacia in the Natural Mediterranean Forest of Israel: Which, Where, and How Many? Israel J. Zool. 2013, 41, 591–600. [Google Scholar]
- Gätjens-Boniche, O. The Mechanism of Plant Gall Induction by Insects: Revealing Clues, Facts, and Consequences in a Cross-Kingdom Complex Interaction. Rev. Biol. Trop. 2019, 67, 1359–1382. [Google Scholar] [CrossRef]
- Korgaonkar, A.; Han, C.; Lemire, A.L.; Siwanowicz, I.; Bennouna, D.; Kopec, R.E.; Andolfatto, P.; Shigenobu, S.; Stern, D.L. A Novel Family of Secreted Insect Proteins Linked to Plant Gall Development. Curr. Biol. 2021, 31, 1836–1849. [Google Scholar] [CrossRef] [PubMed]
- Inbar, M.; Wink, M.; Wool, D. The Evolution of Host Plant Manipulation by Insects: Molecular and Ecological Evidence from Gall-Forming Aphids on Pistacia. Mol. Phylogenet. Evol. 2004, 32, 504–511. [Google Scholar] [CrossRef]
- Rostás, M.; Maag, D.; Ikegami, M.; Inbar, M. Gall Volatiles Defend Aphids Against a Browsing Mammal. BMC Evol. Biol. 2013, 13, 193. [Google Scholar] [CrossRef]
- Flamini, G.; Bader, A.; Cioni, P.L.; Katbeh-Bader, A.; Morelli, I. Composition of the Essential Oil of Leaves, Galls, and Ripe and Unripe Fruits of Jordanian Pistacia palaestina Boiss. J. Agric. Food Chem. 2004, 52, 572–576. [Google Scholar] [CrossRef]
- Rand, K.; Bar, E.; Ben-Ari, M.; Lewinsohn, E.; Inbar, M. The Mono- and Sesquiterpene Content of Aphid-Induced Galls on Pistacia palaestina is Not a Simple Reflection of Their Composition in Intact Leaves. J. Chem. Ecol. 2014, 40, 632–642. [Google Scholar] [CrossRef]
- Caputo, R.; Mangoni, L.; Monaco, P.; Palumbo, G. Triterpenes from the Galls of Pistacia palestina. Phytochemistry 1979, 18, 896–898. [Google Scholar] [CrossRef]
- Rand, K.; Bar, E.; Ari, M.B.; Davidovich-Rikanati, R.; Dudareva, N.; Inbar, M.; Lewinsohn, E. Differences in Monoterpene Biosynthesis and Accumulation in Pistacia palaestina Leaves and Aphid-Induced Galls. J. Chem. Ecol. 2017, 43, 143–152. [Google Scholar] [CrossRef]
- Davidovich-Rikanati, R.; Bar, E.; Hivert, G.; Huang, X.Q.; Hoppen-Tonial, C.; Khankin, V.; Rand, K.; Abofreih, A.; Muhlemann, J.K.; Marchese, J.A.; et al. Transcriptional Up-Regulation of Host-Specific Terpene Metabolism in Aphid-Induced Galls of Pistacia palaestina. J. Exp. Bot. 2022, 73, 555–570. [Google Scholar] [CrossRef] [PubMed]
- Bar, E.; Davidovich-Rikanati, R.; Saini, S.; Inbar, M.; Lewinsohn, E. Chiral Chemopolymorphism in the Monoterpenes of Pistacia palaestina Leaves and Galls. Chirality 2024, 36, e23702. [Google Scholar] [CrossRef] [PubMed]
- Martinez, J.J.I. Anti-Insect Effects of the Gall Wall of Baizongia pistaciae [L.], a Gall-Inducing Aphid on Pistacia palaestina Boiss. Arthropod Plant Interact. 2010, 4, 29–34. [Google Scholar] [CrossRef]
- Lev-Yadun, S.; Inbar, M. The Potential of Visual and Olfactory Signals in Gall Defence. Indian J. Entomol. 2024, 86, 287–294. [Google Scholar] [CrossRef]
- Gerchman, Y.; Inbar, M. Distinct Antimicrobial Activities in Aphid Galls on Pistacia atlantica. Plant Signal. Behav. 2011, 6, 2008–2012. [Google Scholar] [CrossRef]
- Patel, S.; Rauf, A.; Khan, H. The Relevance of Folkloric Usage of Plant Galls as Medicines: Finding the Scientific Rationale. Biomed. Pharmacother. 2018, 97, 240–247. [Google Scholar] [CrossRef]
- Crutcher, M.; Schroeder, A.; Wagner, M.; Alsharif, B.; Boylan, F. A Review of the Phytochemical Properties and Pharmacological Uses of the Genus Pistacia L. (Anacardiaceae). Infarma 2023, 35, 285–331. [Google Scholar] [CrossRef]
- Xiong, W.; Liao, L.; Ni, Y.; Gao, H.; Yang, J.; Guo, Y. The Effects of Epicuticular Wax on Anthracnose Resistance of Sorghum bicolor. Int. J. Mol. Sci. 2023, 24, 3070. [Google Scholar] [CrossRef]
- Mamgain, J.; Mujib, A.; Bansal, Y.; Gulzar, B.; Zafar, N.; Syeed, R.; Alsughayyir, A.; Dewir, Y.H. Elicitation Induced α-Amyrin Synthesis in Tylophora indica In Vitro Cultures and Comparative Phytochemical Analyses of In Vivo and Micropropagated Plants. Plants 2023, 13, 122. [Google Scholar] [CrossRef]
- Luo, X.; Li, J.; Cen, Z.; Feng, C.; Hong, M.; Huang, L.; Long, Q. Exploring the Therapeutic Potential of Lupeol: A Review of its Mechanisms, Clinical Applications, and Advances in Bioavailability Enhancement. Food Chem. Toxicol. 2025, 196, 115193. [Google Scholar] [CrossRef]
- Kokten, K.; Mokhtarzadeh, S.; Çaçan, E.; Kutlu, M.; Özdemir, S.; Uçar, R.; Ekmekci, M. Fatty Acid Composition of Stems, Leaves, Flowers, and Seeds of Some Medicinal Plants. Riv. Ital. Sostanze Grasse 2023, 100, 103–108. [Google Scholar]
- Podell, S.; Gribskov, M. Predicting N-Terminal Myristoylation Sites in Plant Proteins. BMC Genom. 2004, 5, 37. [Google Scholar] [CrossRef] [PubMed]
- Hamrouni, H.; Othman, K.B.; Benmoussa, H.; Idoudi, S.; Najjaa, H.; Neffati, M.; Elfalleh, W. Chemical Composition and Diversity in Medicinal Plants. Chem. Biodivers. 2023, 20, e202300265. [Google Scholar] [CrossRef]
- Riggs, J.W.; Rockwell, N.C.; Cavales, P.C.; Callis, J. Identification of the Plant Ribokinase and Discovery of a Role for Arabidopsis Ribokinase in Nucleoside Metabolism. J. Biol. Chem. 2016, 291, 22572–22582. [Google Scholar] [CrossRef]
- Campos-García, T.; Hernández-Soltero, M.F.; Hernández-Fernández, O.B.; Vázquez-Martínez, J.; García-Morales, S. Selenium Nanoparticles Induce Differential Shoot/Root Response of Capsicum annuum Seedlings Revealed by Non-Targeted Metabolomic Analysis. Plant Nano Biol. 2025, 11, 100139. [Google Scholar] [CrossRef]
- Li, C.-H.; Tien, H.-J.; Wen, M.-F.; Yen, H.E. Myo-Inositol Transport and Metabolism Participate in Salt Tolerance of Halophyte Ice Plant Seedlings. Physiol. Plant. 2021, 172, 1619–1629. [Google Scholar] [CrossRef]
- Cui, Y.N.; Yan, S.J.; Zhang, Y.N.; Wang, R.; Song, L.L.; Ma, Y.; Guo, H.; Yang, P.Z. Physiological, Metabolome and Gene Expression Analyses Reveal the Accumulation and Biosynthesis Pathways of Soluble Sugars and Amino Acids in Sweet Sorghum under Osmotic Stresses. Int. J. Mol. Sci. 2024, 25, 8942. [Google Scholar] [CrossRef]
- Sandeep; Ghosh, S. Chapter 12—Triterpenoids: Structural Diversity, Biosynthetic Pathway, and Bioactivity. In Studies in Natural Products Chemistry, 2nd ed.; Atta-ur-Rahman, A., Ed.; Elsevier: Amsterdam, The Netherlands, 2020; Volume 67, pp. 411–461. [Google Scholar] [CrossRef]
- Kurzfeld-Zexer, L.; Inbar, M. Gall-Forming Aphids Are Protected (and Benefit) from Defoliating Caterpillars: The Role of Plant-Mediated Mechanisms. BMC Ecol. Evol. 2021, 21, 124. [Google Scholar] [CrossRef]
- Parra-Rivero, O.; Barros, M.P.; Prado, M.D.M.; Gil, J.V.; Hornero-Méndez, D.; Zacarías, L.; Rodrigo, M.J.; Limón, M.C.; Avalos, J. Neurosporaxanthin Overproduction by Fusarium fujikuroi and Evaluation of Its Antioxidant Properties. Antioxidants 2020, 9, 528. [Google Scholar] [CrossRef]
- Sandmann, G. Antioxidant Protection from UV- and Light-Stress Related to Carotenoid Structures. Antioxidants 2019, 8, 219. [Google Scholar] [CrossRef]
- Wrońska, N.; Szlaur, M.; Zawadzka, K.; Lisowska, K. The Synergistic Effect of Triterpenoids and Flavonoids—New Approaches for Treating Bacterial Infections? Molecules 2022, 27, 847. [Google Scholar] [CrossRef] [PubMed]
- Czerniewicz, P.; Sytykiewicz, H.; Durak, R.; Borowiak-Sobkowiak, B.; Chrzanowski, G. Role of Phenolic Compounds During Antioxidative Responses of Winter Triticale to Aphid and Beetle Attack. Plant Physiol. Biochem. 2017, 118, 529–540. [Google Scholar] [CrossRef] [PubMed]
- Bedetti, C.S.; Modolo, L.V.; Isaias, R.M.S. The Role of Phenolics in the Control of Auxin in galls of Piptadenia gonoacantha (Mart.) MacBr (Fabaceae: Mimosoideae). Biochem. Syst. Ecol. 2014, 55, 53–59. [Google Scholar] [CrossRef]
- Kumar, S.; Abedin, M.M.; Singh, A.K.; Das, S. Role of Phenolic Compounds in Plant-Defensive Mechanisms. In Plant Phenolics in Sustainable Agriculture; Lone, R., Shuab, R., Kamili, A., Eds.; Springer: Singapore, 2020. [Google Scholar] [CrossRef]
- Ferreira, B.G.; Oliveira, D.C.; Moreira, A.S.; Faria, A.P.; Guedes, L.M.; França, M.G.; Álvarez, R.; Isaias, R.M. Antioxidant Metabolism in Galls Due to the Extended Phenotypes of the Associated Organisms. PLoS ONE 2018, 13, e0205364. [Google Scholar] [CrossRef]
- Bae, J.; Kim, N.; Shin, Y.; Kim, S.-Y.; Kim, Y.-J. Activity of Catechins and Their Applications. Biomed. Dermatol. 2020, 4, 8. [Google Scholar] [CrossRef]
- Gandhi, G.R.; Vasconcelos, A.B.S.; Antony, P.J.; Montalvão, M.M.; de Franca, M.N.F.; Hillary, V.E.; Ceasar, S.A.; Liu, D. Natural Sources, Biosynthesis, Biological Functions, and Molecular Mechanisms of Shikimic Acid and Its Derivatives. Asian Pac. J. Trop. Biomed. 2023, 13, 139–147. [Google Scholar] [CrossRef]
- Nahum, S.; Inbar, M.; Ne’eman, G.; Ben-Shlomo, R. Phenotypic Plasticity and Gene Diversity in Pistacia lentiscus L. Along Environmental Gradients in Israel. Tree Genet. Genomes 2008, 4, 777–785. [Google Scholar] [CrossRef]
- Schultz, J.C.; Edger, P.P.; Body, M.J.; Appel, H.M.A. Galling Insect Activates Plant Reproductive Programs During Gall Development. Sci. Rep. 2019, 9, 1833. [Google Scholar] [CrossRef]
- Álvarez, R.; Martinez, J.J.; Muñoz-Viveros, A.L.; Molist, P.; Abad-González, J.; Nieto Nafría, J.M. Contribution of Gall Microscopic Structure to Taxonomy of Gallicolous Aphids on Pistacia. Plant Biol. 2016, 18, 868–875. [Google Scholar] [CrossRef]
- Batovska, D.; Inbar, M. Beyond the Nut: Pistacia Leaves as Natural Food Preservatives. Foods 2024, 13, 3138. [Google Scholar] [CrossRef]
- NIST08; NIST Standard Reference Database 1A: NIST/EPA/NIH Mass Spectral Library (NIST 08) and NIST Mass Spectral Search Program (Version 20f) Manual. US Department of Commerce, National Institute of Standards and Technology: Gaithersburg, MD, USA, 2008.
- Hummel, J.; Strehmel, N.; Selbig, J.; Walther, D.; Kopka, J. Decision Tree-Supported Substructure Prediction of Metabolites from GC-MS Profiles. J. Metabolomics 2010, 6, 322–333. [Google Scholar] [CrossRef] [PubMed]
- Dincheva, I.; Badjakov, I.; Georgiev, V.; Semerdjieva, I.; Vrancheva, R.; Ivanov, I.; Pavlov, A. Comprehensive GC-MS Characterization and Histochemical Assessment of Various Parts of Three Colchicum Species from Bulgarian Flora. Plants 2025, 14, 270. [Google Scholar] [CrossRef] [PubMed]


| Sample | Mean of Ranks | Groups | ||
|---|---|---|---|---|
| T2G | 252.212 | A | ||
| T3B | 266.144 | A | B | |
| T3G | 295.288 | A | B | C |
| T3L | 322.763 | A | B | C |
| T1G | 326.322 | A | B | C |
| T2L | 365.864 | A | B | C |
| T2P | 386.814 | B | C | |
| T2B | 393.254 | C | ||
| T1B | 401.424 | C | ||
| T1P | 412.407 | C | ||
| T1L | 415.186 | C | ||
| T3P | 416.322 | C | ||
Disclaimer/Publisher’s Note: The statements, opinions and data contained in all publications are solely those of the individual author(s) and contributor(s) and not of MDPI and/or the editor(s). MDPI and/or the editor(s) disclaim responsibility for any injury to people or property resulting from any ideas, methods, instructions or products referred to in the content. |
© 2025 by the authors. Licensee MDPI, Basel, Switzerland. This article is an open access article distributed under the terms and conditions of the Creative Commons Attribution (CC BY) license (https://creativecommons.org/licenses/by/4.0/).
Share and Cite
Batovska, D.; Chakarova, M.; Dines, M.; Dincheva, I.; Badjakov, I.; Inbar, M. Association Between Gall Structural and Metabolic Complexity: Evidence from Pistacia palaestina. Plants 2025, 14, 721. https://doi.org/10.3390/plants14050721
Batovska D, Chakarova M, Dines M, Dincheva I, Badjakov I, Inbar M. Association Between Gall Structural and Metabolic Complexity: Evidence from Pistacia palaestina. Plants. 2025; 14(5):721. https://doi.org/10.3390/plants14050721
Chicago/Turabian StyleBatovska, Daniela, Mirena Chakarova, Monica Dines, Ivayla Dincheva, Ilian Badjakov, and Moshe Inbar. 2025. "Association Between Gall Structural and Metabolic Complexity: Evidence from Pistacia palaestina" Plants 14, no. 5: 721. https://doi.org/10.3390/plants14050721
APA StyleBatovska, D., Chakarova, M., Dines, M., Dincheva, I., Badjakov, I., & Inbar, M. (2025). Association Between Gall Structural and Metabolic Complexity: Evidence from Pistacia palaestina. Plants, 14(5), 721. https://doi.org/10.3390/plants14050721