
Impact of Climate and Soil on Plant Dynamics and Ecosystem Stability in Argan Orchards

 , , , and
Abstract
1. Introduction
2. Materials and Methods
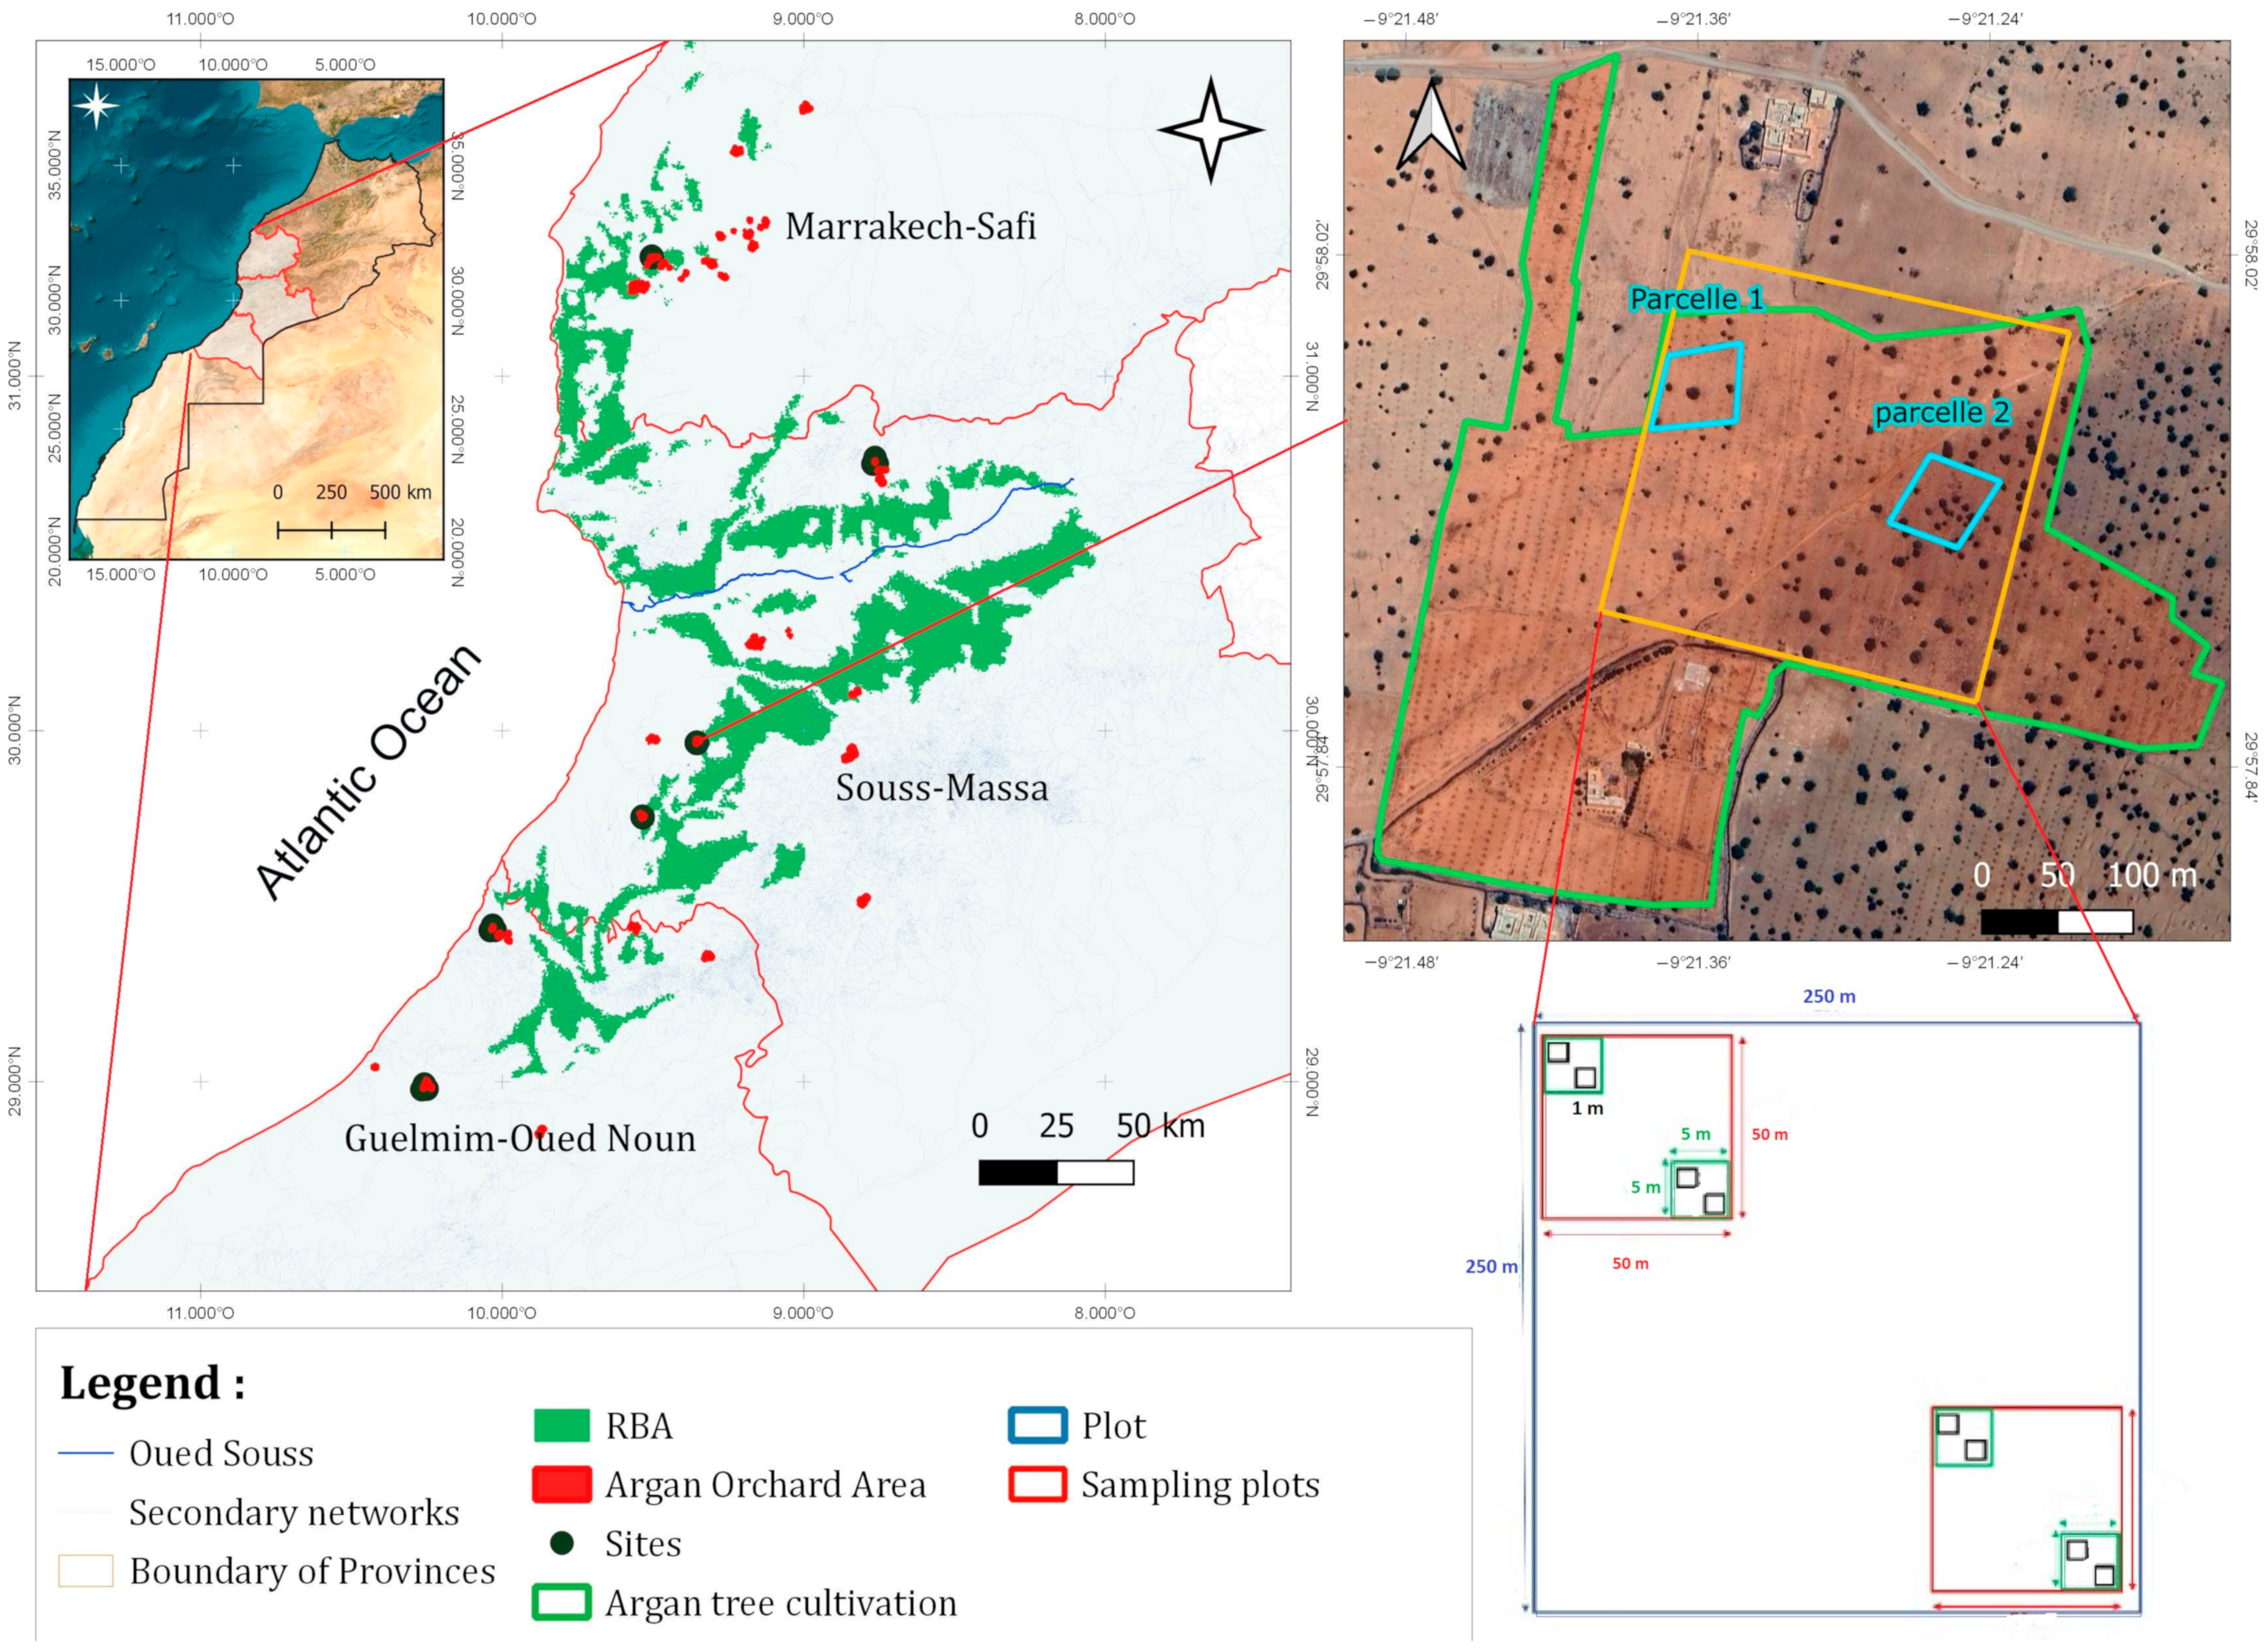
2.1. Study Site
2.2. Experimental Design
2.3. Plant Diversity and Vegetation Analysis
2.4. Stand Structural Indices: Diversity Analysis
2.4.1. α-Diversity
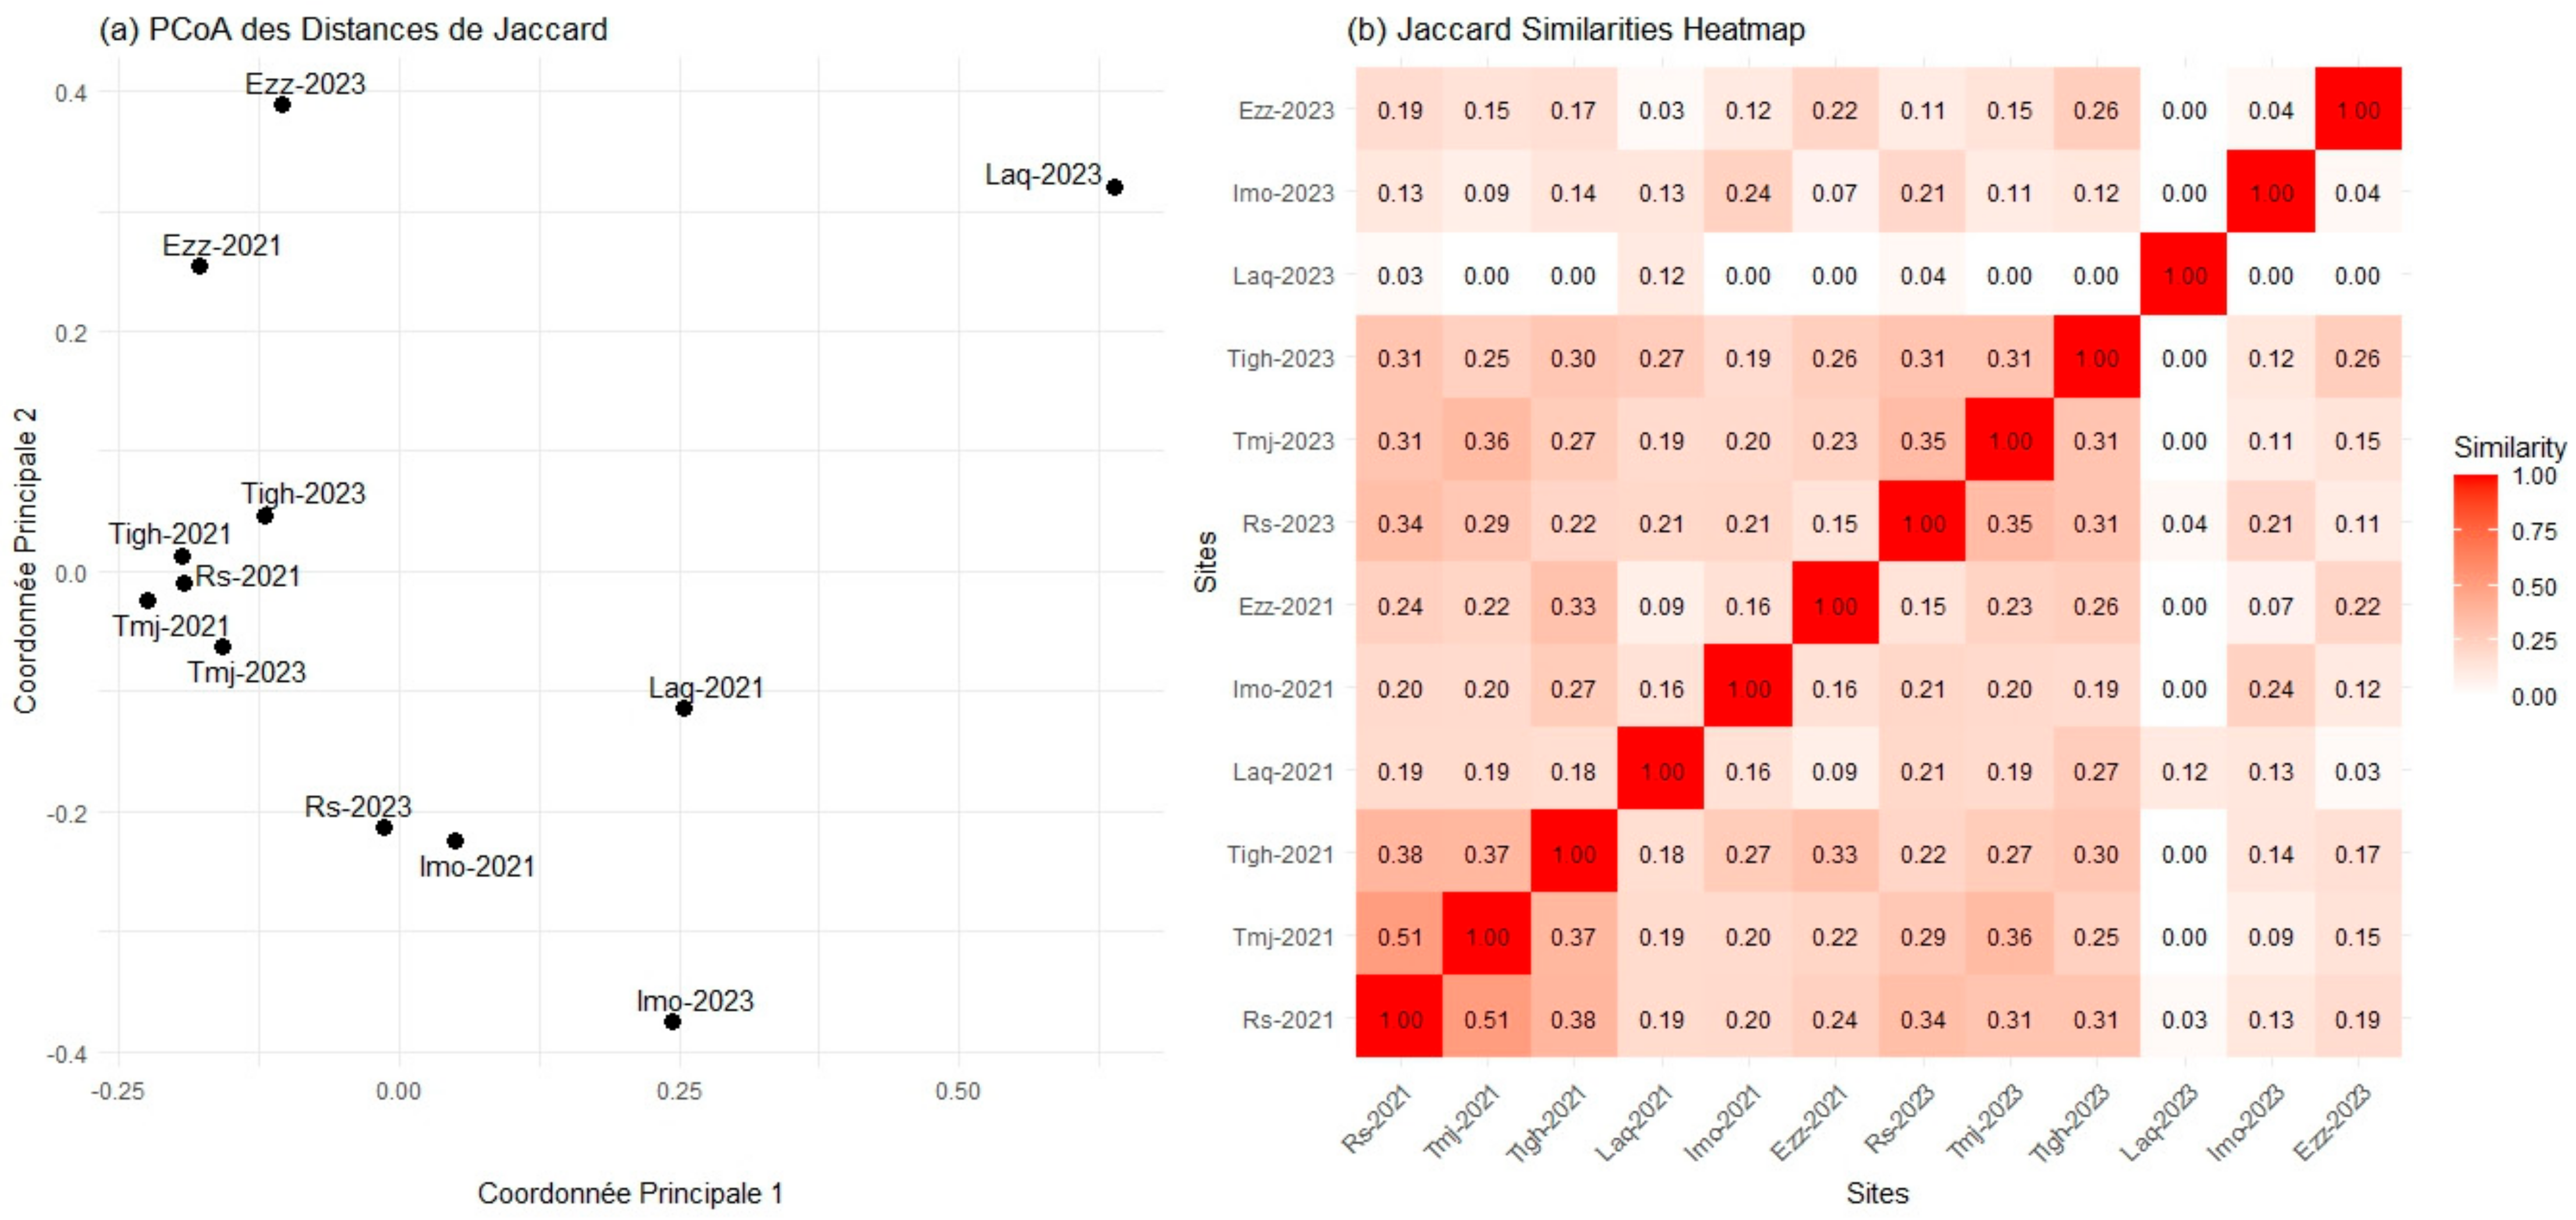
2.4.2. β-Diversity
2.4.3. Structural Diversity Analysis
2.5. Soil Sampling and Analyses
2.6. Climate Data Analysis
2.7. Data Analyses
3. Results
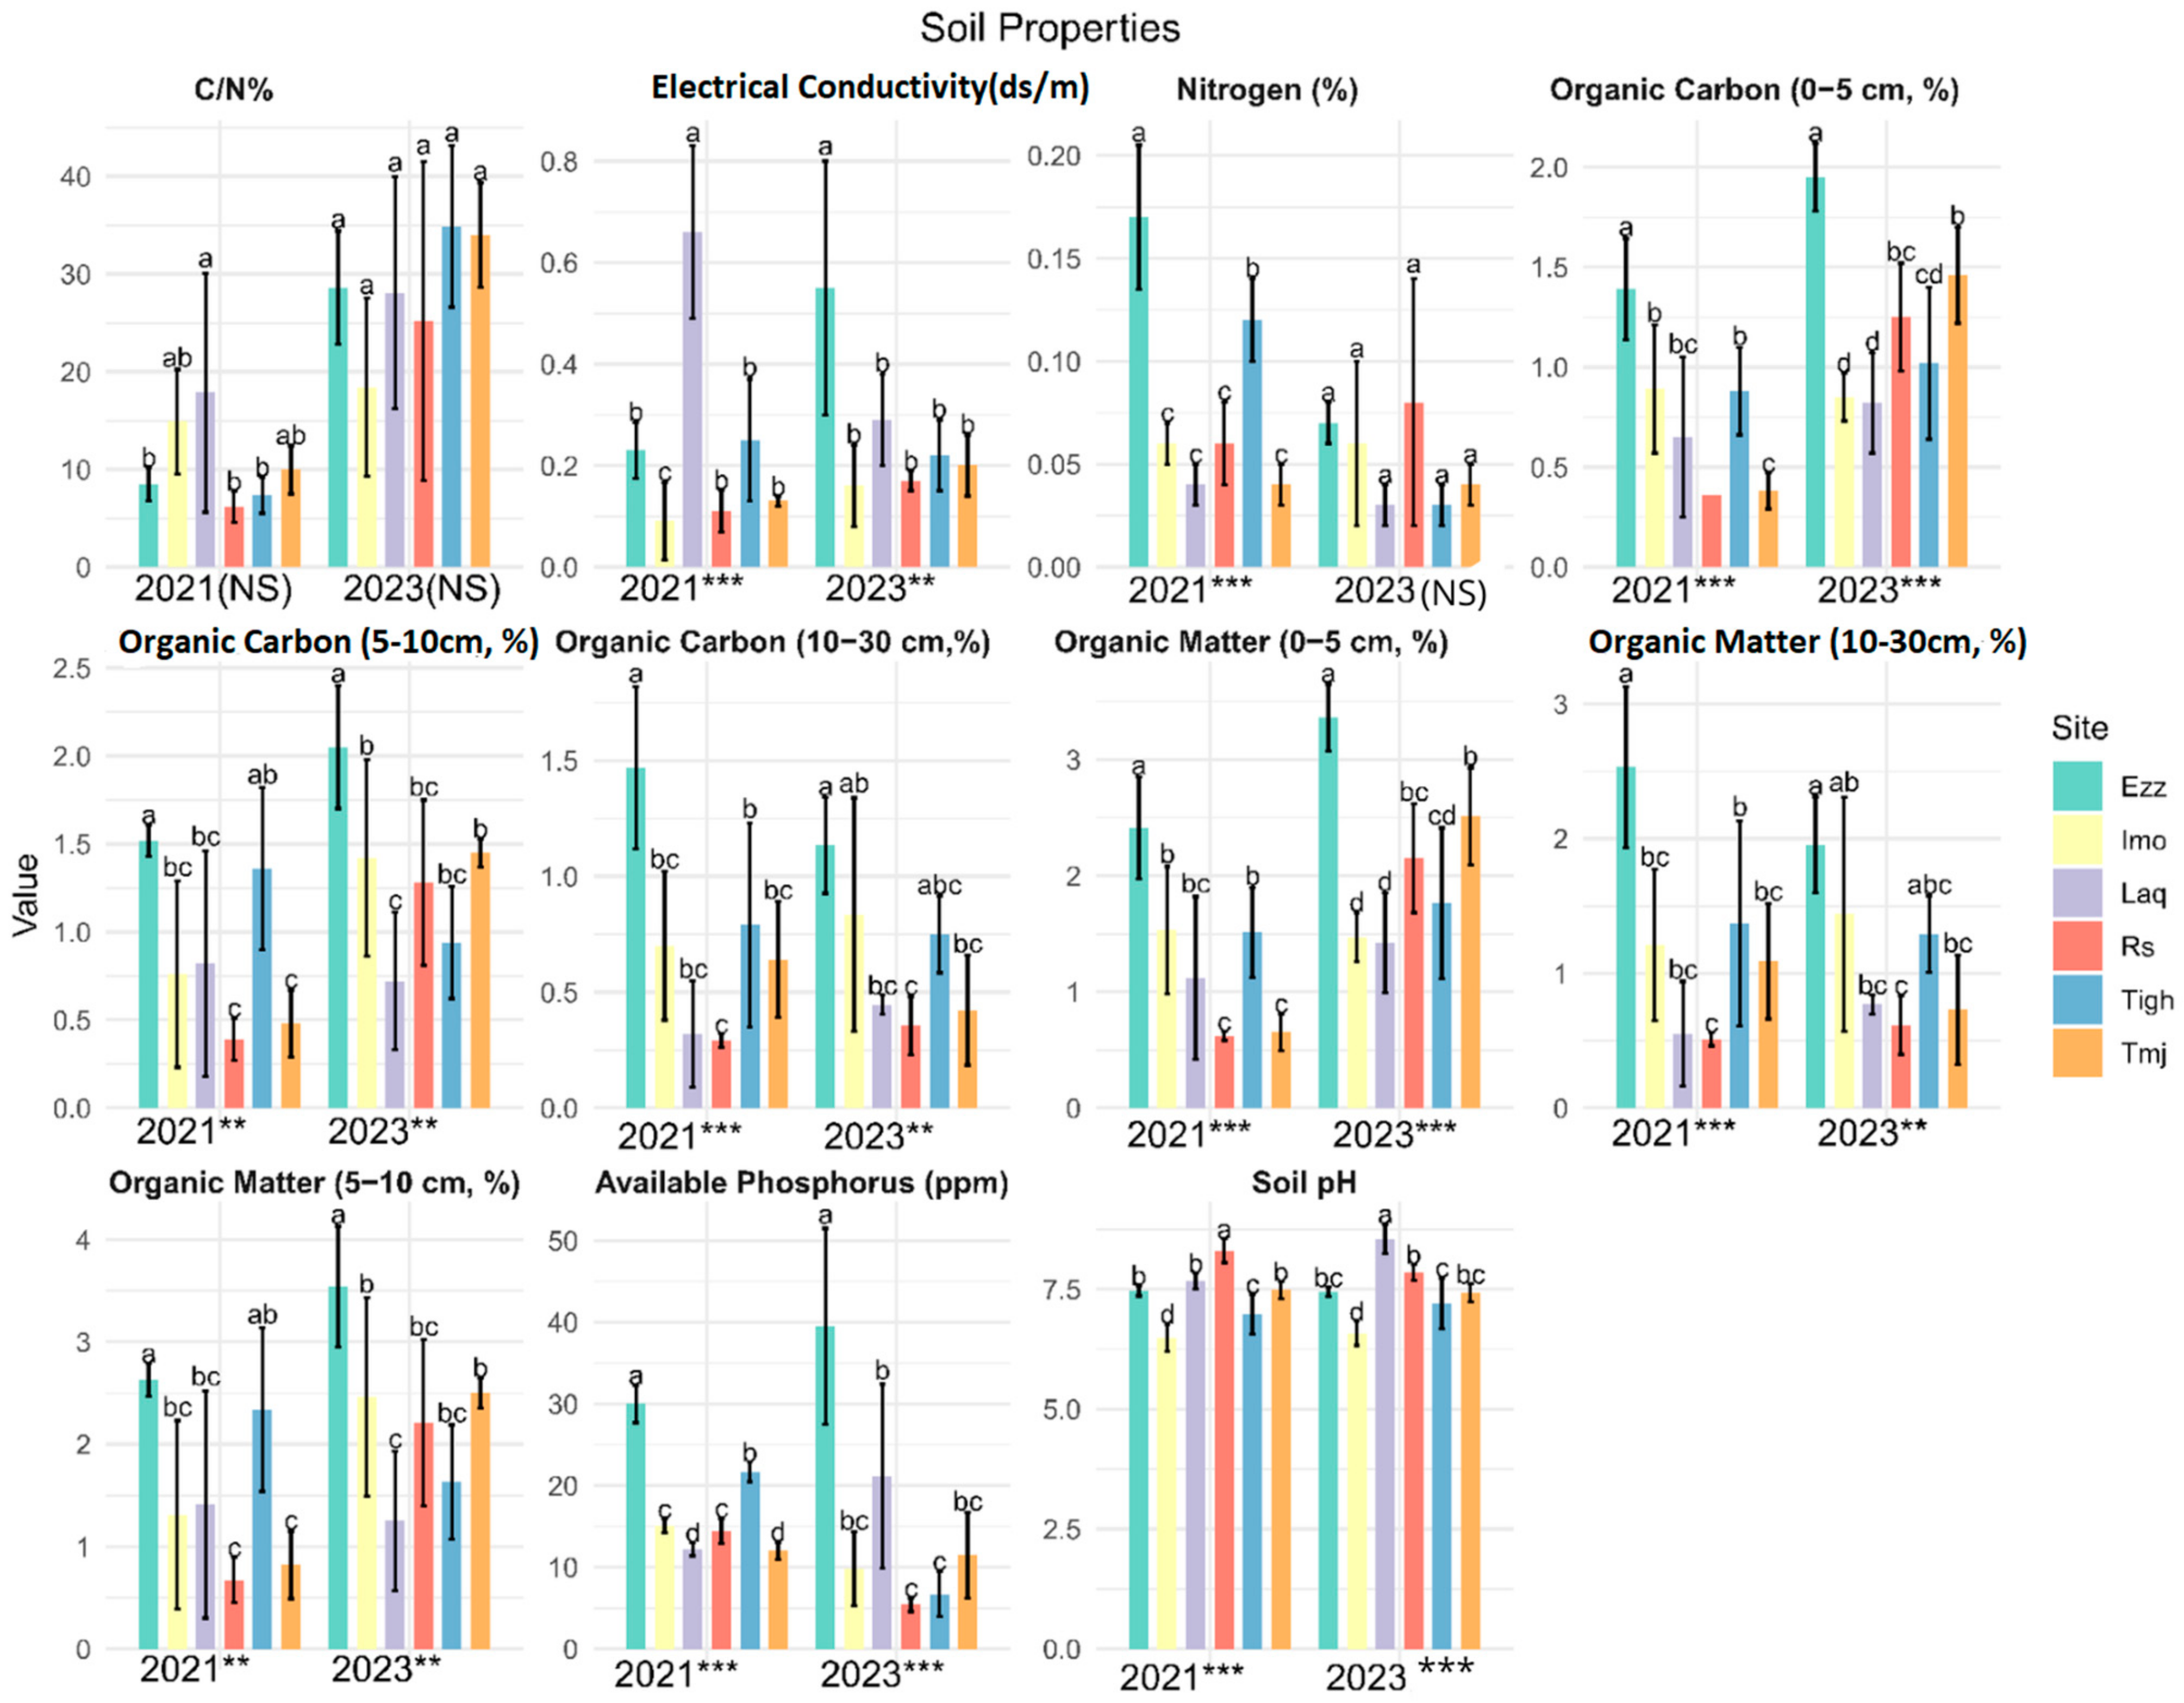
3.1. Comparison of Soil Physiochemical Properties in Different Orchards
3.1.1. Comparison of Soil Physiochemical Properties in Different Sites for Each Year: Effect of Site
3.1.2. Comparison of Soil Physiochemical Properties in Different Orchards in Each Site: Effect Year
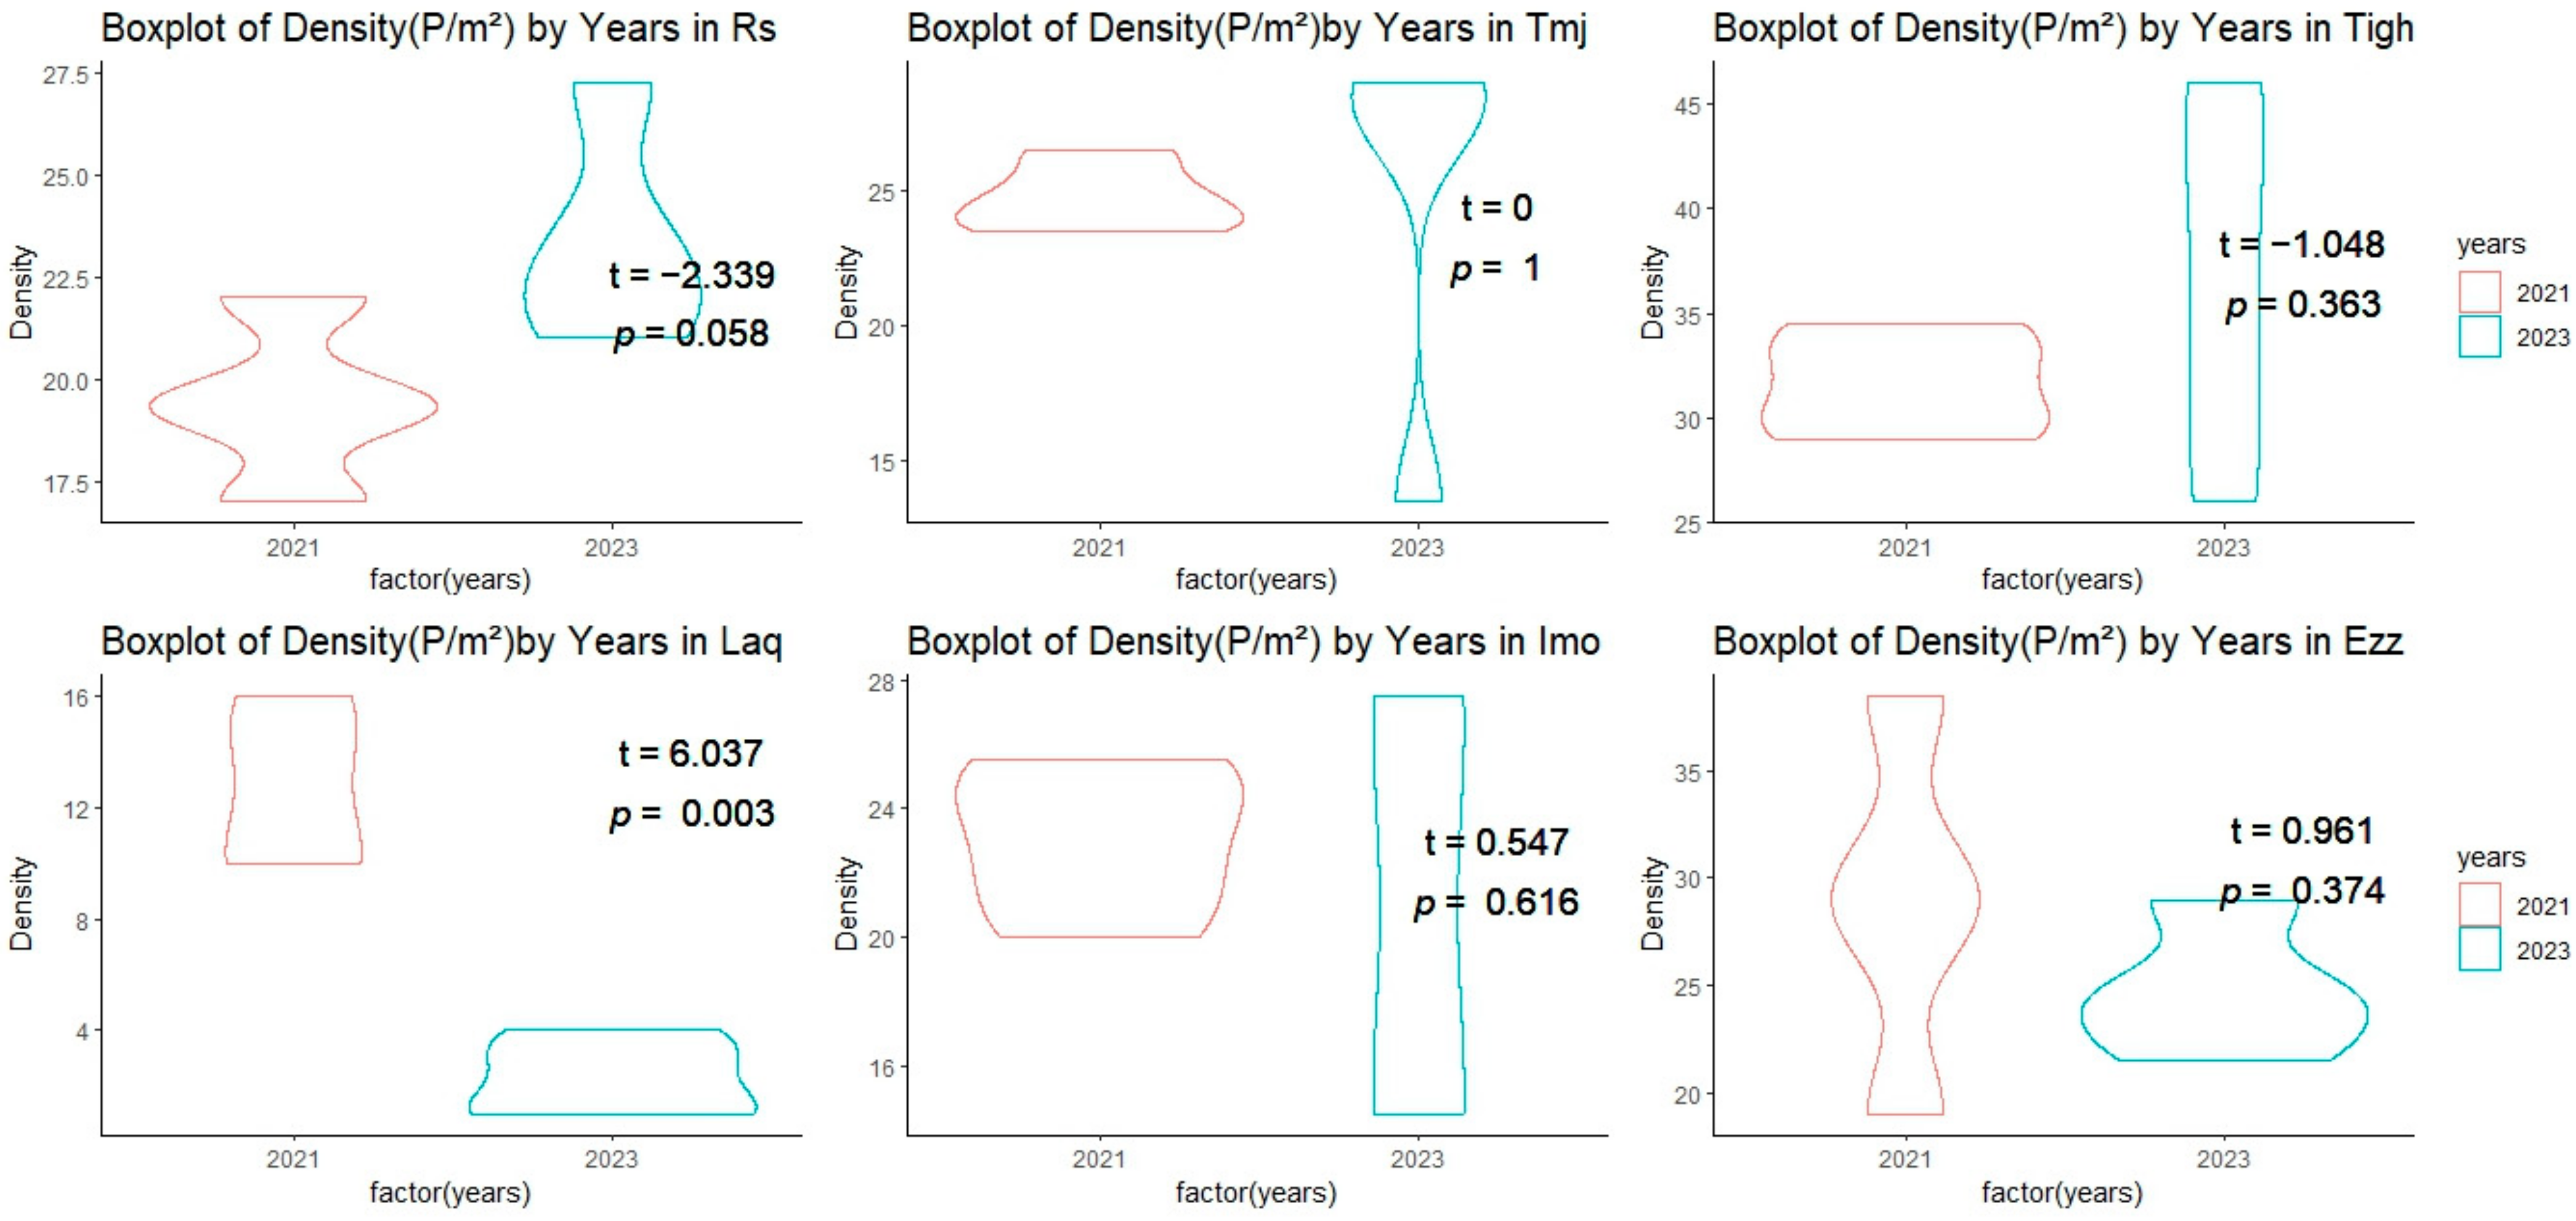
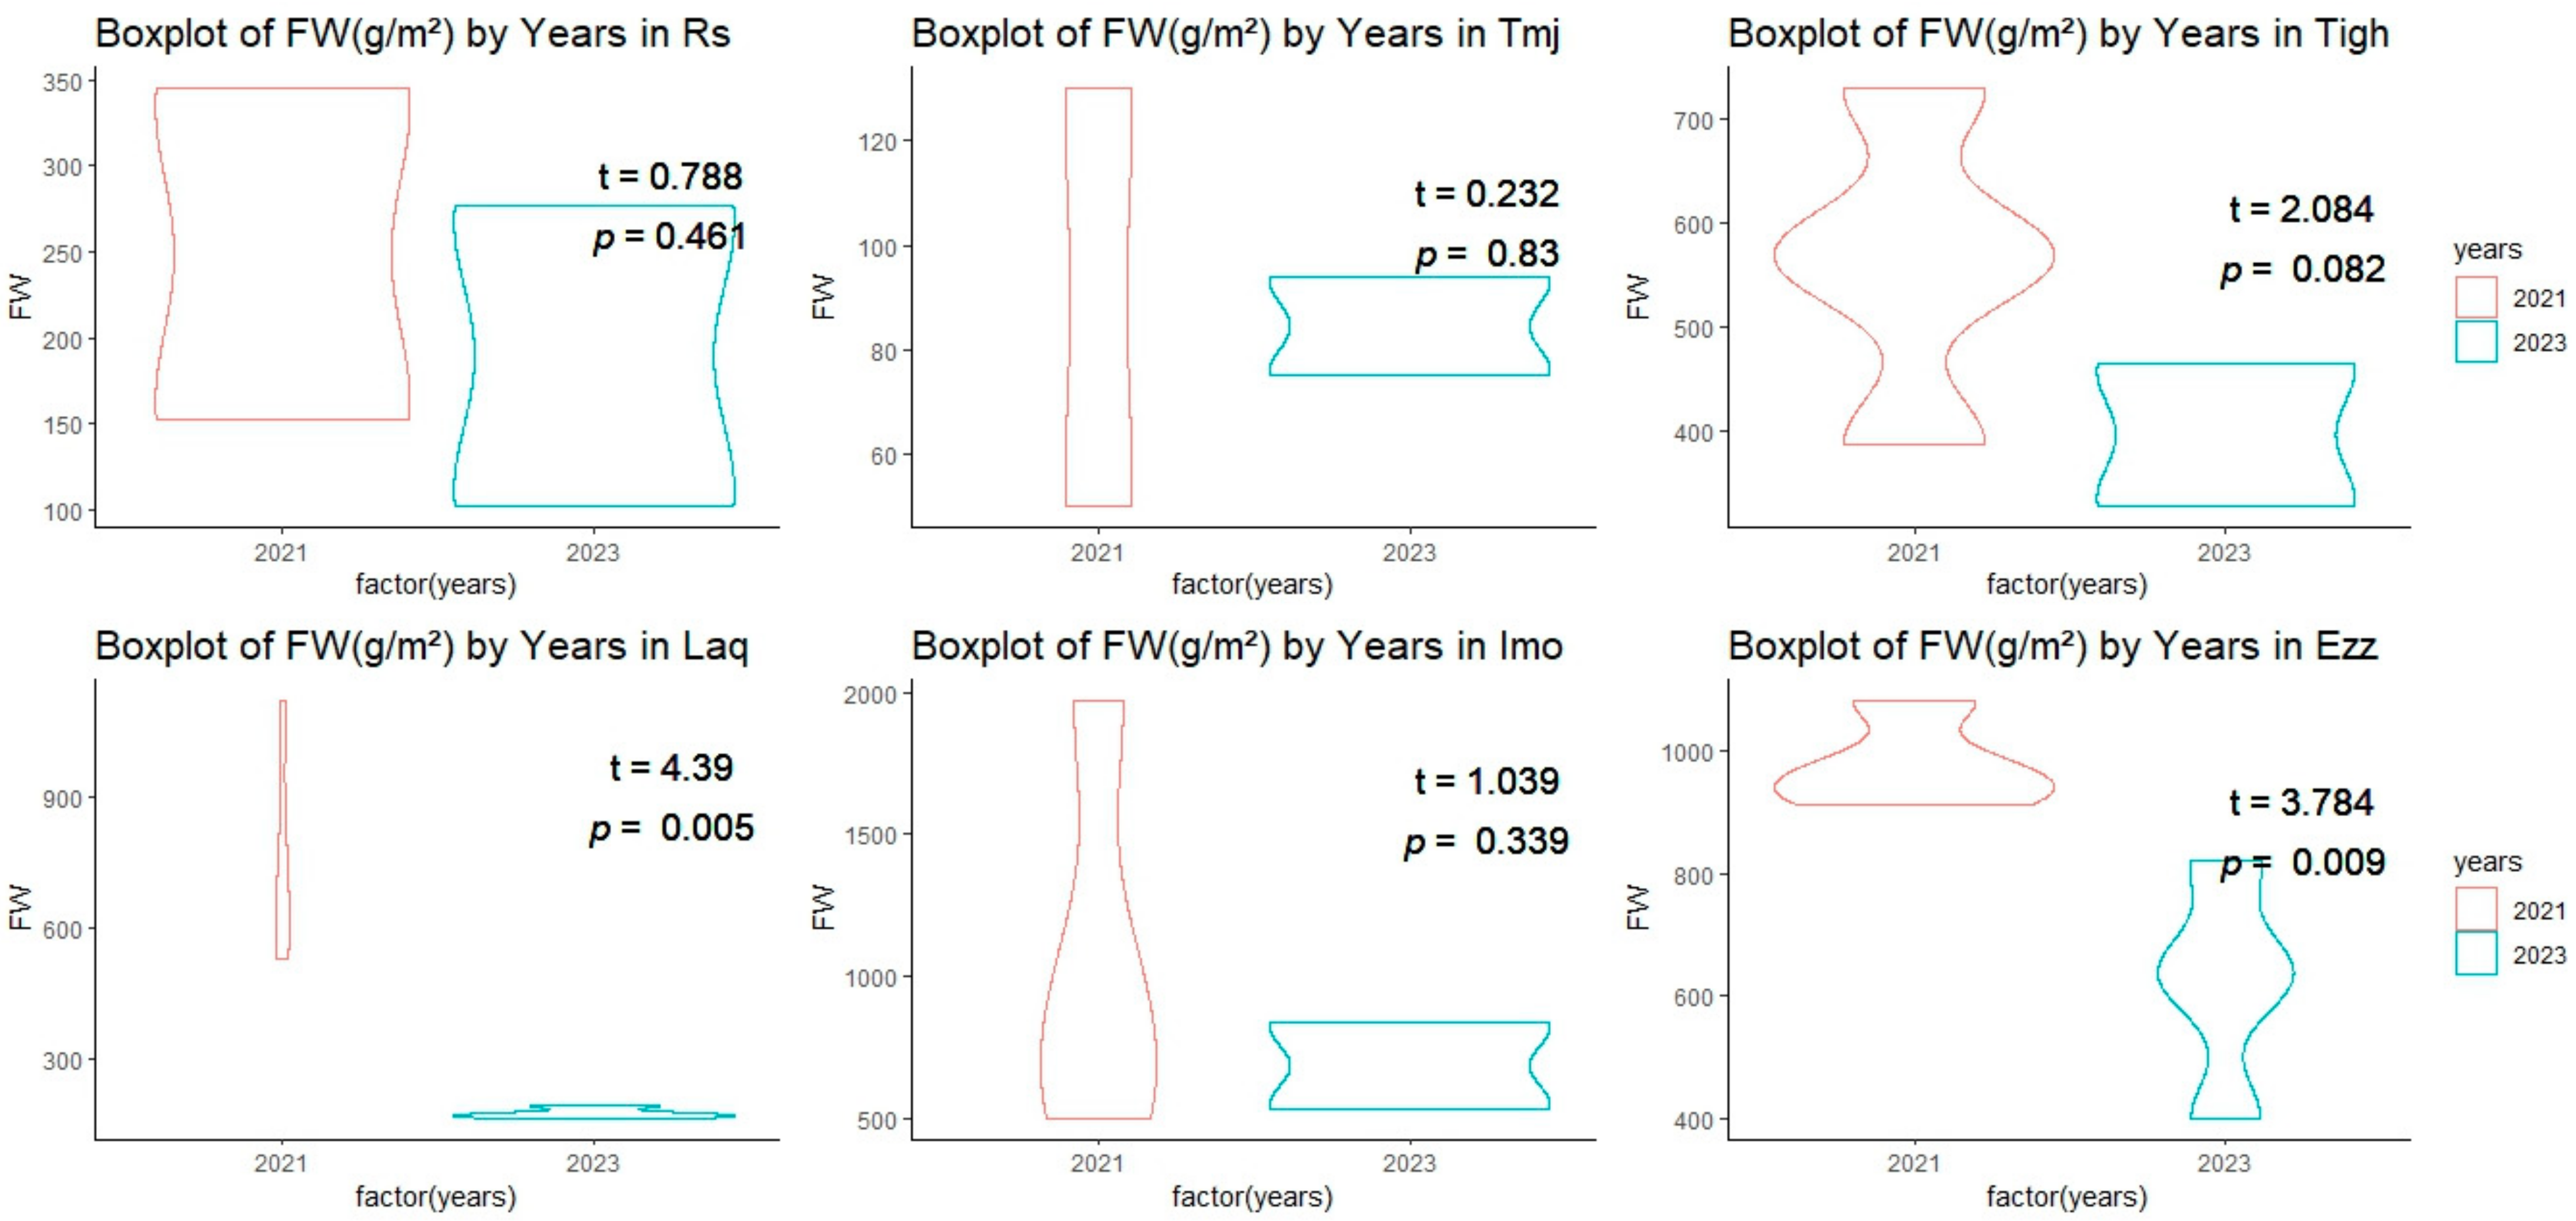
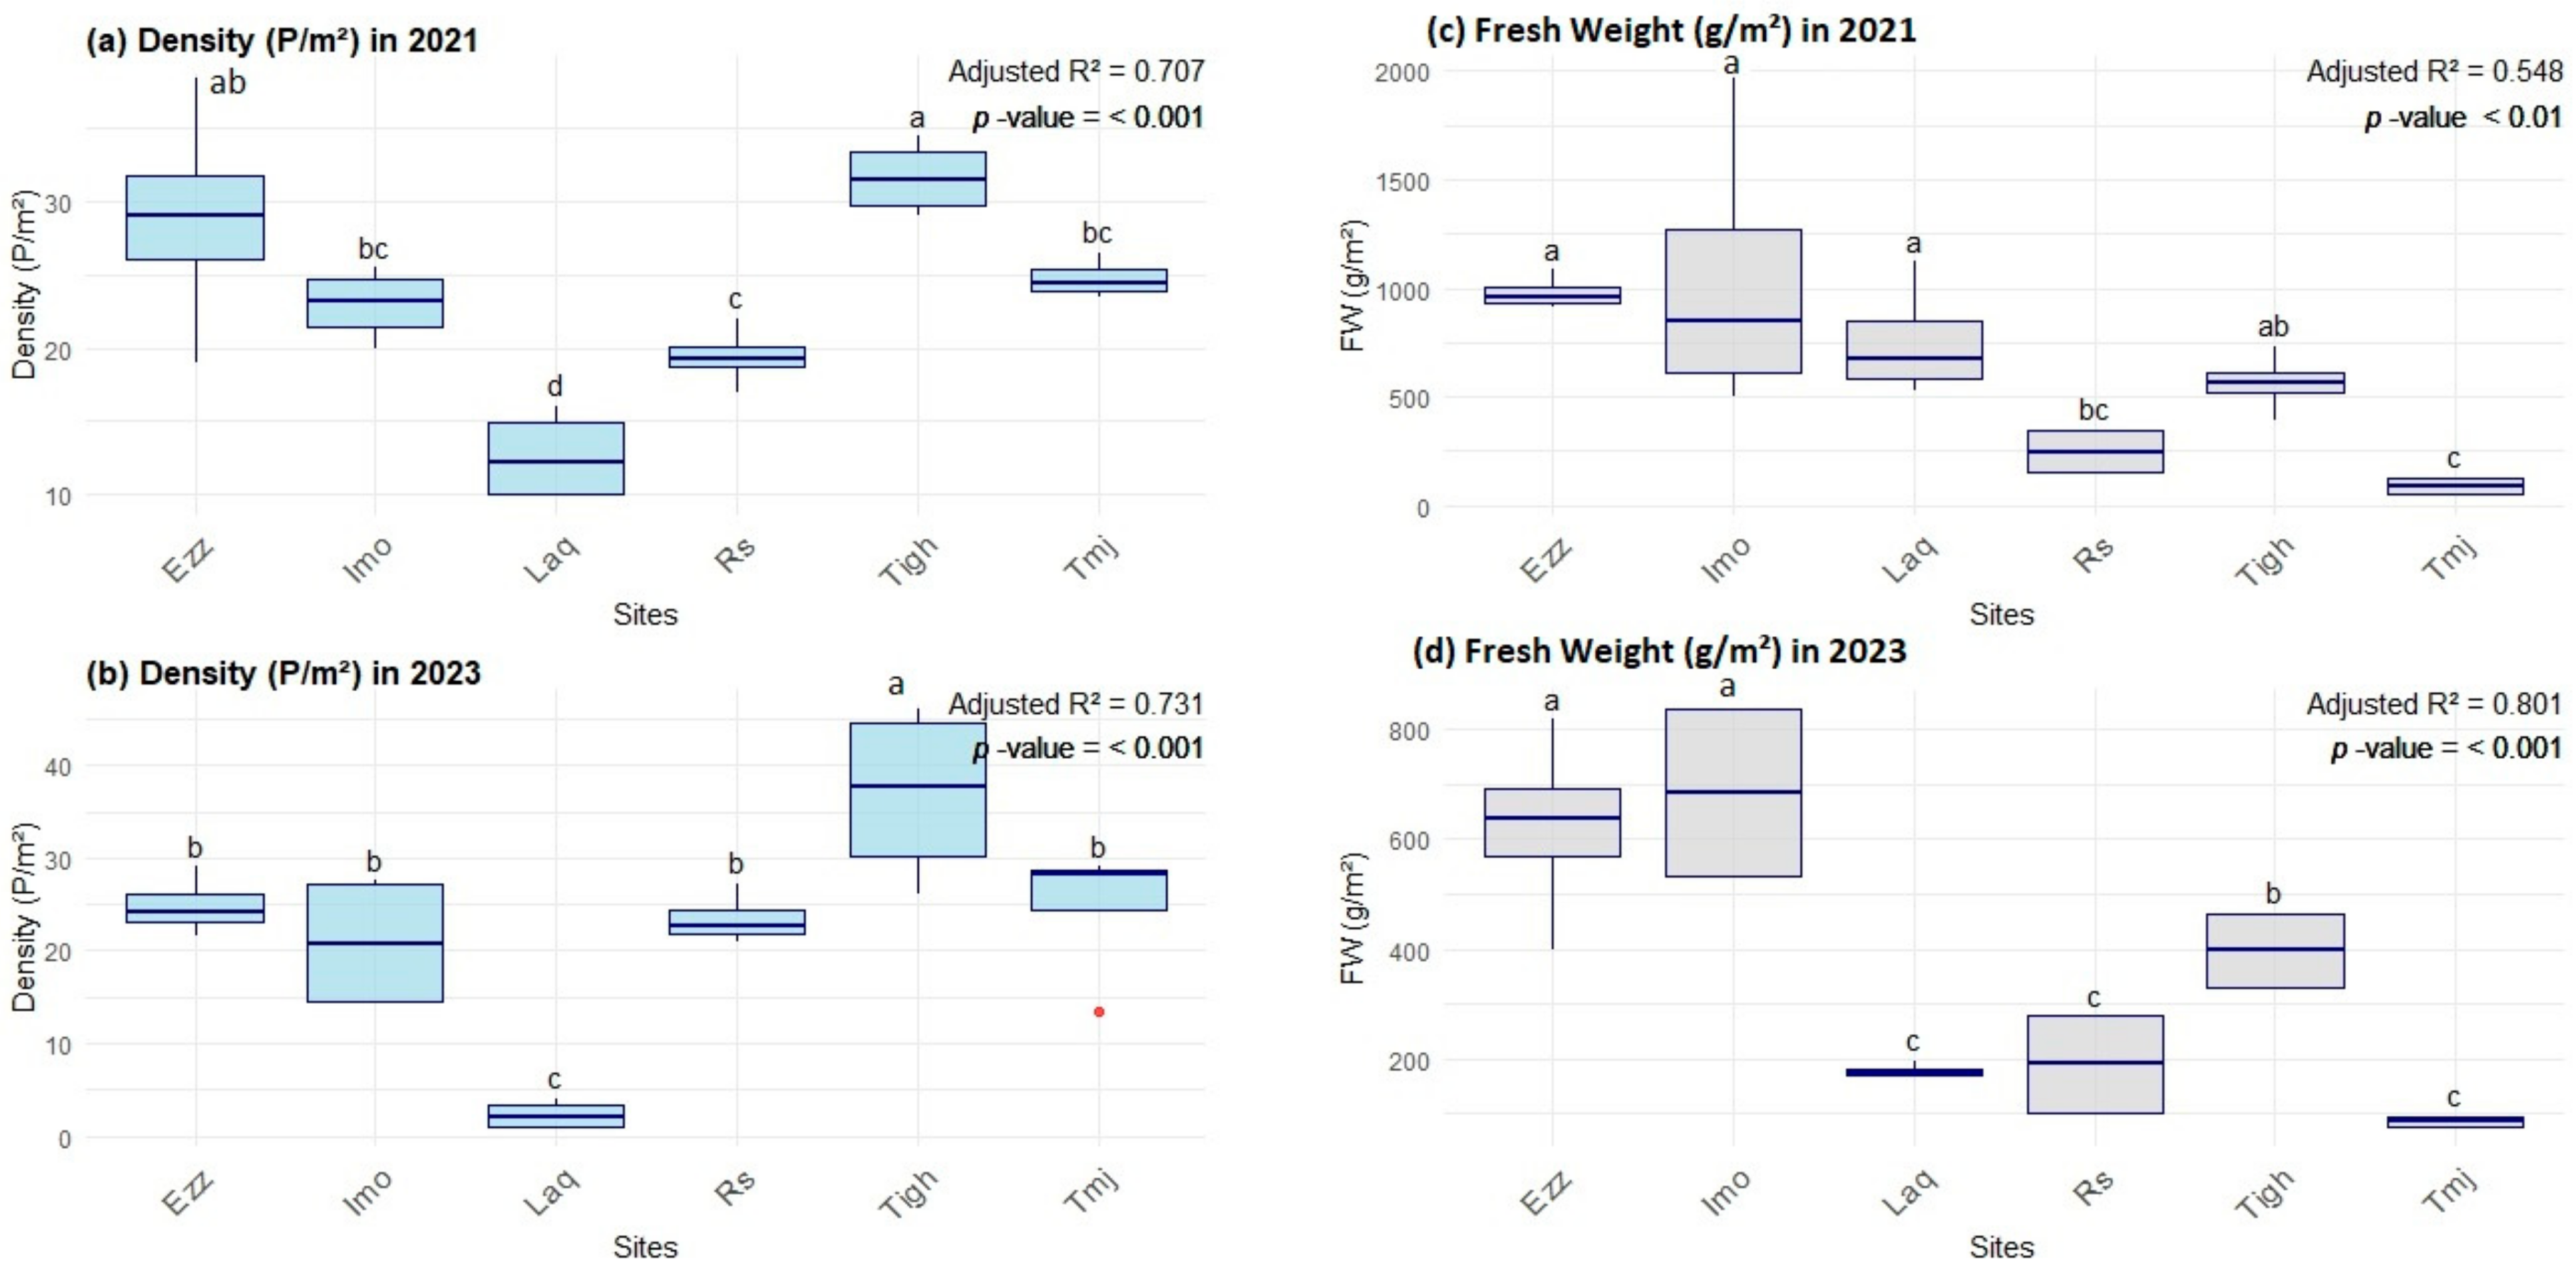
3.2. Comparison of Structural Features
3.2.1. Inter-Group Comparisons of Structural Features at Each Site
3.2.2. Intra-Group Comparisons of Structural Features in Each Year
3.2.3. Effect of Density on Fresh Weight in Plant Density Is Strongly Associated
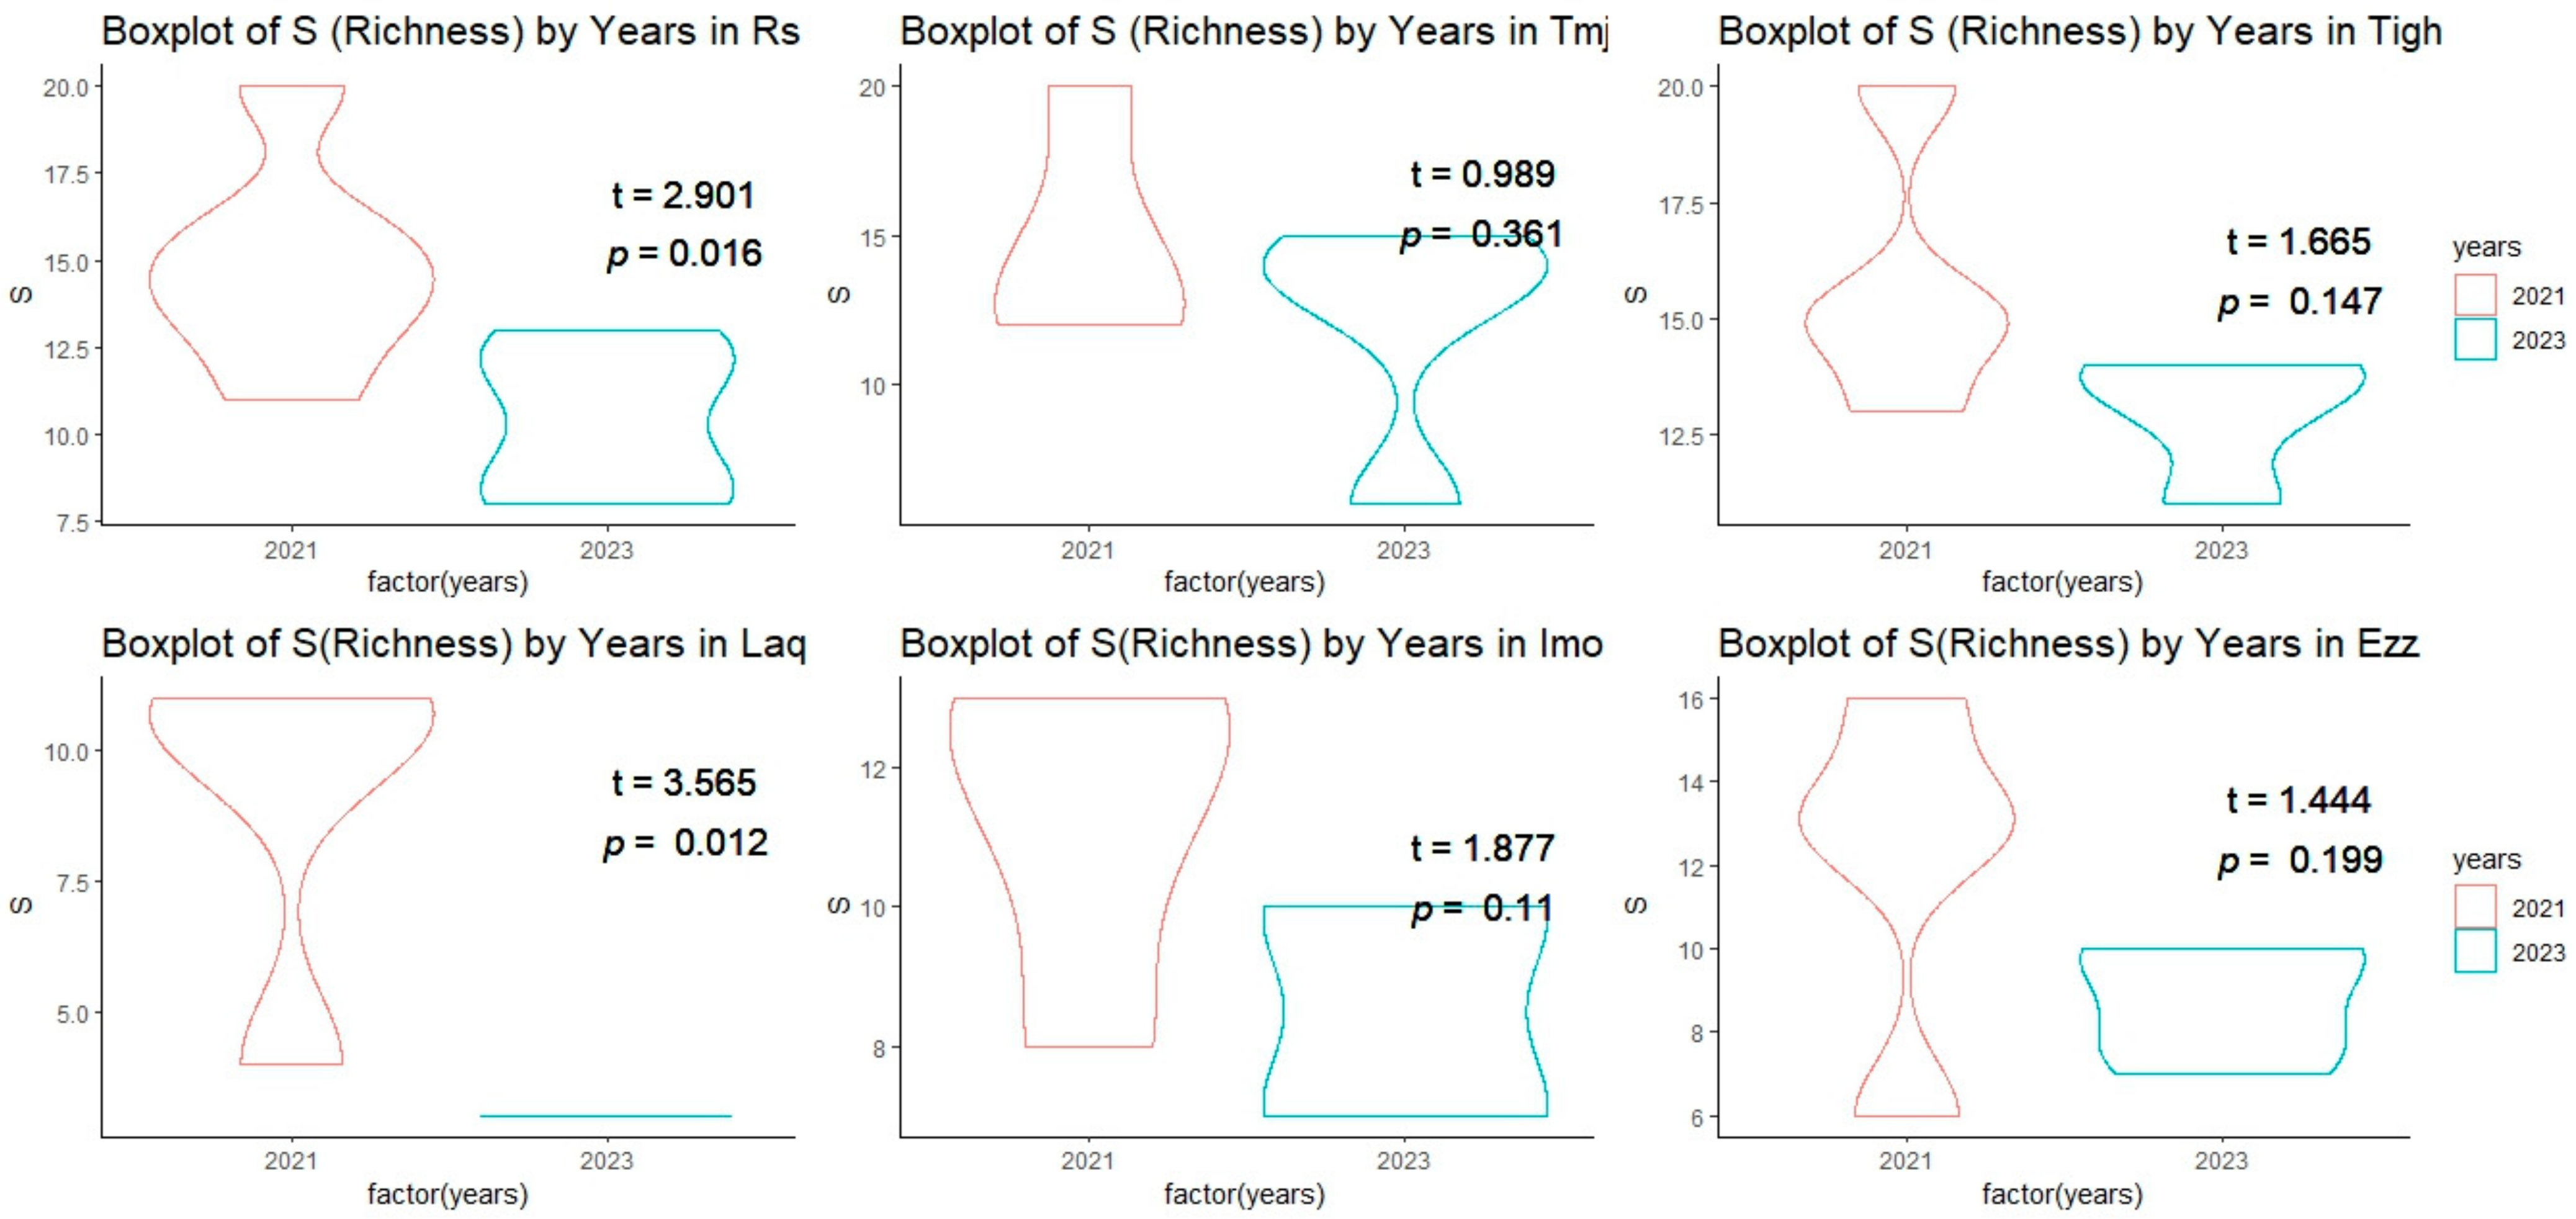
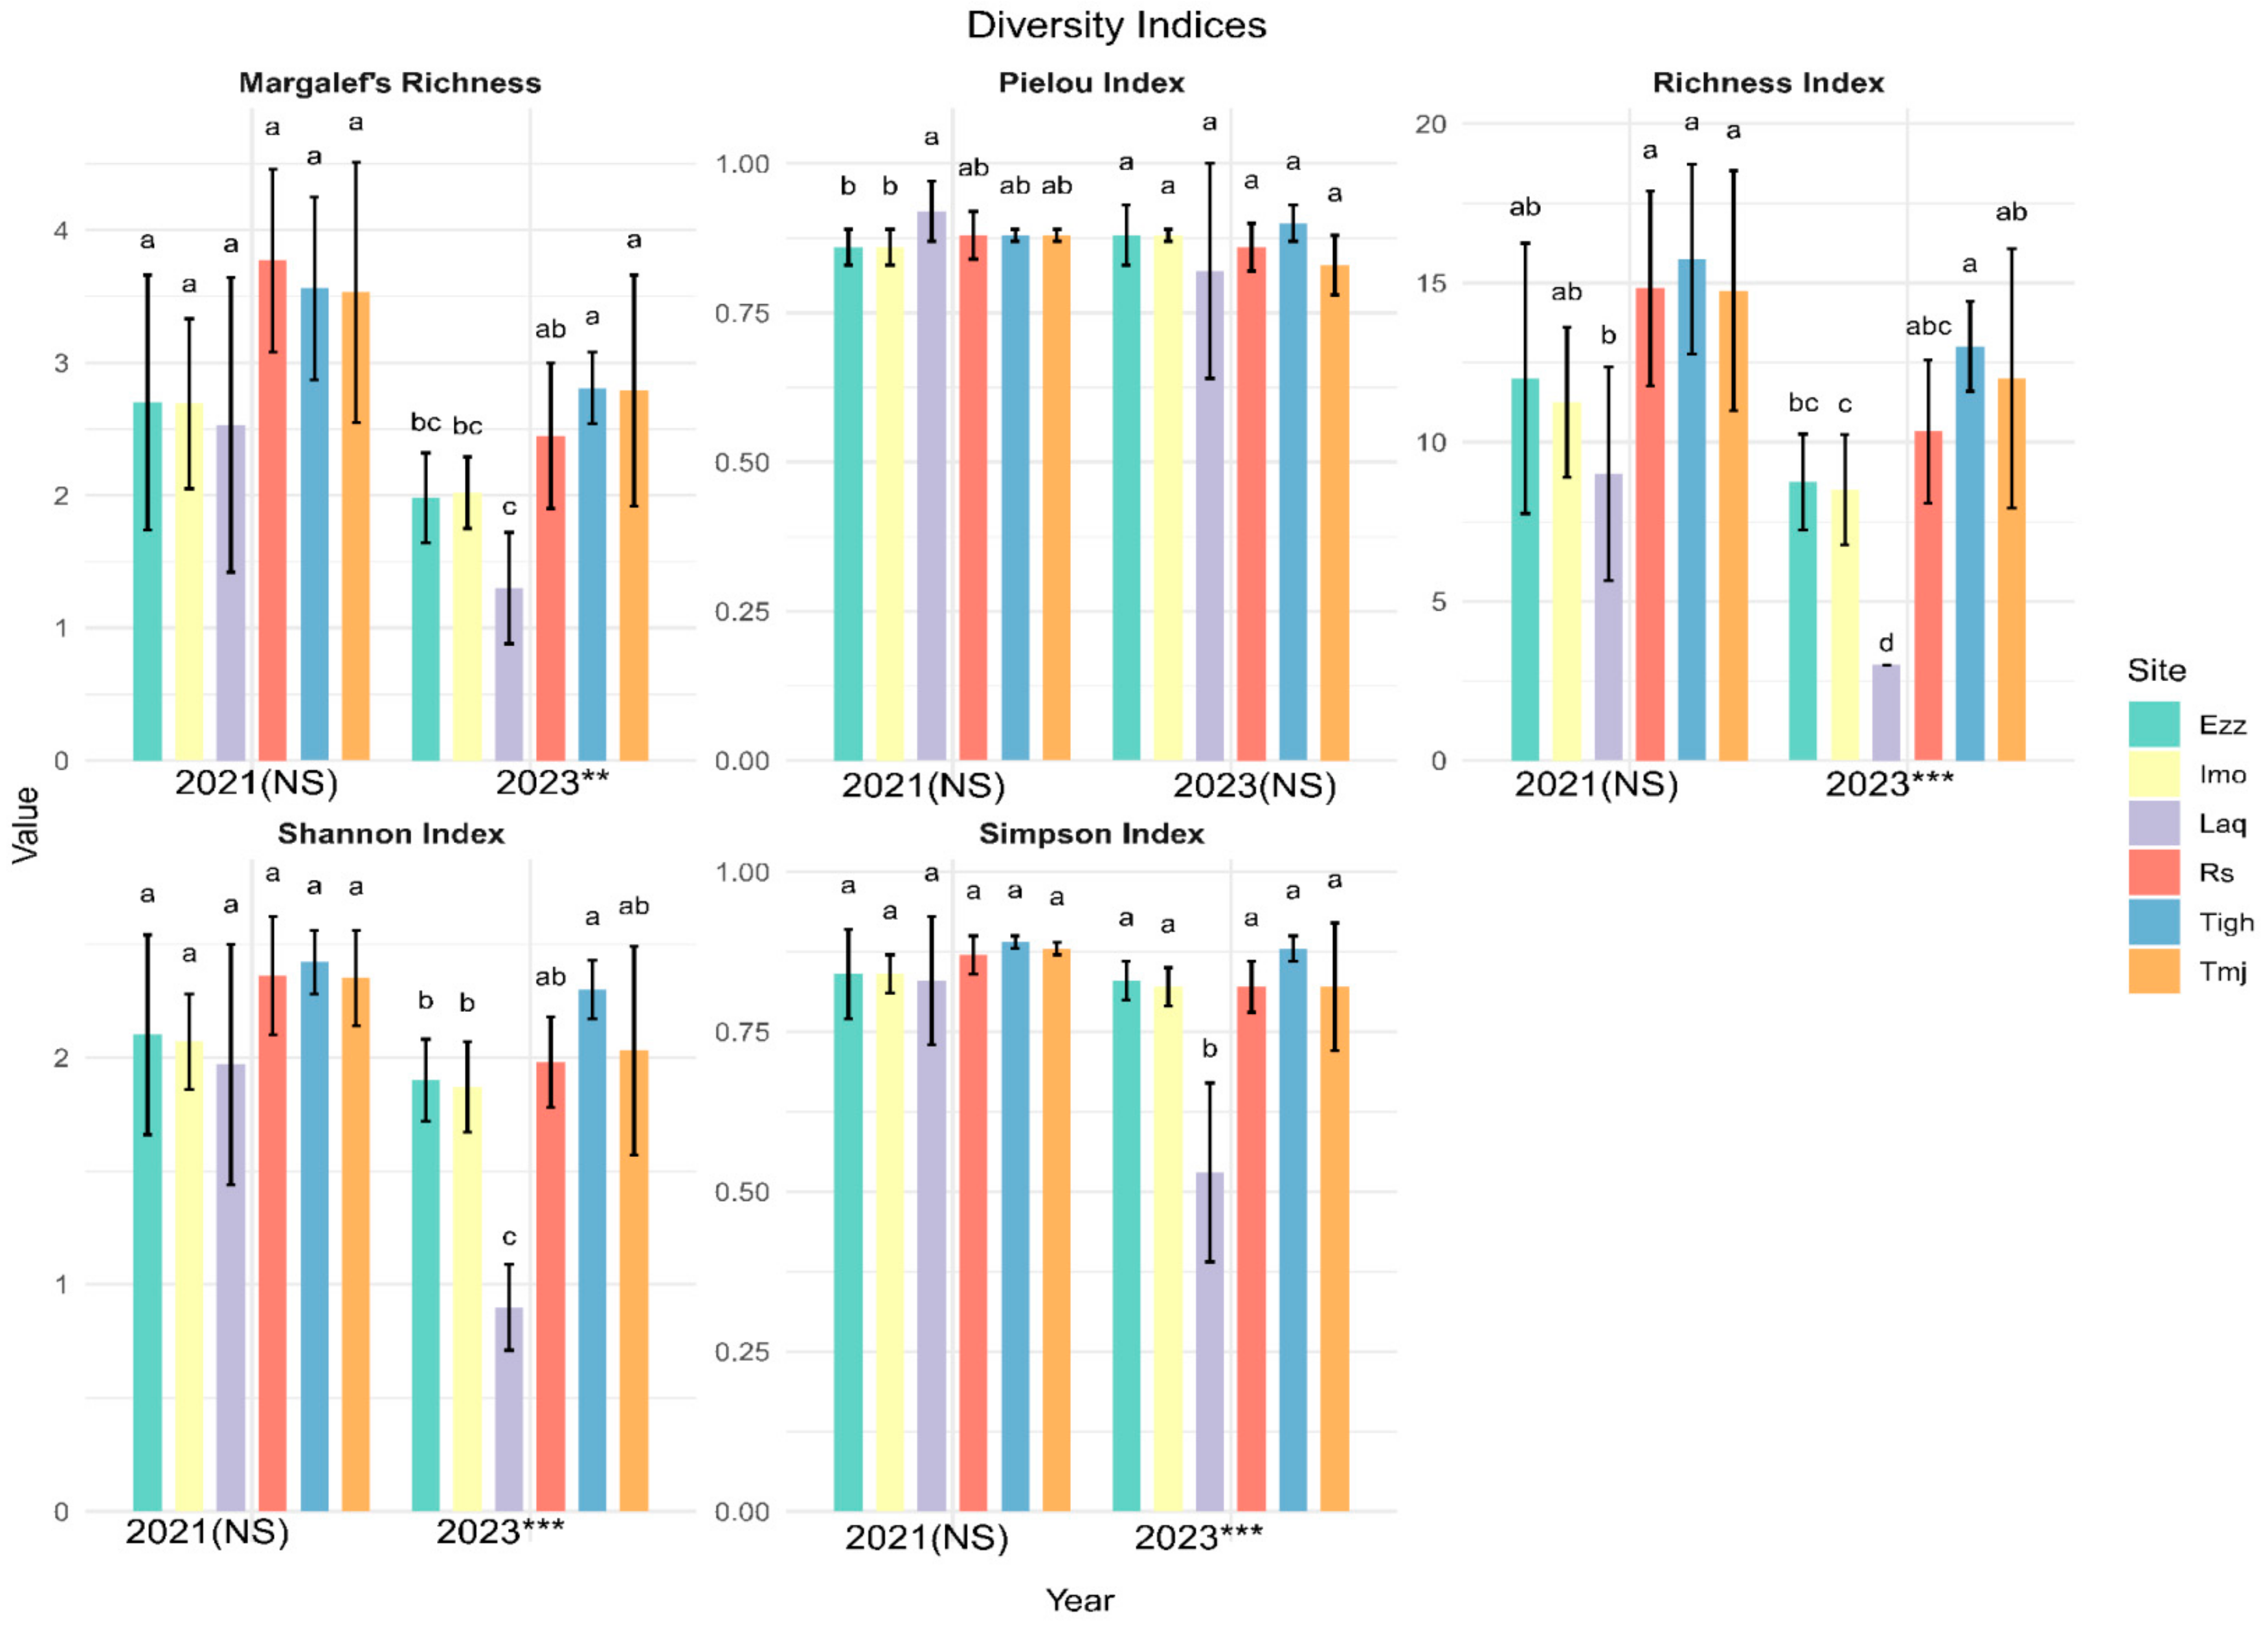
3.3. Comparison of Alpha Diversity Indices in Different Sites for Each Year
3.3.1. Inter-Group Comparisons of Alpha Diversity at Each Site
3.3.2. Intra-Group Comparisons of Alpha Diversity in Each Year
3.3.3. Effect of Elevation in Alpha Diversity (Shannon Index)
3.4. Comparison of Climatic Conditions in Analyzed Orchards
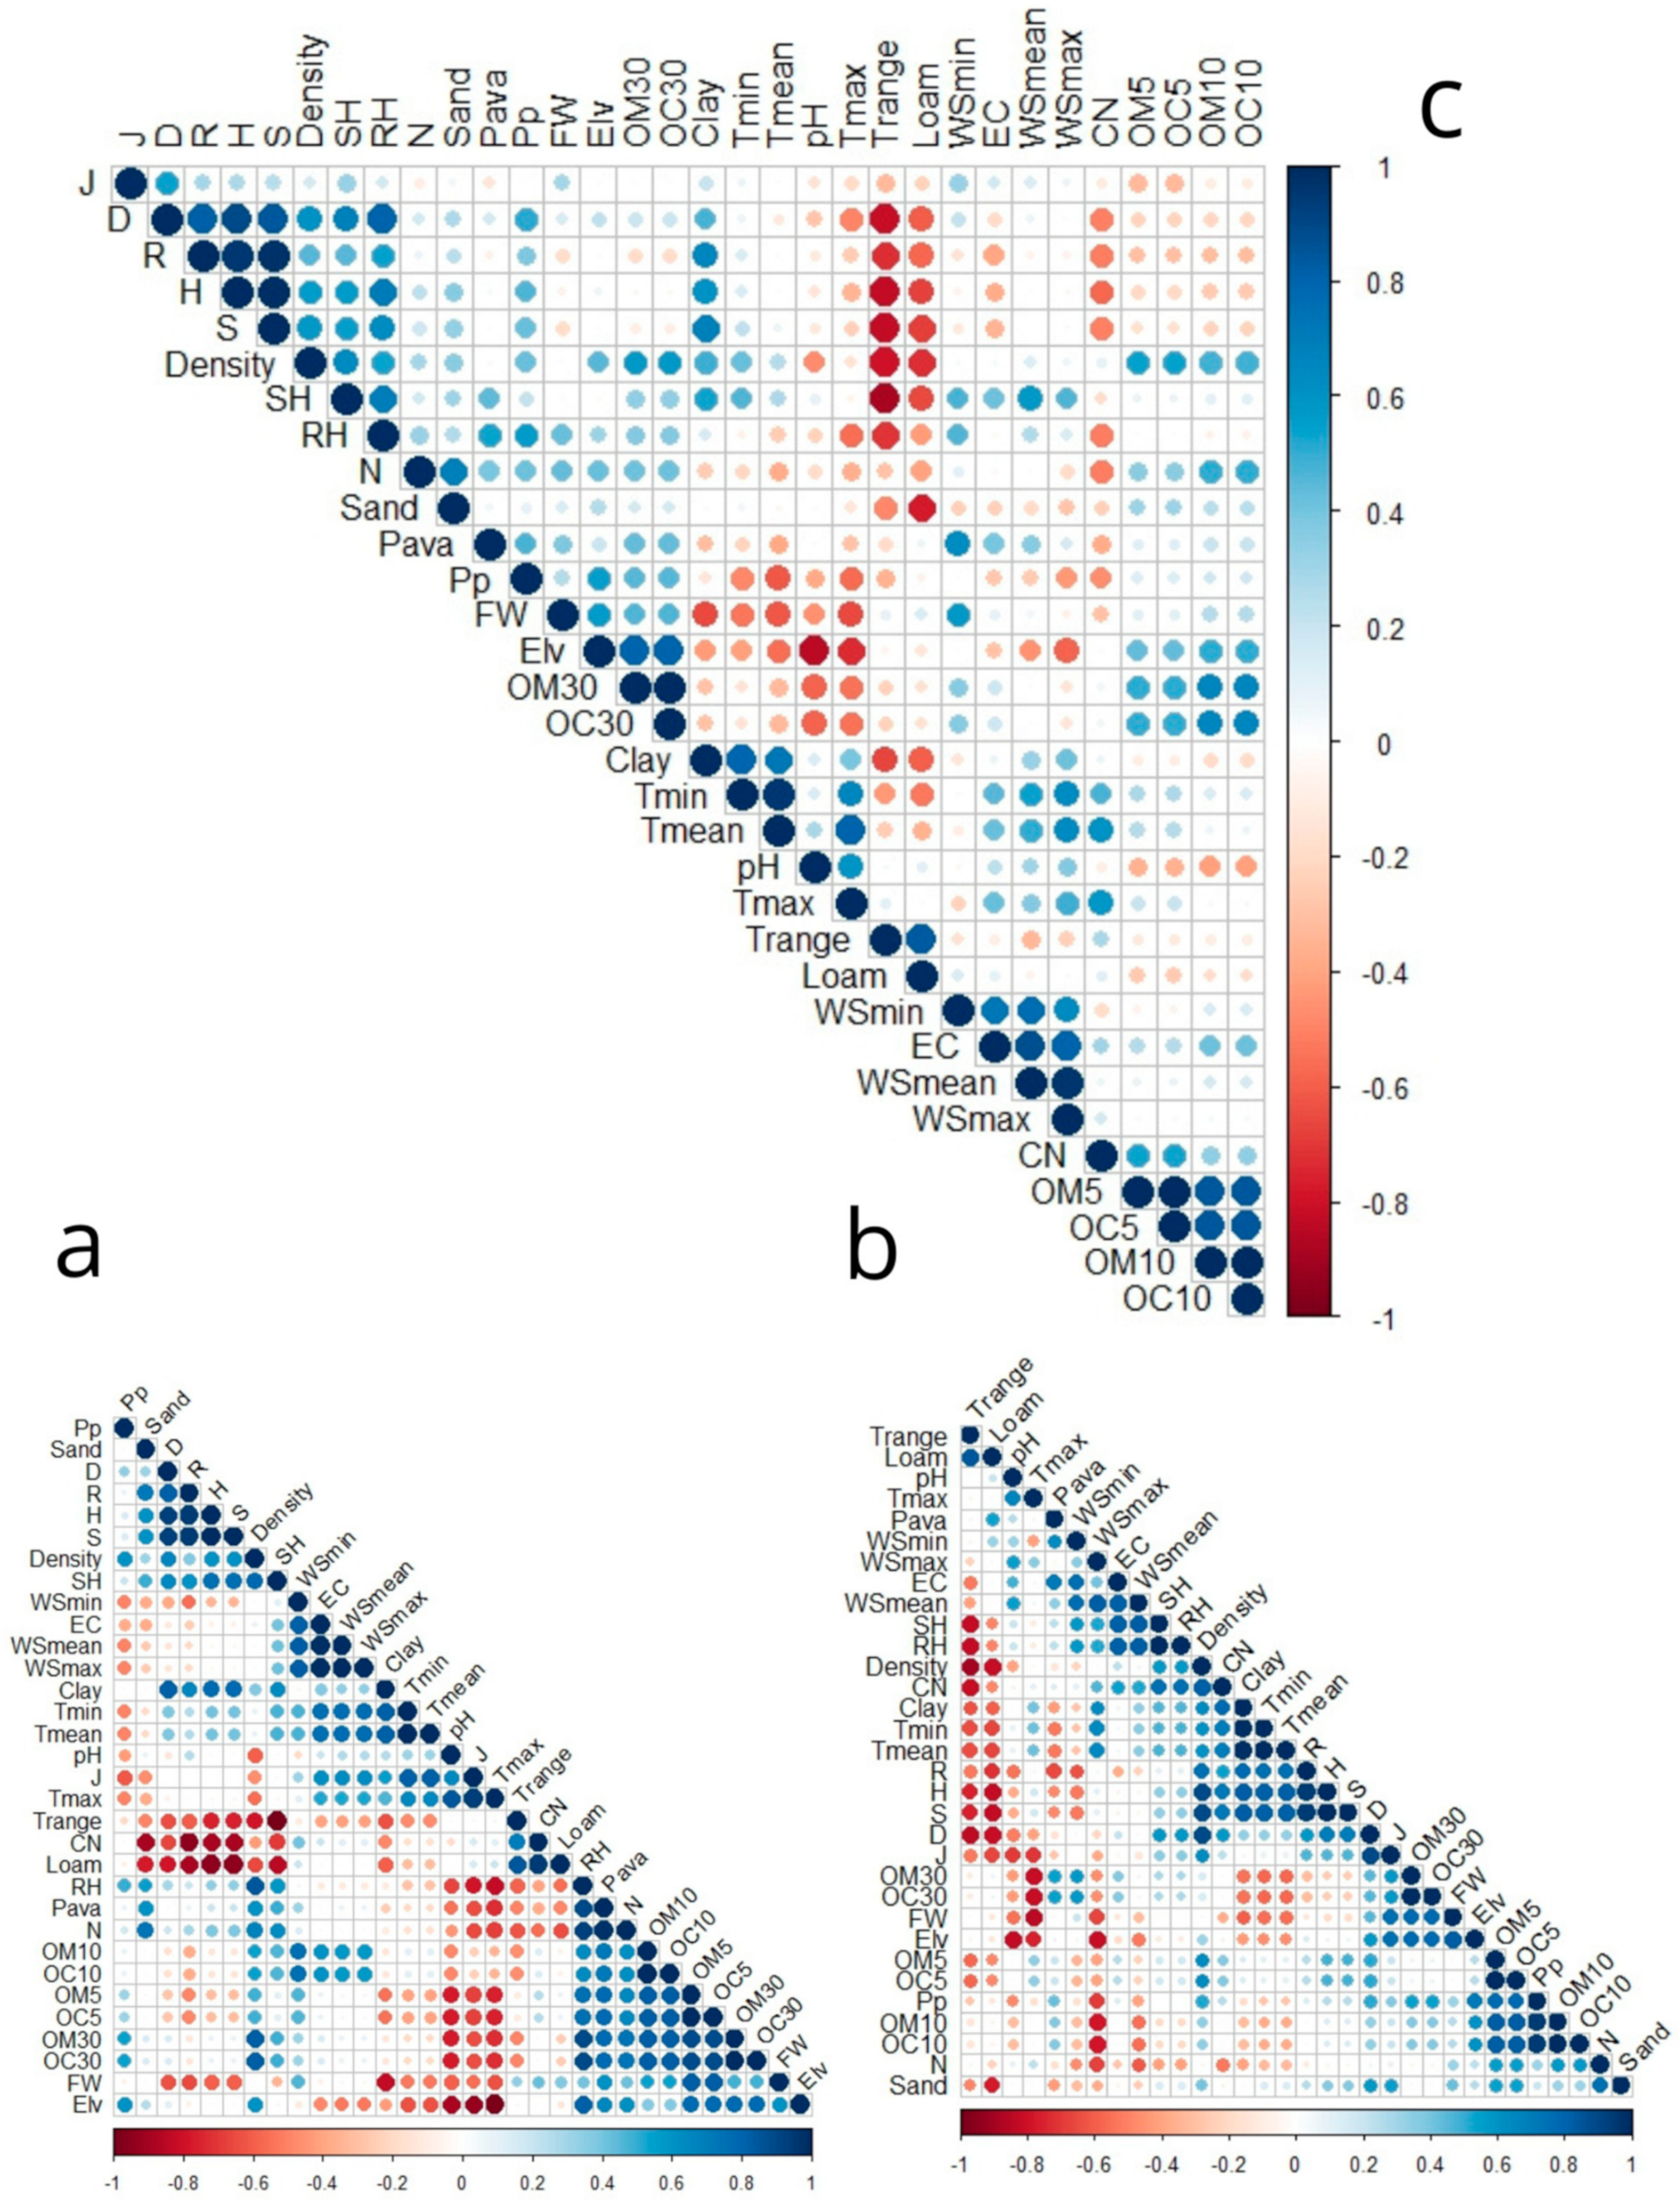
3.5. Relationships Between the Index Diversity Relationship with Ecological and Environmental Factors
3.5.1. Principal Component Analysis
3.5.2. Pearson’s Correlation
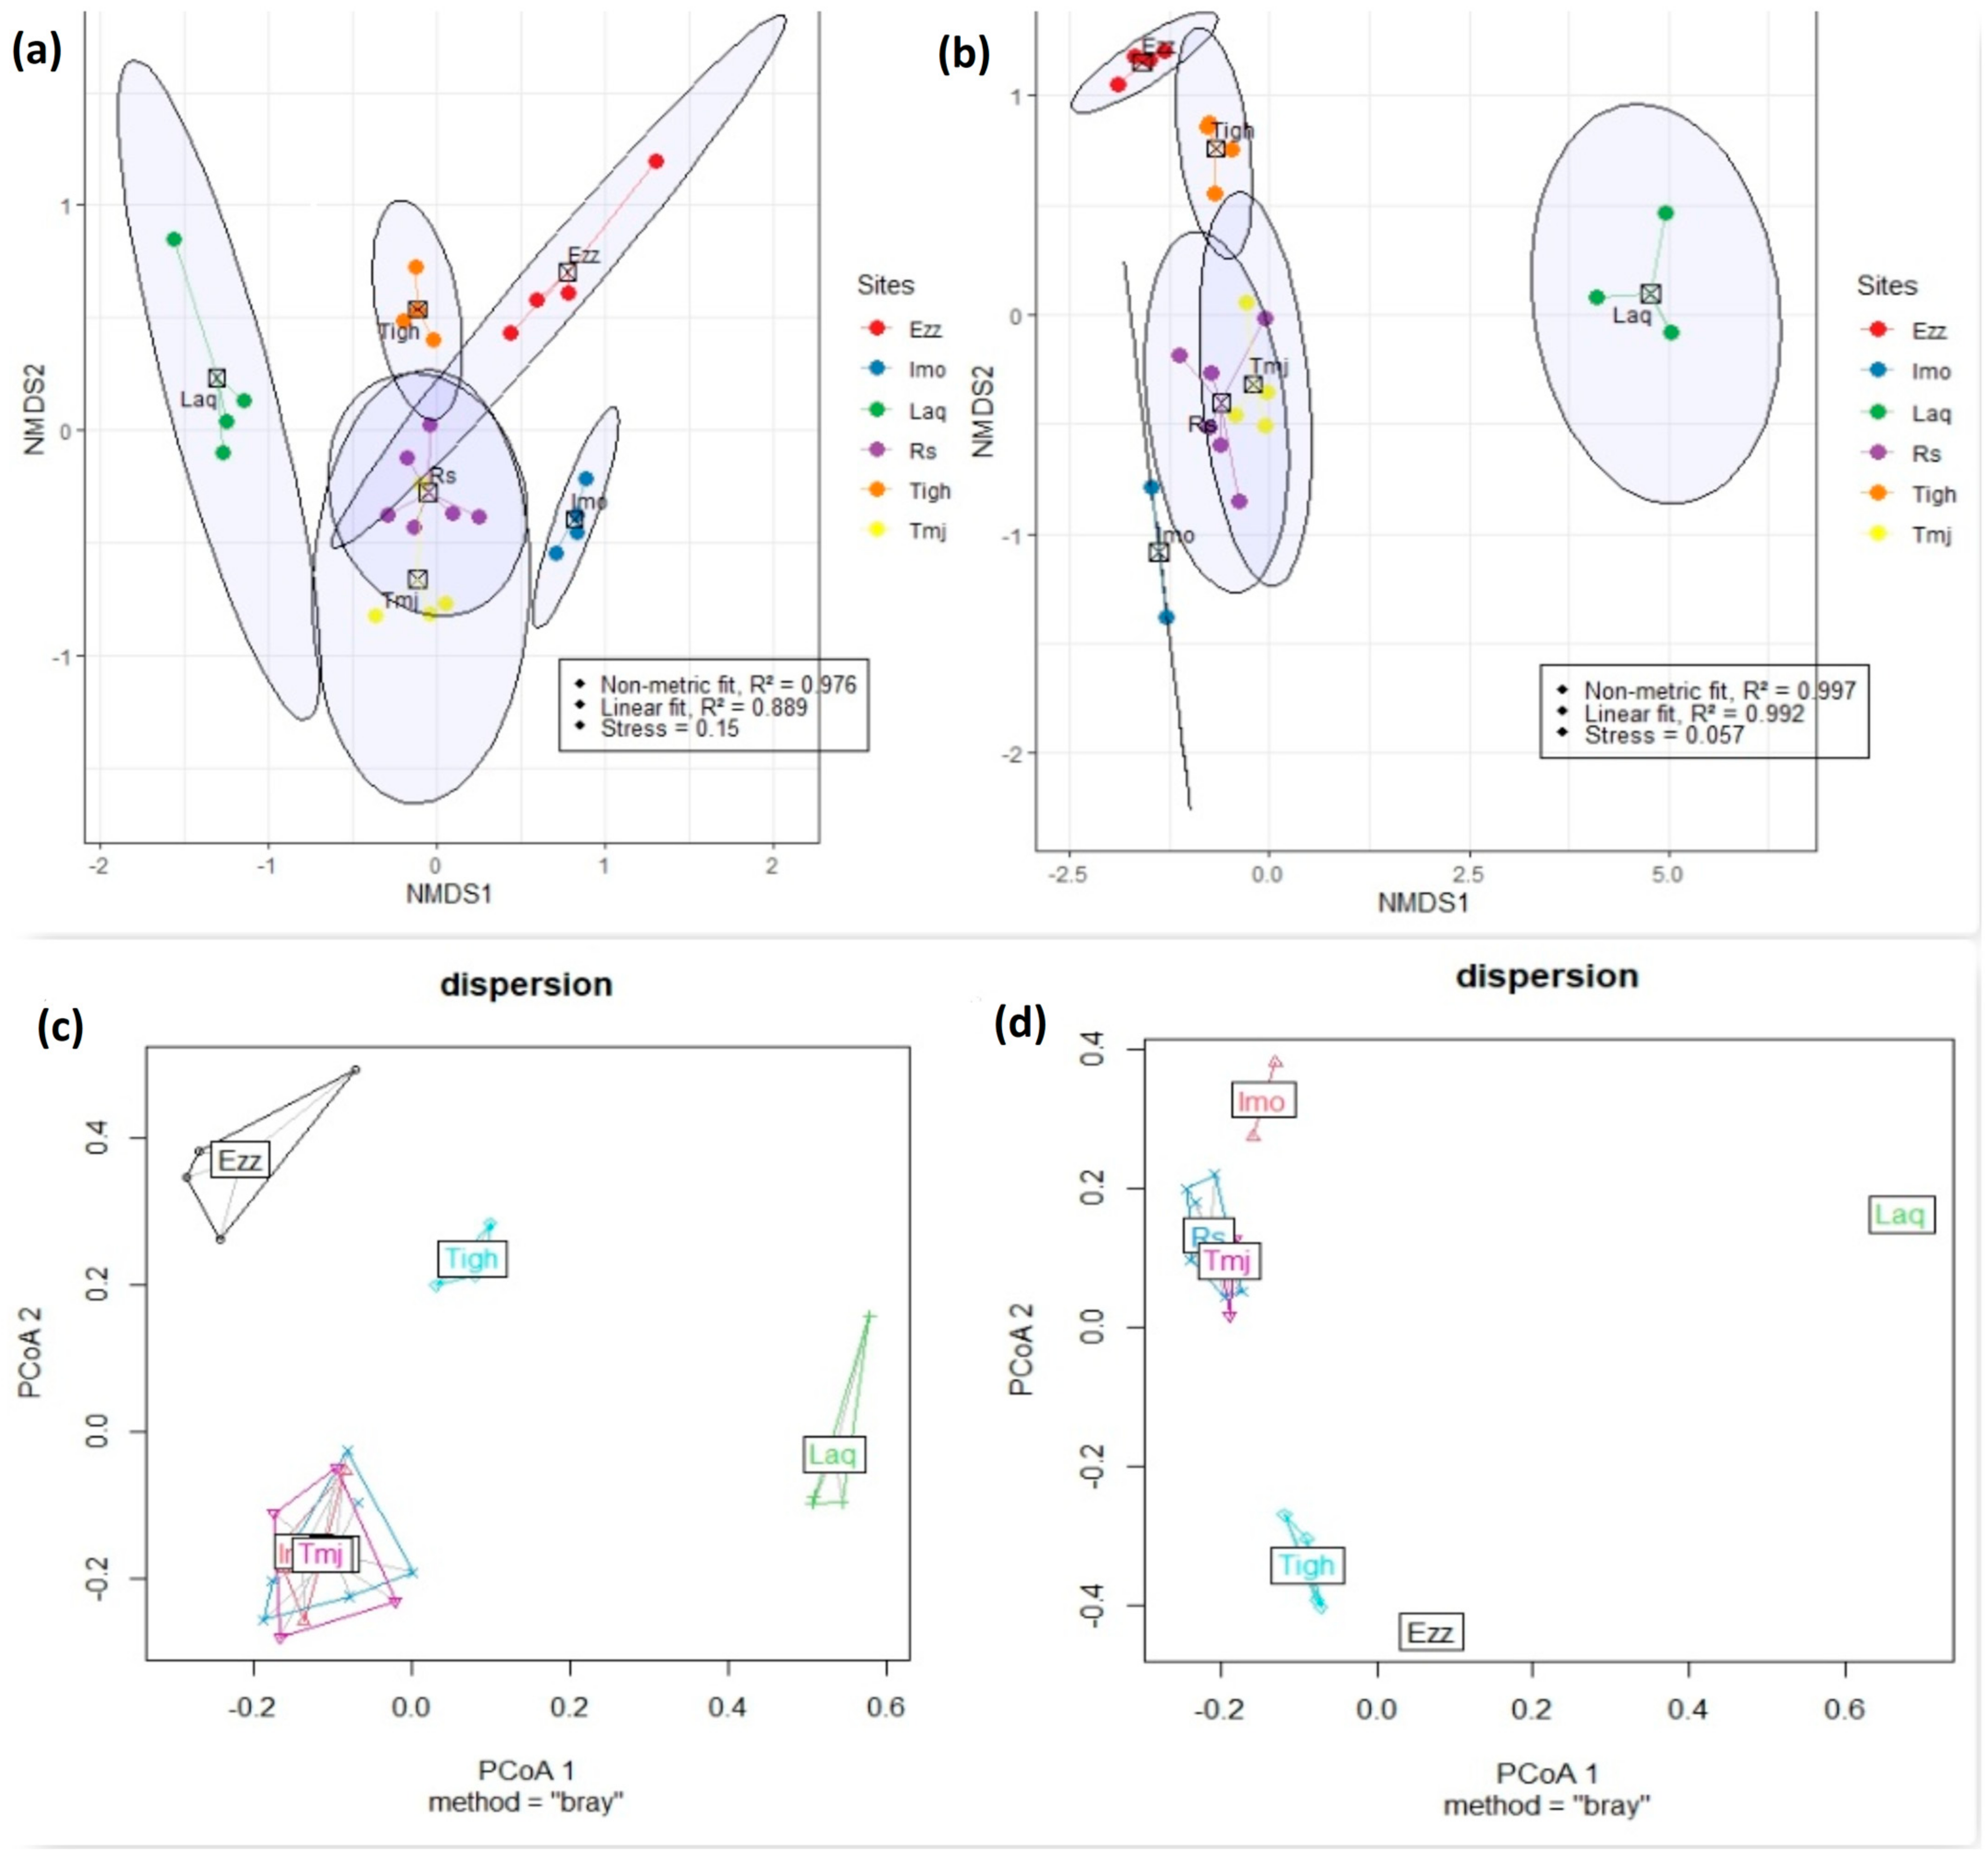
3.6. Differences in Community Composition
3.7. Comparison of Beta Diversity Indices in Different Sites for Each Year
4. Discussion
4.1. Relationships Between Plant Diversity, Density and Biomass Across Different Type’s Argan Orchards
4.2. Relationships Between Plant Productivity and Density
4.3. Biomass, Diversity, Density, Soil Physiochemical Properties and Soil Texture
4.4. Impact of Climatic Complexity on Ecosystem Stability and Species Resilience in Arid Regions
5. Conclusions
Supplementary Materials
Author Contributions
Funding
Data Availability Statement
Acknowledgments
Conflicts of Interest
References
- De Waroux, Y.L.P.; Lambin, E.F. Monitoring degradation in arid and semi-arid forests and woodlands: The case of the argan woodlands (Morocco). Appl. Geogr. 2012, 32, 777–786. [Google Scholar] [CrossRef]
- Ain-Lhouta, F.; Boutalebb, S.; Diaz-Barradasc, M.C.; Jaureguic, J.; Zunzuneguic, M. Monitoring the evolution of soil moisture in root zone system of Argania spinosa using electrical resistivity imaging. Agric. Water Manag. 2016, 164, 158–166. [Google Scholar] [CrossRef]
- Msanda, F.; Mayad, E.H.; Furze, J.N. Floristic biodiversity, biogeographical significance, and importance of Morocco’s Arganeraie Biosphere Reserve. Environ. Sci. Pollut. Res. 2021, 28, 64156–64165. [Google Scholar] [CrossRef]
- Mechqoq, H.; El Yaagoubi, M.; El Hamdaoui, A.; Momchilova, S.; Almeida, J.R.G.S.; Msanda, F. Ethnobotany, phytochemistry and biological properties of Argan tree (Argania spinosa (L.) Skeels) (Sapotaceae)—A review. J. Ethnopharmacol. 2021, 281, 114528. [Google Scholar] [CrossRef]
- Ait Aabd, N.; Tahiri, A.; Qessaoui, R.; Mimouni, A.; Bouharroud, R. Self- and Cross-Pollination in Argane Tree and their Implications on Breeding Programs. Cells 2022, 11, 828. [Google Scholar] [CrossRef]
- Santoro, A.; Ongoma, V.; Ait el Kadi, M.; Piras, F.; Fiore, B.; Bazzurro, A.; Romano, F.; Meskour, B.; Hssaisoune, M.; Labbaci, A.; et al. Innovation of argan (Argania spinosa (L.) Skeels) products and byproducts for sustainable development of rural communities in Morocco. A systematic literature review. Biodivers. Conserv. 2023, 1–29. [Google Scholar] [CrossRef]
- Msanda, F.; Aboudi, A.E.; Peltier, J.-P. Biodiversité et biogéographie de l’arganeraie marocaine. Cahiers Agric. 2005, 14, 357–364. [Google Scholar]
- Ait Aabd, N.; Ayadi, F.E.; Msanda, F.; El Mousadik, A. Evaluation of agromorphological variability of Argan tree under different environmental conditions in Morocco: Implication for selection. Int. J. Biodivers. Conserv. 2011, 3, 73–82. [Google Scholar]
- El Ghazali, H.; Daoud, S.; Benoada, T.N. Impact of Climate Change on the Argan Biosphere Reserve (ABR) in Morocco. Preprints 2021, 1–14. [Google Scholar] [CrossRef]
- Alami, M.; Pakhrou, O.; Medraoui, L.; Assemar, F.E.; Rabeh, K.; Filali-Maltouf, A.; Belkadi, B. Genomic scan of endangered moroccan endemic trees (Argania spinosa L. Skeels) along a latitudinal gradient: Exploring gene-environment correlations. Trees For. People 2024, 16, 100535. [Google Scholar] [CrossRef]
- Tinya, F.; Kovács, B.; Bidló, A.; Dima, B.; Király, I.; Kutszegi, G.; Lakatos, F.; Mag, Z.; Márialigeti, S.; Nascimbene, J.; et al. Environmental drivers of forest biodiversity in temperate mixed forests—A multi-taxon approach. Sci. Total Environ. 2021, 795, 148720. [Google Scholar] [CrossRef] [PubMed]
- Barkaoui, M.; Katiri, A.; Boubaker, H.; Msanda, F. Ethnobotanical survey of medicinal plants used in the traditional treatment of diabetes in Chtouka Ait Baha and Tiznit (Western Anti-Atlas), Morocco. J. Ethnopharmacol. 2017, 198, 338–350. [Google Scholar] [CrossRef] [PubMed]
- Zhou, R.; Ci, X.; Hu, J.; Zhang, X.; Cao, G.; Xiao, J.; Liu, Z.; Li, L.; Thornhill, A.H.; Conran, J.G.; et al. Transitional areas of vegetation as biodiversity hotspots evidenced by multifaceted biodiversity analysis of a dominant group in Chinese evergreen broad-leaved forests. Ecol. Indic. 2023, 147, 110001. [Google Scholar] [CrossRef]
- Hausner, V.H.; Engen, S.; Muñoz, L.; Fauchald, P. Assessing a nationwide policy reform toward community-based conservation of biological diversity and ecosystem services in the Alpine North. Ecosyst. Serv. 2021, 49, 101289. [Google Scholar] [CrossRef]
- Ceballos, G.; Ehrlich, P.R.; Barnosky, A.D.; García, A.; Pringle, R.M.; Palmer, T.M. Accelerated modern human–induced species losses. Sci. Adv. 2015, 1, e1400253. [Google Scholar] [CrossRef]
- Perry, W. Social sustainability and the argan boom as green development in Morocco. World Dev. Perspect. 2020, 20, 100238. [Google Scholar] [CrossRef]
- Gogoi, A.; Ahirwal, J.; Sahoo, U.K. Plant biodiversity and carbon sequestration potential of the planted forest in Brahmaputra flood plains. J. Environ. Manag. 2021, 280, 111671. [Google Scholar] [CrossRef]
- Shannon, C.E. The Bell system technical journal. J. Frankl. Inst. 1948, 196, 519–520. [Google Scholar] [CrossRef]
- Simpson, E.H. Measurement of diversity. Nature 1949, 163, 688. [Google Scholar] [CrossRef]
- Bates, D.; Mächler, M.; Bolker, B.M.; Walker, S.C. Fitting linear mixed-effects models using lme4. J. Stat. Softw. 2015, 67, 1–48. [Google Scholar] [CrossRef]
- Oksanen, J.; Simpson, G.L.; Blanchet, F.G.; Kindt, R.; Legendre, P.; Minchin, P.R.; O’Hara, R.B.; Solymos, P.; Stevens, M.H.H.; Szoecs, E.; et al. Package ‘vegan’. Community Ecol. Package 2013, 2, 1–295. [Google Scholar]
- Mi, J.; Ou, J.; Liu, H.; Shi, J.; Chen, D.; Bai, Y. The loss of plant species diversity dominated by temperature promotes local productivity in the steppe of eastern Inner Mongolia. Ecol. Indic. 2022, 139, 108953. [Google Scholar] [CrossRef]
- Heydari, M.; Roshan, S.A.; Lucas-Borja, M.E.; Omidipour, R.; Prévosto, B. Diverging consequences of past forest management on plant and soil attributes in ancient oak forests of southwestern Iran. For. Ecol. Manag. 2021, 494, 119360. [Google Scholar] [CrossRef]
- Fayiah, M.; Dong, S.; Li, Y.; Xu, Y.; Gao, X.; Li, S.; Shen, H.; Xiao, J.; Yang, Y.; Wessell, K. The relationships between plant diversity, plant cover, plant biomass and soil fertility vary with grassland type on Qinghai-Tibetan Plateau. Agric. Ecosyst. Environ. 2019, 286, 106659. [Google Scholar] [CrossRef]
- Yan, P.; Lu, X.; Liang, G.; Tang, Q.; Ding, S. Seasonal and habitat dependence of plant species, functional and phylogenetic diversity in agricultural landscapes. Ecol. Indic. 2023, 160, 111795. [Google Scholar] [CrossRef]
- Zhao, W.; Wang, D.D.; Huang, K.C.; Liu, S.; Reyila, M.; Sun, Y.F.; Li, J.K.; Cui, B.K. Seasonal variation in the soil fungal community structure of Larixgmelinii forests in Northeast China. Front. Microbiol. 2023, 14, 1106888. [Google Scholar] [CrossRef]
- Liu, K.; Liu, Z.; Li, X.; Shi, X.R.; Lock, T.R.; Kallenbach, R.L.; Yuan, Z.Y. Precipitation-mediated responses of plant biomass production and allocation to changing soil pH in semiarid grasslands. Agric. Ecosyst. Environ. 2022, 339, 108123. [Google Scholar] [CrossRef]
- Token, S.; Jiang, L.; Zhang, L.; Lv, G. Effects of plant diversity on primary productivity and community stability along soil water and salinity gradients. Glob. Ecol. Conserv. 2022, 36, e02095. [Google Scholar] [CrossRef]
- Hautier, Y.; Seabloom, E.W.; Borer, E.T.; Adler, P.B.; Harpole, W.S.; Hillebrand, H.; Lind, E.M.; MacDougall, A.S.; Stevens, C.J.; Bakker, J.D.; et al. Eutrophication weakens stabilizing effects of diversity in natural grasslands. Nature 2014, 508, 521–525. [Google Scholar] [CrossRef]
- Van der Plas, F. Biodiversity and ecosystem functioning in naturally assembled communities. Biol. Rev. 2019, 94, 1220–1245. [Google Scholar] [CrossRef]
- Xue, W.; Bezemer, T.M.; Berendse, F. Soil heterogeneity and plant species diversity in experimental grassland communities: Contrasting effects of soil nutrients and pH at different spatial scales. Plant Soil 2019, 442, 497–509. [Google Scholar] [CrossRef]
- Sharma, A.; Kaur, A.; Kohli, R.K.; Singh, H.P.; Batish, D.R. Bidens pilosa (Asteraceae) invasion reshapes the pattern of plant communities and edaphic properties across the north-western Himalayan landscape. Ecol. Inform. 2023, 77, 102281. [Google Scholar] [CrossRef]
- Schirpke, U.; Kohler, M.; Leitinger, G.; Fontana, V.; Tasser, E.; Tappeiner, U. Future impacts of changing land-use and climate on ecosystem services of mountain grassland and their resilience. Ecosyst. Serv. 2017, 26, 79–94. [Google Scholar] [CrossRef]
- Jiang, Z.Y.; Li, X.Y.; Wu, H.W.; Zhang, S.Y.; Zhao, G.Q.; Wei, J.Q. Linking spatial distributions of the patchy grass Achnatherum splendens with dynamics of soil water and salt using electromagnetic induction. Catena 2017, 149, 261–272. [Google Scholar] [CrossRef]
- Jentsch, A.; Beyschlag, W. Vegetation ecology of dry acidic grasslands in the lowland area of central Europe. Flora 2003, 198, 3–25. [Google Scholar] [CrossRef]
- Heydari, M.; Cheraghi, J.; Omidipour, R.; Rostaminia, M.; Kooch, Y.; Valkó, O.; Carcaillet, C. Tree dieback, woody plant diversity, and ecosystem driven by topography in semi-arid mountain forests: Implication for ecosystem management. Environ. Manag. 2023, 339, 117892. [Google Scholar] [CrossRef]
- Ma, T.; Deng, X.; Chen, L.; Xiang, W. The soil properties and their effects on plant diversity in different degrees of rocky desertification. Sci. Total Environ. 2020, 736, 139667. [Google Scholar] [CrossRef]
- Trap, J.; Blanchart, E. Intensifying the soil ecological functions for sustainable agriculture: Acting with stakeholders. Curr. Res. Environ. Sustain. 2023, 5, 100225. [Google Scholar] [CrossRef]


| Site/Province | Code | Geographical Location | Elevation (m) | Soil Texture (%) | |||
|---|---|---|---|---|---|---|---|
| Sand | Loam | Clay | Class | ||||
| Rasmouka/Tiznit | Rs | 29°45′17.47″ N 9°32′1.96″ W | 207 | 80.28 | 7.79 | 11.93 | Loamy sand |
| Tamjloujt/Chtouka AitBaha | Tmj | 29°57′53.34″ N 9°21′23.62″ W | 239 | 57.61 | 29.53 | 12.86 | Loamy sand |
| Tioughza/Sidi Ifni | Tigh | 29°26′13.97″ N 10°1′55.73″ W | 279 | 70.35 | 2.44 | 27.21 | Loam clay sandy |
| Laqsabi/Guelmim | Laq | 28°58′58.32″ N 10°15′31.33″ W | 181 | 56.32 | 37.36 | 6.32 | Loamy sand |
| Imoulass/Taroudant | Imo | 30°45′33.1″ N 8°45′50.5″ W | 1207 | 65.49 | 32.55 | 1.96 | Loamy sand |
| Ezzaouite/Essaouira | Ezz | 31°19′55.15″ N 9°30′20.47″ W | 378 | 79.01 | 17.25 | 3.74 | Sandy loam |
| Sites | Rs | Tmj | Tigh | Laq | Imo | Ezz | |
|---|---|---|---|---|---|---|---|
| Soil properties | Pava (ppm) | (10.2880) *** | (0.2094) NS | (9.9763) *** | (−1.5779) NS | (2.2683) NS | (−1.5541) NS |
| N % | (−0.4760) NS | (−1.2445) NS | (8.7930) *** | (0.9214) NS | (−0.0334) NS | (5.2588) ** | |
| pH | (2.9085) * | (0.3801) NS | (−0.6576) NS | (−4.9930) ** | (−0.4757) NS | (0.3046) NS | |
| EC (ds.m−1) | (−2.7005) * | (2.1488) NS | (0.4460) NS | (3.8122) ** | (−1.1788) NS | (−2.4613) * | |
| OM % (0–5 cm) | (−6.4614) *** | (−8.2672) *** | (−0.6603) NS | (−0.7279) NS | (0.2065) NS | (−3.6207) * | |
| OM % (5–10 cm) | (−3.6687) * | (−9.2517) *** | (1.4533) NS | (0.2566) NS | (−1.7096) NS | (−2.9597) * | |
| OM % (10–30 cm) | (−0.8909) NS | (1.2525) NS | (0.1886) NS | (−1.0666) NS | (−0.4379) NS | (1.6333) NS | |
| OC % (0–5 cm) | (−6.4612) *** | (−8.2664) *** | (−0.6599) NS | (−0.7276) NS | (0.2071) NS | (−3.6198) * | |
| OC % (5–10 cm) | (−3.6685) * | (−9.2520) *** | (1.4537) NS | (0.2568) NS | (−1.7093) NS | (−2.9593) * | |
| OC % (10–30 cm) | (−0.8902) NS | (1.2530) NS | (0.1889) NS | (−1.0666) NS | (−0.4378) NS | (1.6340) NS | |
| C/N % | (−2.3174) NS | (−8.1231) *** | (−6.4848) *** | (1.1966) NS | (−0.6605) NS | (−6.6523) *** |
| Fixed Factors | Random Factor | ||
|---|---|---|---|
| Density | Years | Sites | |
| Fresh Weight | t value = 3.100 p = 0.003 | t value = −3.282 p = 0.002 | Variance 0.7873 |
| Sites | Rs | Tmj | Tigh | Laq | Imo | Ezz | |
|---|---|---|---|---|---|---|---|
| Diversity indices | Shannon Index | (2.867) * | (1.255) NS | (1.257) NS | (3.817) ** | (1.338) NS | (0.870) NS |
| Simpson Index | (2.376) * | (1.176) NS | (1.079) NS | (3.483) * | (1.067) NS | (0.464) NS | |
| Pielou Index | (0.970) NS | (1.809) NS | (−1.046) NS | (1.107) NS | (−1.194) NS | (−0.548) NS | |
| Margalef’s Richness | (3.682) ** | (1.124) NS | (2.020)N S | (2.081) * | (1.927) NS | (1.391) NS |
| Fixed | Random | ||
|---|---|---|---|
| Elevation | Years | Sites | |
| Shannon’s index of diversity (H′) | t value = 0.171 p = 0.873 | t value = −4.347 p < 0.001 | 0.1133 |
| Ezz | Imo | Laq | Rs | Tigh | Tmj | p-Value | |
|---|---|---|---|---|---|---|---|
| 2021 | 46.01 ± 33.20 a | 38.01 ± 37.42 a | 16.0 ± 14.02 a | 22.01 ± 14.30 a | 27.01 ± 16.67 a | 46.40 ± 48.21 a | 0.502 NS |
| 2023 | 27.60 ± 42.03 a | 17.4 ± 28.88 a | 6.60 ± 8.47 a | 7.60 ± 8.91 a | 11.80 ± 16.83 a | 23.80 ± 34.07 a | 0.748 NS |
| ANOSIM | PERMANOVA | PERMDISP | |||||
|---|---|---|---|---|---|---|---|
| R | p-Value | R2 | F | p-Value | F | Pr(>F) | |
| 2021 | 0.918 | 0.001 *** | 0.666 | 7.98 | 0.001 *** | 0.831 | 0.554 NS |
| 2023 | 0.982 | 0.001 *** | 0.802 | 16.25 | 0.001 *** | 11.483 | 0.001 *** |
Disclaimer/Publisher’s Note: The statements, opinions and data contained in all publications are solely those of the individual author(s) and contributor(s) and not of MDPI and/or the editor(s). MDPI and/or the editor(s) disclaim responsibility for any injury to people or property resulting from any ideas, methods, instructions or products referred to in the content. |
© 2025 by the authors. Licensee MDPI, Basel, Switzerland. This article is an open access article distributed under the terms and conditions of the Creative Commons Attribution (CC BY) license (https://creativecommons.org/licenses/by/4.0/).
Share and Cite
Telmoudi, M.; Afi, C.; Chabbi, N.; Labbassi, S.; Oumasst, A.; Ouknin, M.; Bouharroud, R.; Mimouni, A.; El Kaoua, M.; Hsissou, D.; et al. Impact of Climate and Soil on Plant Dynamics and Ecosystem Stability in Argan Orchards. Plants 2025, 14, 664. https://doi.org/10.3390/plants14050664
Telmoudi M, Afi C, Chabbi N, Labbassi S, Oumasst A, Ouknin M, Bouharroud R, Mimouni A, El Kaoua M, Hsissou D, et al. Impact of Climate and Soil on Plant Dynamics and Ecosystem Stability in Argan Orchards. Plants. 2025; 14(5):664. https://doi.org/10.3390/plants14050664
Chicago/Turabian StyleTelmoudi, Maryem, Chaima Afi, Naima Chabbi, Said Labbassi, Assma Oumasst, Mohamed Ouknin, Rachid Bouharroud, Abdelaziz Mimouni, Mimoun El Kaoua, Driss Hsissou, and et al. 2025. "Impact of Climate and Soil on Plant Dynamics and Ecosystem Stability in Argan Orchards" Plants 14, no. 5: 664. https://doi.org/10.3390/plants14050664
APA StyleTelmoudi, M., Afi, C., Chabbi, N., Labbassi, S., Oumasst, A., Ouknin, M., Bouharroud, R., Mimouni, A., El Kaoua, M., Hsissou, D., Tahiri, A., & Aabd, N. A. (2025). Impact of Climate and Soil on Plant Dynamics and Ecosystem Stability in Argan Orchards. Plants, 14(5), 664. https://doi.org/10.3390/plants14050664