Article

Characterization of Grain Structure Using Micro-CT and Identification of Related Candidate Genes by QTL Mapping in Foxtail Millet

1
College of Agriculture, Shanxi Agricultural University, Jinzhong 030810, China
2
College of Software, Shanxi Agricultural University, Jinzhong 030810, China
*
Authors to whom correspondence should be addressed.
Plants 2025, 14(23), 3603; https://doi.org/10.3390/plants14233603
Submission received: 11 October 2025 / Revised: 13 November 2025 / Accepted: 24 November 2025 / Published: 26 November 2025
(This article belongs to the Collection Crop Genomics and Breeding)

Abstract

Foxtail millet is a plant that is highly drought-resistant and rich in nutrients. Its grain structure traits are linked with water uptake during grain germination, which is closely related to plant density for high yield under rain fed regions; however, there is no related research. Using Micro-CT technology, we investigated a total of 15 internal structure traits of foxtail millet grains, such as the volume and surface area of the embryo, endosperm, cavity, hull, and whole grain, and mapped relevant quantitative trait loci (QTLs) using recombination inbred lines (RILs). With phenotypic variations in these traits and genome sequences of 100 foxtail millet RILs, four QTLs were identified. In combination with transcriptome profiling during grain development, we identified seven candidate genes that may play a role in the regulation of grain structure in foxtail millet.

1. Introduction

Given the global decrease in water resources and environmental deterioration, foxtail millet has attracted worldwide attention because of its outstanding characteristics such as drought tolerance, water saving, abundant nutrition, and environmental adaptability [1,2,3,4]. Due to its small grain size with a thousand-grain weight about 3 g, the seed of foxtail millet is sowed just 3 cm deep into the soil to facilitate the emergence of seedlings. Rain-fed foxtail millet relies on soil moisture in order for the grains to germinate successfully. The ideal timing for germination is before the top layer of soil dries out. The hull and caryopses of the grains are crucial for the uptake of water from the soil, which is essential for timely germination and achieving the desired plant density necessary for a good yield [5,6,7]. However, there have been limited studies on this research area in foxtail millet, which restricts the discovery of relevant genes for molecular breeding for drought tolerance varieties with quick germination.
To study seed structure, traditionally, the grains were sectioned and observed using an optical microscope [8,9]. Not only is it difficult to obtain the comprehensive grain structure in detail, but also time-consuming and laborious, making it prone to errors. Although fluorescence microscopy enables high-resolution imaging of cellular and subcellular structures through fluorescent dye labeling, it presents challenges when imaging deep tissues [10,11,12,13]. While the scanning electron microscope (SEM) can produce high-resolution images, it requires spraying metals on the sample surface and is limited to capturing the image of the sample surface only. The transmission electron microscope (TEM) offers a high resolution; however, it is also limited to generating simple two-dimensional structure images and the sample preparation is long and laborious [14,15,16,17].
Micro-CT utilizes differences in X-ray absorption and transmittance of plant tissues to reveal their three-dimensional structure through 2D or 3D images [18]. It has been used to study the 3D structures of maize kernels [19], American field pansy (Viola bicolor) seeds [20], barley flowers [21], Arabidopsis flowers [21], and leaves of a range of species (including both dicots and monocots) [22]. So far, Micro-CT has succeeded in crop phenomics analysis, but only a limited number of studies linking phenomic data with genotype data have been reported.
The grain of the grass family (Poaceae) represents a highly specialized fruit type that has been crucial to human civilization, forming the nutritional foundation of major cereals such as foxtail millet (Setaria italica), rice (Oryza sativa), sorghum (Sorghum bicolor), and maize (Zea mays). The grain has a complex structure derived from a floret with a caryopsis that is encased by the hull [23]. The caryopsis is a dry, indehiscent fruit characterized by the fusion of the exocarp, mesocarp, and endocarp, with the seed coat into a thin, hard layer that is sometimes called caryopsis coat. Additionally, in some species, the caryopsis is covered by a structure called the hull, which is not fused to the caryopsis, but adheres tightly to it and can be difficult to remove. The hull is produced by the transformation of the bract(s) that are subtending the flower. These bracts are called the lemma and palea. The grain of Setaria sp. is caryopsis with hull [24]. The caryopsis consists of three genetically distinct components: (i) the diploid maternal tissues including the pericarp, testa, and remnants of the nucellus; (ii) the triploid filial endosperm tissue; and (iii) the diploid filial embryo tissue [9]. This anatomical structure exhibits remarkable evolutionary adaptations for protection, dormancy, and efficient germination [25,26].
Quantitative trait loci (QTL) analysis is a rapid and accurate method for identifying the major genes that control quantitative traits. An F2 population consisting of 167 individuals derived from Yugu1 × Longgu7 was used to detect QTLs associated with agronomic and yield trait in foxtail millet, resulting in the identification of 29 QTLs linked with 11 traits [27]. These QTLs related to hull color traits were detected using an RIL population, and five candidate genes were identified [28]. The integrative quantitative trait mapping and transcriptome analysis is an effective strategy to narrow down the mapping area or reduce the number of candidate genes. Using this approach, a number of candidate genes are identified in different crops such as genes related to seed size in einkorn wheat (Triticum monococcum ssp. monococcum) and pericarp thickness in sweetcorn [29,30].
In this study, 3D images of foxtail millet grains were obtained using Micro-CT technology, and 15 traits data such as volume and surface area of embryo, endosperm, cavity, hull, and whole grain were analyzed. Through the analysis of 15 traits in 100 RILs, the candidate genes were identified using an integrative analysis of QTL mapping and transcriptome. These results not only lay the foundation for the study of the regulatory mechanism of related traits in the structure of foxtail millet grains, but also provide a basis for research on improving the water absorption rate of foxtail millet grains during germination.

2. Results

2.1. Three-Dimensional Structure of All Tested Grains

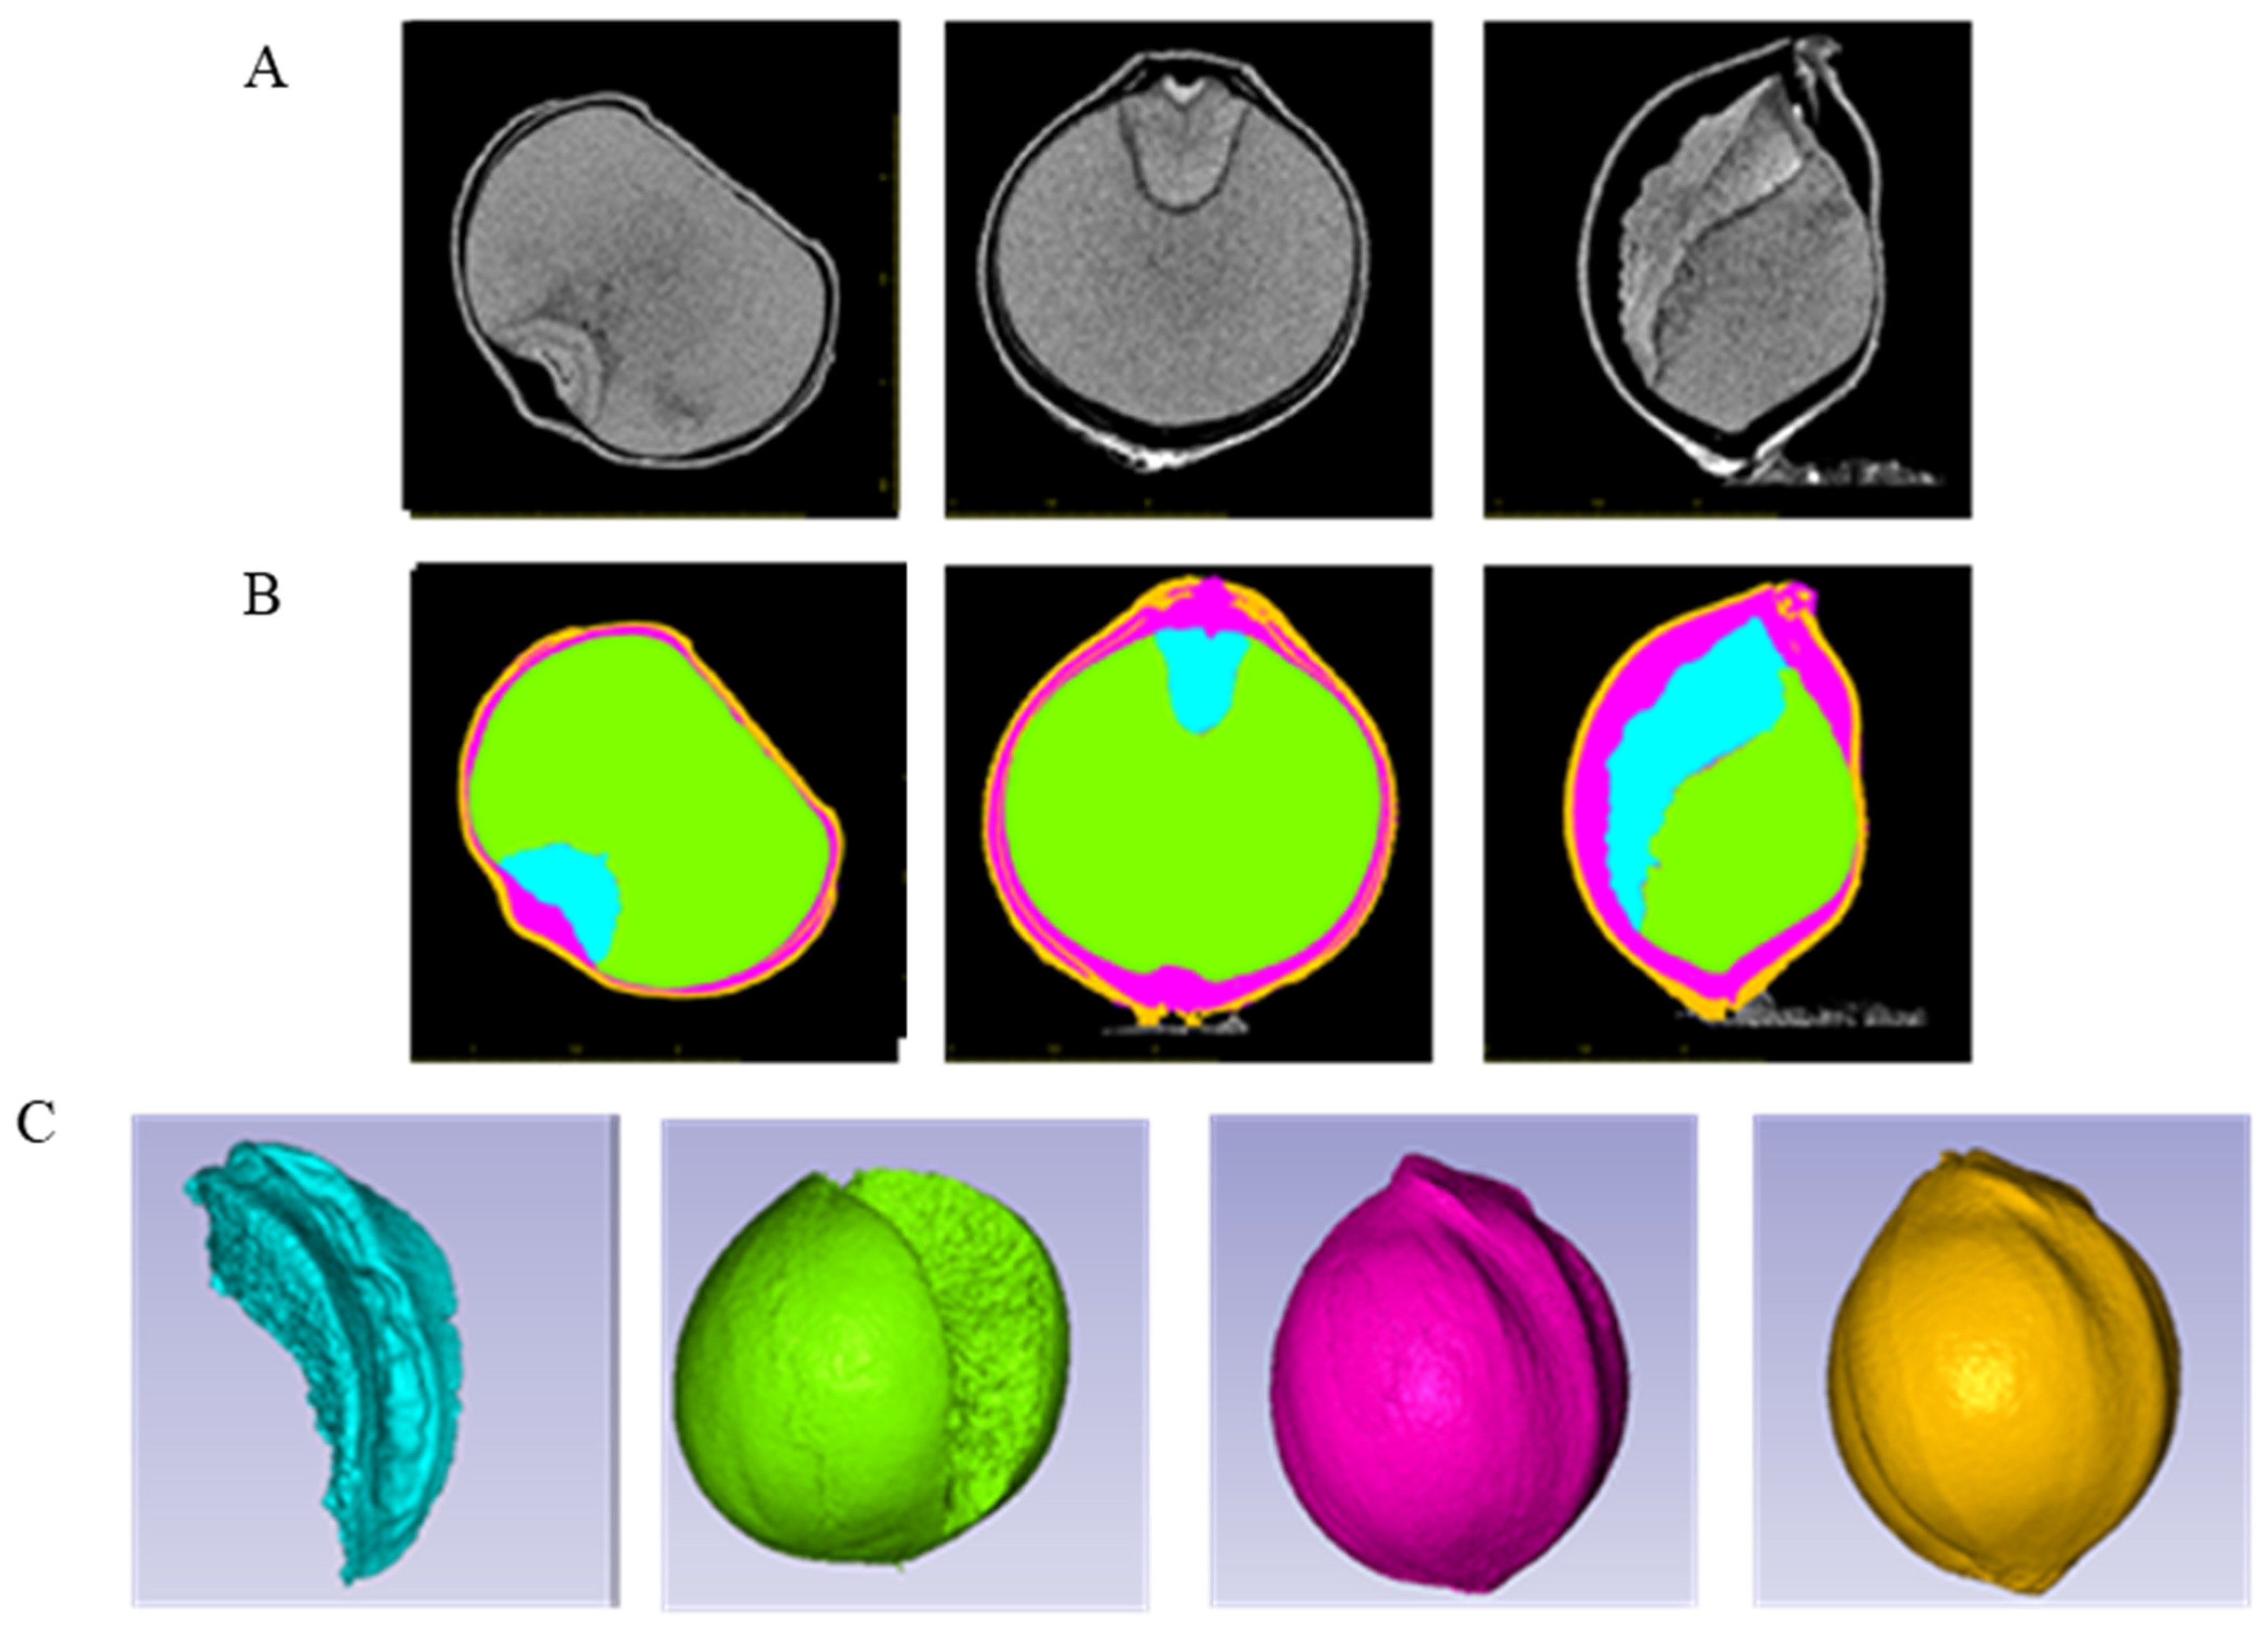
Based on high-resolution Micro-CT reconstruction images, foxtail millet grains are composed of four parts, embryo, endosperm, cavity, and hull (Figure 1). The different parts exhibit varying X-ray absorption, resulting in varying grayscale levels. To accurately identify and separate these parts, region growing techniques were employed. The embryo, endosperm, cavity, and hull were, respectively, assigned the colors blue, green, purple, and yellow (Figure 2B). Finally, by manually adjusting the threshold values for the regions with small differences that are difficult to distinguish, precise segmentation of the embryo, endosperm, cavity, and hull was achieved (Figure 2C), and the 3D volume, surface area, and hull thickness were calculated using the AVIZO 8.0 software.

2.2. Relationship Between Different Traits of All Tested Grains

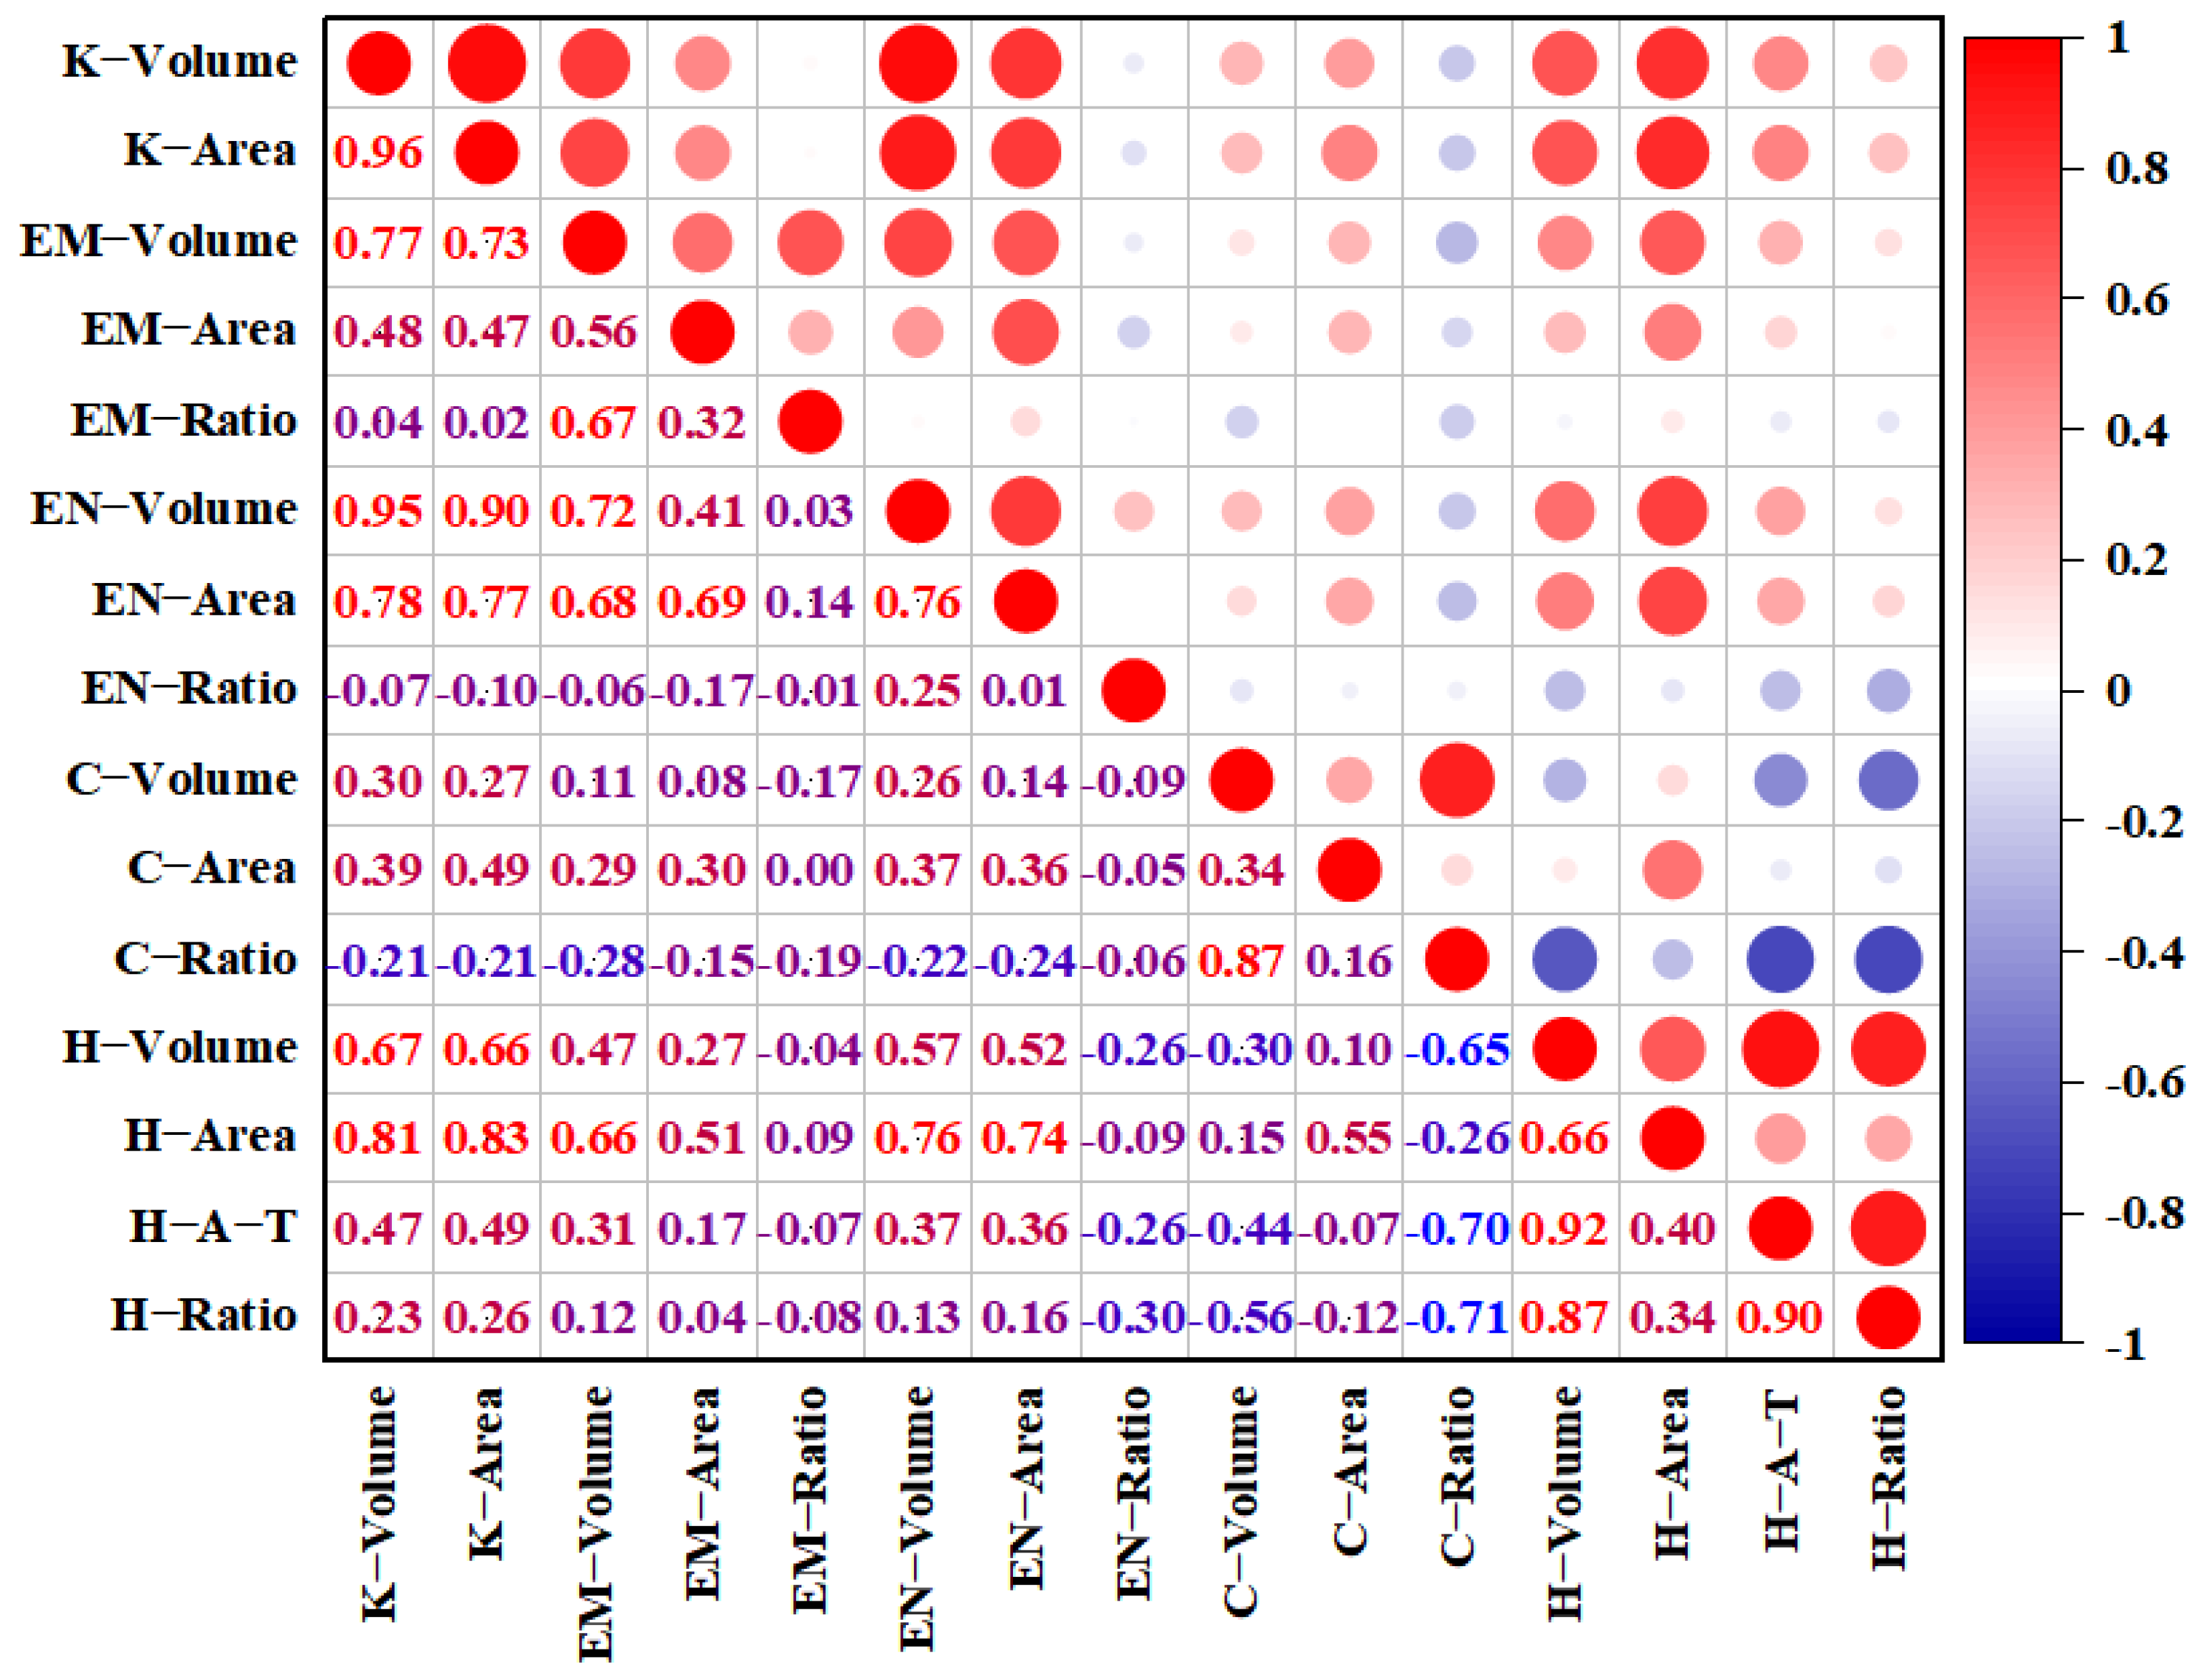
Correlation analysis of grain phenotypic traits revealed significant positive correlations among the volume of the embryo (EM-Volume), the volume of the endosperm (EN-Volume), the volume of the hull (H-Volume), and the volume of the grain (K-Volume), with correlation coefficients of 0.77, 0.95, and 0.67, respectively (Figure 3). H-Volume exhibited positive correlations with the average thickness of the hull (H-A-T), the proportion of hull volume (H-Ratio), and the surface area of the hull (H-Area) with the correlation coefficients of 0.92, 0.87, and 0.66, respectively. The correlation coefficient between H-Ratio and H-A-T was 0.90. The proportion of cavity volume (C-Ratio) showed negative correlations with H-Volume, H-A-T, and H-Ratio, with correlation coefficients of −0.65, −0.70, and −0.71, respectively. C-Ratio exhibited weak negative correlations with the other ten traits.

2.3. Phenotypic Analysis for Foxtail Millet Grains

The grain phenotypic data of the two parents, JG21 and GBS, were collected using Micro-CT. As shown in Table 1, the volume and area of the embryo, endosperm, hull, and whole grain of JG21 were greater compared to GBS. Statistical analysis revealed substantial phenotypic variations in the grain phenotypic traits of the RIL population. The coefficient of phenotypic variation (CV) ranged from 6.71% to 20.57%. Using the online software SPSSAU (https://spssau.com/indexs.html, accessed on 25 July 2025) and the Shapiro–Wilk test method, it was found that only four traits, namely K-Volume, the surface area of the embryo (EM-Area), the surface area of the endosperm (EN-Area), and the proportion of the endosperm volume (EN-Ratio), showed significance (p < 0.05). However, for all traits, the absolute value of skewness was less than 3, and the absolute value of kurtosis was less than 10. This indicates that all traits exhibit a normal distribution.

2.4. Identification of QTLs Related to Grain Structures in Foxtail Millet

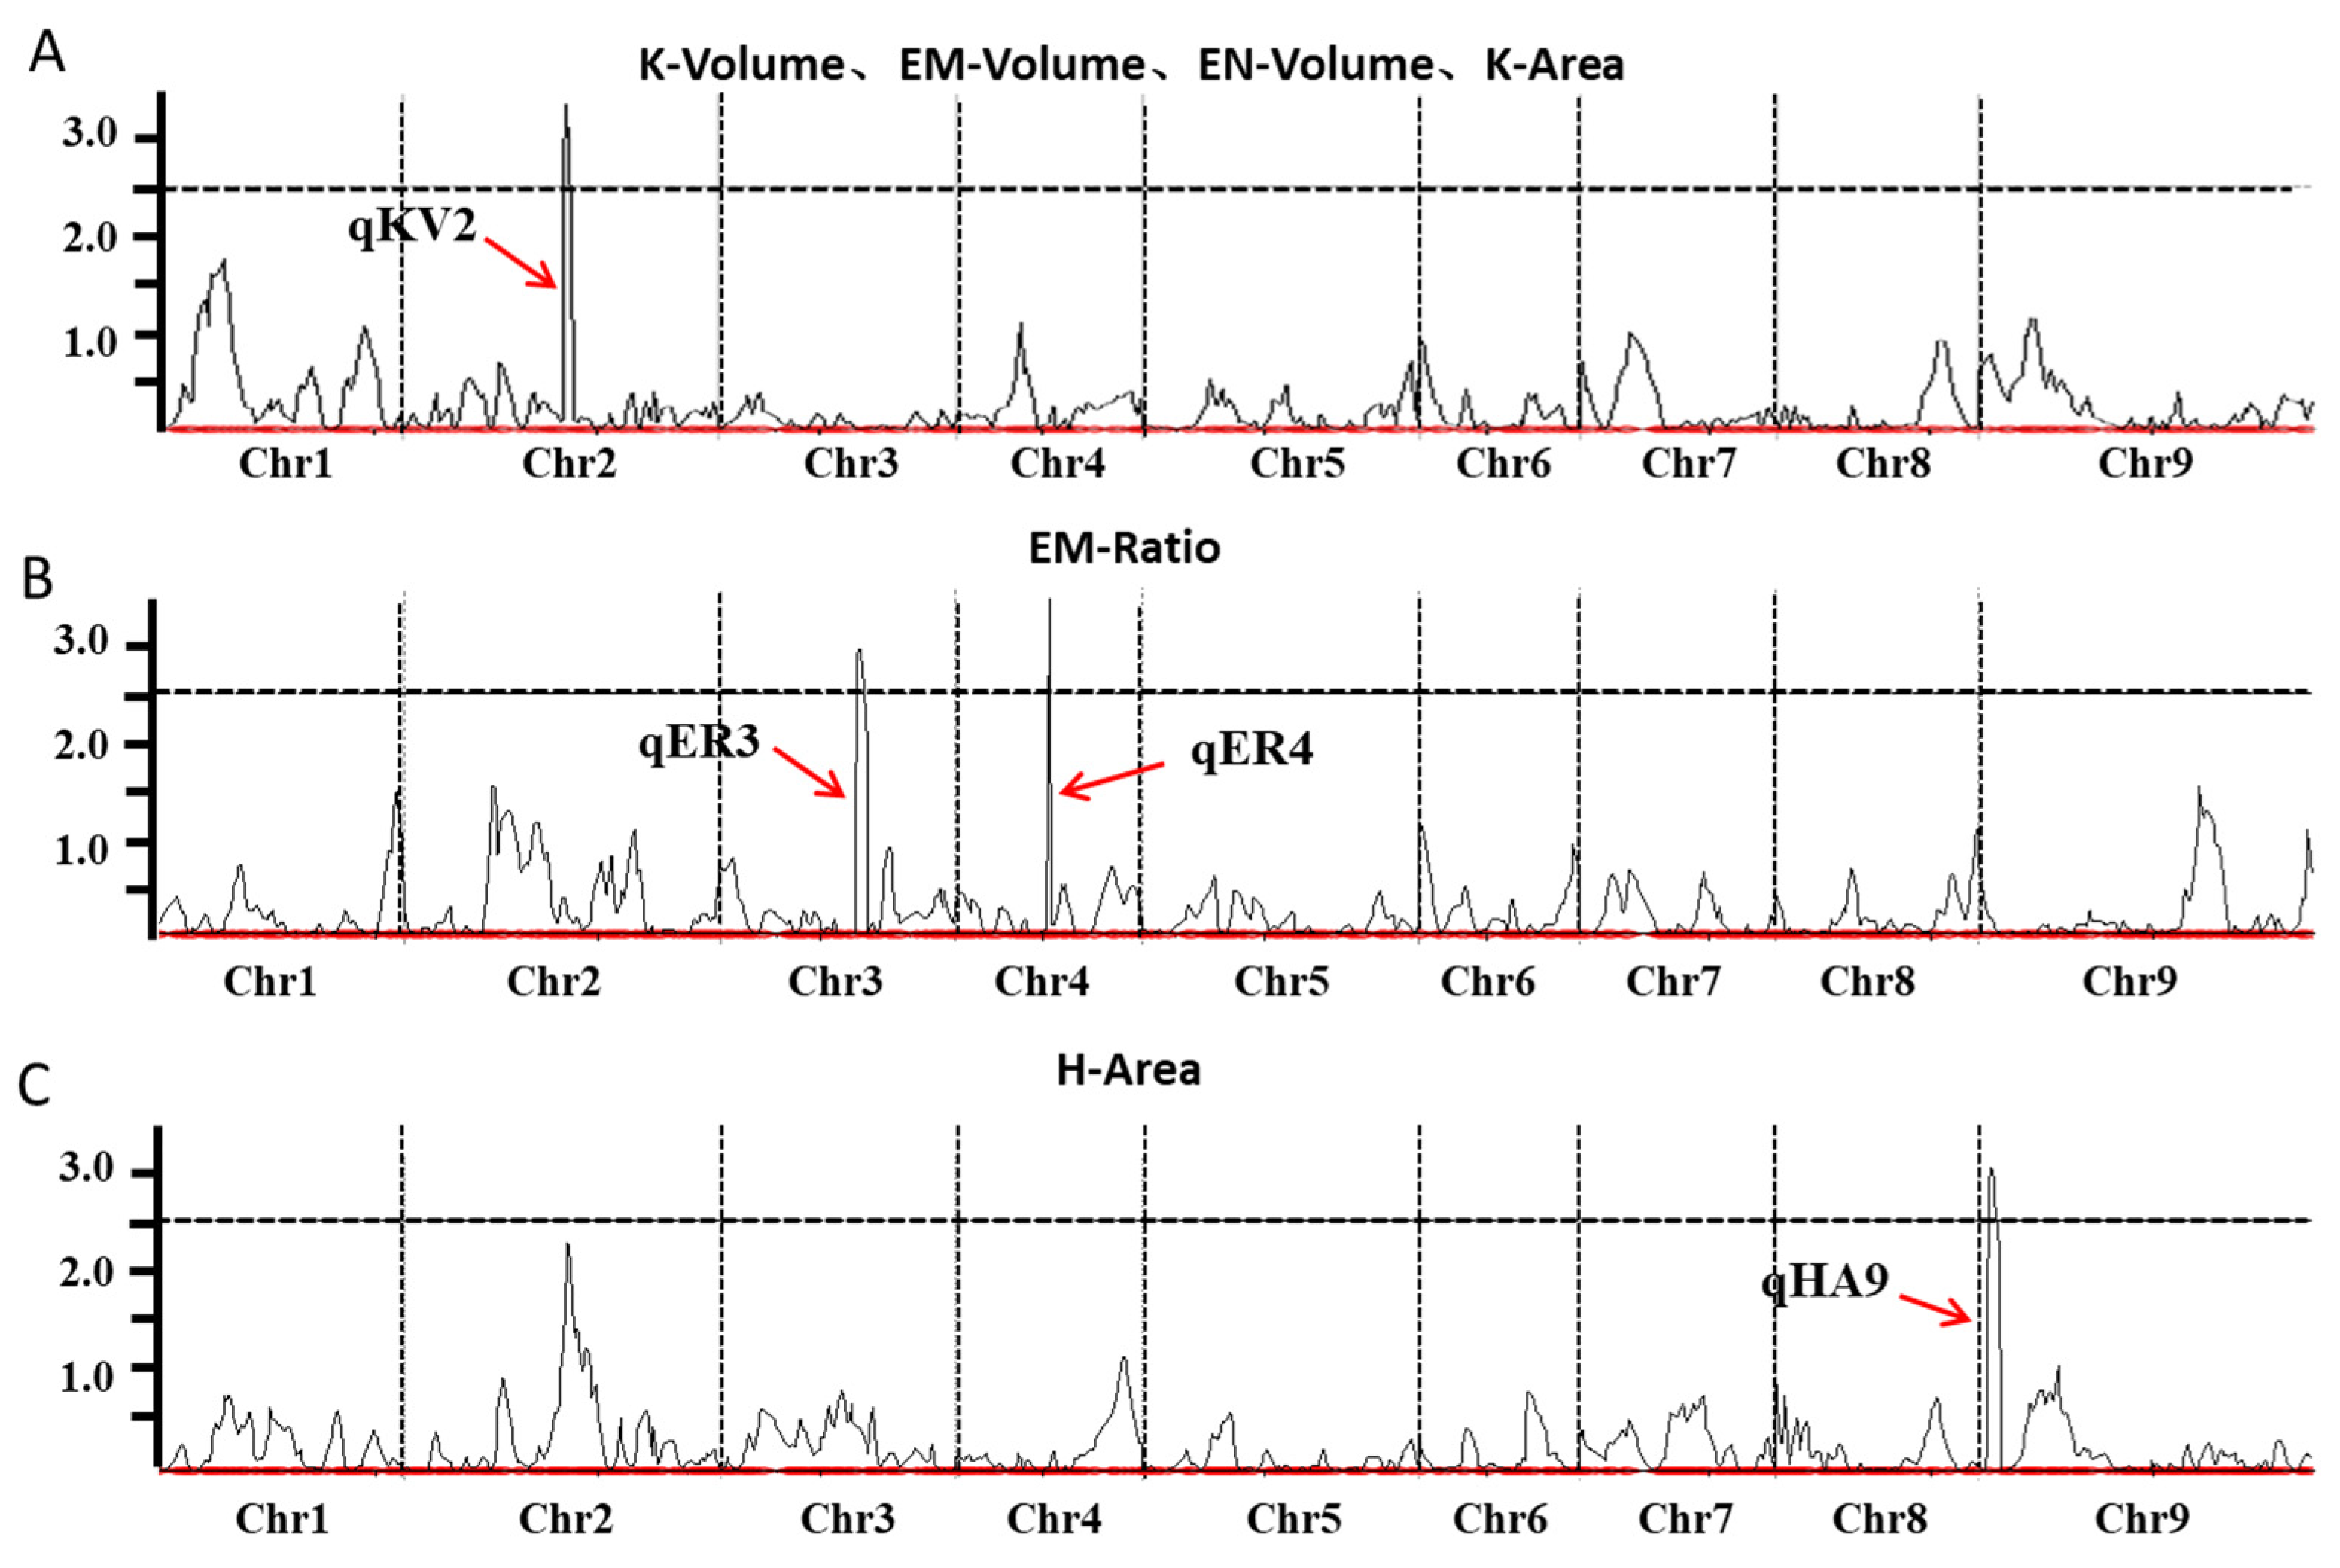
A total of four QTLs were identified for the six traits (Figure 4 and Table 2). One QTL was found on chromosome 2, explaining 14.51~17.09% of the phenotypic variation (PVE) for K-Volume, EM-Volume, EN-Volume, and K-Area, with logarithm of odds scores (LOD) ranging from 2.66 to 3.38. The additive effects (Add) were positive. For EM-Ratio, two QTLs were detected on chromosomes 3 and 4, explaining 11.40% and 12.23% of the PVE, with LOD scores of 2.95 and 3.49, respectively. The Add values were opposite for these QTLs. Additionally, one QTL was identified on chromosome 9 for H-Area, explaining 13.79% of the PVE, with a LOD score of 3.05. The Add value for this QTL was negative.

2.5. Differentially Expressed Genes During Grain Development Between Varieties with Different Grain Structures

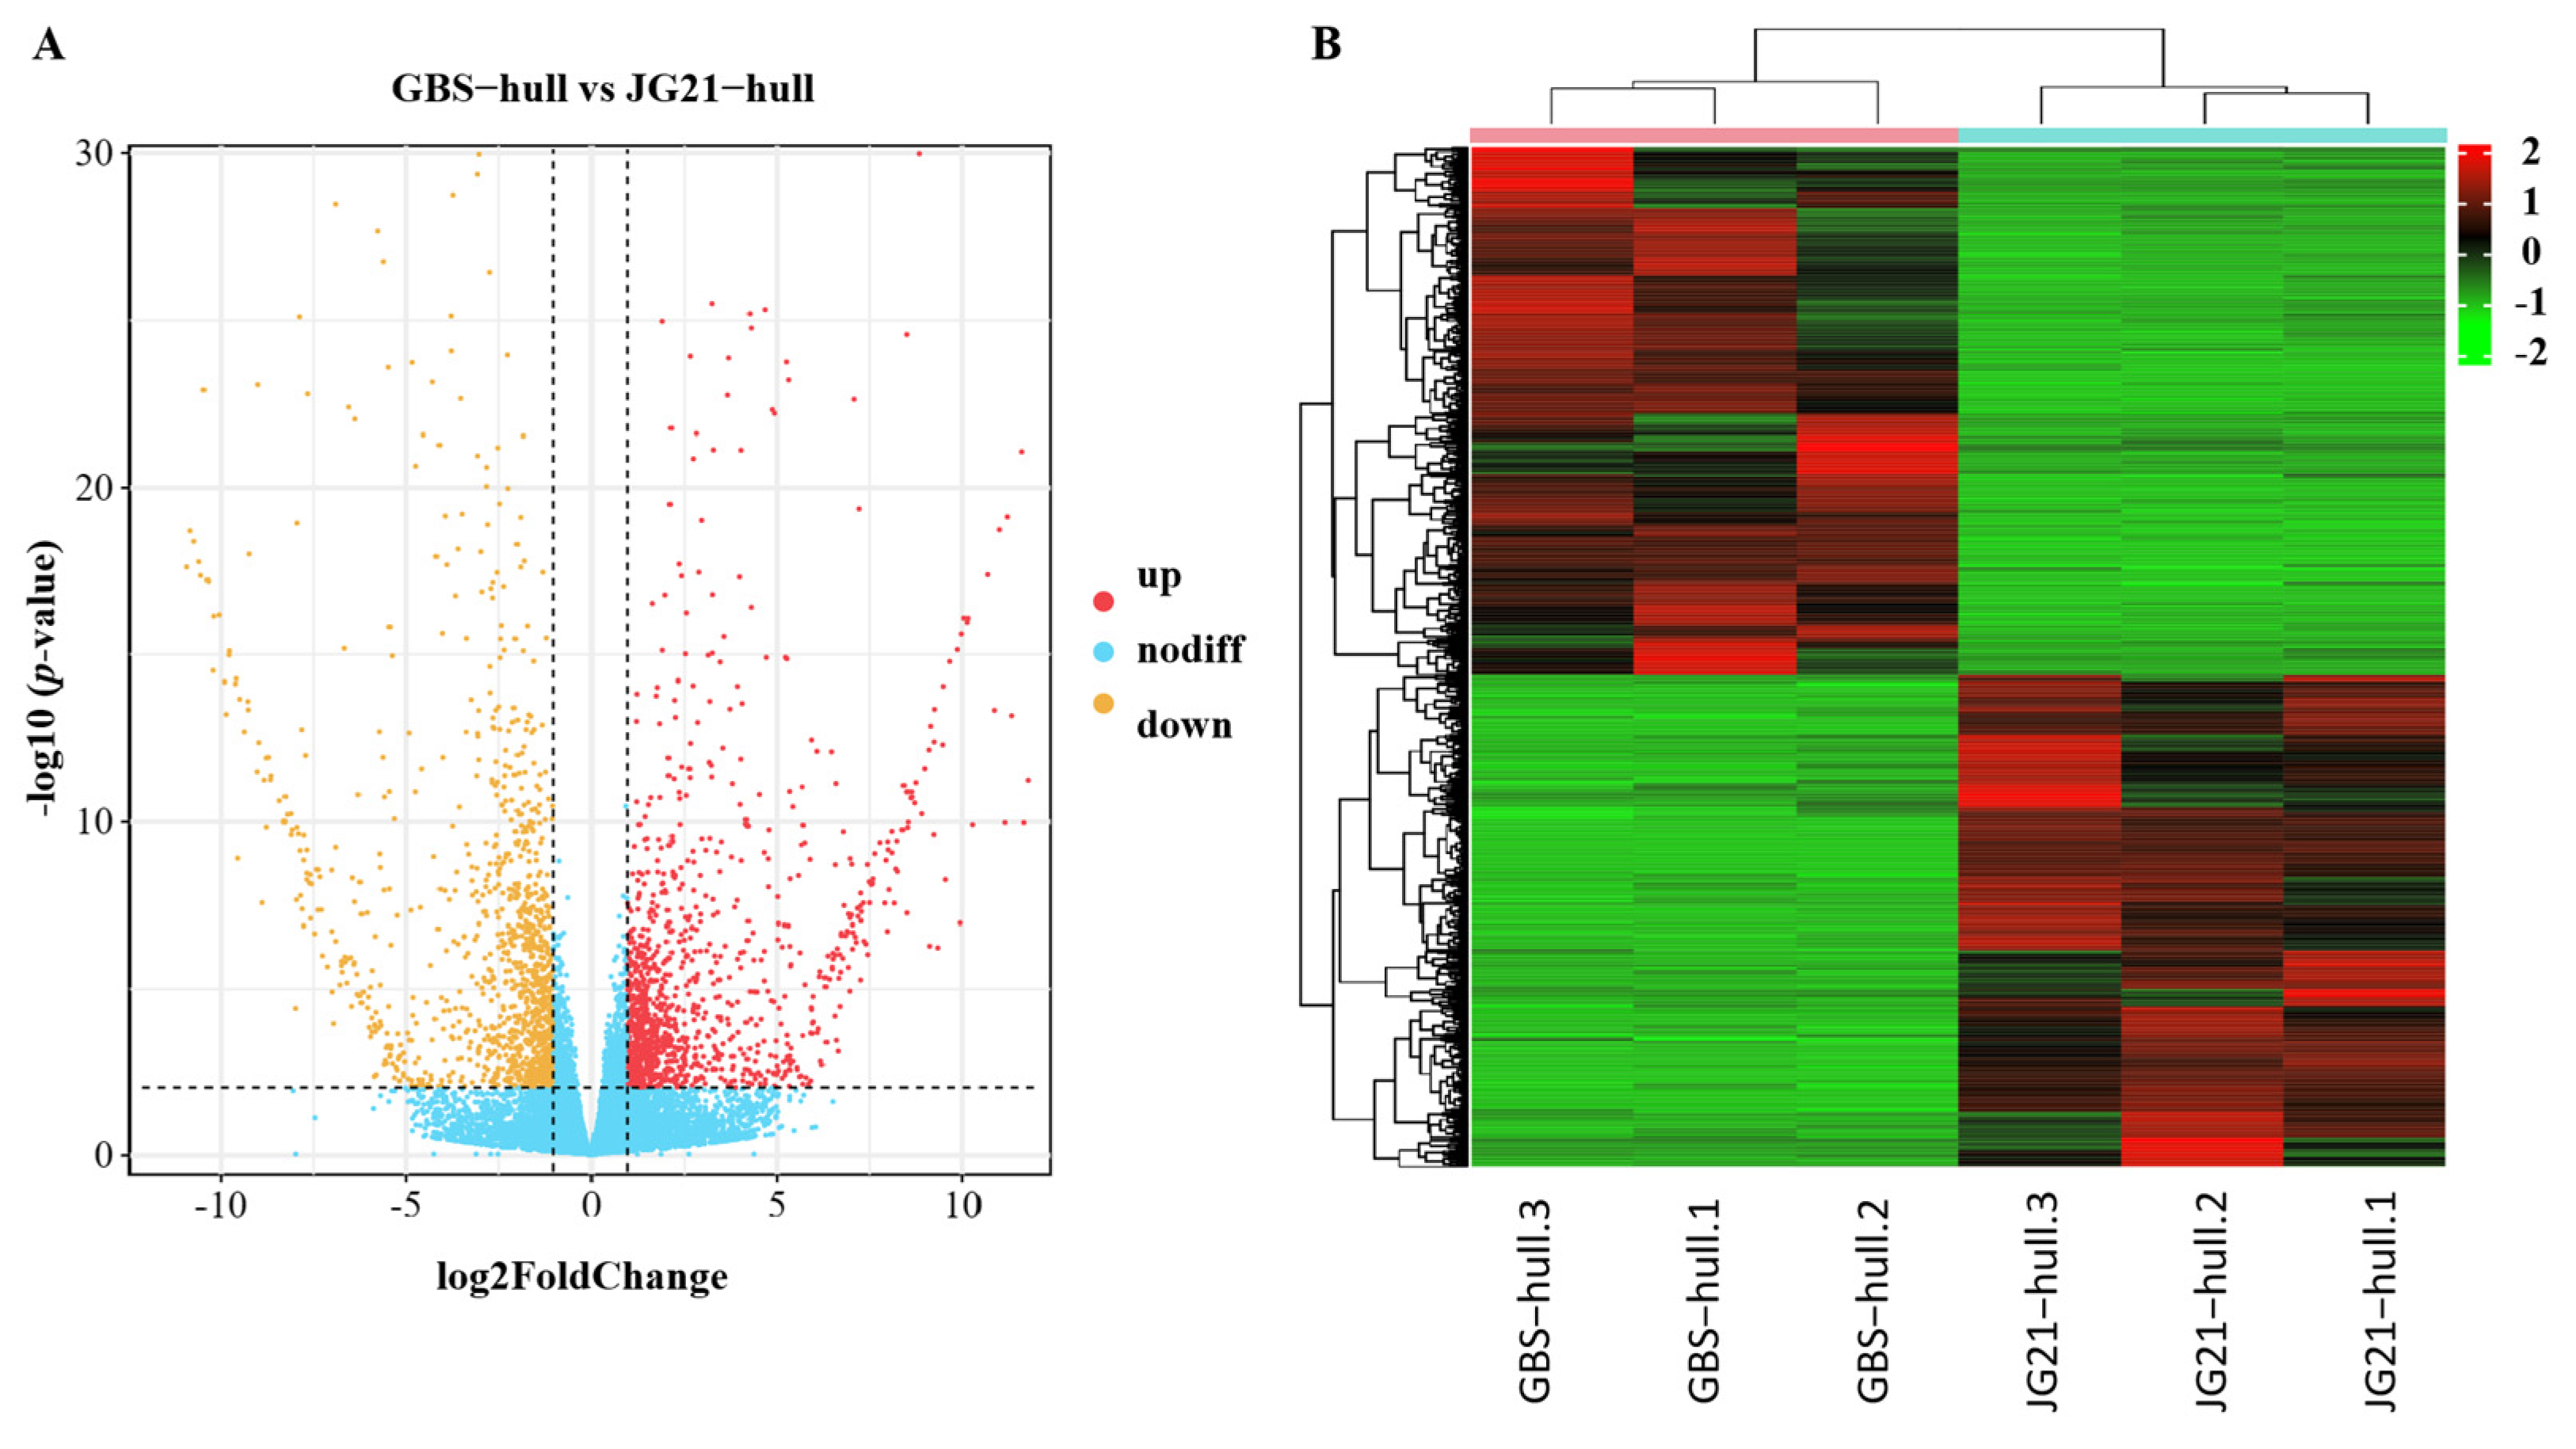
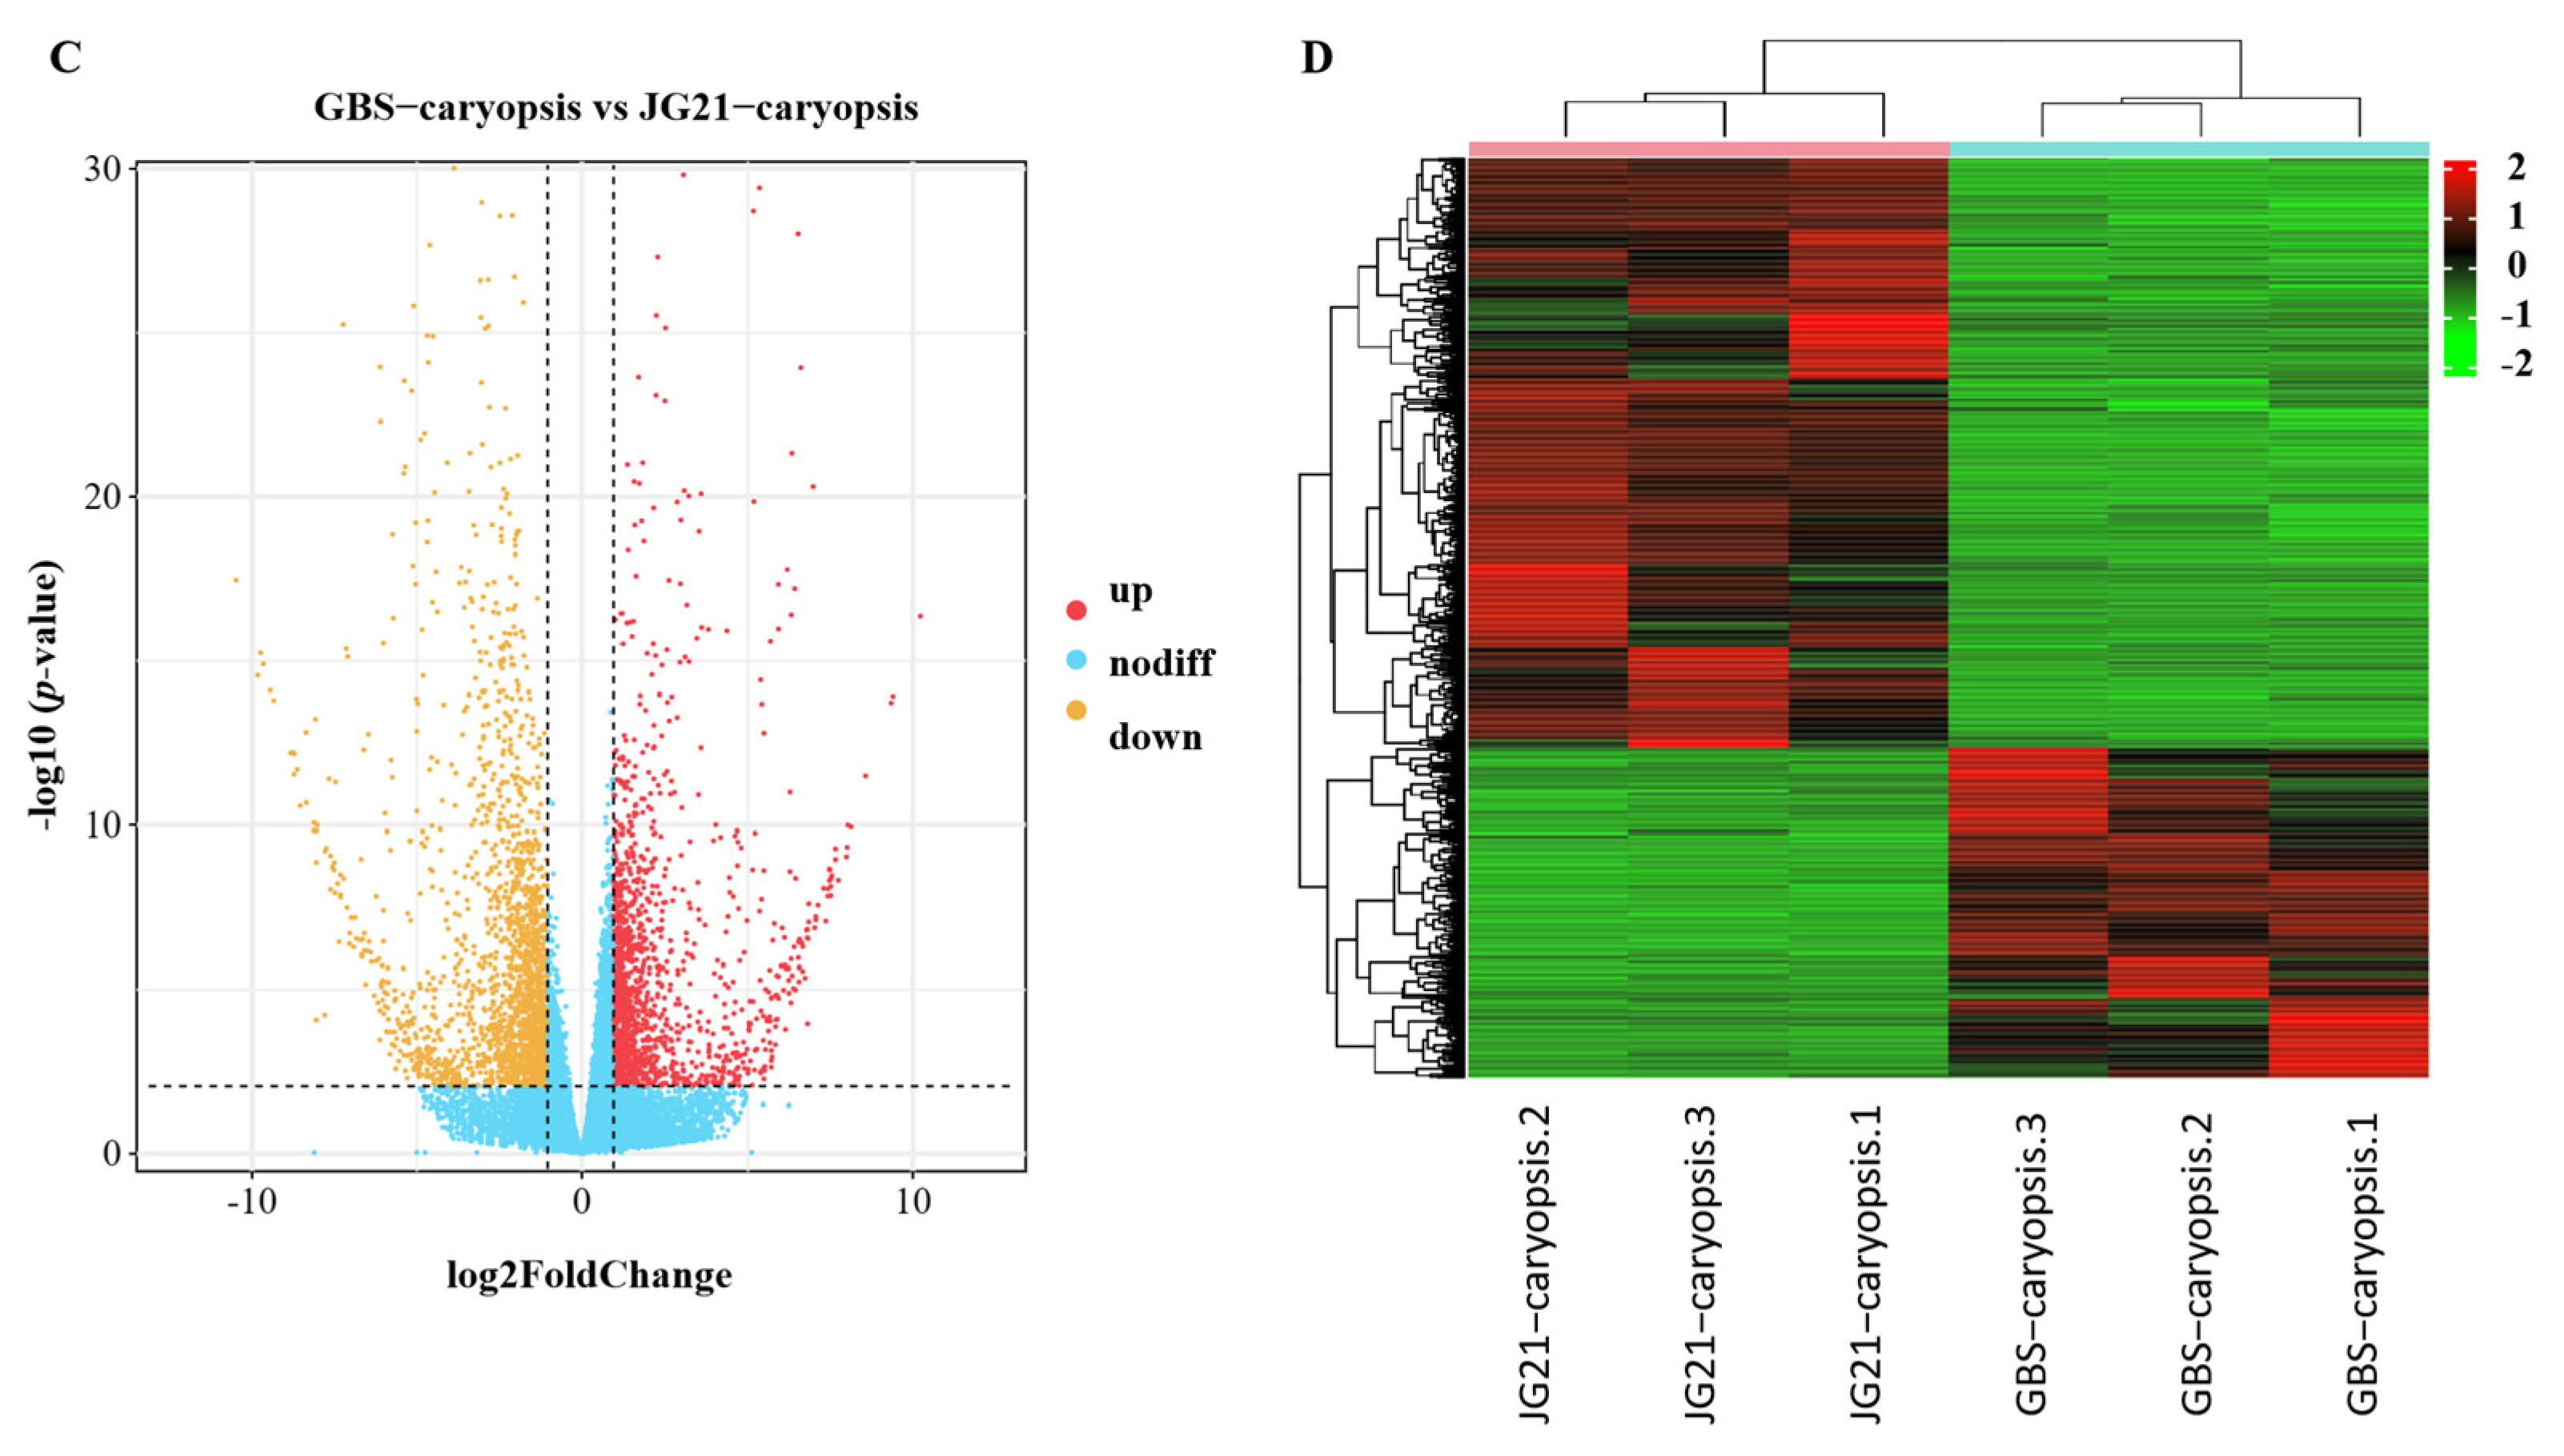
To further identify the candidate genes of grain structural traits, we performed a transcriptome analysis on the caryopsis and hull of two varieties with significantly different grain structures during the mid-grain-filling stage. This resulted in the generation of approximately 88.20 Gb of total nucleotide data from GBS and JG21 through RNA sequencing. We identified a total of 3045 differentially expressed genes (DEGs) in the hull between GBS and JG21 (|log2FoldChange| ≥ 1 and p values < 0.05). Among these genes, 1454 were upregulated and 1591 were downregulated in JG21 (Figure 5A,B and Table S1). We also identified a total of 4312 DEGs in the caryopsis between GBS and JG21 (|log2FoldChange| ≥ 1 and p values < 0.05). Among these genes, 2439 were upregulated and 1873 were downregulated in JG21 (Figure 5C,D and Table S2).

2.6. Expression Analysis of Candidate Genes Related to Grain Structure

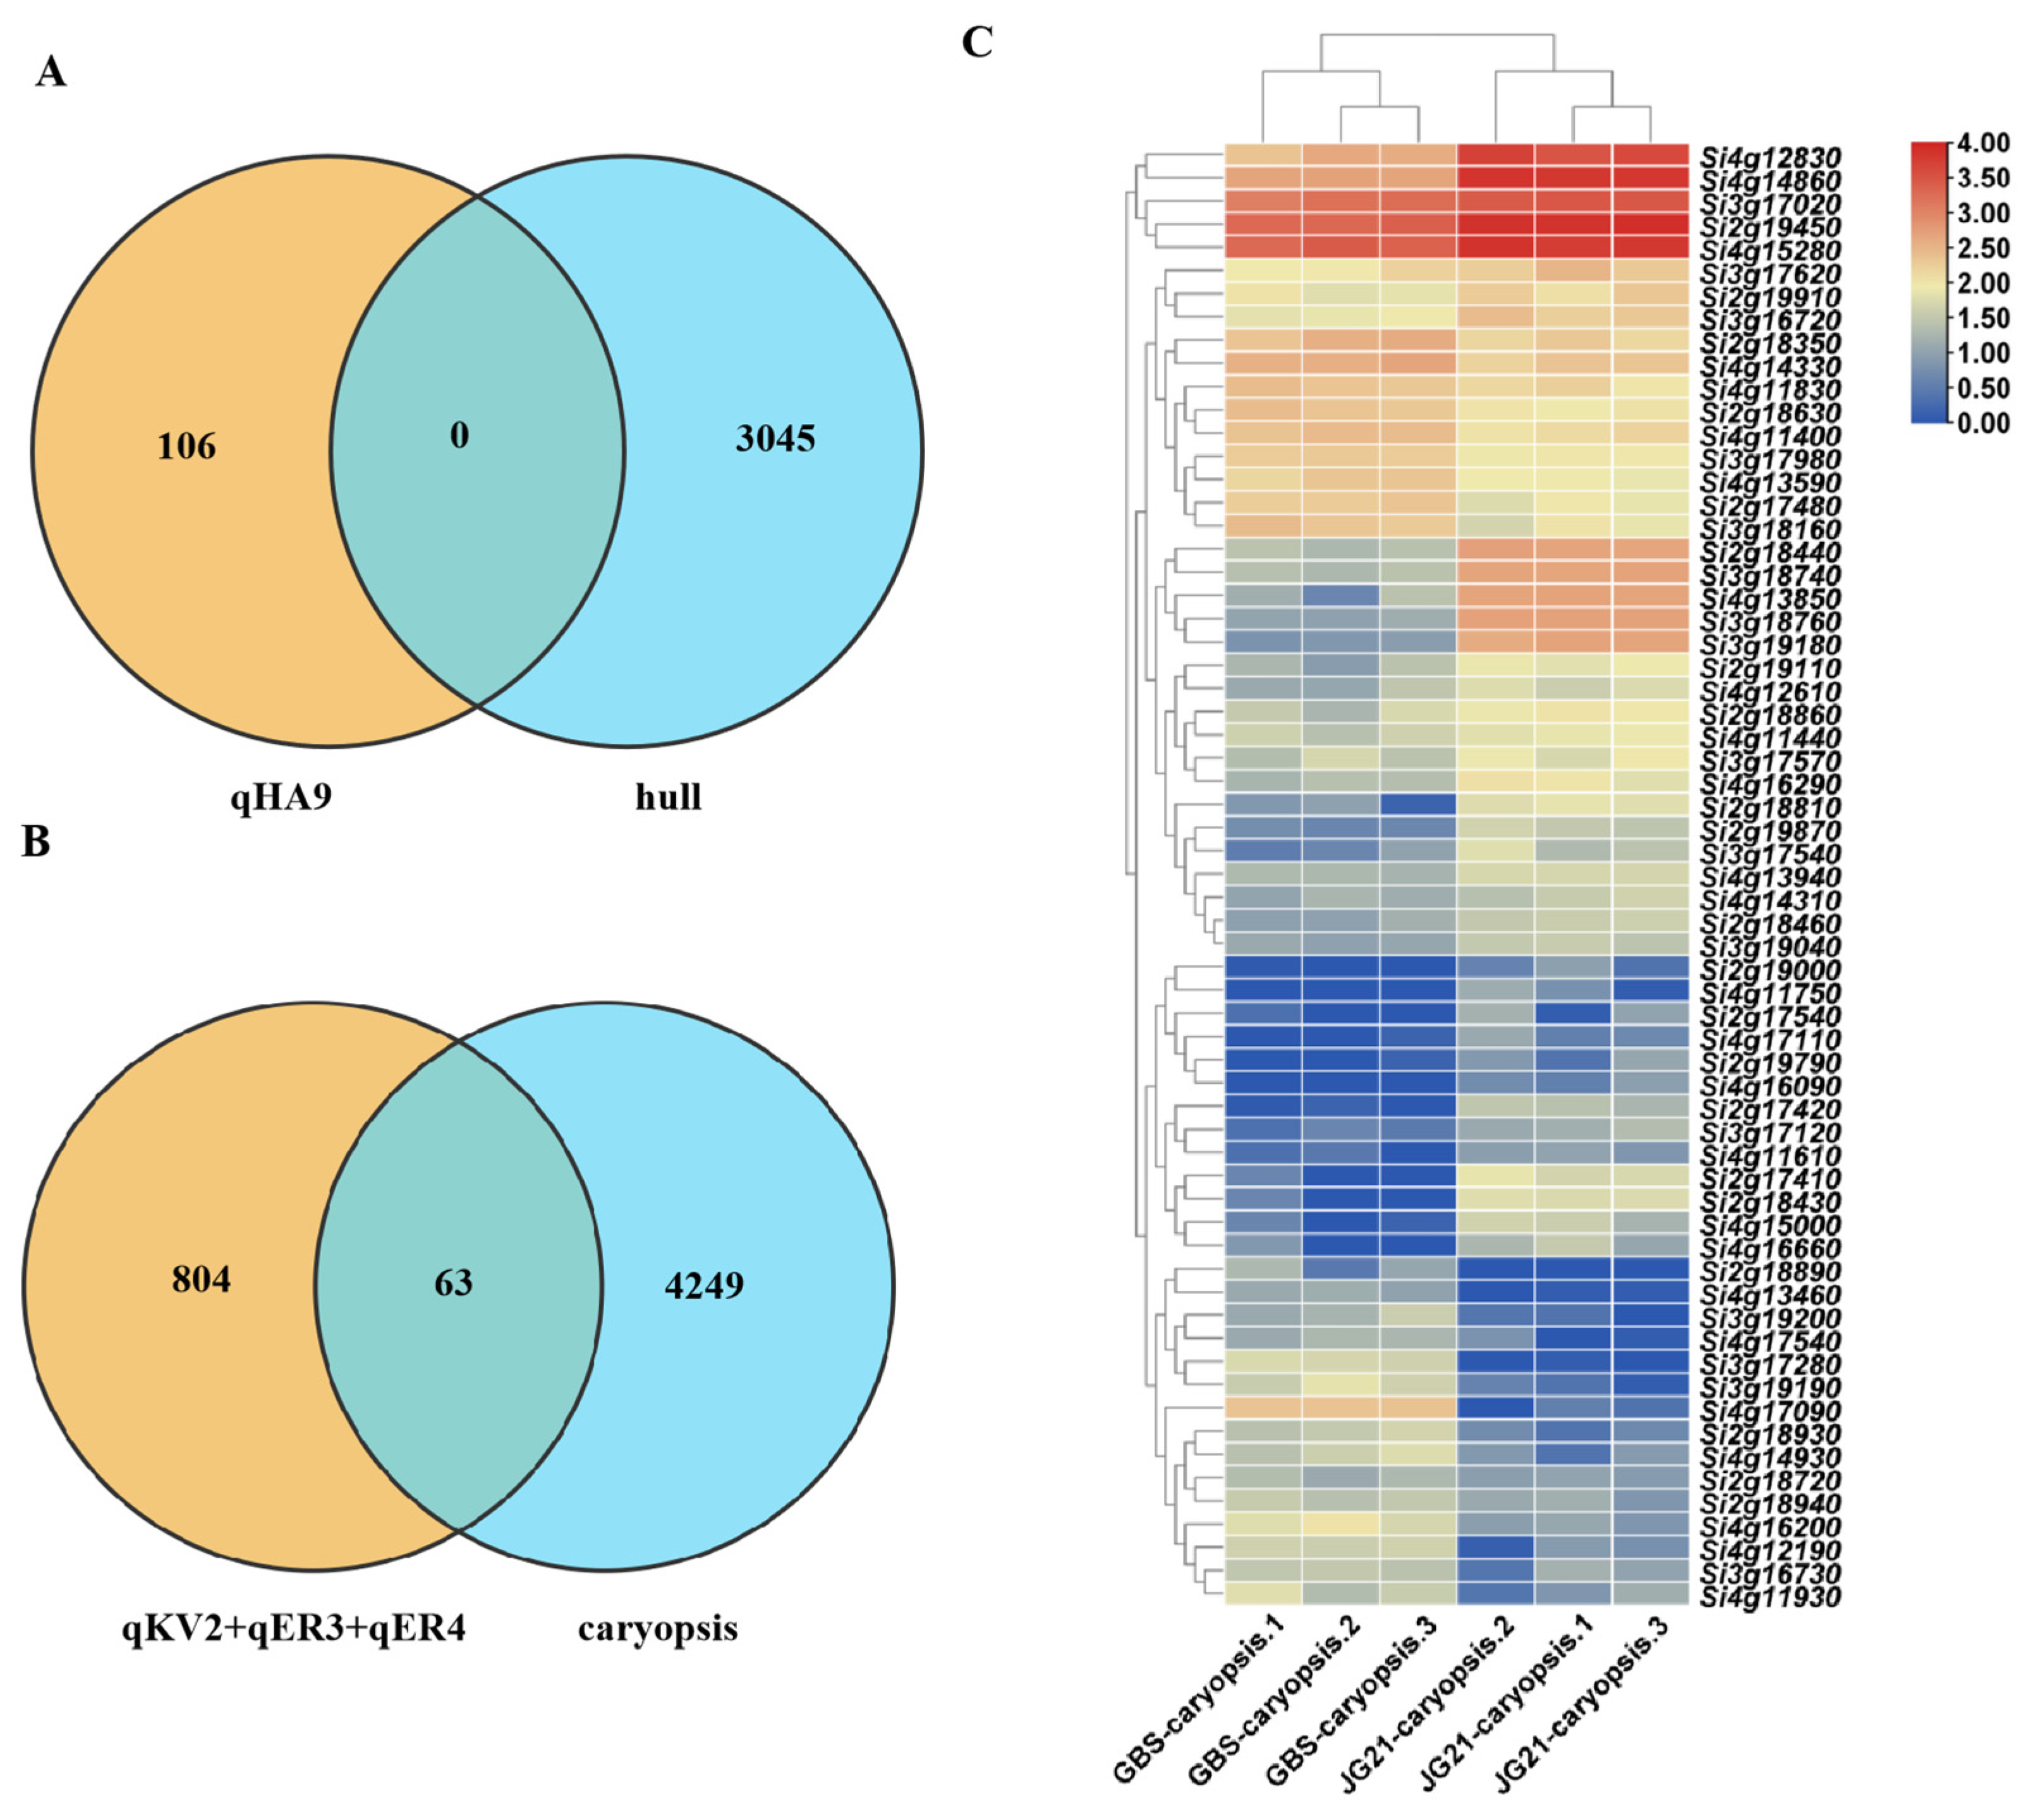
Genes located within the qHA9 interval did not exhibit differential expression in the hulls between GBS and JG21. Within the qKV2, qER3, and qER4 intervals, a total of 63 genes showed differential expression in the caryopsis between GBS and JG21, among which Si2g18440, Si3g18740, Si3g18760, Si3g19180, Si4g12830, Si4g14860, and Si4g17090 displayed significant differences (Figure 6).

2.7. Functional Prediction of Candidate Genes for Grain Structure

A total of seven candidate genes were found to be displaying significant differences within the qKV2, qER3, and qER4 intervals. Their homologous genes in Oryza sativa (L.) were found in the Phytozome 13 database, and the functional annotation information of homologous genes was searched in the China Rice Data Center to preliminarily predict the functions of the candidate genes. According to the annotation of homologous genes, the seven candidate genes were named SiUDP82A1, SiUDP, SiUDP73E1, SiWAT1, SiLEA1, SiLEA31, and SiAP2 (See Table 3).

3. Discussion

Foxtail millet grain structural characteristics play an important role in germination as a rain-fed crop. However, foxtail millet has small grain size and a complex and irregular structure, which makes it difficult to study. Micro-CT technology overcomes the limitations of traditional phenotypic identification and analysis by providing non-destructive three-dimensional structural information of plant tissues [18,21]. This technology opens up opportunities for combined phenotypic and genotypic studies of small grains such as those of foxtail millet. Grain structural traits are quantitative traits controlled by multiple genes [31,36]. We used QTL mapping in combination with transcriptome analysis to identify the candidate genes regulating the traits related to grain structures in foxtail millet.

3.1. Grain Structure Characteristics

Compared to photon- and electron-based tomography, Micro-CT combines the advantages of high resolution and excellent deep penetration. Significant differences in morphology and internal structure were observed with Micro-CT technique among different types of corn grains, and there were also significant correlations among different traits of corn grains [19]. Similarly, using Micro-CT technique we investigated the grain structure characteristics of foxtail millet, and significant differences in grain structure were found among different varieties. There were significant correlations among different traits of foxtail millet, for example, the volume of embryo, endosperm, and husk is significantly positively correlated with the volume of the whole grain. Moreover, we observed noteworthy correlations among different traits of foxtail millet grain. Notably, there was a strong positive correlation between the volumes of the embryo, endosperm, and hull with the whole grain volume.
However, Micro-CT also presents certain limitations, including high cost and a resolution that remains amenable to further enhancement. Specifically, the caryopsis coat—which is thin layers of dead cells closely adhering the endosperm and embryo—is relatively poorly contrasted in the Micro-CT image. Additionally, the degree of rugosity of the lemma, an important character in taxonomic diagnosis, is also imaged with limited contrast, thereby constraining the diagnostic utility of the Micro-CT [25,26].

3.2. QTL Mapping and Identification of Candidate Genes in Combination with Transcriptome Profiling

Quantitative trait loci (QTL) mapping is increasingly important in molecular breeding, including marker-assisted selection (MAS) and gene discovery. In recent years, researchers have utilized germplasm materials with various genetic backgrounds to create populations for QTL mapping of important agronomic traits in foxtail millet [27,28]. In this study, we conducted QTL mapping of grain structure traits using 100 lines of a RIL population and identified a total of four QTLs for six traits. The whole grain volume, embryo volume, endosperm volume, and whole grain area were all located within the same genomic region. Integrating quantitative traits and transcriptome analysis can effectively narrow down the localization region or reduce the number of candidate genes [29,30]. In this study, QTL mapping combined with transcriptome analysis revealed 63 genes showing differential expression within the QTL interval in parent grains. Subsequently, the nucleic acid and amino acid sequences of these 63 genes were compared and searched in multiple databases, resulting in the identification of 7 genes that are associated with grain size (Table 3).
Studies in rice and Arabidopsis have demonstrated that proteins participating in signaling pathways mediated by proteasomal degradation, phytohormones, and G proteins regulate seed size by influencing cell proliferation and cell elongation [37]. Ethylene-responsive transcription factors play a significant regulatory role in various biological and physiological processes, such as plant morphogenesis, stress response mechanisms, hormone signaling, and metabolite regulation. In rice, the APETALA2/ethylene-responsive element binding protein family transcription factor, rsr1 mutants, exhibit larger grain size, increased grain mass, and therefore higher yield [35]. In this study, the candidate gene SiAP2 was annotated as an ethylene-responsive transcription factor. Its expression level in the caryopsis of JG21 was significantly lower than that of GBS, whereas the grain volume of JG21 was larger than that of GBS, indicating that this transcription factor may negatively regulate grain size.
Auxin plays a crucial role in plant cell elongation and division. Arabidopsis WALLS ARE THIN1 (WAT1) facilitates auxin export from vacuoles and is required for auxin homeostasis [33]. In this study, the candidate gene SiWAT1 was identified as the WAT1-related protein At5g07050. Its expression level in the caryopsis of JG21 was higher than that of GBS, suggesting a potential role in auxin transport within the grains, thereby contributing to increased grain size.
Flavonoids directly influence auxin transporter, distribution, activity, and content, thereby regulating polar auxin transport. UDP-glycosyltransferases regulate flavonoid activity and stability. In rice, GSA1 encodes a UDP-glucosyltransferase that exhibits glucosyltransferase activity toward flavonoids. GSA1 regulates grain size by modulating cell proliferation and expansion [31]. Natural variations in EDR1 (Endosperm Development in Rice) significantly reduced UDP-glucosyltransferase activity, resulting in abnormal endosperm development in the paddy rice. EDR1 and GSA1 might have similar functions [32]. In our study, the candidate genes SiUDP82A1 and SiUDP73E1 were predicted to encode UDP-glycosyltransferases, while SiUDP was predicted to encode a UDP-glucosyl transferase. The expression level of SiUDP82A1 in the caryopsis of JG21 was significantly higher than that of GBS, indicating that it may serve as a major gene involved in the regulation of caryopsis size. On the other hand, the expression levels of SiUDP and SiUDP73E1 in the caryopsis of JG21 were slightly higher than in GBS, suggesting they may act as minor genes involved in regulating grain size.
Arabidopsis mutant mdn1-1 exhibits an increased seed size and over-accumulation of LEA (Late Embryogenesis Abundant) proteins in the dry seeds [34]. In our study, candidate genes SiLEA1 and SiLEA31 were predicted to encode LEA proteins. Interestingly, their expression levels in the caryopsis of JG21 were significantly higher than that of GBS, suggesting their potential role in regulating grain size.
Although many genes related to grain structure have been identified in other species, few have been studied in foxtail millet. Therefore, it is necessary to validate the function of these genes we identified to uncover the regulatory genes governing grain structure in foxtail millet.

4. Materials and Methods

4.1. Plant Materials

The grains were derived from a population of RILs constructed by germplasms GBS and JG21, which was previously described by Ma et al. [38]. A total of 100 lines and 2 parents were selected for this study. The plants were cultivated in the experimental field of Shanxi Agricultural University (37.43° N, 112.59° E) in 2021. The experimental site was a type of brown soil, with medium soil fertility, and the terrain was flat. The altitude of the experimental site was 802 m, the average annual temperature was 9.7 °C, the average annual precipitation was 440.7 mm, the average annual wind speed was 2.3 m/s, and the minimum daily sunshine duration was 253.5 h. Each variety was planted in 2 rows, with a row length of 2.5 m and a row spacing of 0.4 m. The seeds were sown in mid-May and harvested in early October. No fertilization or any chemical reagents were used in the field. After the grains mature, three panicles with consistent growth were chosen from the same plants. After natural drying (the water content of the dry seeds was about 14% as determined by the FOSS NIRS DS2500), the grains from the middle of the panicles were collected for Micro-CT scanning. For transcriptome sequencing, grains were taken from the middle panicle of both parents at the mid-grain filling stage and stored in liquid nitrogen.

4.2. Data Acquisition and Analysis

X-ray scanning of the foxtail millet grains was performed in the institute of genetics and developmental biology, Chinese academy of sciences (IGDB, CAS, Beijing, China) [39]. The scanning parameters included a spatial resolution of 3 μm, an acceleration energy of 60 kV, a current of 100 μA, and a detector exposure time of 0.3 s. Each grain underwent a 24 min scanning process, acquiring 720 frames for subsequent image reconstruction and analysis. A series of reconstructed virtual images of grain cross-section in 16-unbit BMP format were obtained using VoxelStudio Recon (Sanying Precision Instruments Co., Ltd., Tianjin, China, V2.2.3.6) software.
Traditional OpenCV image processing techniques were utilized for the segmentation and reconstruction of CT images. Based on the varying X-ray absorption of different substances, the CT images were processed using Otsu’s automatic thresholding method. By minimizing inter-class variance, the optimal threshold was determined to effectively extract the target objects in the CT images. Subsequently, a multi-stage edge detection process based on the classic Canny edge detection algorithm efficiently captured edge information in the images, providing a reliable foundation for subsequent segmentation. Following the edge detection operations, the image boundaries were selected for region growing. By aggregating adjacent pixels based on pixel similarity, regions with similar attributes were formed, and then each region in the 2D CT image was assigned a separate label and color using region growing techniques. Finally, segmentation of various portions in the images was achieved.
The AVIZO software (https://en.wikipedia.org/wiki/Avizo, accessed on 3 June 2025) was then employed to calculate various parameters, including the volume (in mm3) of the whole grain (K-Volume), embryo (EM-Volume), endosperm (EN-Volume), cavity (C-Volume), and hull (H-Volume); the surface area (in mm2) of the whole grain (K-Area), embryo (EM-Area), endosperm (EN-Area), cavity (C-Area), and hull (H-Area); and the average hull thickness (H-A-T) in millimeters. Finally, the ratios of embryo volume (EM-Ratio), endosperm volume (EN-Ratio), cavity volume (C-Ratio), and hull volume (H-Ratio) to the whole grain volume were calculated using Excel (Microsoft Office Excel 2007).

4.3. QTL Mapping and Transcriptome Analysis

The genotypic data [39,40] and trait data were analyzed with QTL IciMapping 4.2 software to detect QTLs [41]. The inclusion composite interval mapping (ICIM) method was used to calculate p-values. The QTL analysis was performed using the BIP function with Step (cM) = 1, PIN = 0.01 and permutation times were 1000 (Table S3). QTLs with LOD scores exceeding 2.5 were identified, and the confidence intervals were estimated using the 2.0 LOD-drop method. The QTLs were named using the letter ‘q’, followed by the trait abbreviation and chromosome number. Furthermore, to narrow down the range of candidate genes, we selected developing grains with similar growth characteristics from the middle portion of the two parental panicles at the middle grain filling stage for transcriptome sequencing. The cDNA library preparations and sequencing experiments were conducted by the sequencing cooperation of Novogene Co., Ltd. (Beijing, China).

4.4. Functional Analysis of Candidate Genes

Genes within the QTL physical interval were identified and downloaded from MDSi: Multi-omics Database for Setaria italica (http://sky.sxau.edu.cn/MDSi.htm, accessed on 5 September 2025). The KEGG enrichment analysis was performed using OmicShare Tools (https://www.omicshare.com, accessed on 20 September 2025).

5. Conclusions

Micro-CT scanning can quickly obtain three-dimensional non-destructive structural images of foxtail millet grains. By combining the differences in X-ray absorption rates of different portions in foxtail millet grains with tissue edge recognition technology, each portion can be successfully segmented. The volumes and surface areas of each portion can be calculated using AVIZO. By integrating QTL mapping and transcriptome analysis, candidate genes related to the structure of foxtail millet grains were screened out. This study has, for the first time, established a three-dimensional phenotypic analysis system for the grain structure in foxtail millet, laying the foundation for a deeper understanding of the formation of foxtail millet grain structure.

Supplementary Materials

The following supporting information can be downloaded at https://www.mdpi.com/article/10.3390/plants14233603/s1. Table S1: The differentially expressed genes identified in the hull between GBS and JG21. Table S2: The differentially expressed genes identified in the caryopsis between GBS and JG21. Table S3: The empirical LOD threshold (at 95% confidence) obtained from the permutation test.

Author Contributions

Conceptualization, Y.H. and X.L.; data curation, M.T. and Y.Y.; formal analysis, J.Z. and D.G.; funding acquisition, Y.H.; investigation, B.L. and Y.M.; methodology, M.T. and Y.Y.; project administration, X.L.; resources, S.H., F.M. and X.L.; software, Y.M. and J.H.; supervision, X.L.; validation, M.T. and Y.Y.; visualization, J.Z. and D.G.; writing—original draft preparation, M.T.; writing—review and editing, Y.Y., F.M., X.L., S.H., J.H. and Y.H. All authors have read and agreed to the published version of the manuscript.

Funding

The research was funded by the National Natural Science Foundation of China (NSFC) (U21A20216), Innovation Project of Shanxi Foxtail Millet Industry (202104010911013-1), Program for the Scientific Activities of Selected Returned Overseas Professionals in Shanxi Province (20220015), SXAU Initiation Project (2023BQ27), National Foxtail Millet Breeding Network Program (gzlg-01), and Shanxi Key Research Project (2022ZDYF108).

Data Availability Statement

The raw sequencing data generated in this study are available in SRA (https://www.ncbi.nlm.nih.gov/sra, accessed on 9 October 2025) of NCBI with the accession numbers PRJNA1338945.

Acknowledgments

We would like to thank the Sanying Precision Instruments Company Limited (Tianjin, China) for their assistance.

Conflicts of Interest

The authors declare no conflicts of interest.

Abbreviations

The following abbreviations are used in this manuscript:
QTLQuantitative trait loci
RILsRecombination inbred lines
SEMScanning Electron Microscopy
TEMTransmission electron microscope
CVCoefficient of phenotypic variation
PVEPhenotypic variation
LODLogarithm of odds scores
AddAdditive effects
DEGsDifferentially expressed genes

References

  1. Lu, H.Y.; Zhang, J.P.; Liu, K.B.; Wu, N.Q.; Li, Y.M.; Zhao, K.S.; Ye, M.L.; Zhang, T.Y.; Zhang, H.J.; Yang, X.Y.; et al. Earliest domestication of common millet in East Asia extended to 10,000 years ago. Proc. Natl. Acad. Sci. USA 2009, 106, 7367–7372. [Google Scholar] [CrossRef] [PubMed]
  2. Li, H.X.; Tian, G.; Wang, Y.W.; Liu, X.; Liu, H. Genetic correlation coefficients of foxtail millet traits between parents and hybrids. Sci. Agric. Sin. 2020, 53, 239–246. [Google Scholar]
  3. Jia, G.Q.; Huang, X.H.; Zhi, H.; Zhao, Y.; Zhao, Q.; Li, W.J.; Chai, Y.; Yang, L.F.; Liu, K.Y.; Lu, H.Y.; et al. A haplotype map of genomic variations and genome-wide association studies of agronomic traits in foxtail millet (Setaria italica). Nat. Genet. 2013, 45, 957–961. [Google Scholar] [CrossRef] [PubMed]
  4. Diao, X.M.; Wang, L.W.; Zhi, H.; Zhang, J.; Li, S.G.; Cheng, R.H. Development, genetic deciphering and breeding utilization of dwarf lines in foxtail millet. Acta Agron. Sin. 2024, 50, 265–279. [Google Scholar] [CrossRef]
  5. Tan, M.; Yang, Y.; Chen, Z.; Gong, X.; Ma, F.; Duan, M.; Wang, L.; Han, Y. Identification of candidate genes related to the husk papillae in foxtail millet (Setaria italica (L.) P. Beauv). Plants 2025, 14, 2535. [Google Scholar] [CrossRef]
  6. Zhu, Z.H.; Sami, A.; Chen, Z.P.; Fatima, M.; Zheng, W.Y.; Xu, Q.Q.; Lei, Y.H.; Jin, X.Z.; Zhang, H.; Li, Y.; et al. Effects of microscopic testa color and morphology on the water uptake ability and drought tolerance of germination-stage rapeseed (Brassica napus L.). Bioengineered 2021, 12, 9341–9355. [Google Scholar] [CrossRef]
  7. Cloetens, P.; Mache, R.; Schlenker, M.; Lerbs-Mache, S. Quantitative phase tomography of Arabidopsis seeds reveals intercellular void network. Proc. Natl. Acad. Sci. USA 2006, 103, 14626–14630. [Google Scholar] [CrossRef] [PubMed]
  8. Xu, A.H.; Wei, C.X. Comprehensive comparison and applications of different sections in investigating the microstructure and histochemistry of cereal kernels. Plant Methods 2020, 16, 8. [Google Scholar] [CrossRef]
  9. Wu, X.B.; Liu, J.X.; Li, D.Q.; Liu, C.M. Rice caryopsis development I: Dynamic changes in different cell layers. J. Integr. Plant Biol. 2016, 58, 772–785. [Google Scholar] [CrossRef]
  10. Prunet, N.; Duncan, K. Imaging flowers: A guide to current microscopy and tomography techniques to study flower development. J. Exp. Bot. 2020, 71, 2898–2909. [Google Scholar] [CrossRef]
  11. Rawson, S.D.; Maksimcuka, J.; Withers, P.J.; Cartmell, S.H. X-ray computed tomography in life sciences. BMC Biol. 2020, 18, 21. [Google Scholar] [CrossRef] [PubMed]
  12. Littlejohn, G.R.; Gouveia, J.D.; Edner, C.; Smirnoff, N.; Love, J. Perfluorodecalin enhances in vivo confocal microscopy resolution of Arabidopsis thaliana mesophyll. New Phytol. 2010, 186, 1018–1025. [Google Scholar] [CrossRef]
  13. Kurihara, D.; Mizuta, Y.; Sato, Y.; Higashiyama, T. ClearSee: A rapid optical clearing reagent for whole-plant fluorescence imaging. Development 2015, 142, 4168–4179. [Google Scholar] [CrossRef]
  14. Bhawana; Miller, J.L.; Cahoon, A.B. 3D plant cell architecture of Arabidopsis thaliana (Brassicaceae) using focused ion beam-scanning electron microscopy. Appl. Plant Sci. 2014, 2, 1300090. [Google Scholar] [CrossRef]
  15. Kittelmann, M.; Hawes, C.; Hughes, L. Serial block face scanning electron microscopy and the reconstruction of plant cell membrane systems. J. Microsc. 2016, 263, 200–211. [Google Scholar] [CrossRef] [PubMed]
  16. Czymmek, K.; Sawant, A.; Goodman, K.; Pennington, J.; Pedersen, P.; Hoon, M.; Otegui, M.S. Imaging plant cells by high-pressure freezing and serial block-face scanning electron microscopy. Methods Mol. Biol. 2020, 2177, 69–81. [Google Scholar] [CrossRef] [PubMed]
  17. Harwood, R.; Goodman, E.; Gudmundsdottir, M.; Huynh, M.; Musulin, Q.; Song, M.; Barbour, M.M. Cell and chloroplast anatomical features are poorly estimated from 2D cross-sections. New Phytol. 2020, 225, 2567–2578. [Google Scholar] [CrossRef] [PubMed]
  18. Duncan, K.E.; Czymmek, K.J.; Jiang, N.; Thies, A.C.; Topp, C.N. X-ray microscopy enables multiscale high-resolution 3D imaging of plant cells, tissues, and organs. Plant Physiol. 2022, 188, 831–845. [Google Scholar] [CrossRef]
  19. Li, D.Z.; Wang, J.L.; Zhang, Y.; Lu, X.J.; Du, J.J.; Guo, X.Y. CT-based phenotyping and genome-wide association analysis of the internal structure and components of maize kernels. Agronomy 2023, 13, 1078. [Google Scholar] [CrossRef]
  20. Kunishima, N.; Takeda, Y.; Hirose, R.; Kalasová, D.; Šalplachta, J.; Omote, K. Visualization of internal 3D structure of small live seed on germination by laboratory-based X-ray microscopy with phase contrast computed tomography. Plant Methods 2020, 16, 7. [Google Scholar] [CrossRef]
  21. Tracy, S.R.; Gómez, J.F.; Sturrock, C.J.; Wilson, Z.A.; Ferguson, A.C. Non-destructive determination of floral staging in cereals using X-ray micro-computed tomography (µCT). Plant Methods 2017, 13, 9. [Google Scholar] [CrossRef]
  22. Mathers, A.W.; Hepworth, C.; Baillie, A.L.; Sloan, J.; Jones, H.; Lundgren, M.; Fleming, A.J.; Mooney, S.J.; Sturrock, C.J. Investigating the microstructure of plant leaves in 3D with lab-based X-ray computed tomography. Plant Methods 2018, 14, 99. [Google Scholar] [CrossRef]
  23. Yoshida, H.; Nagato, Y. Flower development in rice. J. Exp. Bot. 2011, 62, 4719–4730. [Google Scholar] [CrossRef]
  24. Nasu, H.; Momohara, A.; Yasuda, Y.; Jie, H. The occurrence and identification of Setaria italica (L.) P. Beauv. (foxtail millet) grains from the Chengtoushan site (ca. 5800 cal B.P.) in central China, with reference to the domestication centre in Asia. Veg. Hist. Archaeobotany 2007, 16, 481–494. [Google Scholar] [CrossRef]
  25. Darmency, H.; Dekker, J. Setaria. In Wild Crop Relatives: Genomic and Breeding Resources; Kole, C., Ed.; Springer: Berlin/Heidelberg, Germany, 2011; pp. 275–296. [Google Scholar] [CrossRef]
  26. Dekker, J. The foxtail (Setaria) species-group. Weed Sci. 2003, 51, 641–656. [Google Scholar] [CrossRef]
  27. Fang, X.M.; Dong, K.J.; Wang, X.Q.; Liu, T.P.; He, J.H.; Ren, R.Y.; Zhang, L.; Liu, R.; Liu, X.Y.; Li, M.; et al. A high density genetic map and QTL for agronomic and yield traits in foxtail millet [Setaria italica (L.) P. Beauv.]. BMC Genom. 2016, 17, 336. [Google Scholar] [CrossRef] [PubMed]
  28. Guo, S.Q.; Chai, S.H.; Guo, Y.; Shi, X.; Han, F.; Qu, T.; Xing, L.; Yang, Q.H.; Gao, J.F.; Gao, X.L.; et al. Mapping of major QTL and candidate gene analysis for hull colour in foxtail millet (Setaria italica (L.) P. Beauv.). BMC Genom. 2023, 24, 458. [Google Scholar] [CrossRef]
  29. Yu, K.; Liu, D.C.; Chen, Y.; Wang, D.Z.; Yang, W.L.; Yang, W.; Yin, L.X.; Zhang, C.; Zhao, S.C.; Sun, J.Z.; et al. Unraveling the genetic architecture of grain size in einkorn wheat through linkage and homology mapping and transcriptomic profiling. J. Exp. Bot. 2019, 70, 4671–4688. [Google Scholar] [CrossRef]
  30. Wu, X.M.; Wang, B.; Xie, F.G.; Zhang, L.P.; Gong, J.; Zhu, W.; Li, X.Q.; Feng, F.Q.; Huang, J. QTL mapping and transcriptome analysis identify candidate genes regulating pericarp thickness in sweet corn. BMC Plant Biol. 2020, 20, 117. [Google Scholar] [CrossRef]
  31. Dong, N.Q.; Sun, Y.W.; Guo, T.; Shi, C.L.; Zhang, Y.M.; Kan, Y.; Xiang, Y.H.; Zhang, H.; Yang, Y.B.; Li, Y.C.; et al. UDP-glucosyltransferase regulates grain size and abiotic stress tolerance associated with metabolic flux redirection in rice. Nat. Commun. 2020, 11, 2629. [Google Scholar] [CrossRef]
  32. Wu, Z.H.; Zhang, X.; Chang, G.M.; Yang, J.; Wan, J.P.; Wang, F.J.; Tao, D.Y.; Zhou, J.W.; Shang, L.G.; Xu, P.; et al. Natural alleles of a uridine 5′-diphospho-glucosyltransferase gene responsible for differential endosperm development between upland rice and paddy rice. J. Integr. Plant Biol. 2022, 64, 135–148. [Google Scholar] [CrossRef]
  33. Ranocha, P.; Dima, O.; Nagy, R.; Felten, J.; Corratgé-Faillie, C.; Novák, O.; Morreel, K.; Lacombe, B.; Martinez, Y.; Pfrunder, S.; et al. Arabidopsis WAT1 is a vacuolar auxin transport facilitator requireed for auxin homoeostasis. Nat. Commun. 2013, 4, 2625. [Google Scholar] [CrossRef] [PubMed]
  34. Li, P.C.; Ma, J.J.; Zhou, X.M.; Li, G.H.; Zhao, C.Z.; Xia, H.; Fan, S.J.; Wang, X.J. Arabidopsis MDN1 is involved in the establishment of a normal seed proteome and seed germination. Front. Plant Sci. 2019, 10, 1118. [Google Scholar] [CrossRef]
  35. Ohto, M.A.; Fischer, R.L.; Goldberg, R.B.; Nakamura, K.; Harada, J.J. Control of seed mass by APETALA2. Proc. Natl. Acad. Sci. USA 2005, 102, 3123–3128. [Google Scholar] [CrossRef] [PubMed]
  36. Boukail, S.; Macharia, M.; Miculan, M.; Masoni, A.; Calamai, A.; Palchetti, E.; Dell’Acqua, M. Genome wide association study of agronomic and seed traits in a world collection of proso millet (Panicum miliaceum L.). BMC Plant Biol. 2021, 21, 330. [Google Scholar] [CrossRef]
  37. Zuo, J.R.; Li, J.Y. Molecular genetic dissection of quantitative trait loci regulating rice grain size. Annu. Rev. Genet. 2014, 48, 99–118. [Google Scholar] [CrossRef]
  38. Ma, G.F.; Wang, Y.J.; Han, S.L.; Han, Y.H.; Li, H.Y.; Hou, S.Y. Correlation analysis of grain episperm color and main agronomic traits in hybrid population from a famous foxtail millet cultivar Jingu 21. J. Shanxi Agric. Sci. 2020, 48, 1180–1184. [Google Scholar] [CrossRef]
  39. Miao, Y.; Wang, R.; Jing, Z.; Wang, K.; Tan, M.; Li, F.; Zhang, W.; Han, J.; Han, Y. CT image segmentation of foxtail millet seeds based on semantic segmentation model VGG16-UNet. Plant Methods. 2024, 20, 169. [Google Scholar] [CrossRef]
  40. Liu, X.; Zhang, N.; Sun, Y.R.; Fu, Z.X.; Han, Y.H.; Yang, Y.; Jia, J.C.; Hou, S.Y.; Zhang, B.J. QTL mapping of downy mildew resistance in foxtail millet by SLAF-seq and BSR-seq analysis. Theor. Appl. Genet. 2024, 137, 168. [Google Scholar] [CrossRef]
  41. Babu, B.; Agrawal, P.; Saha, S.; Gupta, H. Mapping QTLs for opaque2 modifiers influencing the tryptophan content in quality protein maize using genomic and candidate gene-based SSRs of lysine and tryptophan metabolic pathway. Plant Cell Rep. 2015, 34, 37–45. [Google Scholar] [CrossRef] [PubMed]
Figure 1. Scanning images of a foxtail millet grain (germplasm GBS) with botanical terms [24]. In this paper, we define the term “cavity” as an expression for the gap between caryopsis and hull. The caryopsis consists of the embryo, endosperm, and caryopsis coat (the caryopsis coat, which is thin layers of dead cells closely adhering the endosperm and embryo, is relatively poorly contrasted in the Micro-CT image). The caryopsis is covered by a structure called the hull, which can be divided into the lemma and palea.
Plants 14 03603 g001
Figure 2. Visualization of different portions of a mature foxtail millet grain after being labeled and segmented (germplasm GBS). (A) Micro-CT reconstruction images in different cross-sectional directions. (B) Different tissues were labeled different colors. (C) The embryo (blue), endosperm (green), cavity (purple), and hull (yellow) were segmented, respectively.
Plants 14 03603 g002
Figure 3. Correlation analyses of grain phenotypic traits. Note: The corresponding Pearson’s correlation coefficients are displayed in the lower left panels. The intensity of the color of the numbers represents the strength of the correlation. Red numbers indicate a positive correlation; blue numbers indicate a negative correlation. In the upper right panels, red and blue denote positive and negative correlations, respectively. K, the whole grain; EM, embryo; EN, endosperm; C, cavity; H, hull; H-A-T, the average thickness of the hull.
Plants 14 03603 g003
Figure 4. QTLs localization of grain phenotypic traits. (A) QTL localization of grain volume, embryo volume and endosperm volume; (B) QTLs localization of the proportion of embryo volume; (C) QTL localization of hull surface area. Note: The x-axis represents the chromosome and the y-axis represents the LOD value. The black horizontal dotted line is the significance threshold of the LOD value, and the black vertical dotted line is the chromosome discrimination line. qKV2, qER3, qER4, and qHA9 are the names of the loci of quantitative traits. K, the whole grain; EM, embryo; EN, endosperm; H, hull.
Plants 14 03603 g004
Figure 5. The differentially expressed genes (DEGs) identified between GBS and JG21. (A) Volcano plot of DEGs identified in the hull between GBS and JG21. (B) Hierarchical clustering heat map of DEGs identified in the hull between GBS and JG21. (C) Volcano plot of DEGs identified in the caryopsis between GBS and JG21. (D) Hierarchical clustering heat map of DEGs identified in the caryopsis between GBS and JG21. Note: In the volcano plot, the x-axis represents the fold change (log2FoldChange). A larger absolute value on the x-axis indicates a greater fold change in expression between GBS and JG21; the y-axis indicates the significance level of expression differences. Upregulated genes are represented by red dots, downregulated genes by yellow dots, and genes with no significant changes by blue dots. In the cluster analysis heatmap, the x-axis represents samples and the y-axis represents differentially expressed genes. The left side clusters genes based on expression similarity, and the top clusters each sample based on expression profile similarity. Expression levels increase gradually from green to red, with numbers indicating the normalized relative expression levels.
Plants 14 03603 g005aPlants 14 03603 g005b
Figure 6. Expression analysis of genes within QTL localization intervals. (A) Expression analysis of genes within the qHA9 interval. (B) Expression analysis of genes within the qKV2, qER3, and qER4 intervals. (C) Heatmap of genes expression analysis within the qKV2, qER3, and qER4 intervals. Note: In the heatmap, the x-axis represents samples and the y-axis represents differentially expressed genes. On the left side, genes are clustered based on expression similarity, and at the top, each sample is clustered based on the similarity of their expression profiles. The expression levels gradually increase from blue to red, with numbers indicating the normalized relative expression levels.
Plants 14 03603 g006
Table 1. Results of statistical analysis for grain phenotypic traits.
TraitParentsRIL PopulationCV (%)SkewnessKurtosisp
GBSJG21MinimumMaximumMean ± SD
K-Volume2.3443.5162.2293.7143.023 ± 0.30510.1−0.3010.4830.042 *
K-Area9.25511.6348.83212.52510.950 ± 0.7356.71−0.4640.7030.454
EM-Volume0.2000.3590.1780.3610.259 ± 0.03513.6020.3890.330.989
EM-Area3.1595.4682.6035.4683.502 ± 0.47513.5551.2712.9810.000 **
EM-Ratio0.0810.1100.0680.1130.086 ± 0.0078.5440.7181.5320.231
EN-Volume0.8401.9400.8402.2411.759 ± 0.21015.335−0.1230.3010.557
EN-Area7.2712.6737.15012.6739.151 ± 0.94511.9321.1743.4260.000 **
EN-Ratio0.5610.5550.5120.6190.585 ± 0.03410.324−1.1122.0920.007 **
C-Volume0.6320.4850.3751.0480.563 ± 0.11119.6651.0233.4830.369
C-Area27.5527.45618.11244.84225.769 ± 3.49713.5711.597.6950.208
C-Ratio0.2300.1460.1090.330.187 ± 0.03518.7390.8452.6760.168
H-Volume0.3450.5430.2440.6030.410 ± 0.08420.5680.112−0.4560.812
H-Area22.1728.25918.17428.25923.596 ± 1.9288.1720.0560.5120.149
H-Ratio0.1260.1640.090.2120.135 ± 0.02216.7240.3190.8110.908
H-A-T35.4643.38026.1656.2938.966 ± 6.51716.0740.221−0.4450.900
Note: Asterisks indicate significant differences between the varieties by Shapiro–Wilk test (* p < 0.05, ** p < 0.01). K, the whole grain; EM, embryo; EN, endosperm; C, cavity; H, hull; H-A-T, the average thickness of the hull. The unit for volume is cubic millimeters, the unit for surface area is square millimeters, and the unit for the average thickness of the hull is micrometers.
Table 2. QTLs detected for six traits in the RIL population.
QTLChromosomePhysical Interval (Mb)TraitsLODPVE (%) Add
qKV2225.180–28.330K-Volume3.35217.0870.120
EM-Volume3.37615.9610.014
EN-Volume3.00714.5130.069
K-Area2.66316.7190.262
qER3312.320–14.800EM-Ratio2.95511.3980.003
qER4412.960–30.600EM-Ratio2.81813.170−0.005
qHA9957.300–58.220H-Area3.04513.792−0.701
Table 3. Candidate genes for grain structure and their homologous genes in rice.
Genes IDGene NamesHomologous GeneFunction Annotation of Homologous Genes
Si2g18440SiUDP82A1LOC_Os04g44354UDP-glycosyltransferases affect cell proliferation and expansion by regulating auxin transport, thereby regulating seed development [31,32].
Si3g18740SiUDPLOC_Os05g42020
Si3g18760SiUDP73E1LOC_Os05g42040
Si3g19180SiWAT1LOC_Os05g41420Regulating auxin exporting affects the elongation and division of cells [33].
Si4g12830SiLEA1LOC_Os06g21910The mutant mdn1-1 exhibits an increased seed size and late embryogenesis abundant (LEA) proteins are over-accumulated in the dry seeds of mdn1-1 [34].
Si4g14860SiLEA31LOC_Os06g23350
Si4g17090SiAP2LOC_Os06g36000The mutants exhibited larger seed size and increased seed mass [35].
Disclaimer/Publisher’s Note: The statements, opinions and data contained in all publications are solely those of the individual author(s) and contributor(s) and not of MDPI and/or the editor(s). MDPI and/or the editor(s) disclaim responsibility for any injury to people or property resulting from any ideas, methods, instructions or products referred to in the content.