Article

Genome-Wide SNP Analysis Reveals Population Structure and Genetic Diversity in Lycium ruthenicum Murr

1
Inner Mongolia Academy of Forestry Sciences, Hohhot 010010, China
2
Inner Mongolia Engineering Technology Research Center of Lycium ruthenicum Murr., Hohhot 010010, China
3
Key Laboratory of State Forestry and Grassland Administration for Sandy Land Biological Resources Conservation and Cultivation, Hohhot 010010, China
4
College of Forestry, Inner Mongolia Agricultural University, Hohhot 010019, China
*
Authors to whom correspondence should be addressed.
Plants 2025, 14(21), 3374; https://doi.org/10.3390/plants14213374
Submission received: 24 September 2025 / Revised: 27 October 2025 / Accepted: 28 October 2025 / Published: 4 November 2025
(This article belongs to the Section Plant Genetics, Genomics and Biotechnology)

Abstract

Lycium ruthenicum Murr. (Black goji), a medicinal and economically valuable crop rich in bioactive compounds, remains genomically understudied despite its expanding cultivation. To overcome limitations of traditional markers in genetic diversity analysis and molecular breeding, we employed specific-locus amplified fragment sequencing (SLAF-seq) to develop genome-wide SNP markers and elucidate the genetic structure of 213 L. ruthenicum accessions from natural and cultivated populations in Alxa, China. We identified 827,630 SLAF tags and 33,121 high-quality SNPs uniformly distributed across 12 chromosomes, establishing the first high-density SNP database for this species. Population genetic analyses revealed three distinct genetic clusters with <60% geographic origin consistency, indicating weakened isolation due to anthropogenic germplasm exchange. The Qinghai Nuomuhong population exhibited the highest genetic diversity (Nei’s index = 0.253; Shannon’s index = 0.352), while low overall polymorphism (average PIC = 0.183) likely reflects SNP biallelic limitations and domestication bottlenecks. Notably, SNP-based clustering showed <40% concordance with phenotypic trait clustering (31 traits), underscoring environmental plasticity as a key driver of morphological variation. This study provides the first genome-wide SNP resource for L. ruthenicum, enabling marker-assisted breeding and highlighting the need for standardized germplasm management to mitigate genetic erosion.

1. Introduction

Lycium ruthenicum Murr. (black goji), a medicinally and economically significant species in the Solanaceae family, has experienced growing demand for functional foods and pharmaceutical applications due to its fruit’s high anthocyanin, polysaccharide, and antioxidant content [1]. Despite this increasing cultivation, genomic research on L. ruthenicum lags behind that of its close relative L. barbarum (wolfberry), with fundamental aspects of its genetic diversity, population evolutionary relationships, and key trait regulation remaining poorly characterized [2]. Current cultivars predominantly derive from direct domestication of wild populations or phenotypic selection, yet the absence of a robust molecular marker system has resulted in widespread cultivar misidentification and synonymy, significantly impeding germplasm characterization and molecular breeding efforts [3]. While traditional morphological markers and low-throughput molecular markers (e.g., SSR, ISSR) can support basic genetic analyses, their limited density and uneven genomic distribution hinder the investigation of complex traits influenced by polygenic interactions or genotype environment effects. This limitation is evident in studies where markers such as SSRs, despite revealing population structure, show constrained power in dissecting polygenic traits like drought tolerance in rice [4], or where different marker systems (e.g., ISSR, CDDP, SCoT) yield varying estimates of genetic diversity and differentiation within barley populations, underscoring the need for more comprehensive genomic approaches [5]. Consequently, developing high-throughput molecular markers and constructing a comprehensive genetic map for L. ruthenicum is essential for advancing germplasm improvement.
Among reduced-representation sequencing approaches, specific-locus amplified fragment sequencing (SLAF-seq) has emerged as a powerful tool for large-scale single nucleotide polymorphism (SNP) discovery. This technique targets restriction-enzyme-digested genomic regions, offering an optimal balance of cost efficiency and marker density [6]. The high-throughput nature of SNP markers has revolutionized genetic map construction, identification of phenotype-associated loci, and marker-assisted breeding [7]. Successful applications span diverse crops including maize (Zea mays) [8], rice (Oryza sativa) [9], and soybean (Glycine max) [10]. For example, Yu et al. [11] combined SLAF-seq with bulked segregant analysis (BSA) in an F2 population, identifying four chromosomal regions (totaling 25.71 Mb) containing 1513 annotated genes associated with low-temperature germination tolerance. Similarly, Ren et al. [12] developed a high-density genetic map (8078 markers spanning 3780.98 cM) using an F6:9 recombinant inbred line population, revealing 23 drought-related QTLs with three co-localized loci on chromosomes 6, 17, and 19.
Recent applications have extended SLAF-seq to woody and medicinal plants, including studies of gene expression patterns in early-budding tea (Camellia sinensis) [13] and population genetic analyses of Chinese honeysuckle (Lonicera japonica) germplasm. While SLAF-seq has proven valuable for QTL mapping in L. barbarum [14,15] and enabled construction of ultra-dense genetic maps [16], comprehensive SNP development and population genetic studies in L. ruthenicum remain lacking. This gap persists despite existing resources like global wolfberry germplasm databases [17] and Romanian Lycium genotyping data [18], which are yet to incorporate SLAF-seq. Although SSR markers have addressed some limitations of traditional approaches [19], their moderate polymorphism (PIC 0.612–0.911) remains inadequate for resolving complex traits in L. ruthenicum.
In this study, we employ SLAF-seq for genome-wide SNP discovery in L. ruthenicum, analyzing 213 germplasm accessions from Alxa League, Inner Mongolia. Our objectives are threefold: (1) to establish a high-density SNP marker database addressing current limitations of low-polymorphism markers; (2) to elucidate genetic structure differences between wild and cultivated populations, clarifying domestication impacts on diversity; (3) to identify candidate loci associated with phenotypic traits to facilitate marker-assisted breeding. This work addresses critical gaps in Lycium genomics and provides essential technical support for germplasm conservation, cultivar identification, and molecular breeding in L. ruthenicum.

2. Materials and Methods

2.1. Plant Materials

A total of 213 L. ruthenicum accessions were collected from the germplasm repository in Alxa Left Banner, Inner Mongolia (Table 1). Fresh and healthy young leaves from each accession were wrapped in pre-labeled aluminum foil, flash-frozen in liquid nitrogen, and stored at −80 °C for subsequent DNA extraction.

2.2. Genomic DNA Extraction

Genomic DNA was isolated using a modified CTAB method [20]. Briefly, leaf tissues were ground in liquid nitrogen-precooled steel beads using a homogenizer (Scilogex, CF1524R, Rocky Hill, CT, USA) at 1500 rpm for 40 s, followed by incubation in preheated CTAB lysis buffer (Tiangen, DP1403, Beijing, China) containing 2% β-mercaptoethanol at 65 °C for 40–60 min. Protein contaminants were removed by two rounds of chloroform/isoamyl alcohol (24:1) extraction (12,000 rpm, 20 min). DNA was precipitated by adding isopropanol and 3 M sodium acetate (10:1 v/v) at −20 °C for 1 h, washed with 75% ethanol (12,000 rpm, 5 min), air-dried, and dissolved in RNase A-treated ddH2O. DNA integrity was verified via 1% agarose gel electrophoresis (using λ-Hind III digest DNA Marker, Takara, Dalian, China) at 120 V for 30 min, and purity was assessed using a spectrophotometer (A260/A280 = 1.8–2.0). Qualified samples were diluted to 18 ng/μL and stored at −20 °C.

2.3. SLAF-Seq Library Construction and Sequencing

2.3.1. Reference Genome and Restriction Enzyme Selection

SLAF-seq libraries were constructed for 213 L. ruthenicum DNA samples following a modified protocol [21]. The Lycium chinense genome was selected as the reference for in silico restriction enzyme prediction [22], considering genome size, GC content, and fragment distribution. Enzyme selection criteria included: (1) low fragment duplication rates, particularly in repetitive regions; (2) uniform genomic distribution of digested fragments; (3) compatibility between experimental conditions and predicted fragment lengths [23]; (4) optimal SLAF tag yield for downstream analysis. The optimal restriction enzyme combination was selected, and genomic DNA was digested accordingly.

2.3.2. SLAF-Seq Sequencing

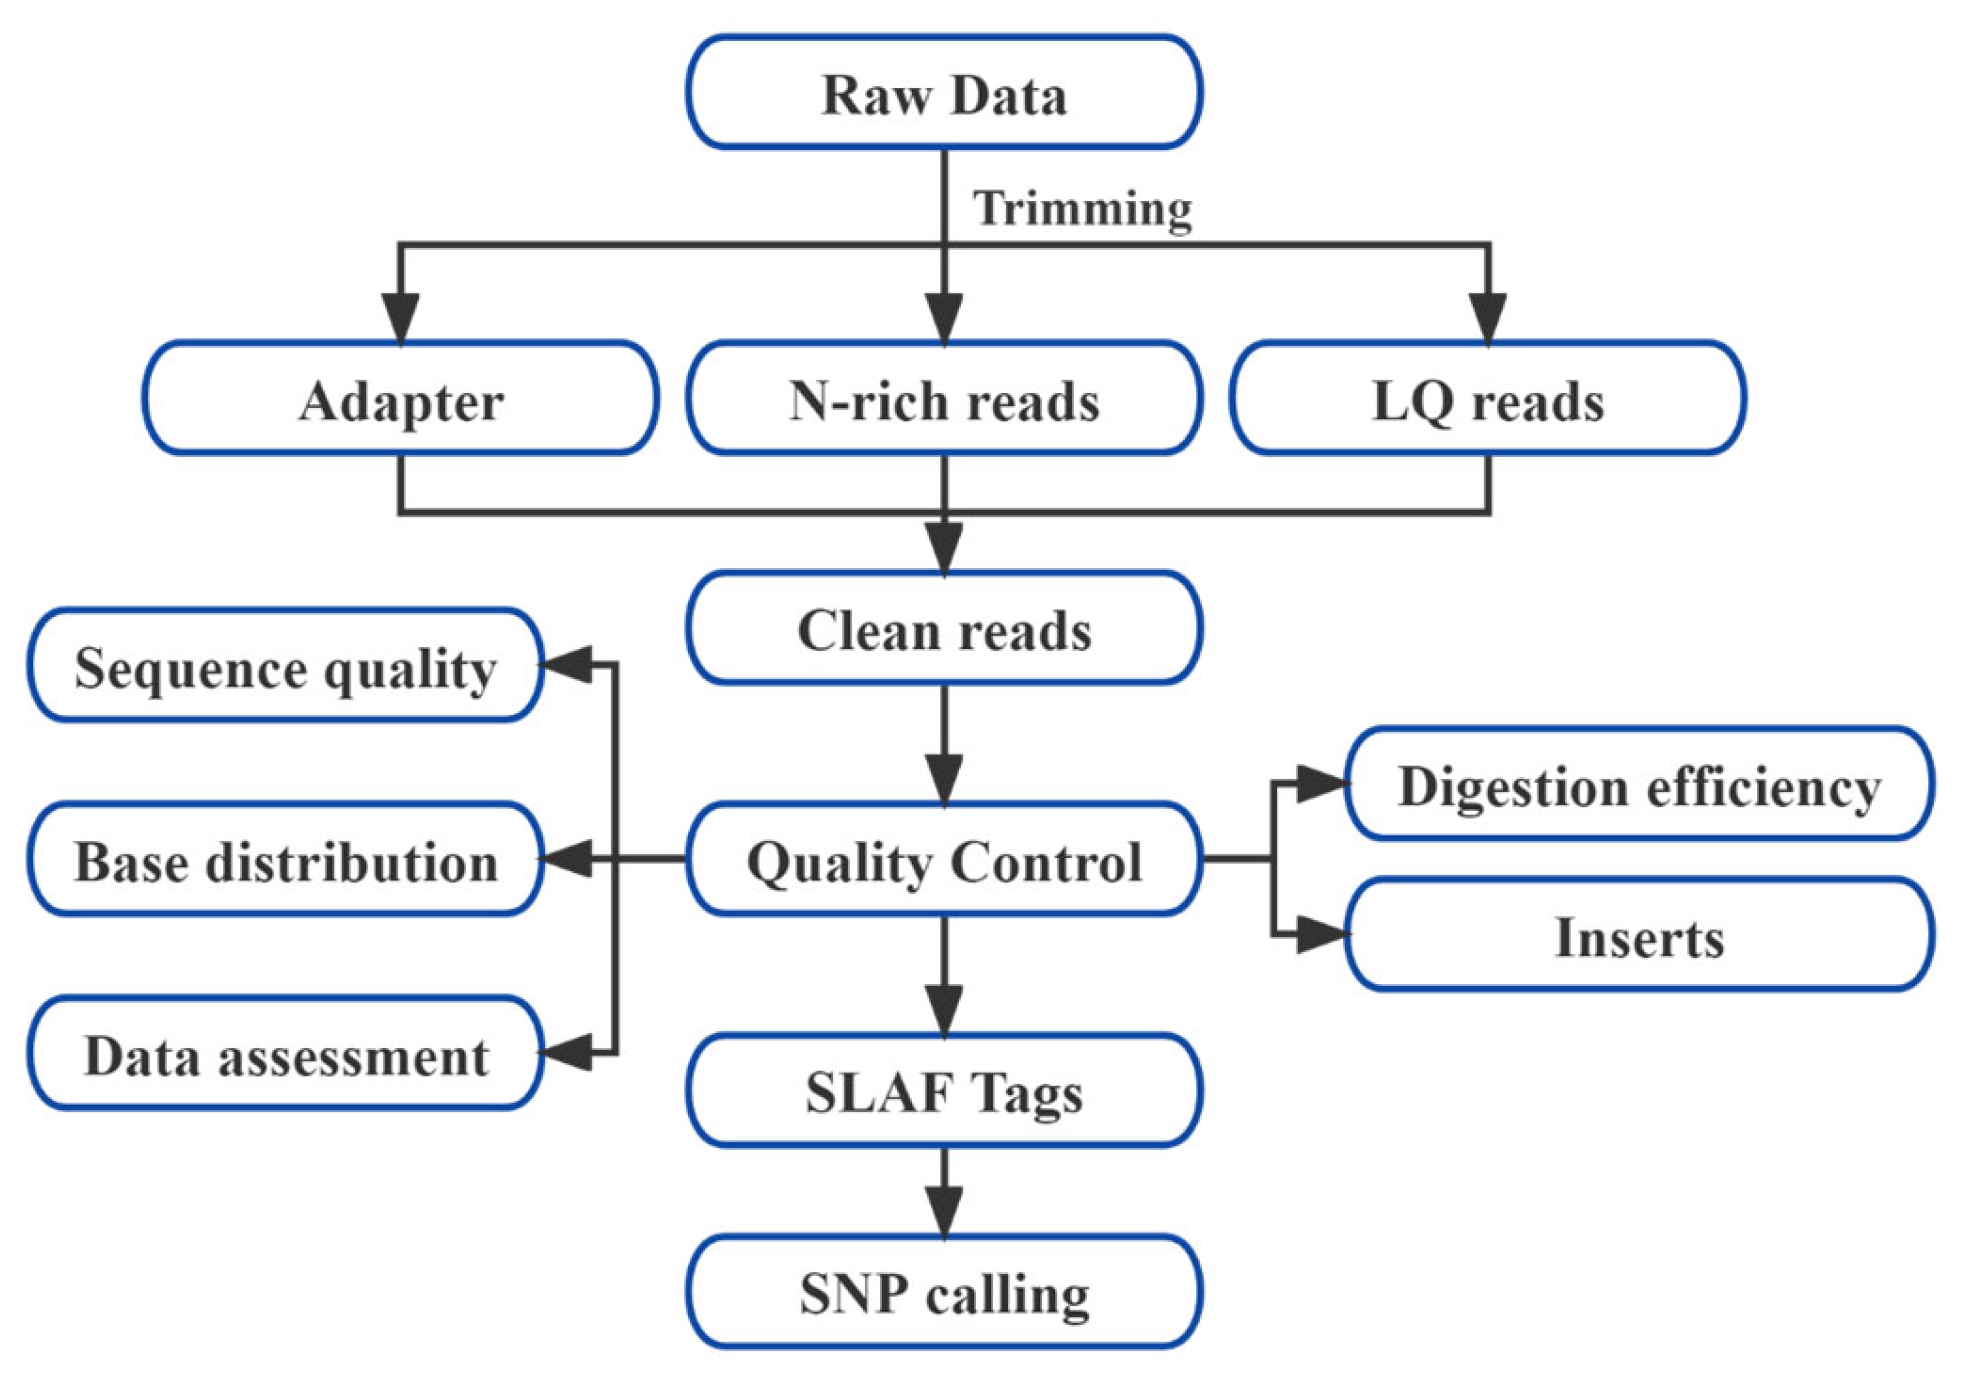
The SLAF-seq workflow is illustrated in Figure 1. Briefly, digested DNA fragments were A-tailed, ligated with dual-index adapters, and PCR-amplified. Amplified products were size-selected via 2% agarose gel electrophoresis, purified, and sequenced on the Illumina HiSeq2500 platform.

2.4. Data Processing and SNP Discovery

Raw sequencing reads were demultiplexed using dual-index barcodes. Low-quality reads (Q30 < 90%, adapter contamination, or abnormal GC content) were filtered out. Digestion efficiency was evaluated by comparing experimental and in silico digestions.
Clean reads were aligned to the L. chinense reference genome using BWA v0.7.17 [24]. SNPs were called using both Samtools v1.9 [25] and GATK v3.8 [26], with high-confidence SNPs retained from the intersection of both datasets (Figure 2).

2.5. Population Genetic Structure Analysis

Population genetic studies investigate the frequencies of genes and genotypes within populations, as well as the factors influencing these frequencies. High-confidence SNP loci were obtained by filtering variant SNP data based on minor allele frequency (MAF ≥ 0.05) and locus integrity (INT ≥ 0.3). These high-quality SNPs were subsequently used for downstream analyses, including phylogenetic tree construction, population structure analysis, principal component analysis (PCA), and linkage disequilibrium (LD) analysis [27]. In this study, population structure was analyzed using ADMIXTURE software (version 1.22) [28]. Phylogenetic relationships were inferred using MEGA X [29] with the neighbor-joining algorithm [30]. PCA was performed using EIGENSOFT (version 6.0) [31] to assess sample clustering patterns, providing additional insights into evolutionary relationships.

2.6. Genetic Diversity Analysis

Genetic diversity was assessed using multiple approaches. Kinship coefficients were calculated using GCTA (version 1.92.1) [32], while genetic distances were computed using MEGA X [29]. Custom Perl scripts developed by Biomarker Technologies were employed to analyze key genetic diversity indices, including minor allele frequency (MAF), expected number of alleles (Ne), expected heterozygosity (He), Nei’s diversity index (H), number of polymorphic loci (A), observed number of alleles (Na), observed heterozygosity (Ho), polymorphism information content (PIC), and Shannon-Wiener index (I). These analyses provided a comprehensive evaluation of genetic diversity within the L. ruthenicum population.

2.7. Construction of L. ruthenicum DNA Fingerprints

SNP markers were developed using SLAF-seq data from 213 L. ruthenicum accessions. The selection criteria included uniform genomic distribution of markers, no missing data (100% locus integrity), MAF ≥ 0.20, PIC ≥ 0.35, Hardy–Weinberg equilibrium (HWE) p-value > 0.01, and no adjacent mutations within 100 bp flanking regions. High-confidence SNPs meeting these criteria were designated as core markers. These were subsequently converted into QR codes to establish a standardized L. ruthenicum DNA fingerprinting database.

3. Results and Analysis

3.1. Restriction Enzyme Selection and Library Construction Evaluation

Through in silico restriction enzyme prediction analysis, HaeIII and Hpy166II were identified as the optimal restriction enzymes for genomic digestion. Genomic DNA from all 213 L. ruthenicum samples that passed quality control was subjected to digestion with these enzymes. As shown in Figure 3 (samples B1–B12), agarose gel electrophoresis confirmed high DNA extraction quality across all samples.
Post-digestion bioinformatics analysis mapped paired-end sequences to the reference genome to determine SLAF tag lengths. The insert size distribution (Figure 4A) revealed fragments ranging from 364 to 394 bp, following a normal distribution, indicating successful SLAF library construction. Base composition analysis (Figure 4B) showed balanced A/T and C/G distributions, confirming sequencing accuracy and reliability of the SLAF tags for subsequent SNP development and genetic diversity analysis.

3.2. Statistical Analysis and Quality Assessment of Reduced-Representation Genome Sequencing

To ensure data quality for downstream analyses, we employed 126 bp paired-end sequencing based on the results shown in Figure 5. Sequencing of 213 L. ruthenicum accessions generated a total of 563.48 million reads, with individual samples yielding between 606,309 (ES14 from Ejin Banner’s Suobaoerge Sumu) and 9,355,410 reads (E11 from Dalaihubu Town, Ejin Banner) (Figure 5a).
Quality assessment revealed Q30 scores ranging from 88.68% to 95.55%, with an average of 93.32% across all samples. The sample with lowest read count (ES14) showed the minimum Q30 value (88.68%), while BH11 from Nuomuhong, Qinghai Province exhibited the highest quality score (95.55%). Notably, all samples exceeded the 90% Q30 threshold, confirming data reliability (Figure 5a). GC content analysis demonstrated values between 37.62% (ED6 from Dongfeng Town, Ejin Banner) and 43.37% (B29 from Urad Rear Banner, Bayannur), with a population average of 40.11%, meeting standard sequencing requirements (Figure 5b).

3.3. Development of SLAF Tags and SNP Markers

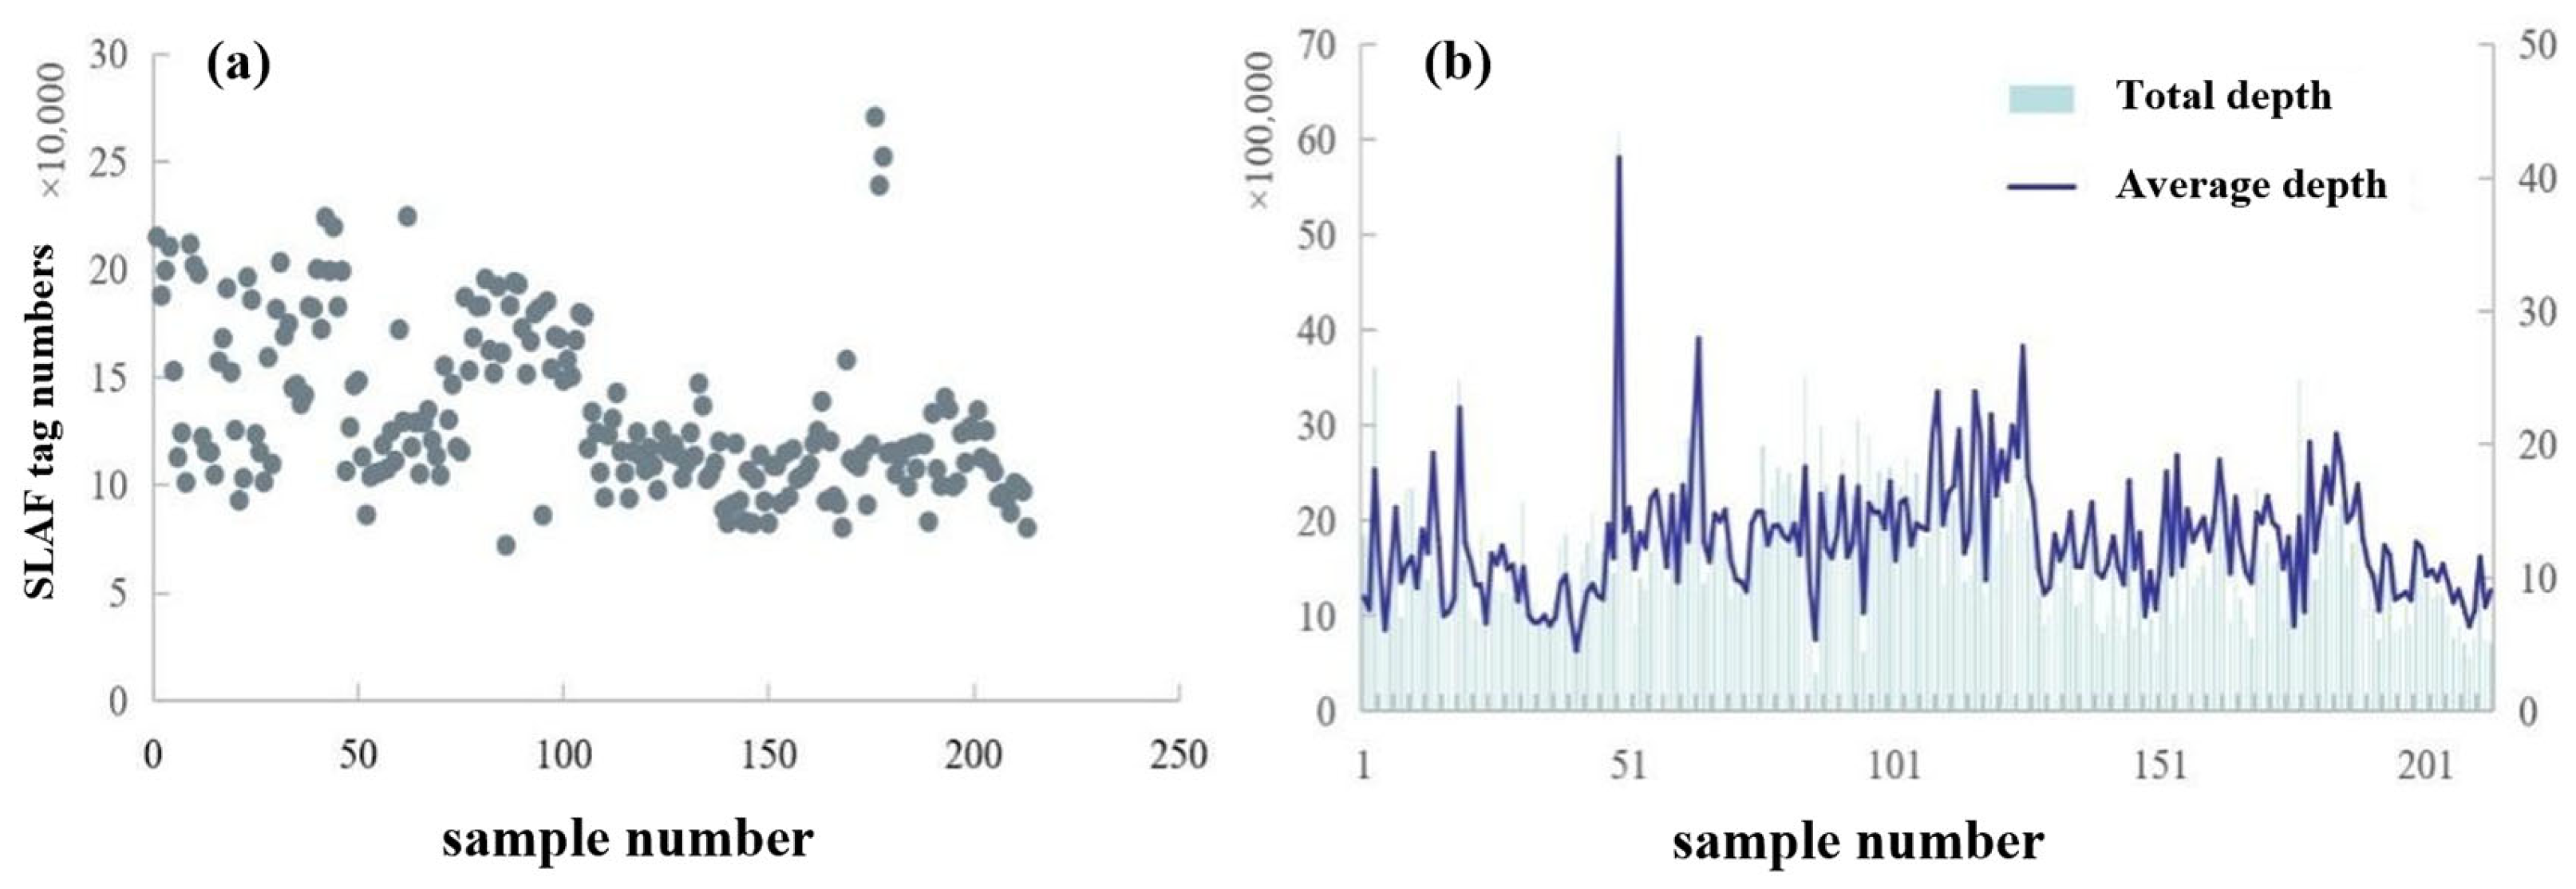
Sequencing analysis of 213 L. ruthenicum accessions yielded 827,630 high-quality SLAF tags, with individual samples containing between 72,074 and 270,676 tags (Figure 6a). The population exhibited an average total sequencing depth of 1,692,421× and mean depth of 12.86×, with per-sample values ranging from 389,796–6,076,553× and 5.4–41.5×, respectively (Figure 6b).
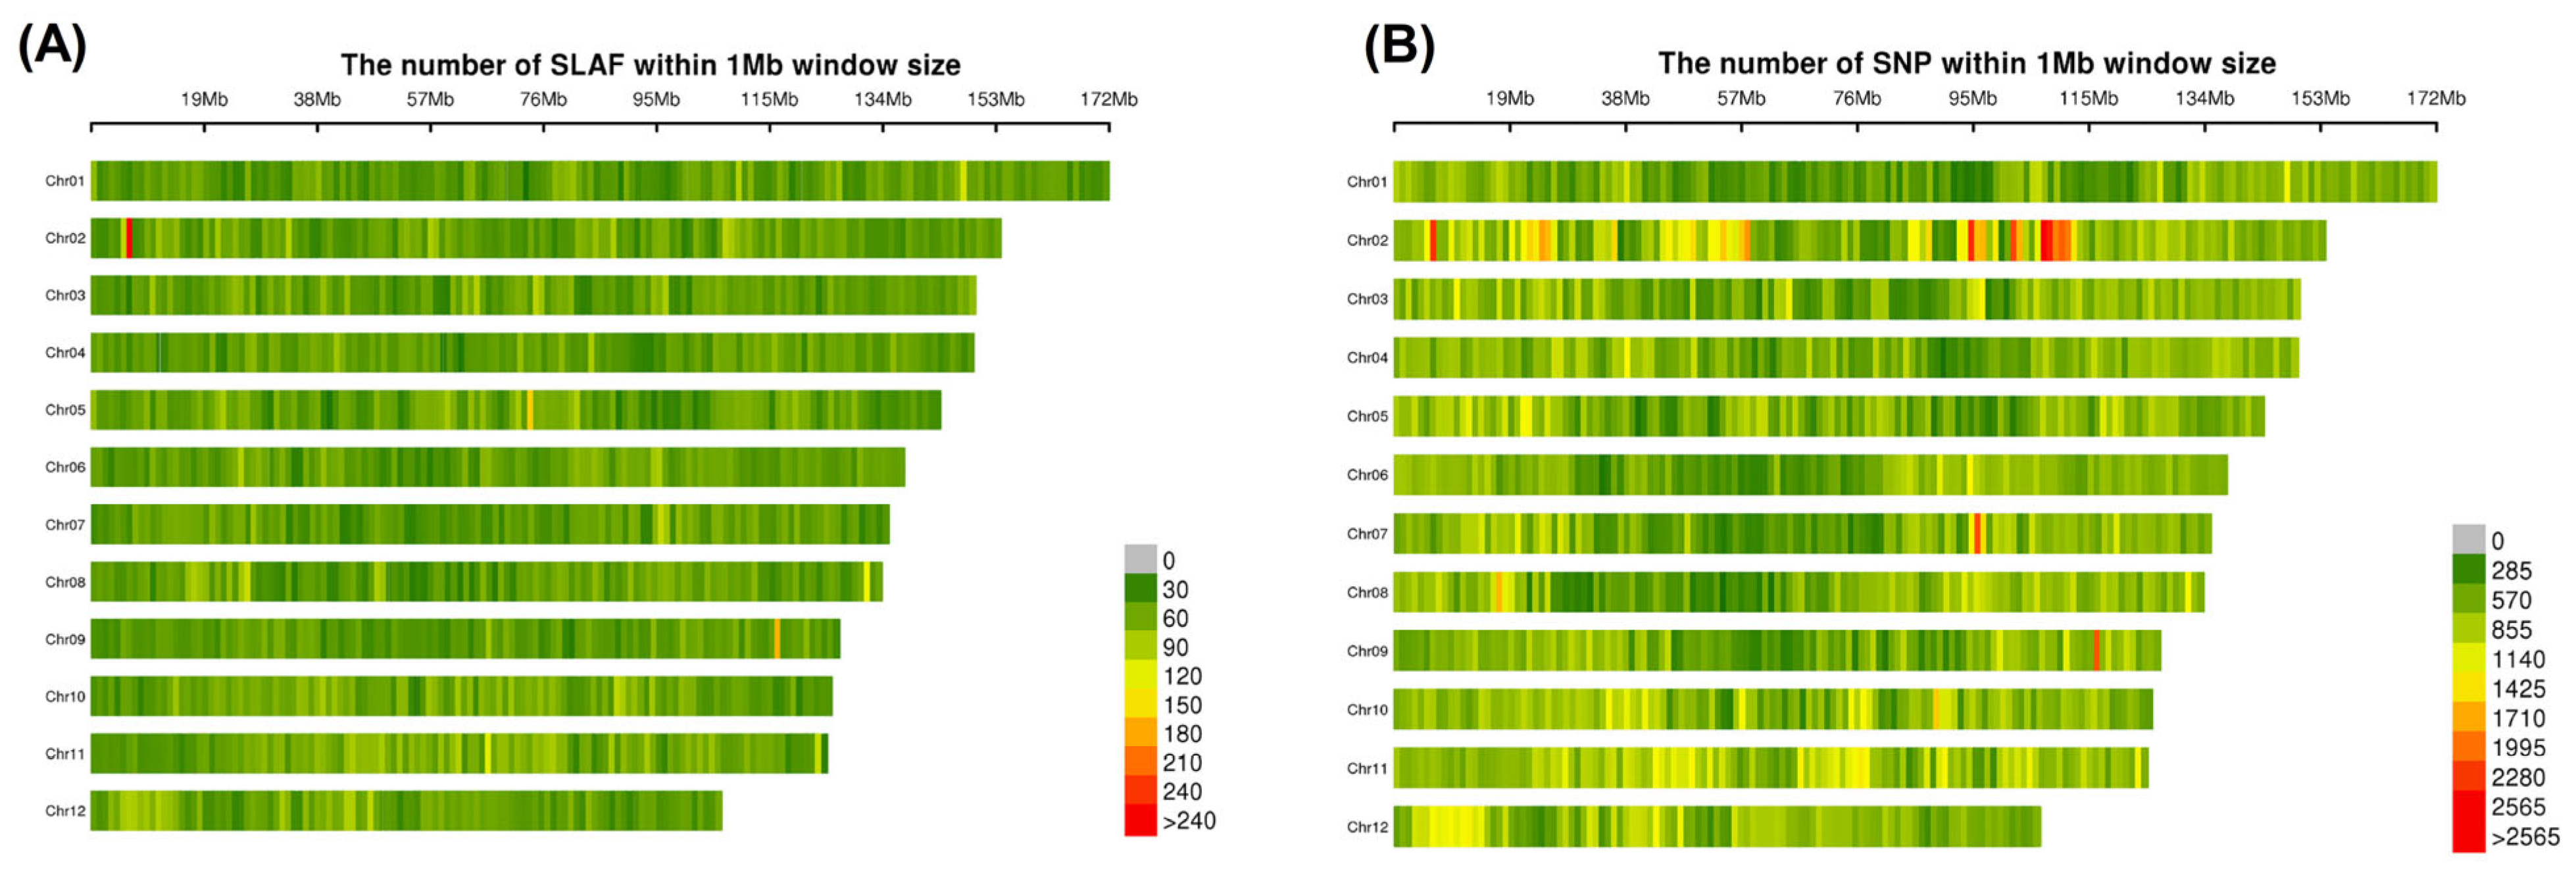
Alignment using BWA software (0.7.10-r789) mapped the SLAF tags to the L. chinense reference genome, identifying 35,098 polymorphic SLAF tags distributed across chromosomes (Table 2). Intersection analysis of SNP calls from both GATK (GenomeAnalysis Toolkit, v4.1) and Samtools (v1.12) pipelines generated a robust dataset of 1,135,505 SNPs. Stringent filtering based on locus integrity (INT ≥ 0.3) and minor allele frequency (MAF ≥ 0.05) produced 33,121 high-confidence SNPs. Chromosomal distribution analysis revealed uniform dispersion of both polymorphic SLAF tags and SNPs across all 12 chromosomes (Figure 7), confirming data quality for subsequent analyses.

3.4. Phylogenetic Analysis of L. ruthenicum

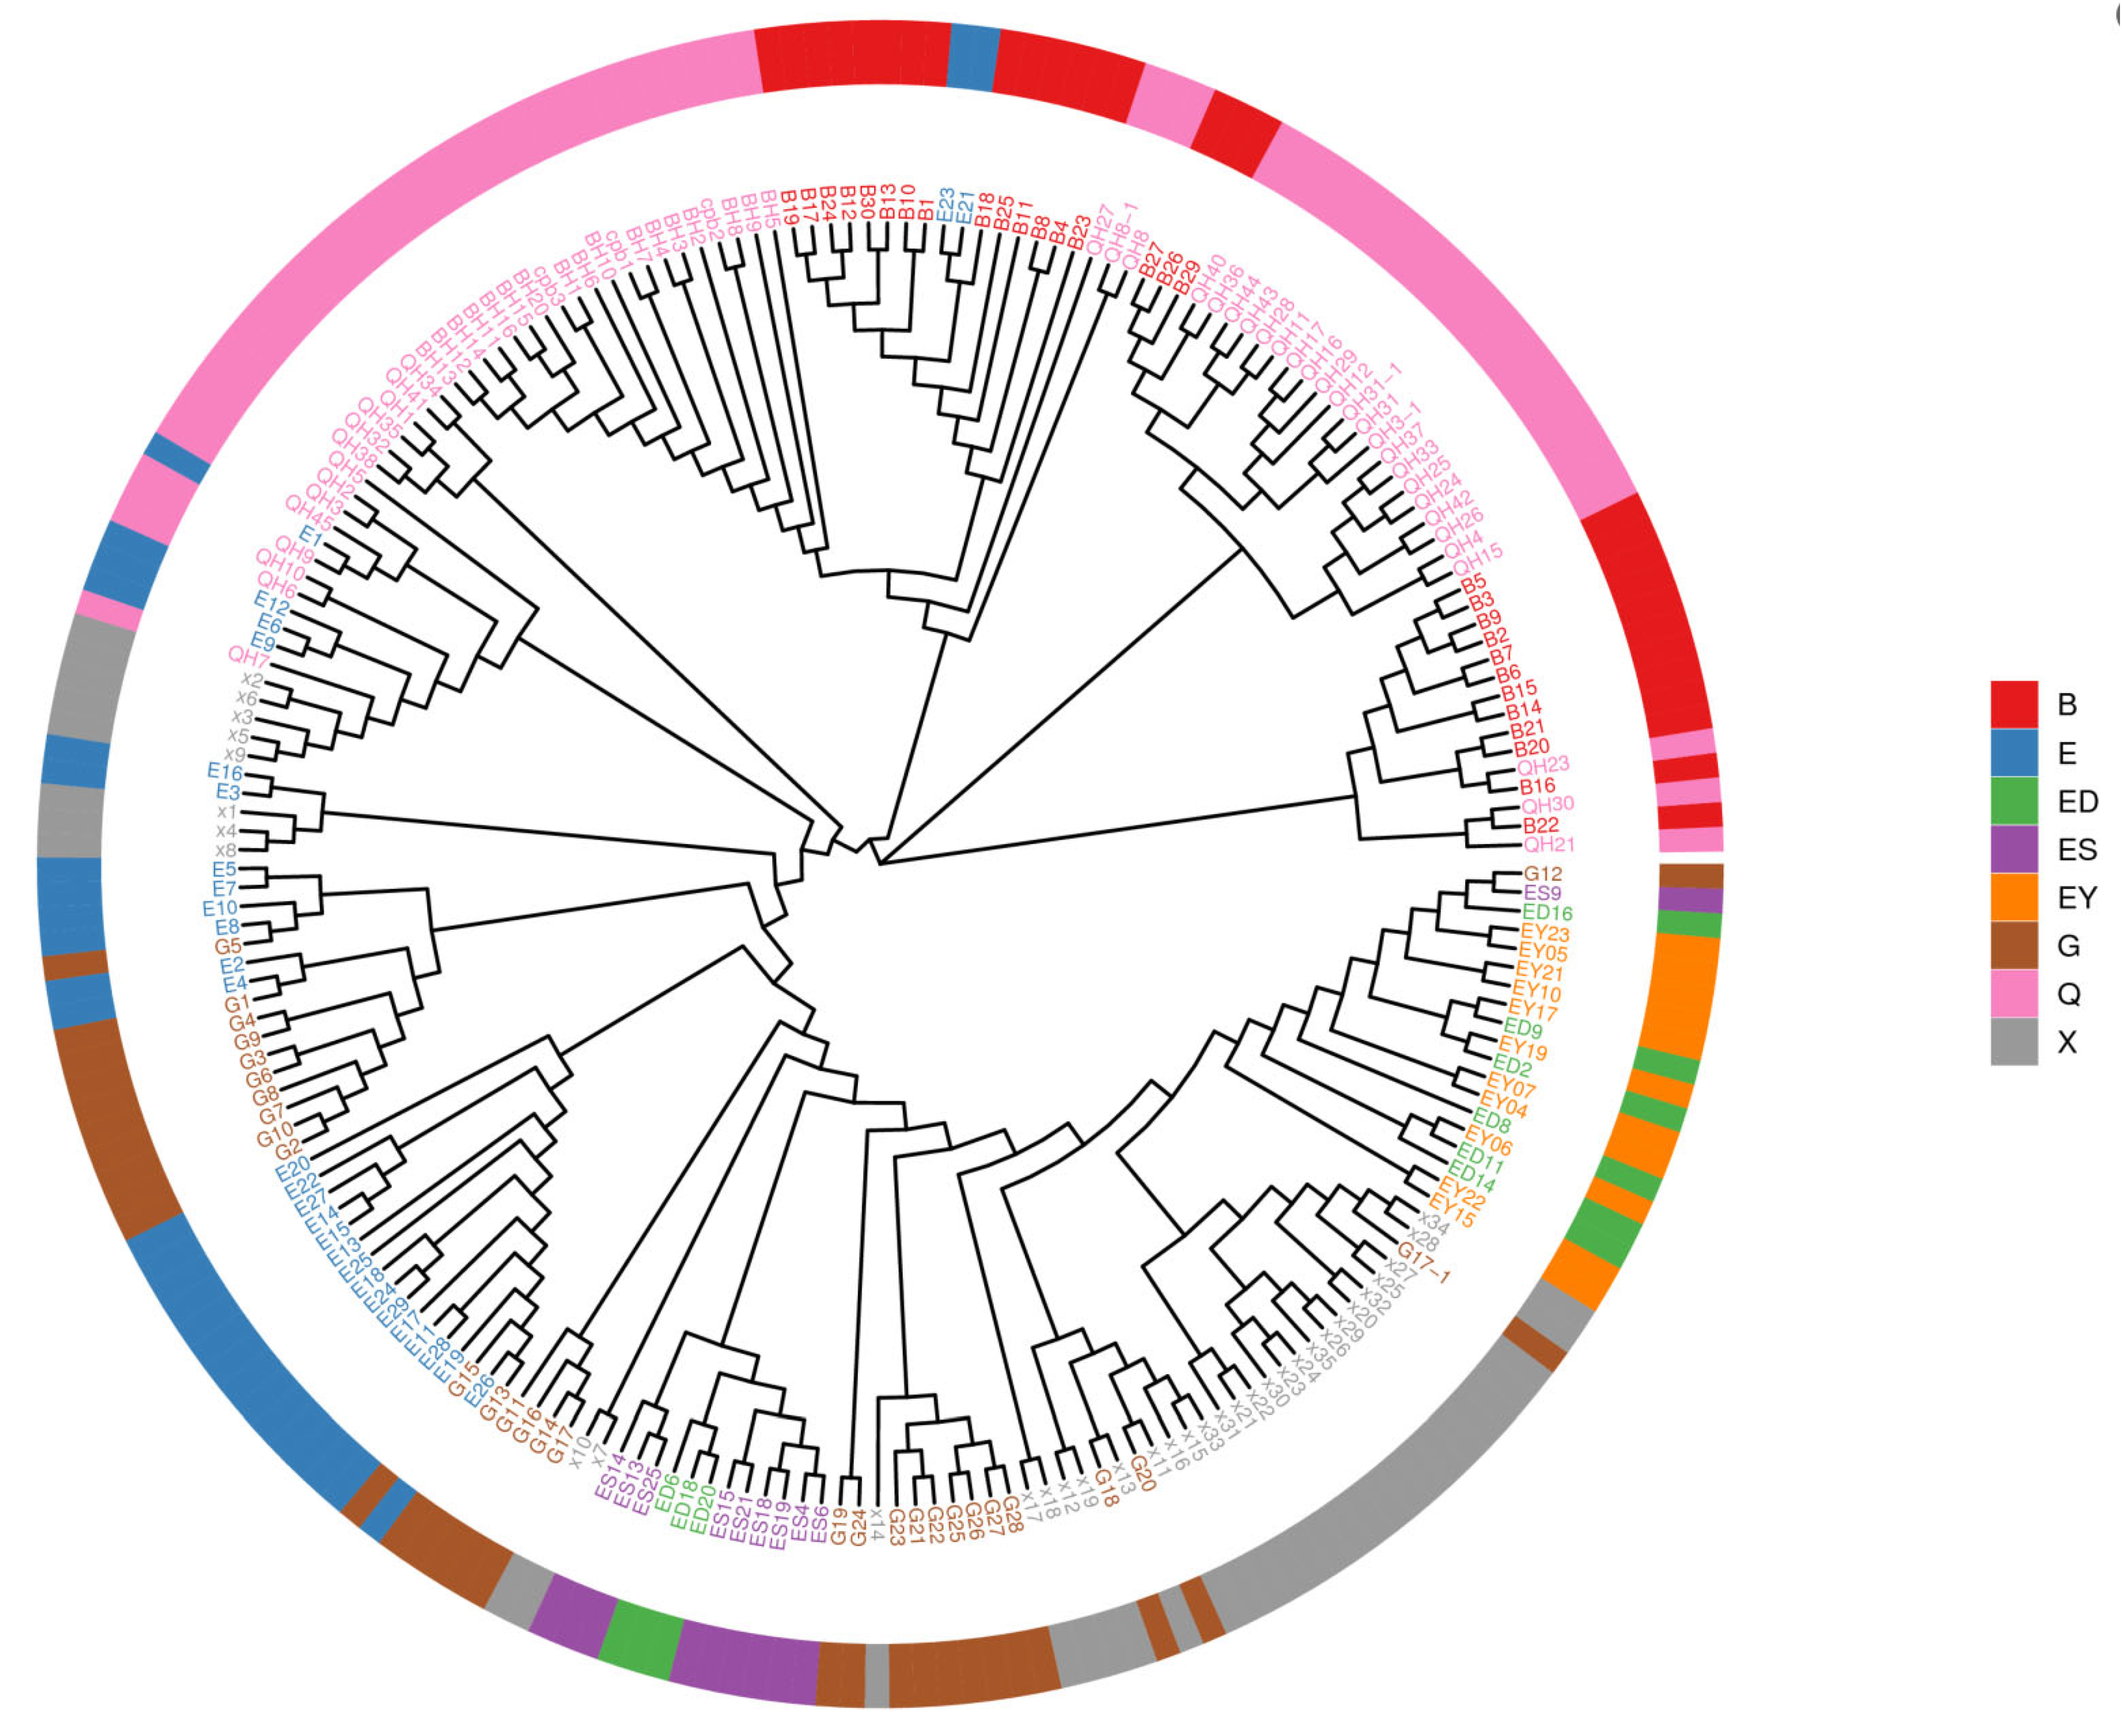
Phylogenetic trees were constructed to elucidate evolutionary relationships among the 213 L. ruthenicum accessions from eight geographic origins. Using MEGA X software with the neighbor-joining method, we generated a tree based on p-distance matrices with 1000 bootstrap replicates (Figure 8, Table 3). The analysis revealed three distinct clades (G1, G2, and G3), each containing further subdivisions.
Group 1 (G1) comprised 39 accessions (18.31%), predominantly from Nuomuhong County, Qinghai Province (23 accessions) and Urad Rear Banner, Bayannur City, Inner Mongolia (14 accessions), suggesting shared ancestry between these populations. Group 2 (G2) contained 39 accessions (18.31%), with 24 from Nuomuhong County and 15 from Urad Rear Banner. Group 3 (G3), the largest cluster (63.38%), included 135 accessions from seven locations across four provinces. Notably, accessions did not cluster strictly by geographic origin, reflecting substantial genetic variation and diversity within the species.

3.5. Population Structure Analysis

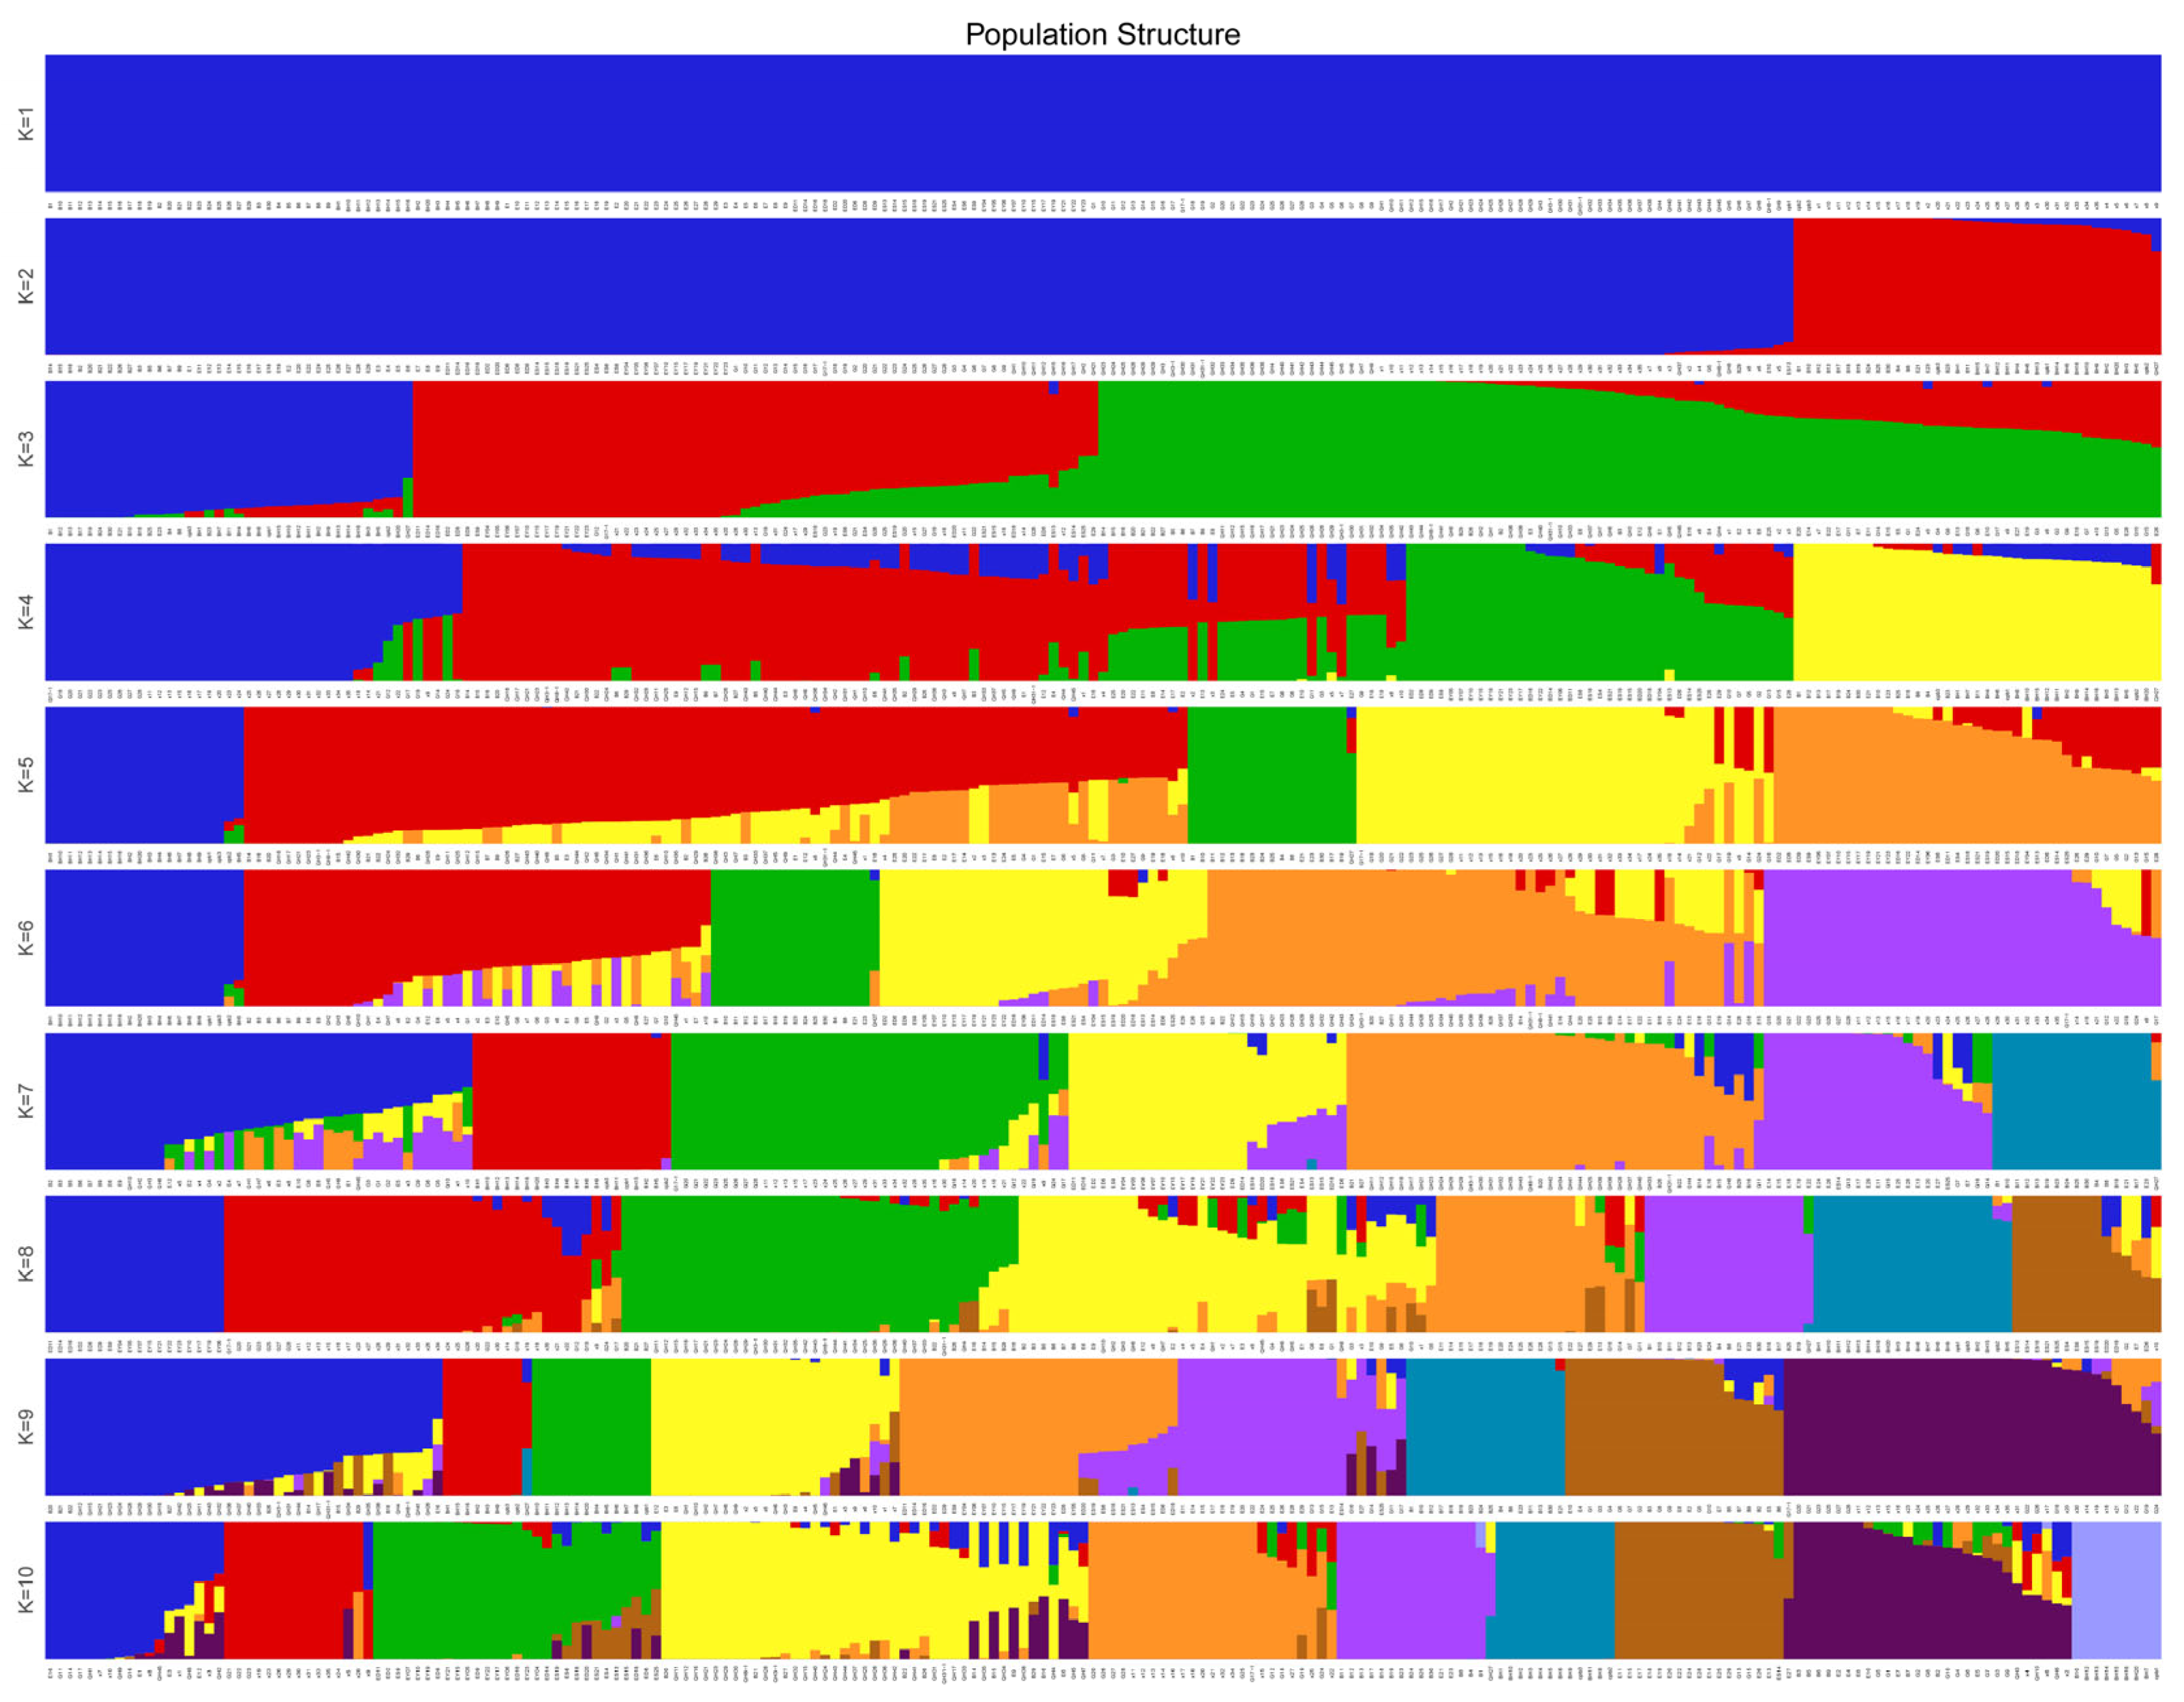
Population genetic structure analysis was performed to investigate non-random distribution of genetic variation among the 213 L. ruthenicum accessions. Using previously identified SNP markers and Admixture software (version 1.22), we evaluated potential population subdivisions by testing K values (hypothesized ancestral populations) ranging from 1 to 10. The optimal number of genetic clusters (K) was determined primarily based on the minimum cross-validation error rate, as is standard practice. Additionally, we considered the biological interpretability of the clustering results, where K = 3 provided a meaningful representation of the population subdivision that aligned with known geographic origins and breeding history of the germplasm. Cross-validation error rates identified K = 3 as the optimal clustering solution (Figure 9), dividing the accessions into three subgroups (Q1-red, Q2-blue, Q3-green) with distinct genetic backgrounds (Figure 10).
The admixture analysis revealed complex patterns of genetic exchange: Q1 (37 accessions) contained 10 pure ancestral types, with 16, 7, and 4 accessions showing admixture with Q2, Q3, or both, respectively. Q2 (69 accessions) included 31 pure types and 35 admixed with Q3. Q3 (107 accessions) comprised 33 pure types, with extensive admixture (69 accessions) with Q2. Geographic distribution analysis showed Q1 dominated by accessions from Nuomuhong County, Qinghai (21) and Urad Rear Banner, Inner Mongolia (14); Q2 contained materials from Ejin Banner (31), Gansu (13), and Xinjiang (25); while Q3 included accessions from all four provinces (Supplementary Table S2).
Comparative analysis revealed 71.9% concordance (Supplementary Materials Table S1) between population structure (Q1–Q3) and phylogenetic groups (G1–G3), with complete correspondence for Q1–G1 (19 accessions) and Q2-G2 (69 accessions). The dispersion of Inner Mongolian accessions across all three subgroups (Q1–Q3) indicates particularly complex genetic backgrounds in these materials. This comprehensive analysis demonstrates both the overall population differentiation and ongoing genetic exchange among L. ruthenicum populations across northwestern China.

3.6. PCA of Population Structure

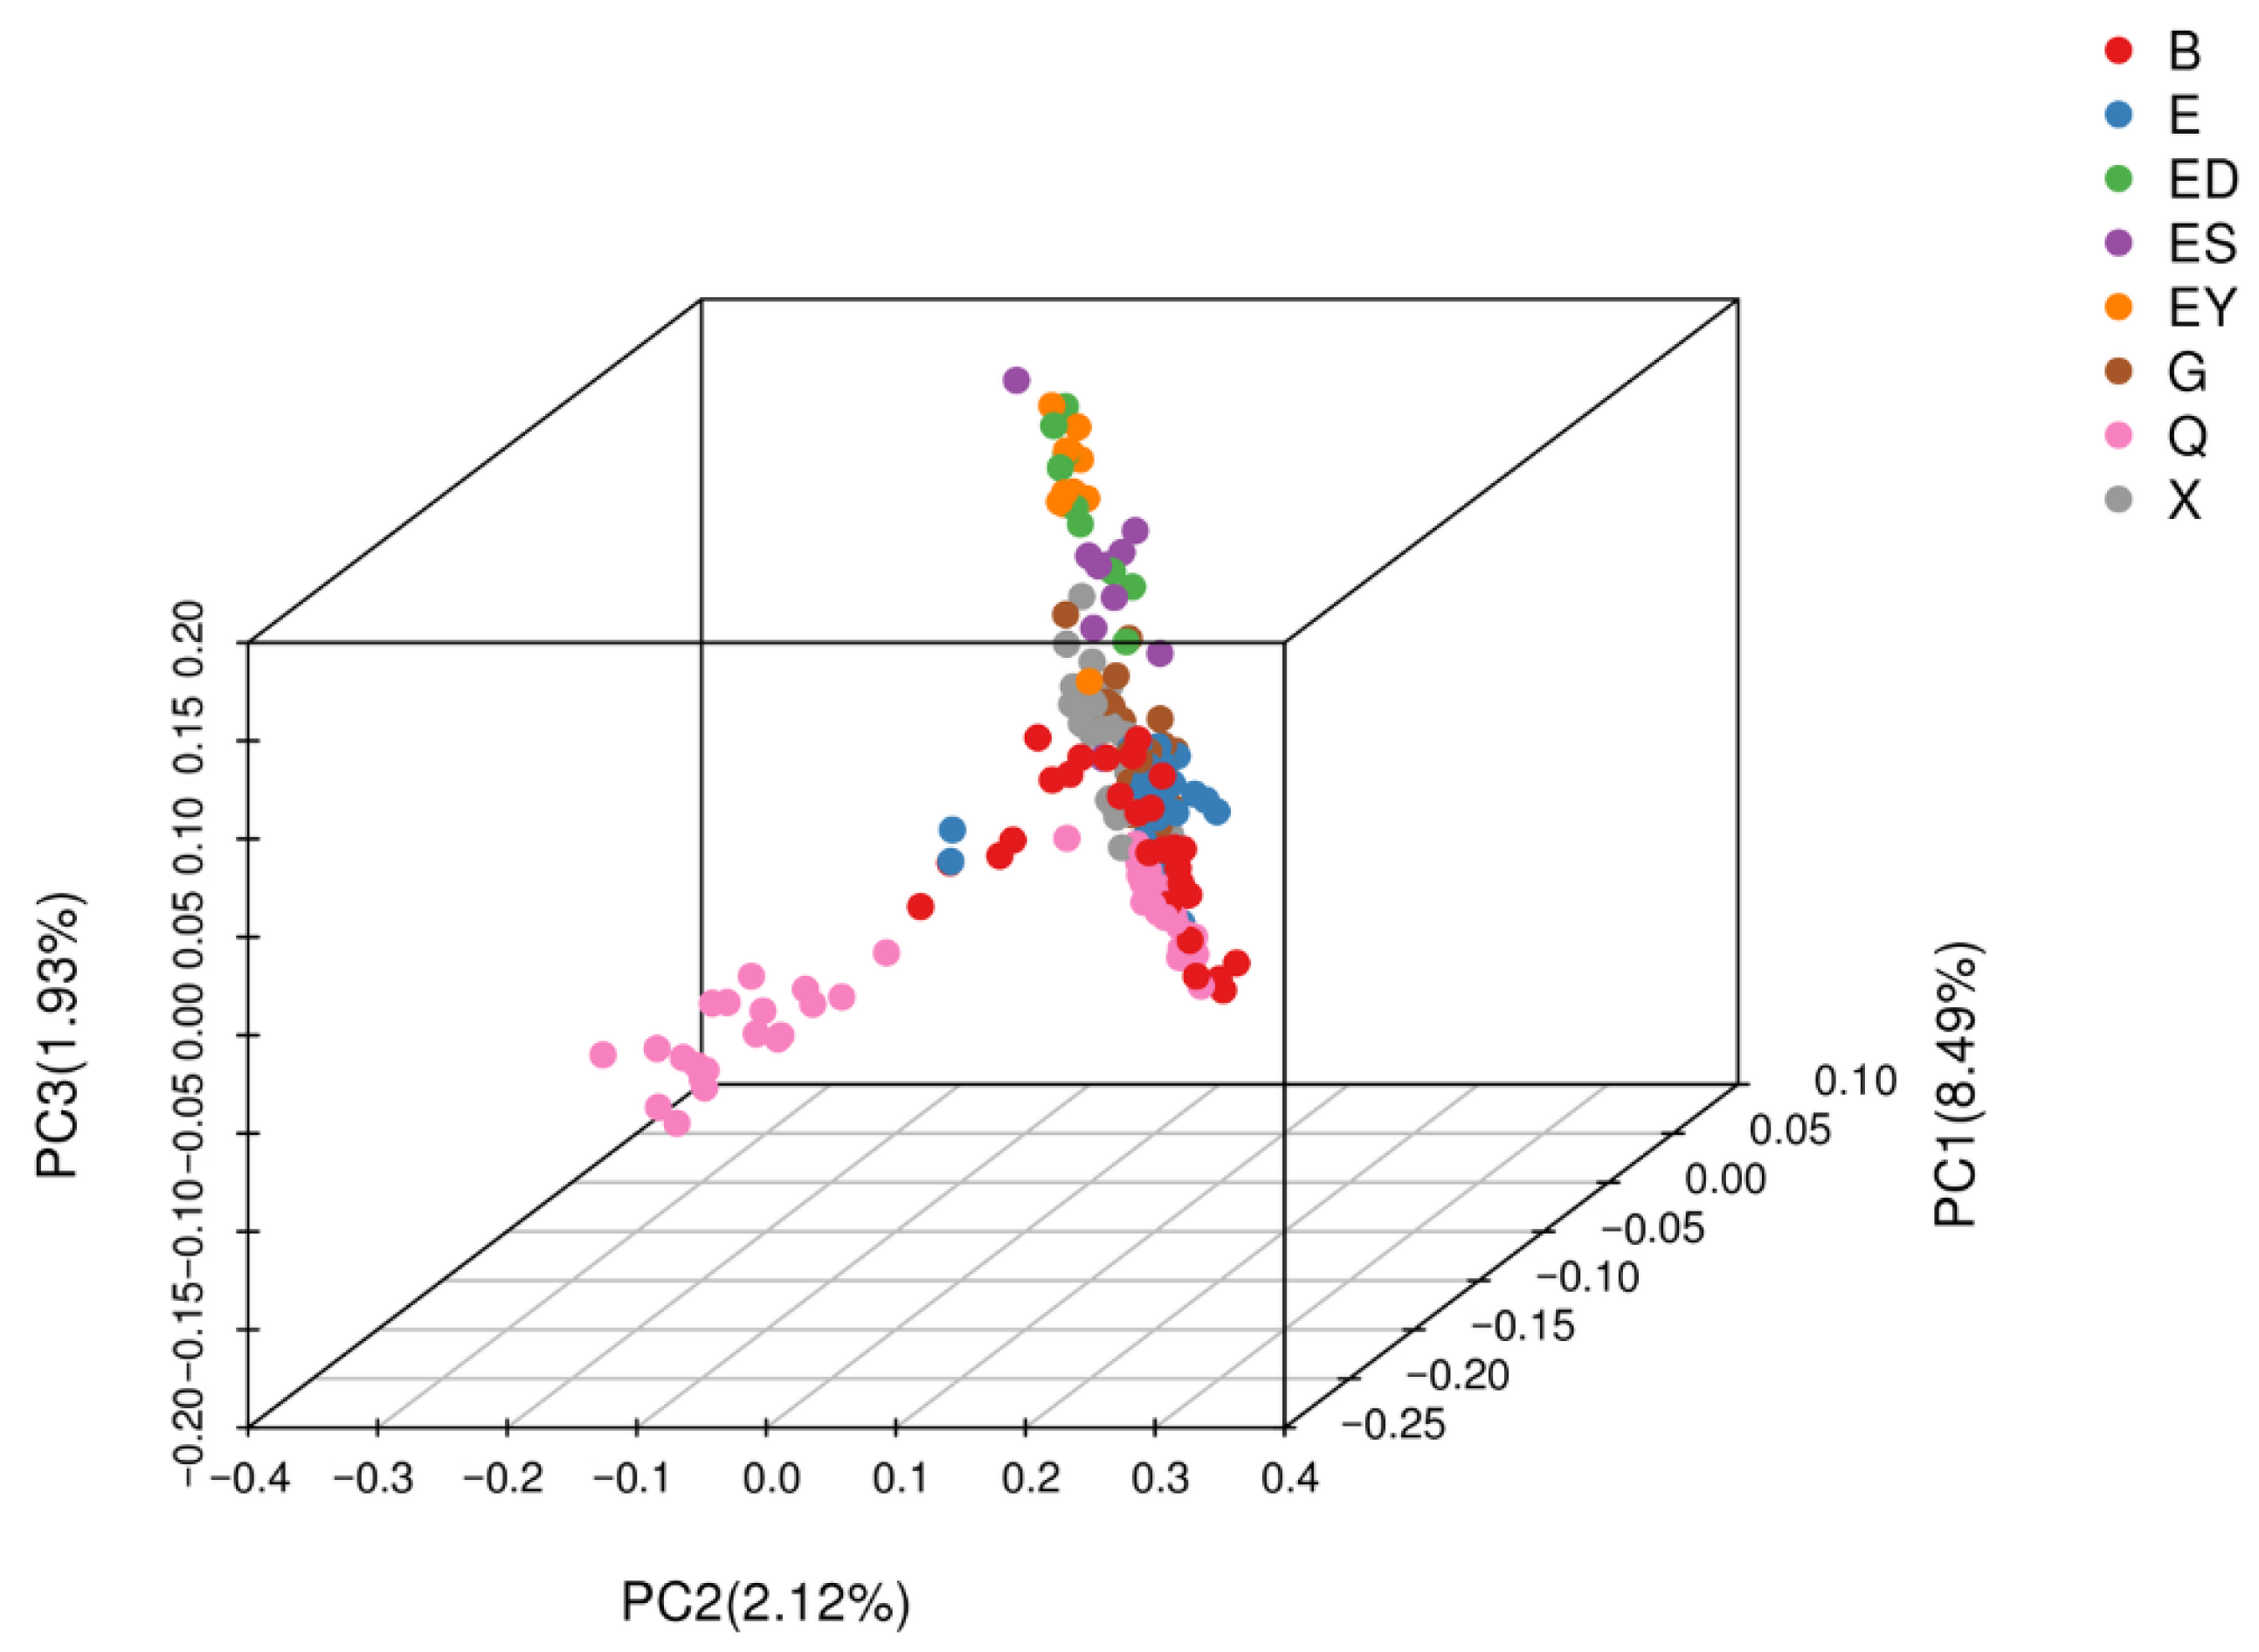
PCA was performed using EIGENSOFT software (version 6.0) to reduce dimensionality and visualize genetic relationships among the 213 L. ruthenicum accessions based on SNP variations. The first three principal components, accounting for 8.49%, 2.12%, and 1.93% of total variance, respectively, were selected as covariates to correct population structure. Three-dimensional clustering (Figure 11) and two-dimensional projections (Figure 12) revealed distinct separation along PC1, enabling classification into three groups: S1 (16 accessions), S2 (21 accessions), and S3 (176 accessions).
The PCA results showed partial concordance with previous clustering methods. Group S1 exclusively contained 14 accessions from Urad Rear Banner (Inner Mongolia) and 2 from Dalaihubu Town, while S2 comprised only 21 accessions from Nuomuhong County (Qinghai). The largest cluster S3 incorporated geographically diverse materials (Table 4). Comparative analysis (Table 5) demonstrated that while genetic groups Q1 and phylogenetic clade G1 corresponded to PCA clusters S1/S2, the admixed Q2-Q3 populations collectively formed S3, revealing complementary but non-identical patterns of population subdivision through different analytical approaches.

3.7. Analysis of Genetic Diversity

Genetic diversity analysis was conducted to examine intra-specific variation among L. ruthenicum populations by assessing differences in allele frequencies and genotype distributions. As shown in Table 6, the population exhibited a mean minor allele frequency (MAF) of 0.235 (range: 0.252–0.296), with expected allele number (Ne) averaging 1.402 (1.31–1.541). The mean expected heterozygosity (He) was 0.235 (0.178–0.318), while Nei’s diversity index (H) averaged 0.253 (0.2–0.327). The population contained an average of 21,088 polymorphic markers (A), with observed allele number (Na) averaging 1.667. Observed heterozygosity (Ho) ranged from 0.054 to 0.092 (mean: 0.075), polymorphism information content (PIC) from 0.142 to 0.255 (mean: 0.188), and Shannon-Wiener index (I) from 0.264 to 0.477 (mean: 0.352).
Notably, accessions from Nuomuhong County, Qinghai Province showed the highest values for all diversity parameters (MAF, Ne, H, A, He, Na, PIC, and I), indicating superior genetic diversity compared to other populations. In contrast, materials from Saihantala Sumu, Ejin Banner, Inner Mongolia exhibited the lowest values for Ne, He, H, A, Na, PIC and I, reflecting reduced genetic diversity in this population. These results demonstrate significant variation in genetic diversity among different geographic sources of L. ruthenicum, with implications for conservation and breeding strategies.

3.8. Construction of DNA Fingerprints

Following established marker selection criteria [33], we identified 347 high-quality SNP markers for fingerprint development based on stringent parameters including marker quality, representativeness, discriminative power, uniform genomic distribution, and specificity. The selected markers were validated through comprehensive genetic analyses including diversity assessment, phylogenetic reconstruction, population structure examination, and PCA.
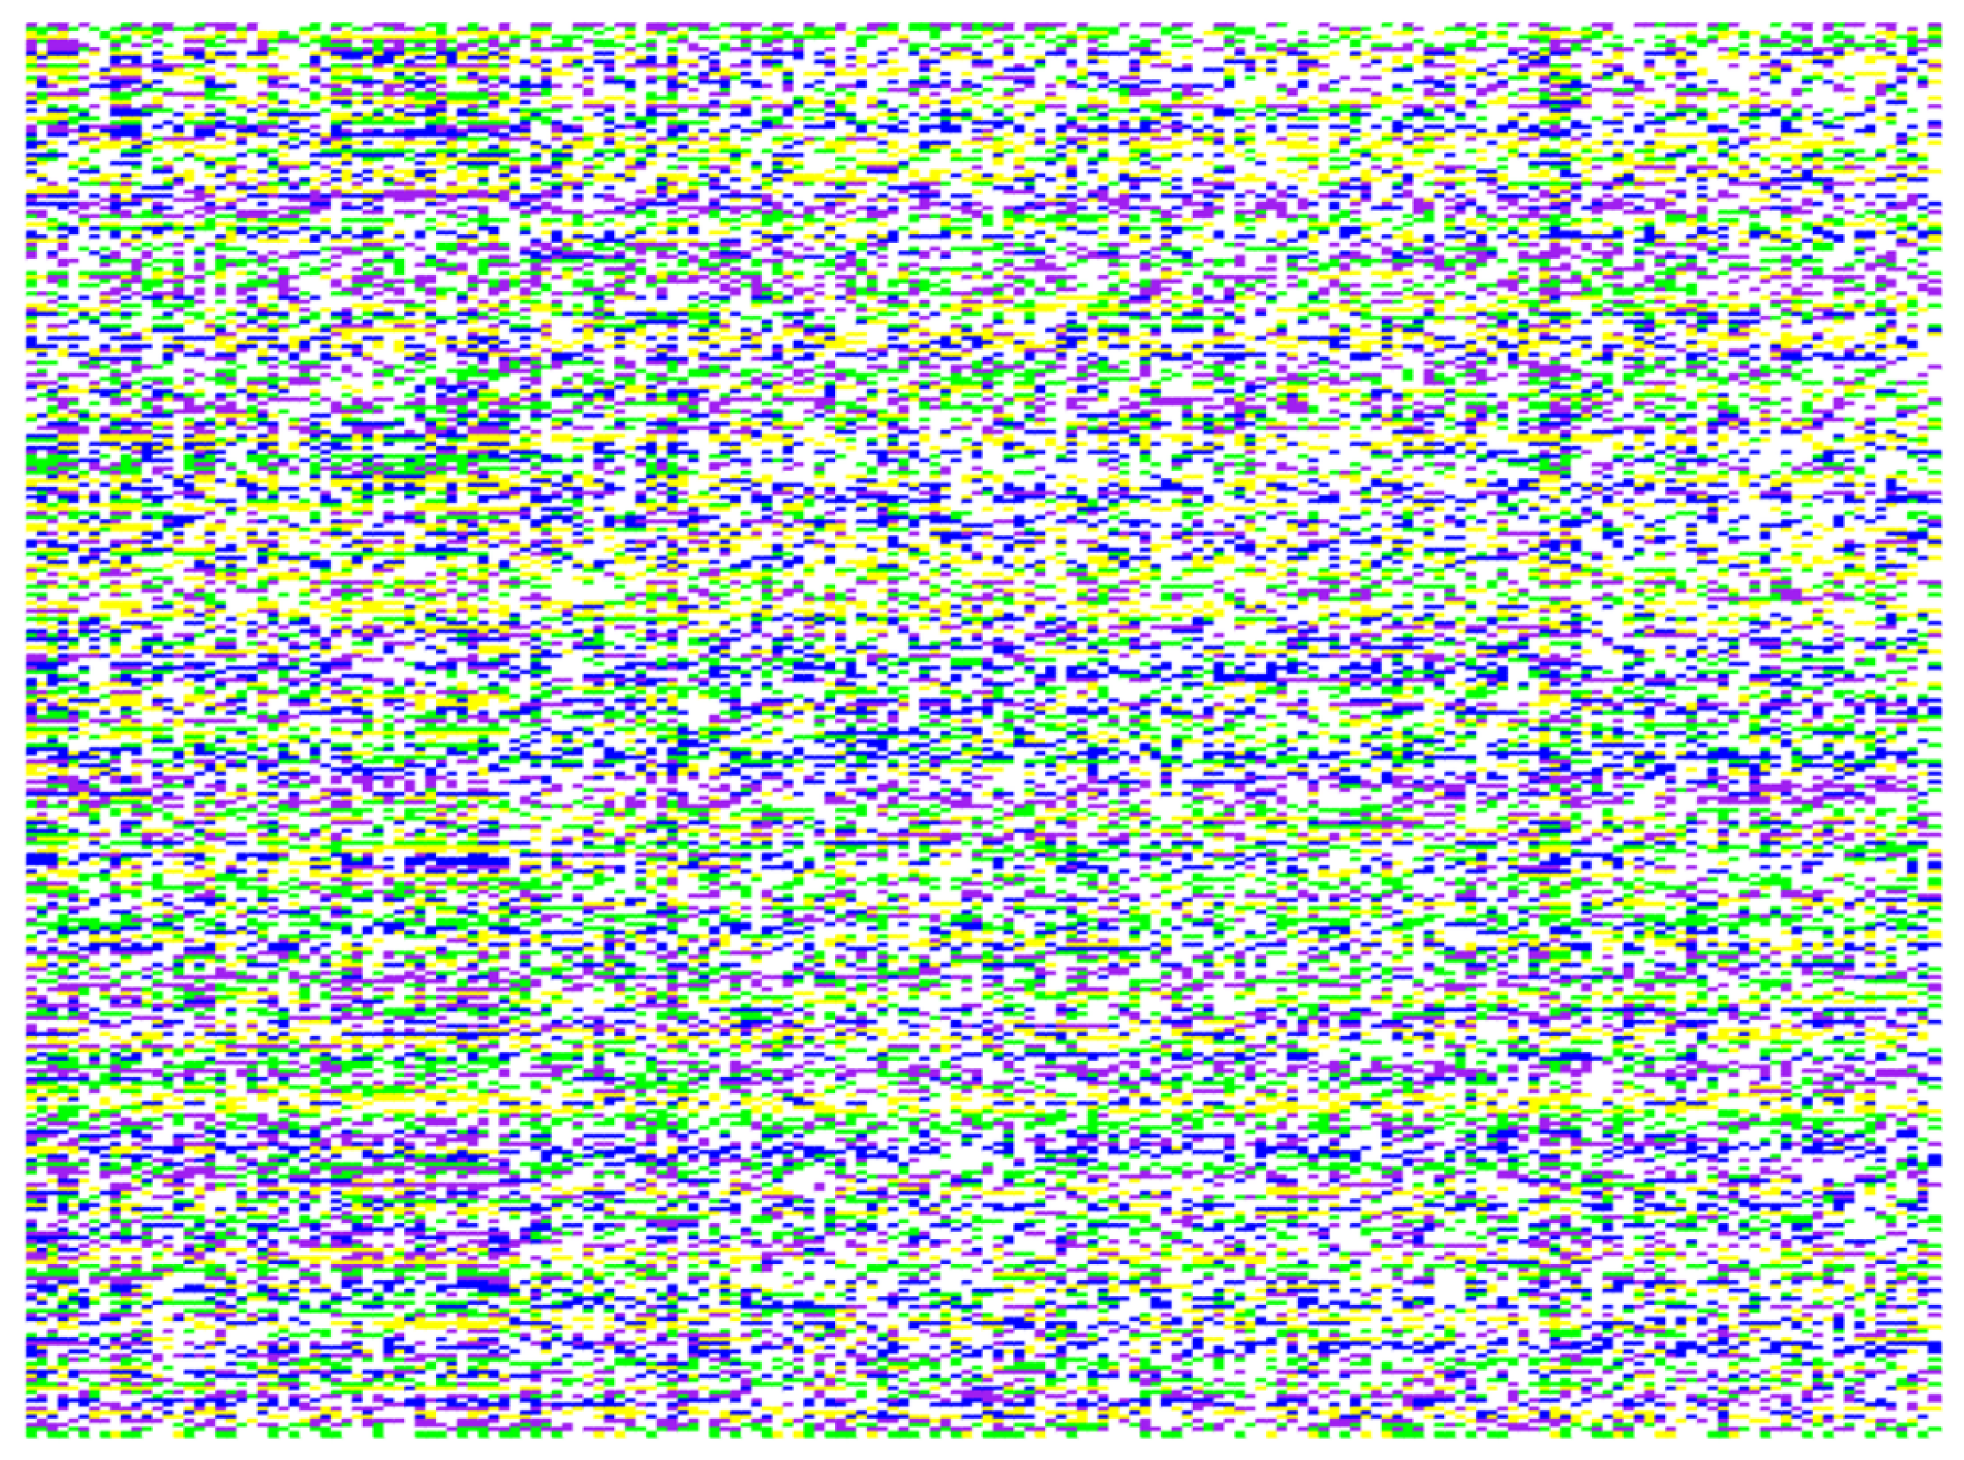
For visual representation, we developed two-dimensional barcodes (Figure 13) where nucleotide states were color-coded: yellow (C/C), green (A/A), blue (T/T), and purple (G/G), with gray indicating missing data and white representing heterozygous sites. Using Qrencode software (version 4.1.1), we generated unique 2D barcode fingerprints for each accession, with representative examples shown for six accessions (B1, BH1, E1, G1, Q1, X1) in Figure S1. This fingerprinting system enables rapid, accurate identification of L. ruthenicum germplasm while capturing the genetic diversity observed across populations.

4. Discussion

4.1. SNP-Based Identification of L. ruthenicum Germplasm

The burgeoning market demand for L. ruthenicum, a plant with dual medicinal and edible value, has driven rapid expansion of cultivated varieties and intensified germplasm exchange across regions [34]. As a self-incompatible, cross-pollinating species, L. ruthenicum exhibits high genomic heterozygosity. Natural selection and hybrid breeding have created complex genetic backgrounds where seed-propagated offspring show significant trait segregation, obscuring varietal relationships [35]. This widespread species demonstrates diverse reproductive strategies, with wild populations evolving into multiple cultivated varieties through domestication and natural genetic variation. Current reliance on morphological identification by experienced practitioners proves inadequate for effective resource utilization, conservation, and breeding programs, underscoring the need for systematic germplasm characterization.
While morphological markers provide preliminary diversity assessments, their environmental sensitivity limits reliability. SSR markers have been widely employed for plant genome mapping, selection, and association studies [36]. Zhao et al. [37] analyzed 139 L. chinense accessions using 18 SSR markers, detecting 108 alleles (average 6 per locus) with moderate genetic diversity (gene diversity = 0.3792, PIC = 0.3296) and population structure (three subpopulations, FST = 0.1178), establishing a genetic framework for L. chinense improvement. However, SSR markers’ high PCR mutation rates can introduce genotyping errors, complicating multiplex assay development. In contrast, SNPs’ lower mutation rates better suit high-throughput automated detection [7].
SLAF-seq technology enables rapid, cost-effective SNP discovery through restriction-enzyme-based reduced-representation sequencing, permitting comprehensive genome-wide analysis [38]. This approach has successfully identified major QTLs in durum wheat [39], revealed geographical genetic clusters in Capsicum annuum [40], and uncovered yield-related loci in bread wheat [41]. Diagnostic SNP development for wheat leaf rust resistance gene Lr16 further demonstrates the technique’s utility [42]. Despite these advances, SLAF-seq applications in L. ruthenicum genetic studies remained unexplored.
Our SLAF-seq analysis of 213 accessions from eight sources generated 563.48 million reads (606,309–9,355,410 per sample) with excellent quality metrics (average Q30 = 93.32%, GC = 40.11%). We developed 827,630 SLAF tags and identified 1,135,505 SNPs, with 33,121 high-confidence SNPs uniformly distributed across all 10 chromosomes. These results establish a robust foundation for L. ruthenicum genetic studies and molecular breeding.

4.2. Population Structure of L. Germplasm

Our SLAF-seq analysis of eight geographic populations aimed to facilitate conservation and genetic improvement of L. ruthenicum resources. While limited to eight sampling locations, this representative dataset effectively captures the species’ genetic diversity. Phylogenetic analysis revealed three distinct clusters, with Groups 1 and 2 primarily comprising accessions from Urad Rear Banner (Inner Mongolia) and Nuomuhong County (Qinghai), indicating close genetic relationships. Group 3 contained admixed materials from all geographic sources without clear spatial clustering, demonstrating weak genotype-geography correlations.
Population structure analysis (K = 3) showed strong concordance with phylogenetic groupings, while PCA revealed complementary patterns with minor discrepancies, suggesting both narrow genetic bases and distant relatedness among most individuals. The incomplete consistency among analytical methods—with some geographic clusters persisting alongside widespread dispersion—implies complex germplasm exchange history, possibly through seedling transplantation and regional resource sharing. Similar discordances between genetic and geographic patterns were reported in tea plant (Camellia sinensis) populations by Liu et al. [43] through SLAF-seq analysis of 47 Wanzhou tea accessions from Yunnan, Sichuan and Fujian provinces, where clustering analysis revealed three distinct groups that could not be fully classified by geographic origin, and by Fang et al. [44] in Chinese onion germplasm, where population structure (3 groups) and PCA (4 groups) yielded divergent classifications independent of geographic origins. These collective findings highlight the limitations of geographic provenance for predicting genetic relationships in outcrossing perennial crops.

4.3. Genetic Diversity of L. ruthenicum Germplasm

The genetic background of L. ruthenicum exhibits remarkable complexity, characterized by high genomic heterozygosity and substantial variation, making genetic diversity studies crucial for understanding its genetics, breeding, identification, and evolutionary history [45]. Current research on Lycium diversity has primarily relied on phenotypic traits and molecular markers. Yin et al. [19] constructed an SSR-AFLP genetic linkage map in Lycium spp., establishing a foundation for QTL mapping and marker-assisted breeding, while Liu et al. [46] employed ISSR and RAMP-PCR markers to reveal genetic connections between geographically distant cultivars, offering valuable insights for medicinal plant conservation. However, these marker systems have shown limitations in fully capturing Lycium’s genetic diversity, necessitating more precise methodologies.
Our study represents the first comprehensive analysis of L. ruthenicum genetic diversity using SNP markers through SLAF-seq data from 213 accessions. We evaluated diversity using standard metrics including mean allele frequency (0.269), Nei’s diversity index (0.253), polymorphic loci count (21,088), observed alleles (1.666), observed heterozygosity (0.075), polymorphism information content (0.188), and Shannon-Wiener index (0.352). The Nuomuhong population from Qinghai Province consistently showed higher diversity values than other sources, indicating moderate-to-high genetic diversity. Notably, the average PIC value (0.188) classified the germplasm as having low polymorphism (PIC < 0.25), consistent with findings from Guan et al. [47] employing SCoT markers (mean PIC = 0.2253).
Comparative studies reveal intriguing contrasts: Gao et al. [48] reported high diversity in wild L. barbarum (He = 0.57, PIC = 0.73) using SSRs, while Zhao et al. [37] documented moderate polymorphism (mean PIC = 0.3296) in L. chinense. These discrepancies with our results may stem from methodological differences, as Li et al. [49] found substantial diversity using phenotypic and AFLP analyses. Such variations underscore the importance of integrating multiple approaches and sampling strategies for accurate diversity assessments in Lycium species. The observed low average PIC value (0.188) can be attributed to a combination of biological and technical factors. Biologically, the species may have undergone a genetic bottleneck during domestication, reducing overall genetic diversity. Technically, the stringent filtering criteria applied to ensure SNP quality, particularly the minor allele frequency (MAF ≥ 0.05) and locus integrity (INT ≥ 0.3) thresholds, inevitably removed rare alleles from the dataset. While this enhances the reliability of the high-confidence SNP set for population genetic analysis, it can lead to an underestimation of the total polymorphism present in the population, as rare variants contributing to higher PIC values are excluded. Furthermore, the inherent biallelic nature of SNPs imposes a theoretical maximum PIC value lower than that of multi-allelic markers like SSRs, which naturally constrains the upper limit of polymorphism measurable with SNP datasets. The PIC values reported in this study therefore reflect a robust but conservative estimate of genetic diversity, optimized for population genetic inference rather than the absolute capture of all polymorphic sites.

4.4. Comparative Analysis of SNP-Based and Phenotypic Clustering in L. ruthenicum Germplasm

High-quality SNPs derived from SLAF-seq data enabled comprehensive phylogenetic, population structure, and principal component analyses, consistently grouping the 213 L. ruthenicum accessions into three major clusters. The classification concordance rates reached 71.9% between population structure and phylogenetic groupings, and 60.25% with PCA, demonstrating strong methodological consistency and mutual validation. In contrast, phenotypic trait-based R-type clustering of 31 morphological characteristics divided the accessions into five categories, while Q-type clustering generated six distinct groups, both showing limited concordance with molecular marker-based classifications.
These findings align with Li et al. [49], who reported low consistency between SNP clustering and agronomic trait classifications in sweet orange germplasm. The observed discrepancies highlight that current DNA markers and phenotypic traits lack sufficient correlation for comprehensive germplasm characterization. While molecular markers effectively cluster accessions with shared genetic backgrounds, phenotypic classifications often fail to reflect these relationships due to environmental influences on trait expression. Minor DNA sequence variations undetectable by current marker systems may underlie these phenotypic differences.
Our results underscore the complementary value of integrating molecular markers and phenotypic data—while SNP analyses provide robust genetic relationships, phenotypic evaluations remain essential for validating breeding-relevant characteristics. This dual approach addresses the limitations of each method, as environmental plasticity affects phenotypic expression, and current marker coverage may miss functionally important genomic regions influencing observable traits. The combined strategy offers a more holistic framework for germplasm characterization and breeding program optimization in L. ruthenicum.

5. Conclusions

This study establishes the first genome-wide high-density SNP marker system for L. ruthenicum using SLAF-seq technology, systematically characterizing the genetic diversity and population structure of both wild and cultivated germplasm. Reduced-representation genome sequencing of 213 accessions (average sequencing depth: Q30 > 93%, GC content 40.11%) generated 827,630 SLAF tags and 33,121 high-quality SNPs uniformly distributed across all 12 chromosomes, creating the most comprehensive genomic variation database for this species to date.
Key genetic findings include: (1) Phylogenetic, population structure, and principal component analyses consistently grouped accessions into three genetic clusters with weak geographic correlation (<60% origin consistency), suggesting human-mediated germplasm exchange has reduced isolation-by-distance effects; (2) diversity assessment identified Nuomuhong (Qinghai) populations as having the highest genetic variation (Nei’s index 0.253, Shannon index 0.352), making them priority candidates for core collection development, while the overall low average polymorphism (PIC = 0.183) likely reflects both SNP biallelic limitations and cultivation-induced genetic bottlenecks; (3) the <40% concordance between SNP-based and phenotypic clustering (31 traits) confirms environmental plasticity’s dominant role in trait variation, while highlighting the need for multi-omics integration to decipher complex trait genetics.
These results provide the first genomic SNP reference system for L. ruthenicum germplasm identification, with the 33,121 high-confidence markers enabling immediate implementation in marker-assisted breeding. The documented genetic admixture underscores the urgent need for standardized germplasm tracking protocols to conserve wild genetic resources. Future research should integrate transcriptomic and metabolomic data to functionally validate LG10 (SNP hotspot) and elucidate molecular mechanisms underlying key traits like anthocyanin biosynthesis, facilitating the transition from traditional to precision breeding paradigms in L. ruthenicum improvement.

Supplementary Materials

The following supporting information can be downloaded at: https://www.mdpi.com/article/10.3390/plants14213374/s1, Figure S1: QR code fingerprint spectrum of representative L. ruthenicum accessions. Table S1: The genetic groups among 213 Lycium ruthenicum Murr. samples by population structure analysis. Table S2: 213 L. ruthenicum samples on population structure analysis, phylogenetic analysis and PCA.

Author Contributions

Conceptualization, L.H. and Y.B.; Methodology, R.Y. and X.W.; Validation, X.W., Y.H. and S.C.; Formal analysis, R.Y.; Investigation, R.Y. and Y.H.; Resources, Y.B.; Data curation, X.W. and S.C.; Writing—original draft, R.Y.; Writing—review & editing, L.H., Y.B. and X.W.; Visualization, R.Y.; Supervision, L.H. and Y.B.; Project administration, L.H.; Funding acquisition, Y.B. All authors have read and agreed to the published version of the manuscript.

Funding

This research was funded by the “Open bidding for selecting the best candidates” project for enhancing research capabilities of the Inner Mongolia Autonomous Region Academy of Forestry Science, grant number 2024NLTS02 and Inner Mongolia Autonomous Region Science and Technology Program, grant number 2021GG0034.

Data Availability Statement

The original contributions presented in this study are included in the article/Supplementary Materials. Further inquiries can be directed to the corresponding authors.

Conflicts of Interest

The authors declare no conflicts of interest.

References

  1. Yao, R.; Heinrich, M.; Weckerle, C.S. The Genus Lycium as Food and Medicine: A Botanical, Ethnobotanical and Historical Review. J. Ethnopharmacol. 2018, 212, 50–66. [Google Scholar] [CrossRef] [PubMed]
  2. Guo, Y.; An, L.; Yu, H.; Yang, M. Endogenous Hormones and Biochemical Changes during Flower Development and Florescence in the Buds and Leaves of Lycium ruthenicum Murr. Forests 2022, 13, 763. [Google Scholar] [CrossRef]
  3. Tiika, R.J.; Wei, J.; Ma, R.; Yang, H.; Cui, G.; Duan, H.; Ma, Y. Identification and Expression Analysis of the WRKY Gene Family during Different Developmental Stages in Lycium ruthenicum Murr. Fruit. PeerJ 2020, 8, e10207. [Google Scholar] [CrossRef]
  4. Manju Devi, S.; Joel, A.J.; Raveendran, M.; Pushpam, R.; Muthuramu, S.; Pushpa, R.; Sritharan, N.; Prasanna, P.; Suresh, R. Unravelling Population Structure and Marker Trait Association Using SSR Markers among the Identified Drought Tolerant Rice Landraces (Oryza sativa L.). Czech J. Genet. Plant Breed. 2025, 61, 1–22. [Google Scholar] [CrossRef]
  5. Tahir, N.; Lateef, D.; Rasul, K.; Rahim, D.; Mustafa, K.; Sleman, S.; Mirza, A.; Aziz, R. Assessment of Genetic Variation and Population Structure in Iraqi Barley Accessions Using ISSR, CDDP, and SCoT Markers. Czech J. Genet. Plant Breed. 2023, 59, 148–159. [Google Scholar] [CrossRef]
  6. Zhou, Y.; Pan, H. Specific-Locus Amplified Fragment Sequencing (SLAF-Seq). In Plant Genotyping: Methods and Protocols; Shavrukov, Y., Ed.; Springer US: New York, NY, USA, 2023; pp. 165–171. ISBN 978-1-0716-3024-2. [Google Scholar]
  7. Zhu, Z.; Sun, B.; Lei, J. Specific-Locus Amplified Fragment Sequencing (SLAF-Seq) as High-Throughput SNP Genotyping Methods. In Crop Breeding: Genetic Improvement Methods; Tripodi, P., Ed.; Springer US: New York, NY, USA, 2021; pp. 75–87. ISBN 978-1-0716-1201-9. [Google Scholar]
  8. Wu, X.; Feng, F.; Zhu, Y.; Xie, F.; Yang, J.; Gong, J.; Liu, Y.; Zhu, W.; Gao, T.; Chen, D.; et al. Construction of High-Density Genetic Map and Identification of QTLs Associated with Seed Vigor after Exposure to Artificial Aging Conditions in Sweet Corn Using SLAF-Seq. Genes 2020, 11, 37. [Google Scholar] [CrossRef]
  9. Liao, Z.; Xia, X.; Zhang, Z.; Nong, B.; Guo, H.; Feng, R.; Chen, C.; Xiong, F.; Qiu, Y.; Li, D.; et al. Genome-Wide Association Study Using Specific-Locus Amplified Fragment Sequencing Identifies New Genes Influencing Nitrogen Use Efficiency in Rice Landraces. Front. Plant Sci. 2023, 14, 1126254. [Google Scholar] [CrossRef]
  10. Mandozai, A.; Moussa, A.A.; Zhang, Q.; Qu, J.; Du, Y.; Anwari, G.; Al Amin, N.; Wang, P. Genome-Wide Association Study of Root and Shoot Related Traits in Spring Soybean (Glycine max L.) at Seedling Stages Using SLAF-Seq. Front. Plant Sci. 2021, 12, 568995. [Google Scholar] [CrossRef]
  11. Yu, T.; Zhang, J.; Cao, J.; Ma, X.; Cao, S.; Li, W.; Yang, G.; Li, S. QTL Analysis of Low-Temperature Tolerance in Maize Germination by SLAF-Seq and BSA Technique. Electron. J. Biotechnol. 2024, 70, 14–22. [Google Scholar] [CrossRef]
  12. Ren, H.; Han, J.; Wang, X.; Zhang, B.; Yu, L.; Gao, H.; Hong, H.; Sun, R.; Tian, Y.; Qi, X.; et al. QTL Mapping of Drought Tolerance Traits in Soybean with SLAF Sequencing. Crop J. 2020, 8, 977–989. [Google Scholar] [CrossRef]
  13. Mi, X.; Qiao, D.; An, Y.; Yang, C.; Lin, K.; Peng, C.; Chen, J. Genome-Wide Association Study of Tea Plant Based on SLAF-Seq Revealed SNP Variations Regulating Timing of Bud Flush. Plant Gene 2025, 42, 100511. [Google Scholar] [CrossRef]
  14. Rehman, F.; Gong, H.; Li, Z.; Zeng, S.; Yang, T.; Ai, P.; Pan, L.; Huang, H.; Wang, Y. Identification of Fruit Size Associated Quantitative Trait Loci Featuring SLAF Based High-Density Linkage Map of Goji Berry (Lycium Spp.). BMC Plant Biol. 2020, 20, 474. [Google Scholar] [CrossRef]
  15. Wang, C.; Qin, K.; Shang, X.; Gao, Y.; Wu, J.; Ma, H.; Wei, Z.; Dai, G. Mapping Quantitative Trait Loci Associated with Self-(in)Compatibility in Goji Berries (Lycium barbarum). BMC Plant Biol. 2024, 24, 441. [Google Scholar] [CrossRef]
  16. Rehman, F.; Gong, H.; Ma, Y.; Zeng, S.; Ke, D.; Yang, C.; Zhao, Y.; Wang, Y. An Ultra-Dense Linkage Map Identified Quantitative Trait Loci Corresponding to Fruit Quality- and Size-Related Traits in Red Goji Berry. Front. Plant Sci. 2024, 15, 1390936. [Google Scholar] [CrossRef] [PubMed]
  17. Rehman, F.; Zeng, S.; Zhao, Y.; Zhao, J.; Qin, K.; Yang, C.; Huang, H.; Wang, Y. Preservation and Innovation of Goji Berry Germplasm Resources. Med. Plant Biol. 2024, 3, e022. [Google Scholar] [CrossRef]
  18. Ciceoi, R.; Asanica, A.; Luchian, V.; Iordachescu, M. Genomic Analysis of Romanian Lycium Genotypes: Exploring BODYGUARD Genes for Stress Resistance Breeding. Int. J. Mol. Sci. 2024, 25, 2130. [Google Scholar] [CrossRef]
  19. Yin, Y.; Qin, X.; Zhao, J.; An, W.; Li, Y.; Fan, Y.; Wang, Y.; Cao, Y. Genome-Wide Identification of Microsatellite Markers and Their Application in Genetic Studies of Wolfberry (Lycium barbarum). bioRxiv 2022, 2022-05. [Google Scholar] [CrossRef]
  20. Aboul-Maaty, N.A.F.; Oraby, H.A.S. Extraction of High-Quality Genomic DNA from Different Plant Orders Applying a Modified CTAB-Based Method. Bull. Natl. Res. Cent. 2019, 43, 25. [Google Scholar] [CrossRef]
  21. Sun, X.; Liu, D.; Zhang, X.; Li, W.; Liu, H.; Hong, W.; Jiang, C.; Guan, N.; Ma, C.; Zeng, H.; et al. SLAF-Seq: An Efficient Method of Large-Scale De Novo SNP Discovery and Genotyping Using High-Throughput Sequencing. PLoS ONE 2013, 8, e58700. [Google Scholar] [CrossRef]
  22. Cao, Y.; Li, Y.; Fan, Y.; Li, Z.; Yoshida, K.; Wang, J.; Ma, X.; Wang, N.; Mitsuda, N.; Kotake, T.; et al. Wolfberry Genomes and the Evolution of Lycium (Solanaceae). Commun. Biol. 2021, 4, 671. [Google Scholar] [CrossRef]
  23. Davey, J.W.; Cezard, T.; Fuentes-Utrilla, P.; Eland, C.; Gharbi, K.; Blaxter, M.L. Special Features of RAD Sequencing Data: Implications for Genotyping. Mol. Ecol. 2013, 22, 3151–3164. [Google Scholar] [CrossRef] [PubMed]
  24. Li, H.; Durbin, R. Fast and Accurate Short Read Alignment with Burrows–Wheeler Transform. Bioinformatics 2009, 25, 1754–1760. [Google Scholar] [CrossRef] [PubMed]
  25. Li, H.; Handsaker, B.; Wysoker, A.; Fennell, T.; Ruan, J.; Homer, N.; Marth, G.; Abecasis, G.; Durbin, R. 1000 Genome Project Data Processing Subgroup The Sequence Alignment/Map Format and SAMtools. Bioinformatics 2009, 25, 2078–2079. [Google Scholar] [CrossRef] [PubMed]
  26. McKenna, A.; Hanna, M.; Banks, E.; Sivachenko, A.; Cibulskis, K.; Kernytsky, A.; Garimella, K.; Altshuler, D.; Gabriel, S.; Daly, M. The Genome Analysis Toolkit: A MapReduce Framework for Analyzing next-Generation DNA Sequencing Data. Genome Res. 2010, 20, 1297–1303. [Google Scholar] [CrossRef]
  27. Cingolani, P.; Platts, A.; Wang, L.L.; Coon, M.; Nguyen, T.; Wang, L.; Land, S.J.; Lu, X.; Ruden, D.M. A Program for Annotating and Predicting the Effects of Single Nucleotide Polymorphisms, SnpEff: SNPs in the Genome of Drosophila melanogaster Strain W1118; Iso-2; Iso-3. Fly 2012, 6, 80–92. [Google Scholar] [CrossRef]
  28. Alexander, D.H.; Novembre, J.; Lange, K. Fast Model-Based Estimation of Ancestry in Unrelated Individuals. Genome Res. 2009, 19, 1655–1664. [Google Scholar] [CrossRef]
  29. Tamura, K.; Peterson, D.; Peterson, N.; Stecher, G.; Nei, M.; Kumar, S. MEGA5: Molecular Evolutionary Genetics Analysis Using Maximum Likelihood, Evolutionary Distance, and Maximum Parsimony Methods. Mol. Biol. Evol. 2011, 28, 2731–2739. [Google Scholar] [CrossRef]
  30. Trees, R.P. The Neighbor-Joining Method: A New Method For. Mol. Biol. Evol. 1987, 4, 406–425. [Google Scholar] [CrossRef]
  31. Price, A.L.; Patterson, N.J.; Plenge, R.M.; Weinblatt, M.E.; Shadick, N.A.; Reich, D. Principal Components Analysis Corrects for Stratification in Genome-Wide Association Studies. Nat. Genet. 2006, 38, 904–909. [Google Scholar] [CrossRef]
  32. Yang, J.; Lee, S.H.; Goddard, M.E.; Visscher, P.M. GCTA: A Tool for Genome-Wide Complex Trait Analysis. Am. J. Hum. Genet. 2011, 88, 76–82. [Google Scholar] [CrossRef]
  33. Wang, Y.; Lv, H.; Xiang, X.; Yang, A.; Feng, Q.; Dai, P.; Li, Y.; Jiang, X.; Liu, G.; Zhang, X. Construction of a SNP Fingerprinting Database and Population Genetic Analysis of Cigar Tobacco Germplasm Resources in China. Front. Plant Sci. 2021, 12, 618133. [Google Scholar] [CrossRef] [PubMed]
  34. Mu, D.; Zhou, G.; Li, J.; Su, B.; Guo, H. Ursolic Acid Activates the Apoptosis of Prostate Cancer via ROCK/PTEN Mediated Mitochondrial Translocation of Cofilin-1. Oncol. Lett. 2018, 15, 3202–3206. [Google Scholar] [CrossRef] [PubMed]
  35. Abdul Aziz, M.; Masmoudi, K. Molecular Breakthroughs in Modern Plant Breeding Techniques. Hortic. Plant J. 2025, 11, 15–41. [Google Scholar] [CrossRef]
  36. Shahnazari, N.; Noormohammadi, Z.; Sheidai, M.; Koohdar, F. A New Insight on Genetic Diversity of Sweet Oranges: CAPs-SSR and SSR Markers. J. Genet. Eng. Biotechnol. 2022, 20, 105. [Google Scholar] [CrossRef]
  37. Zhao, W.-G.; Chung, J.-W.; Cho, Y.-I.; Rha, W.-H.; Lee, G.-A.; Ma, K.-H.; Han, S.-H.; Bang, K.-H.; Park, C.-B.; Kim, S.-M. Molecular Genetic Diversity and Population Structure in Lycium Accessions Using SSR Markers. Comptes rendus. Biol. 2010, 333, 793–800. [Google Scholar] [CrossRef]
  38. Chen, Z.; He, Y.; Iqbal, Y.; Shi, Y.; Huang, H.; Yi, Z. Investigation of Genetic Relationships within Three Miscanthus Species Using SNP Markers Identified with SLAF-Seq. BMC Genom. 2022, 23, 43. [Google Scholar] [CrossRef]
  39. AbuHammad, W.A.; Mamidi, S.; Kumar, A.; Pirseyedi, S.; Manthey, F.A.; Kianian, S.F.; Alamri, M.S.; Mergoum, M.; Elias, E.M. Identification and Validation of a Major Cadmium Accumulation Locus and Closely Associated SNP Markers in North Dakota Durum Wheat Cultivars. Mol. Breed. 2016, 36, 112. [Google Scholar] [CrossRef]
  40. Taranto, F.; D’Agostino, N.; Greco, B.; Cardi, T.; Tripodi, P. Genome-Wide SNP Discovery and Population Structure Analysis in Pepper (Capsicum Annuum) Using Genotyping by Sequencing. BMC Genom. 2016, 17, 943. [Google Scholar] [CrossRef]
  41. Khan, H.; Krishnappa, G.; Kumar, S.; Mishra, C.N.; Krishna, H.; Devate, N.B.; Rathan, N.D.; Parkash, O.; Yadav, S.S.; Srivastava, P. Genome-Wide Association Study for Grain Yield and Component Traits in Bread Wheat (Triticum aestivum L.). Front. Genet. 2022, 13, 982589. [Google Scholar] [CrossRef]
  42. Kassa, M.T.; You, F.M.; Hiebert, C.W.; Pozniak, C.J.; Fobert, P.R.; Sharpe, A.G.; Menzies, J.G.; Humphreys, D.G.; Rezac Harrison, N.; Fellers, J.P. Highly Predictive SNP Markers for Efficient Selection of the Wheat Leaf Rust Resistance Gene Lr16. BMC Plant Biol. 2017, 17, 45. [Google Scholar] [CrossRef]
  43. Liu, Y.; Teng, Y.; Zheng, J.; Khan, A.; Li, X.; Tian, Y.; Cui, J.; Guo, Q. Analysis of Genetic Diversity in Tea Plant Population and Construction of DNA Fingerprint Profile Using SNP Markers Identified by SLAF-Seq. Horticulturae 2025, 11, 529. [Google Scholar] [CrossRef]
  44. Fang, H.; Liu, H.; Ma, R.; Liu, Y.; Li, J.; Yu, X.; Zhang, H.; Yang, Y.; Zhang, G. Genome-Wide Assessment of Population Structure and Genetic Diversity of Chinese Lou Onion Using Specific Length Amplified Fragment (SLAF) Sequencing. PLoS ONE 2020, 15, e0231753. [Google Scholar] [CrossRef] [PubMed]
  45. Gong, H.; Rehman, F.; Ma, Y.; Zeng, S.; Yang, T.; Huang, J.; Li, Z.; Wu, D.; Wang, Y. Germplasm Resources and Strategy for Genetic Breeding of Lycium Species: A Review. Front. Plant Sci. 2022, 13, 802936. [Google Scholar] [CrossRef] [PubMed]
  46. Liu, X.; Du, J.; Khan, M.A.; Cheng, J.; Wei, C.; Mei, Z.; Chen, H.; He, T.; Fu, J. Analysis of Genetic Diversity and Similarities between Different Lycium Varieties Based on ISSR Analysis and RAMP-PCR Markers. World Acad. Sci. J. 2020, 2, 83–90. [Google Scholar] [CrossRef]
  47. Guan, J.; Lv, X.; Cui, G.; Fan, M.; Zhao, X. SCoT analysis on germplasm genetic diversity of 13 Lycium barbarum resources in Zhongning County. Lishizhen Med. Mater. Medica Res. 2022, 33, 2268–2271. [Google Scholar]
  48. Gao, X.; Li, J.; Song, J.; Guo, Q. The SSR Genetic Diversity of Wild Red Fruit Lycium (Lycium barbarum) in Northwest China. Forests 2023, 14, 1598. [Google Scholar] [CrossRef]
  49. Li, Y.; Fan, Y.; Dai, G.; An, W.; Cao, Y. Analysis of Genetic Diversity for Wolfberry Germplasms by AFLP Technology. Chin. Tradit. Herb. Drugs 2011, 42, 770–773. [Google Scholar]
Figure 1. The process of SLAF-seq technology.
Plants 14 03374 g001
Figure 2. The development process of SNP marker.
Plants 14 03374 g002
Figure 3. The detection of DNA extraction of B1~B12 L. ruthenicum leaves.
Plants 14 03374 g003
Figure 4. The reference sequence insert size distribution and 4 bases content distribution. (A) displays the insert size distribution of control sequences, while (B) shows the nucleotide base composition. The first 126 bp represent the base distribution of Read 1 in paired-end sequencing, and the subsequent 126 bp represent Read 2, with each base position (bp) corresponding to an individual sequenced nucleotide.
Plants 14 03374 g004
Figure 5. Sequencing statistics showing (a) total reads per sample and (b) population-level GC content and Q30 scores distribution.
Plants 14 03374 g005
Figure 6. SLAF tag statistics showing (a) SLAF tag counts and (b) total sequencing depth and average depth per sample.
Plants 14 03374 g006
Figure 7. Chromosomal distribution of SLAF tags and SNPs in L. ruthenicum: (A) Density of SLAF tags; (B) Density of genome-wide SNPs.
Plants 14 03374 g007
Figure 8. Phylogenetic tree of 213 L. ruthenicum based on SNPs. The neighbor-joining tree, constructed based on genome-wide SNP data, reveals three distinct genetic clusters (G1, G2, and G3). The clustering pattern shows a weak correlation with geographic origins, indicating extensive germplasm exchange and genetic admixture among populations from different regions.
Plants 14 03374 g008
Figure 9. K value cross-validation errors rate.
Plants 14 03374 g009
Figure 10. Population structure analysis of 213 L. ruthenicum Samples. Different colors represent different subpopulations: blue for Q1, red for Q2, and green for Q3.
Plants 14 03374 g010
Figure 11. 3D clustering plot of Principal component analysis forthe 213 L. ruthenicum samples.
Plants 14 03374 g011
Figure 12. 2D Clustering Plot of PCA forthe 213 L. ruthenicum samples.
Plants 14 03374 g012
Figure 13. Distribution of candidate markers across samples, with each row representing a filtered candidate locus and each column corresponding to a sample.
Plants 14 03374 g013
Table 1. Collection information of germplasm resources.
No.Seed Source LocationProvinceCodeCoordinatesElevation (m)
1Urad Rear Banner, Bayannur CityInner MongoliaB (B1-29)E:106.56° N:40.80°996.0
2Dalaihubu Town, Ejin BannerInner MongoliaE (E1-29)E:100.97° N:41.858°899.6
3Subonaoer Sumu, Ejin BannerInner MongoliaES (ES1-10)E:101.04° N:42.12°869.2
4Dongfeng Town, Ejin BannerInner MongoliaED (ED1-9)E:101.07° N:42.01°873.0
5Saihantala Sumu, Ejin BannerInner MongoliaEY (EY1-11)E:100.59° N:41.88°911.0
6Guazhou County, GansuGansuG (G1-29)E:94.99° N:40.26°1274.0
7Wushi County, Aksu, XinjiangXinjiangX (X1-35)E:78.53° N:41.30°1379.0
8Nuomuhong County, QinghaiQinghaiQ (Q1-61)E:96.19° N:36.25°2712.0
Table 2. SLAF number and polymorphic SLAF number in chromosome distribution.
Chromosome IDSLAF Tag CountPolymorphic SLAF Tags
Chr0185375074
Chr0283934288
Chr0378884901
Chr0475424625
Chr0576514780
Chr0671874489
Chr0767994212
Chr0869864336
Chr0962843910
Chr1071504515
Chr1174984024
Chr1260124062
Table 3. Distribution of the different origin samples in inferred groups clustered by phylogenetic analysis.
Phylogenetic AnalysisBEESEDEYQGXAllRatio(%)
G114200023003918.31
G215000024003918.31
G3029981114293513563.38
All29319811612935213100%
Table 4. Distribution of the different origin samples in inferred groups clustered by population structure.
Population StructureBEESEDEYQGXAll
Q1141100210037
Q20299110132569
Q31427000401625107
All283010911612950213
Table 5. Distribution of the different origin samples in inferred groups clustered by PCA.
PCA GroupsBEESEDEYQGXAll
S114200000016
S200000210021
S3152610911402950176
All202810911612950213
Table 6. Summary of genetic diversity of the L. ruthenicum.
Germplasm ResourcesMAFNeHeHANaHoPICI
B0.2751.000–2.000
(1.506)
0.041–0.500
(0.293)
0.042–0.667
(0.312)
26,3021.000–2.000
(1.809)
0.038–0.684
(0.075)
0.040–0.375
(0.233)
0.101–0.693
(0.436)
E0.2351.000–2.000
(1.432)
0.038–0.500
(0.260)
0.038–0.667
(0.275)
26,6221.000–2.000
(1.805)
0.038–0.750
(0.070)
0.037–0.375
(0.211)
0.095–0.693
(0.397)
ED0.2961.000–2.000
(1.332)
0.105–0.500
(0.191)
0.111–0.667
(0.217)
14,1151.000–2.000
(1.499)
0.111–1.000
(0.092)
0.099–0.375
(0.151)
0.215–0.693
(0.281)
ES0.2941.000–2.000
(1.338)
0.095–0.500
(0.194)
0.100–0.667
(0.220)
14,9811.000–2.000
(1.509)
0.100–1.000
(0.088)
0.090–0.375
(0.154)
0.199–0.693
(0.286)
EY0.291.000–2.000
(1.310)
0.087–0.500
(0.178)
0.091–0.667
(0.200)
12,7321.000–2.000
(1.473)
0.091–1.000
(0.078)
0.083–0.375
(0.142)
0.185–0.693
(0.264)
G0.2521.000–2.000
(1.387)
0.036–0.500
(0.229)
0.037–0.667
(0.241)
22,2791.000–2.000
(1.673)
0.037–0.731
(0.069)
0.036–0.375
(0.184)
0.092–0.693
(0.345)
Q0.2561.000–2.000
(1.541)
0.024–0.500
(0.318)
0.024–0.556
(0.327)
30,6401.000–2.000
(1.925)
0.023–0.595
(0.070)
0.024–0.375
(0.255)
0.066–0.693
(0.477)
X0.2551.000–2.000
(1.371)
0.033–0.500
(0.219)
0.033–0.667
(0.232)
21,0401.000–2.000
(1.638)
0.033–0.667
(0.054)
0.032–0.375
(0.176)
0.085–0.693
(0.329)
Mean0.2691.4020.2350.25321,0891.6670.0750.1880.352
Numbers before and in brackets indicate range and mean, respectively. MAF, Minor allele frequency; Ne, Expected number of alleles; He, Expected heterozygosity; H, Nei’s genetic diversity index; A, Number of polymorphic loci; Na, Observed number of alleles; Ho, Observed heterozygosity; PIC, Polymorphism information content; I, Shannon’s Wiener index.
Disclaimer/Publisher’s Note: The statements, opinions and data contained in all publications are solely those of the individual author(s) and contributor(s) and not of MDPI and/or the editor(s). MDPI and/or the editor(s) disclaim responsibility for any injury to people or property resulting from any ideas, methods, instructions or products referred to in the content.