Article

Integrative Omics Analysis Reveals Mechanisms of Anthocyanin Biosynthesis in Djulis Spikes

Key Laboratory of Coarse Cereal Processing, Ministry of Agriculture and Rural Affairs, Sichuan Engineering and Technology Research Center of Coarse Cereal Industrialization, School of Food and Biological Engineering, Chengdu University, Chengdu 610106, China
*
Authors to whom correspondence should be addressed.
These authors contributed equally to this work.
Plants 2025, 14(2), 197; https://doi.org/10.3390/plants14020197
Submission received: 18 December 2024 / Revised: 9 January 2025 / Accepted: 10 January 2025 / Published: 12 January 2025
(This article belongs to the Special Issue Horticultural Plant Physiology and Molecular Biology)

Abstract

:
Djulis (Chenopodium formosanum Koidz.), a member of the Amaranthaceae family plant, is noted for its vibrant appearance and significant ornamental value. However, the mechanisms underlying color variation in its spikes remain unexplored. This research initially detected the anthocyanin content at different developmental stages of the spike and subsequently utilized an integrative approach, combining targeted metabolomics, transcriptomics, and untargeted metabolomics analyses, to elucidate the mechanisms of anthocyanin biosynthesis in the spikes of djulis. The results of the combined multi-omics analysis showed that the metabolites associated with anthocyanin synthesis were mainly enriched in the flavonoid biosynthesis pathway (ko00941) and the anthocyanin biosynthesis pathway (ko00942). With the maturation of djulis spikes, a total of 28 differentially expressed genes and 17 differentially expressed metabolites were screened during the transition of spike color from green (G) to red (R) or orange (O). Twenty differentially expressed genes were selected for qRT-PCR validation, and the results are consistent with transcriptome sequencing. The upregulation of seven genes, including chalcone synthase (CfCHS3_1, CfCHS3_2, CfCHS3_3), flavanone 3-hydroxylase (CfF3H_3), flavonoid 3′5′-hydroxylase (CfCYP75A6_1), dihydroflavonol reductase (CfDFRA), and glucosyltransferase (Cf3GGT), promotes the formation and accumulation of delphinidin 3-sambubioside and peonidin 3-galactoside. The research results also showed that anthocyanins and betalains can coexist in the spike of djulis, and the reason for the change in spike color during development may be the result of the combined action of the two pigments. A possible regulatory pathway for anthocyanin biosynthesis during the spike maturation was constructed based on the analysis results. The results provide a reference and theoretical basis for further studying the molecular mechanism of anthocyanin regulation of color changes in Amaranthaceae plants.

1. Introduction

Djulis (Chenopodium formosanum Koidz.) is a pseudo-cereal crop growing in Taiwan, China, and is predominantly situated in Pingtung and Taitung counties, with an elevation spanning from 230 to 1568 m [1]. It is an annual dicotyledonous herb belonging to the genus Quinoa in the family Amaranthaceae [2,3]. Djulis, with shallow roots and spikes, can grow vertically to a height of two meters or more, with its primary and side branches yielding seeds [4]. Djulis demonstrates robust stress resistance, exhibiting remarkable traits such as tolerance to cold, drought, and salinity [4,5]. As a grain crop, djulis is notable for its high nutritional value and numerous beneficial biological effects. Additionally, its vibrant red spike color enhances its ornamental appeal, earning it the moniker “ruby of grains” [6]. During the developmental phase, the djulis spikes exhibit a green coloration, which transitions to a red or orange hue upon maturation, thereby enhancing their visual appeal.
The seeds of djulis are abundant in a range of nutrients, including dietary fiber, starch, polyphenolic compounds such as gallic acid, flavonoids such as rutin, proteins, essential amino acids, unsaturated fatty acids, minerals, and vitamins [7,8,9]. Owing to this rich functional composition, djulis and its bioactive compounds exhibit various physiological functions, such as hypoglycemic, diabetes prevention [10,11,12], hypertension prevention [13], hypolipidemia [14,15], colon cancer prevention [16], liver protection [17,18], inducing apoptosis of hepatocellular carcinoma cells [19,20], repairing skin damage and anti-aging [7,21,22], and so on. In addition, djulis has traditionally been used as an insect repellent [23]. A study by Chio et al. [24] evaluated the toxicity and repellence of djulis against mosquitoes and biting midges using methanol or dichloromethane, both containing 9, 12-octadecadienoyl chloride (Z, Z) in the compounds extracted from djulis. The study by Chuang et al. [25], on the other hand, demonstrated that the effective insecticidal effect of the ethanol extract of djulis was attributed to 1,2-benzenediol, 5-HMF (5-hydroxymethylfurfural), and 2-heptanone. Owing to its remarkable resistance, beneficial biological properties, and substantial nutritional content, djulis holds significant potential for applications and market value. Consequently, it has emerged as a prominent subject of research within the scientific community.
Anthocyanins are natural water-soluble pigments prevalent in the leaves, fruits, and flowers of plants and are responsible for these vivid colors. Currently, the biosynthetic pathway of anthocyanins has been extensively studied (Figure 1). Anthocyanin biosynthesis originates from the phenylpropanoid pathway, specifically during the phenylalanine metabolism stage. This process primarily involves the production of anthocyanins through the activities of phenylalanine ammonia-lyase (PAL), cinnamate-4-hydroxylase (C4H), and 4-coumarate-CoA ligase (4CL), which ultimately lead to the formation of coumaroyl CoA [26]. Subsequently, chalcone synthase (CHS), chalcone isomerase (CHI), and flavanone 3-hydroxylase (F3H) catalyze reactions that result in the production of dihydrokaempferol, a crucial dihydroflavonol compound [27,28]. Flavonoid 3′-hydroxylase (F3′H) and flavonoid 3′,5′-hydroxylase (F3′5′H), both members of the cytochrome P450 superfamily, catalyze the production of dihydroquercetin and dihydromyricetin, respectively, utilizing dihydromyricetin as a substrate [29,30]. Subsequently, dihydroflavonol 4-reductase (DFR) facilitates the conversion of dihydrocannabinol, dihydroquercetin, and dihydromyricetin into the colorless compounds pelargonidin, cyanidin, and delphinidin, respectively [31]. Anthocyanidin synthase (ANS), also known as leucoanthocyanidin dioxygenase (LDOX), represents a crucial gene involved in the latter stages of anthocyanin biosynthesis, facilitating the conversion of colorless anthocyanidins into anthocyanins [32]. Subsequently, the carbon skeleton of anthocyanins undergoes modifications through methylation, glycosylation, and acylation, resulting in the formation of stable anthocyanins. These modifications are mediated by enzymes such as flavonoid-glucosyl transferase (UDP-glucose flavonoid 3-O-glucosyl transferase, UFGT), methyltransferase (MT), glucosyltransferase (GT), and acyltransferase (AT), among others [33,34]. In nature, anthocyanins are primarily categorized into six major classes: delphinidins, cyanidins, pelargonidins, peonidins, petunidins, and malvidins [35]. Among them, petunidins and malvidins can be derived from the methylation of delphinidin, and peonidins are generated from the methylation of cyanidins [34].
Numerous studies have been conducted on anthocyanins and the key structural genes across various species. Shi et al. [36], in their investigation of color formation in the fruit skin of Chinese jujube (Ziziphus jujuba Mill.), identified that cyanidin-3-O-rutinoside and peonidin-3,5-O-diglucoside are the predominant anthocyanins, with ZjANS and ZjUGT79B1 being crucial genes involved in anthocyanin biosynthesis. Similarly, Zhong et al. [37] examined the coloration of the bark of the camphor tree (Cinnamomum camphora) and determined that cyanidin, pelargonidin, and peonidin were the primary anthocyanin components. The transcript abundance of PAL, 4CL, CHS, F3H, F3′H, UGT, and OMT was significantly higher in the red bark compared to the green bark. Zhang et al. [38] concluded that pelargonidin 3-O-glucoside and pelargonidin 3-O-(6-O-malonyl-β)-D-glucoside were the primary compounds responsible for the reddish coloration of the petal margins in Carnation (Dianthus caryophyllus), with DFR and ANS exhibiting significantly increased expression during the discoloration process. Wang et al. [39] identified that the dark red blotches on the yellow petals of Rosa persica result from the accumulation of cyanidin, pelargonidin, and peonidin, with 4CL, DFR, ANS, and UFGT being the key structural genes for anthocyanin synthesis. Similarly, Chen et al. [40] reported the accumulation of petunidin-3-O-diglucoside-5-O-glucoside in Sichuan Fritillaria (F. unibracteata). leaves significantly increased the expression of F3′5′H (Unigene_030074 and Unigene_034772). Anthocyanins, a significant class of flavonoid secondary metabolites synthesized by plants, exhibit a wide range of biological effects [41,42,43]. Extensive research has demonstrated that anthocyanins possess free radical scavenging and antioxidant properties [44], as well as anti-inflammatory [45] and antibacterial activities [46]. Furthermore, anthocyanins have been shown to alleviate visual fatigue [47], provide renal protection [48], and protect the cardiovascular and cerebrovascular systems [49]. Additionally, they exhibit anticancer properties [50]. These attributes underscore their substantial applicability and have consistently been a focal point of scientific research.
At present, the mechanisms underlying anthocyanin biosynthesis in djulis remain inadequately understood. Previous studies have shown that anthocyanins and betalains in amaranth plants cannot coexist [51]. Genomic data for djulis was made available in 2022 [52]. Consequently, we employed an integrative approach combining metabolomics and transcriptomics analyses to investigate the potential pathways involved in anthocyanin formation in djulis spikes. Our findings indicate that two anthocyanins, delphinidin 3-sambubioside and peonidin 3-galactoside, accumulate in the spikes of djulis during the color transition from green to red or orange. Seven structural genes, CfCHS3_1, CfCHS3_2, CfCHS3_3, CfFLS_3, CfCYP75A6_1, CfDFRA, and Cf3GGT, have been identified as potential key regulators in the biosynthesis of two specific anthocyanins. The results of this study contribute to a deeper understanding of the molecular mechanisms underlying anthocyanin accumulation during the discoloration process of djulis spikes. Finally, our study can also serve as a typical case for further exploring whether anthocyanins and betalains coexist.

2. Results

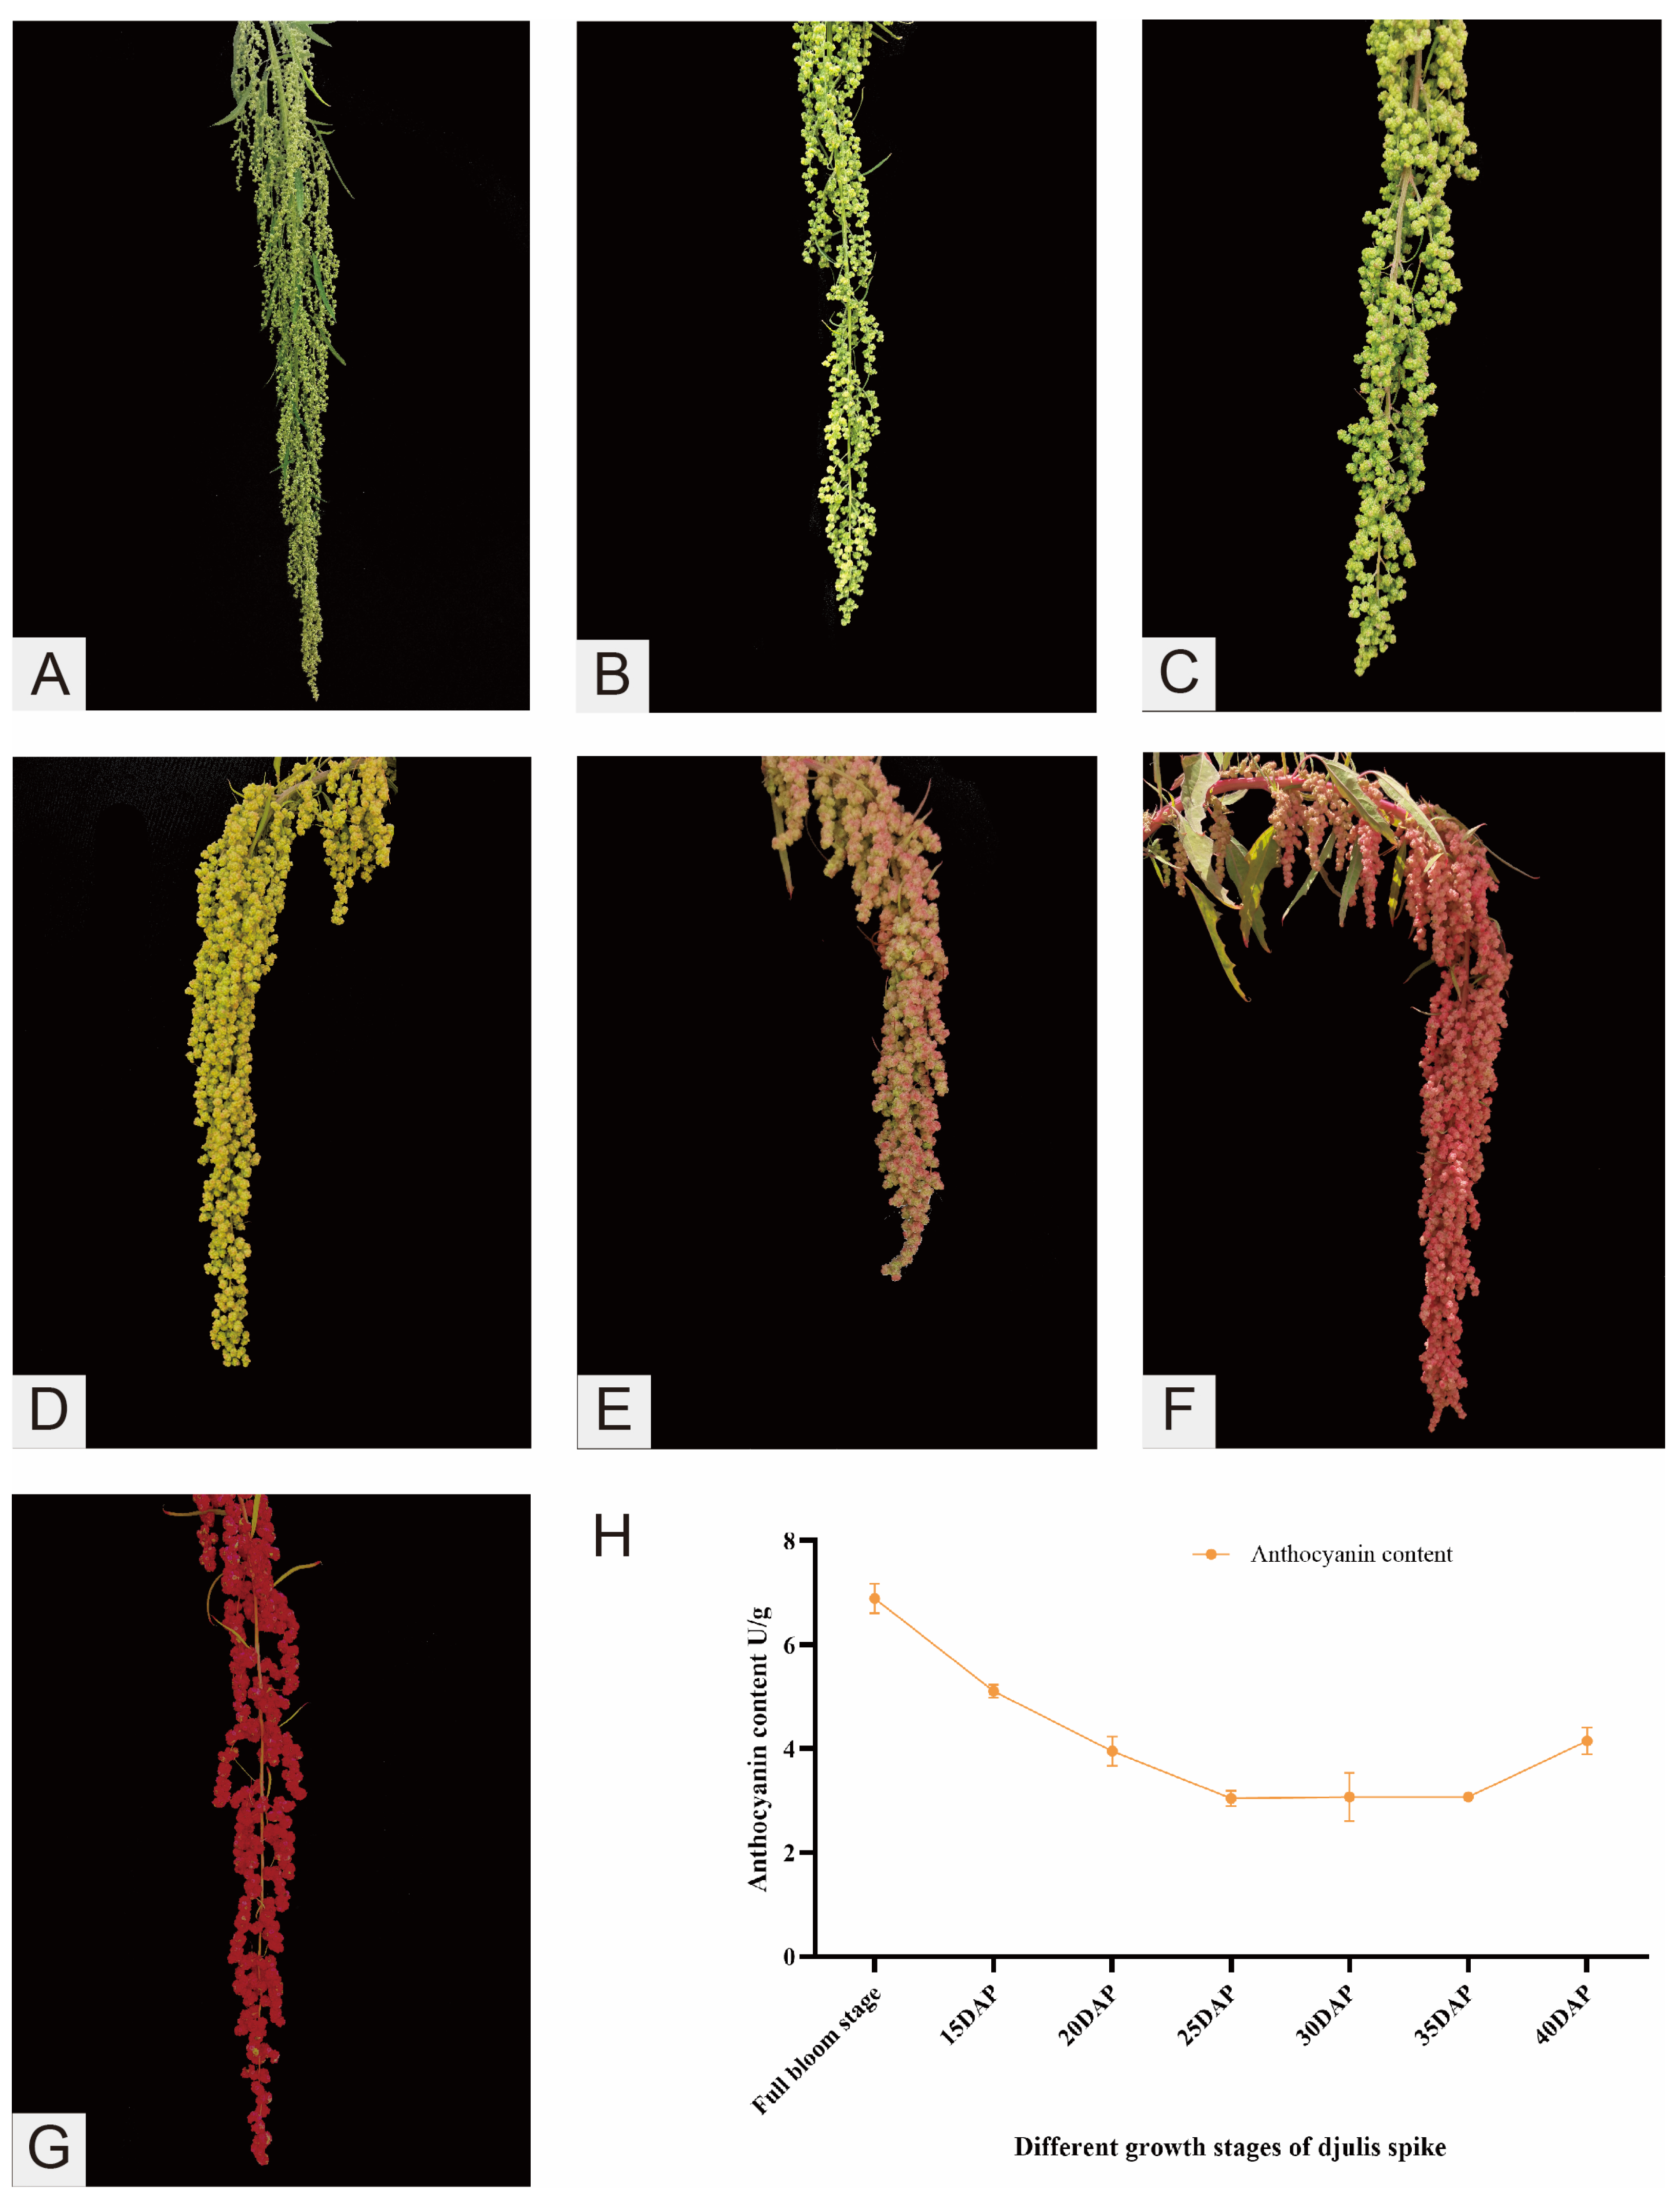
2.1. Changes in Anthocyanin Content During Spike Development

The seven stages of spike development in djulis are illustrated in Figure 2A–G. The findings, as depicted in Figure 2H, indicated that anthocyanin content varies throughout spike development. The highest concentration of anthocyanins was observed at the full bloom stage. As the filling stage commenced, there was a gradual decline in anthocyanin content. Subsequently, as the spikes mature and turn red, the anthocyanin content gradually increases again.
To further determine the presence of anthocyanins in djulis, the experiment selected green (G), red (R), and orange (O) djulis spike tissues as samples, and performed three biological replicates at each color stage. The targeted metabolome results indicate that 51 distinct species and 6 primary classes of anthocyanins were identified. As illustrated in Figure 3A, the study identified several anthocyanin pigments, including cyanidin, delphinidin, malvidin, pelargonidin, petunidin, and peonidin. These pigments constituted 42.31%, 30.77%, 1.92%, 1.92%, 1.92%, and 1.54% of the total metabolites, respectively. The thresholds applied for screening differential anthocyanins were a p-value of <0.05 and a Variable Importance in Projection (VIP) score of >1. In the comparative analyses of O vs. G and R vs. G, 11 and 10 differential anthocyanins were identified, respectively (Figure 3B). There is no difference in anthocyanin in the R vs. O. Among these, two anthocyanins were up-regulated in the O vs. G comparison, while one was up-regulated in the R vs. G comparison. In both comparisons, nine anthocyanins were down-regulated, as illustrated in Figure 3C,D. Specifically, delphinidin 3-sambubioside and peonidin 3-galactoside exhibited up-regulated expression in the O vs. G comparison, whereas delphinidin 3-sambubioside was the sole anthocyanin up-regulated in the R vs. G comparison.
Through anthocyanin content detection and targeted anthocyanin metabolomics analysis, we can find that there are changes in anthocyanins during the transition from green to red or orange in the spikes of djulis. Specifically, during the flowering period and the subsequent green period to the red or orange period after maturity, the content of most anthocyanins decreases, while only a small amount of anthocyanin content increases with color changes.

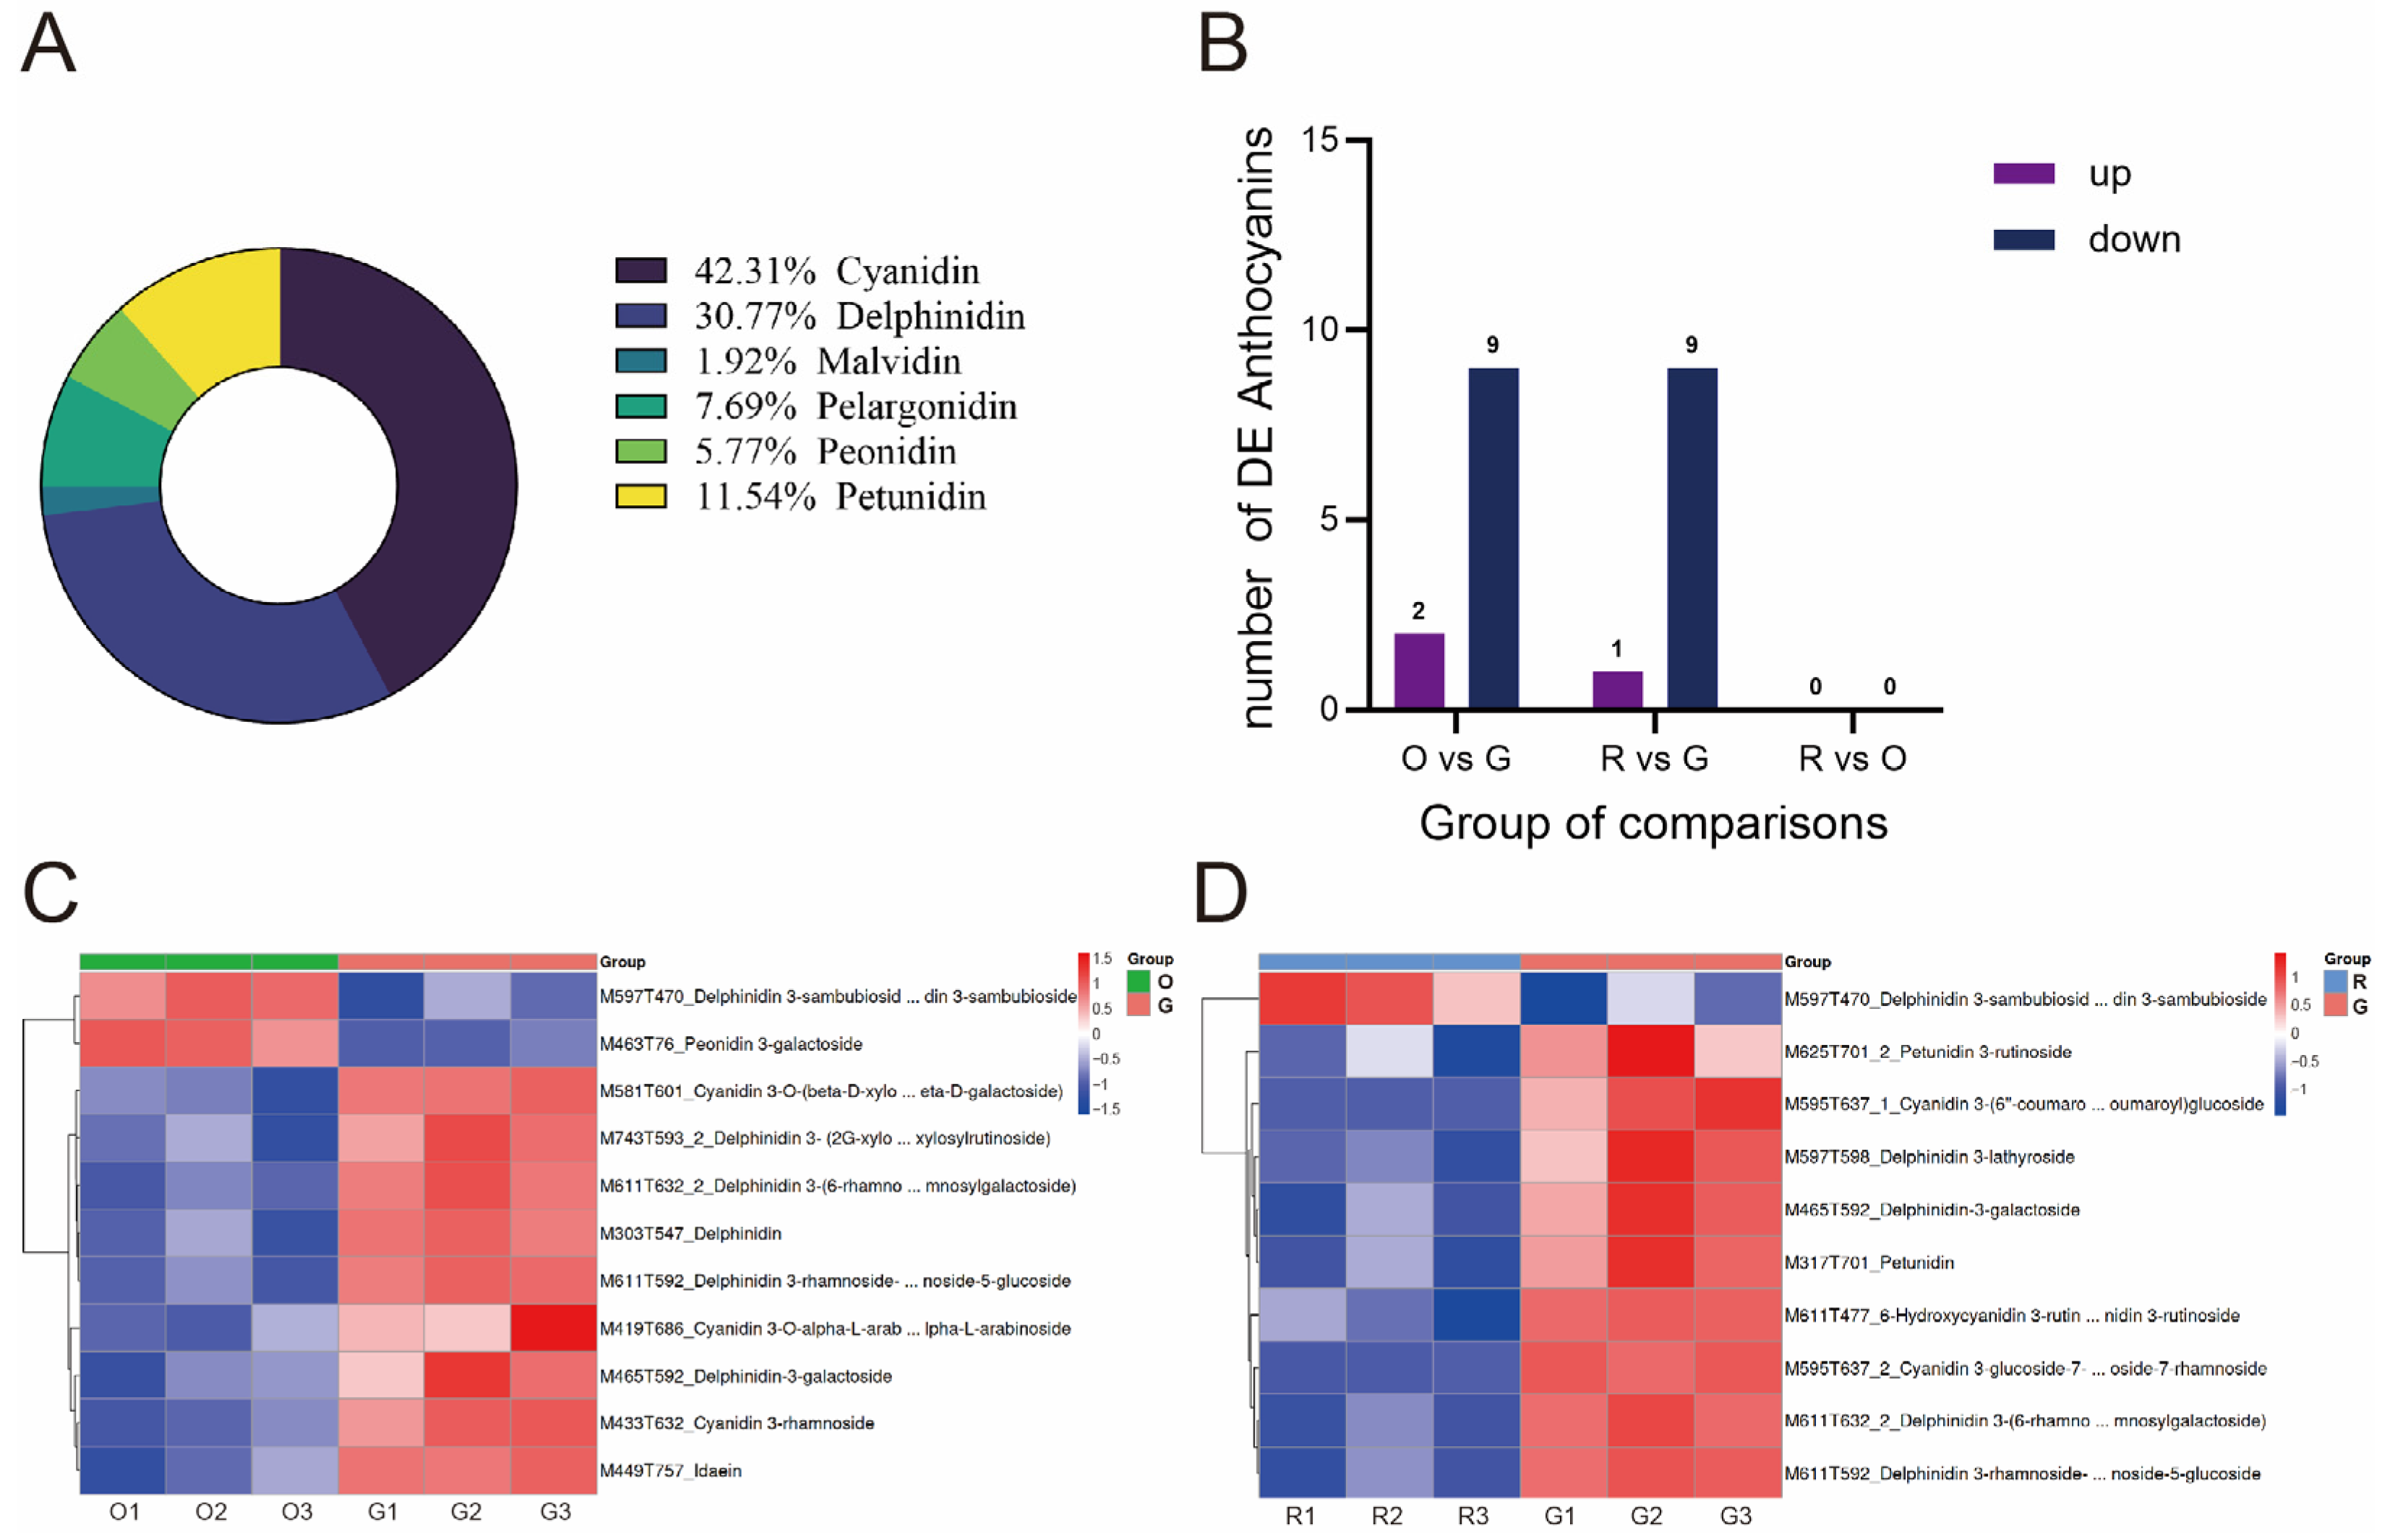
2.2. Non-Targeted Metabolomics

In the detection of non-targeted metabolomics, six biological replicates were selected from green (G), red (R), and orange (O) djulis spike tissues as samples. Following batch normalization of the peak area data in the metabolomics analysis, a total of 20,036 precursor molecules were identified in the positive ion mode, while 12,430 precursor molecules were identified in the negative ion mode. Perform principal component analysis (PCA) on the data, and observe the clustering of samples within the group and the dispersion of samples between groups from the PCA score graph, indicating good data repeatability and reliability (Figure 4A,B). Perform orthogonal projections to latent structures discriminant analysis (OPLS-DA) on the data, using p-value ≤ 0.05 and VIP ≥ 1 as screening thresholds to screen for differential metabolites. In positive ion mode, a total of 8967, 8801, and 8416 metabolites were identified in the comparison groups O vs. G, R vs. G, and R vs. O, respectively (Figure 4C). Among these, 4383, 4519, and 4752 metabolites were up-regulated, while 4584, 4282, and 3664 metabolites were down-regulated. In negative ion mode, 5524, 5556, and 4727 metabolites were detected in the comparisons of O vs. G, R vs. G, and R vs. O, respectively (Figure 4D). Among these, 3052, 3440, and 2695 metabolites were up-regulated, while 2472, 2116, and 1577 metabolites were down-regulated, as illustrated.
The fragmentation data acquired from the MS/MS model were subsequently cross-referenced with annotations in databases such as Metlin (http://metlin.scripps.edu (accessed on 9 January 2025)) and MoNA (https://mona.fiehnlab.ucdavis.edu (accessed on 9 January 2025)) to achieve precise metabolite identification. Following the identification of all measured molecular weights, the detected metabolites were then functionally categorized according to the classification of metabolites in KEGG and Metabolon, Inc. The enrichment analysis of 518 differential metabolites across metabolic pathways revealed that 62, 63, and 57 pathways were significantly enriched in the O vs. G, R vs. G, and R vs. O comparison groups, respectively. Notably, a diverse array of anthocyanin species was enriched within the anthocyanin biosynthesis pathway, which is associated with color variation. In the comparison between O and G, the expression levels of two anthocyanins, peonidin-3-glucoside and delphinidin-3-(p-coumaroyl)-rutinoside-5-glucoside, were found to be up-regulated. Conversely, the expression of three anthocyanins—cyanidin 3-O-beta-D-glucoside 5-O-(6-coumaroyl-beta-D-glucoside), cyanidin 3-O-rutinoside 5-O-beta-D-glucoside, and cyanidin-3-(p-coumaroyl)-rutinoside-5-glucoside—was down-regulated. In the comparison between R and G, the expression levels of five anthocyanins—namely, delphinidin 3-O-beta-D-glucoside 5-O-(6-coumaroyl-beta-D-glucoside), delphinidin 3,7-di-O-beta-D-glucoside, peonidin-3-glucoside, cyanidin 5-O-beta-D-glucoside 3-O-beta-D-sambubioside, and delphinidin-3-(p-coumaroyl)-rutinoside-5- glucoside—were upregulated. Conversely, the expression levels of two anthocyanins, cyanidin 3-O-beta-D-glucoside 5-O-(6-coumaroyl-beta-D-glucoside) and cyanidin 3-O-rutinoside 5-O-beta-D-glucoside, were downregulated. In the comparison of R versus O, there were three anthocyanins—delphinidin 3-O-beta-D-glucoside 5-O-(6-coumaroyl-beta-D-glucoside), delphinidin 3,7-di-O-beta-D-glucoside, and cyanidin-3-(p-coumaroyl)-rutinoside-5-glucoside—that were up-regulated, whereas two anthocyanins, peonidin-3-glucoside and cyanidin 3-rutinoside, were down-regulated. Additionally, the peonidin-3-glucoside and delphinidin-3-(p-coumaroyl)-rutinoside-5-glucoside were up-regulated in both comparative analyses of O versus G and R versus G. The results indicate a variation in anthocyanin-like metabolites associated with the color transition of djulis spikes from green to red or orange.

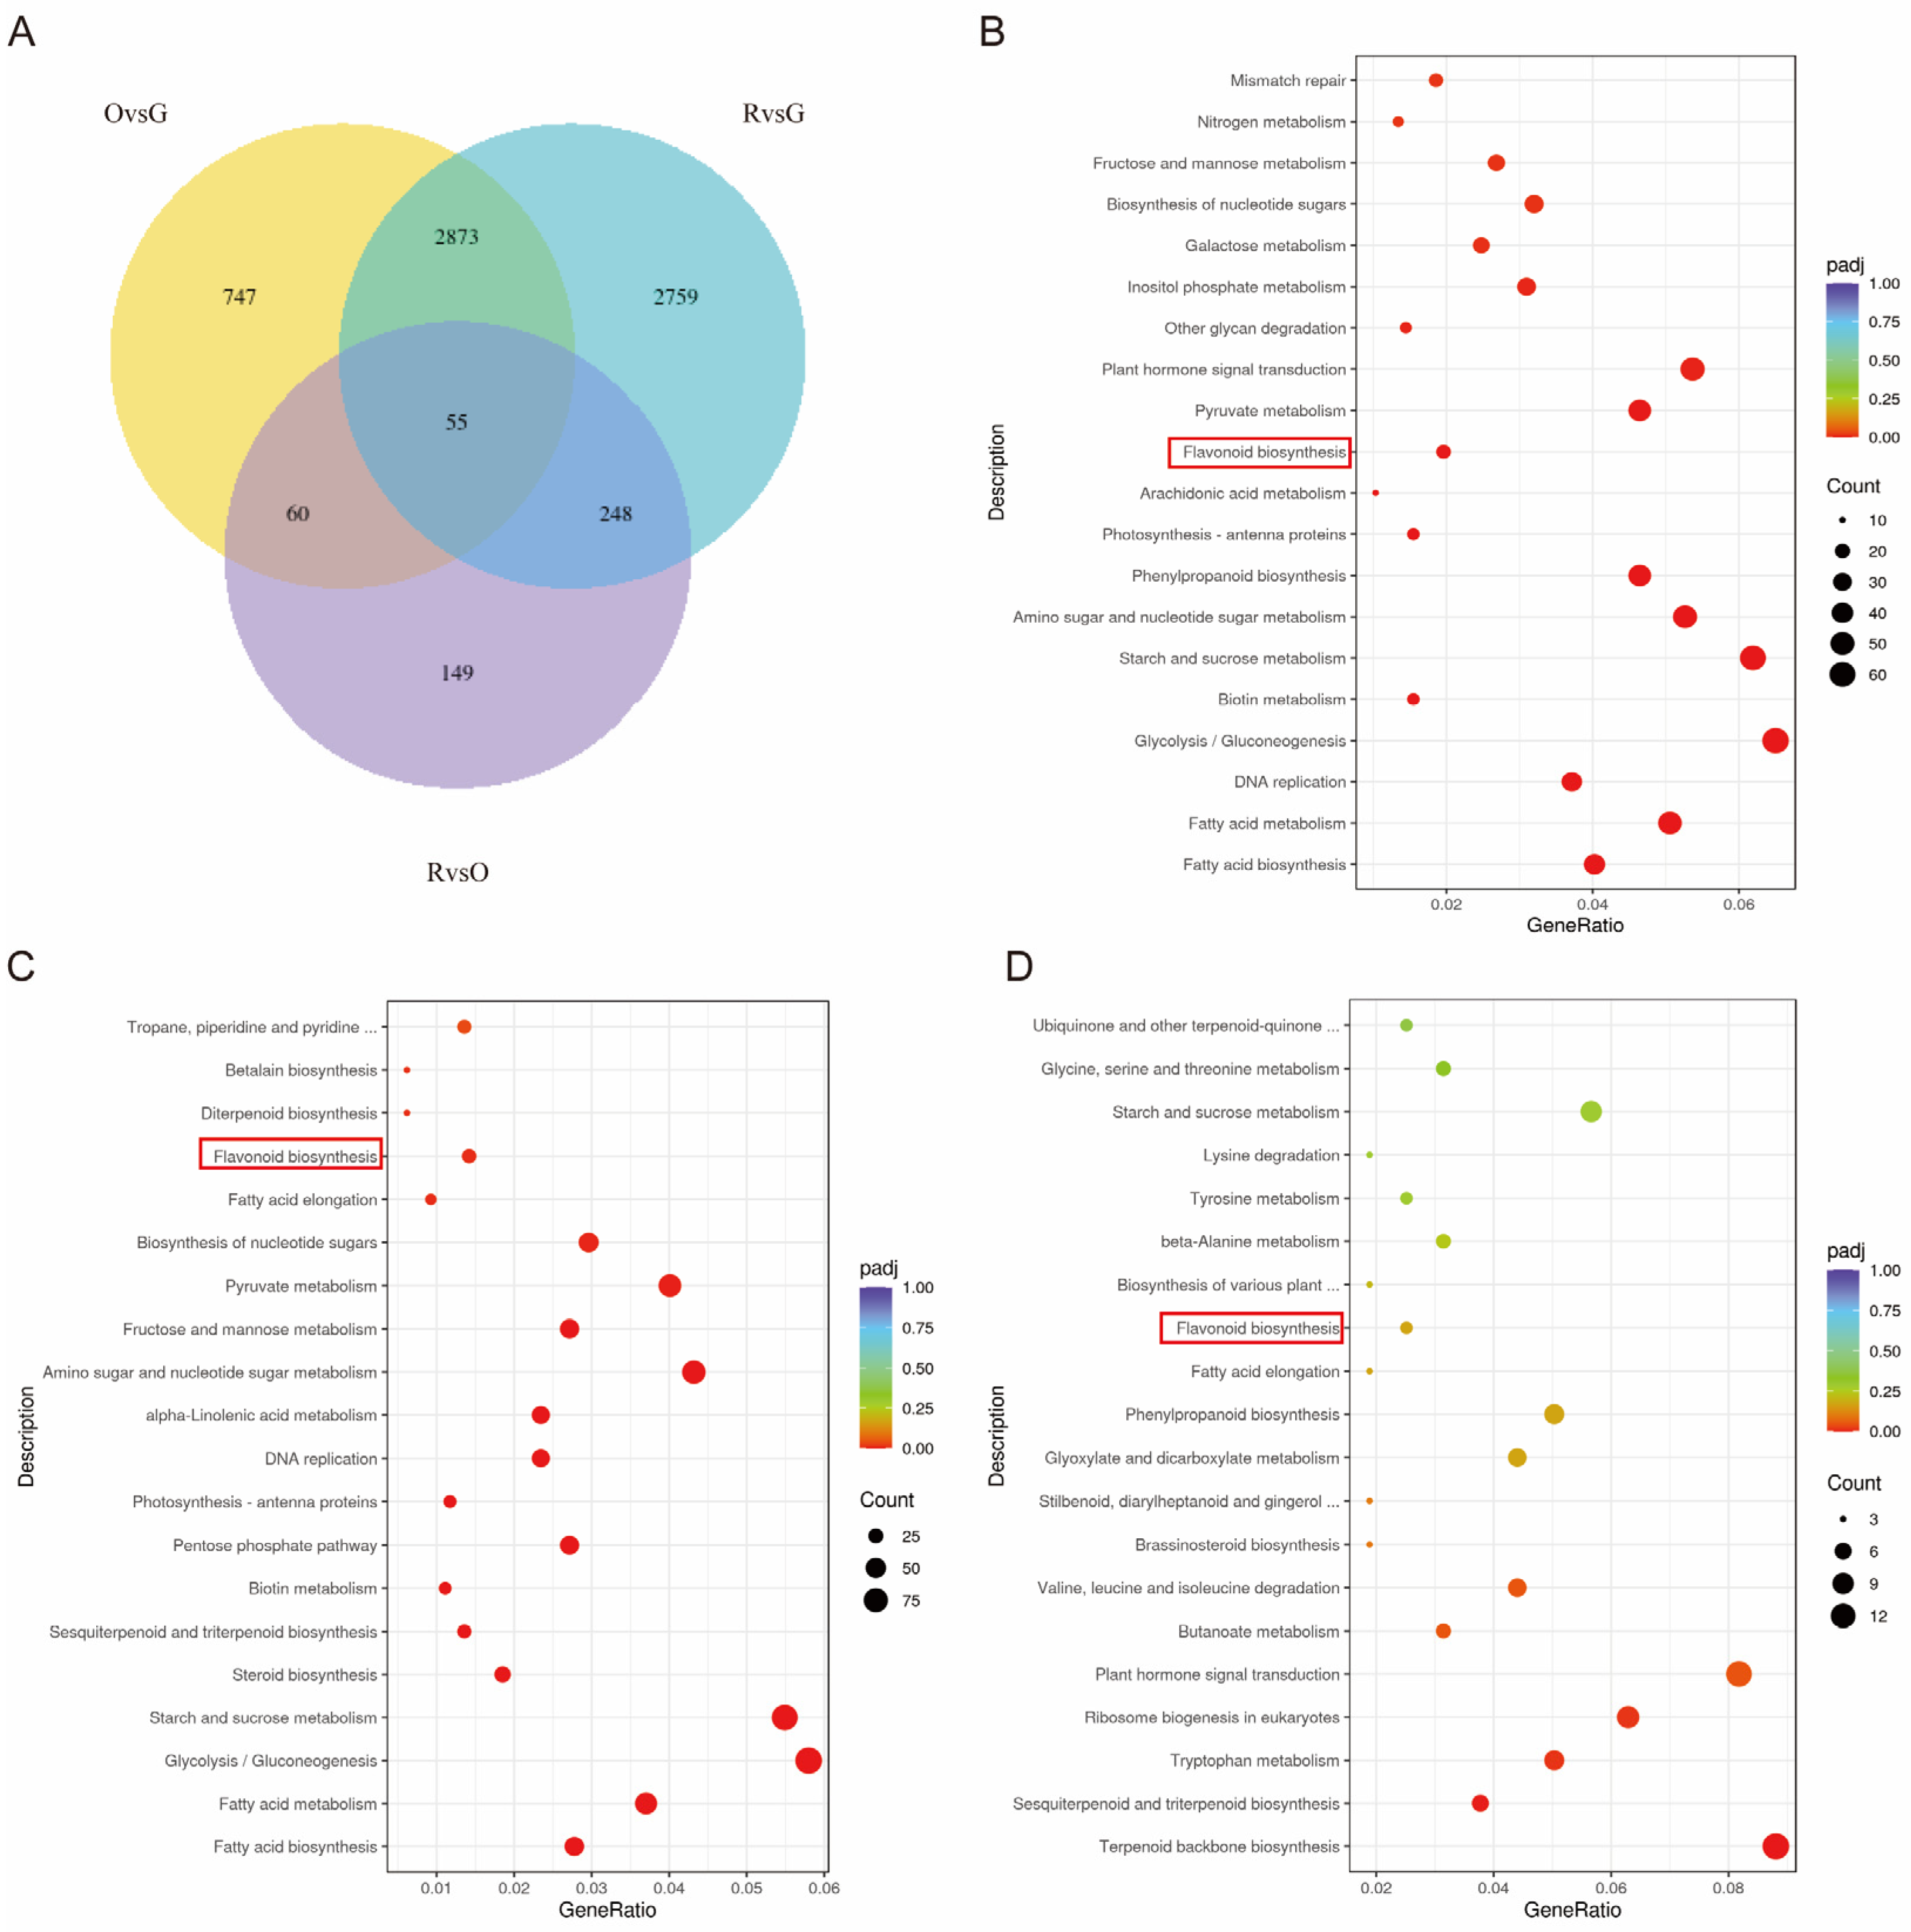
2.3. Transcriptomics, GO, and KEGG Enrichment Analysis

In transcriptome analysis, three biological replicates were selected from green (G), red (R), and orange (O) djulis spike tissues as samples. After eliminating junctions and low-quality bases, a total of 59.61 GB of data was acquired post-quality control. The proportion of Q20 bases exceeded 97.03%, while Q30 bases constituted more than 91.95% of the total bases. Additionally, the measured GC content was greater than 44.04%. The criteria for identifying differentially expressed genes were set at |log2(FC)| ≥ 1 and a padj ≤ 0.05. In the comparative analysis of the three group combinations—O vs. G, R vs. G, and R vs. O—the numbers of differentially expressed genes were 3735, 5935, and 512, respectively. Among these, the up-regulated genes numbered 1362, 2227, and 172, while the down-regulated genes numbered 2373, 3708, and 340, respectively. Differential gene expression plots (Figure 5A) revealed the presence of unique genes for each of the three comparative groups: O vs. G, R vs. G, and R vs. O, with counts of 747, 2759, and 149, respectively.
The identified differentially expressed genes underwent Gene Ontology (GO) functional enrichment analysis utilizing the ClusterProfiler software (version 4.14.4). The analysis categorized these genes into the components of biological process (BP), cellular component (CC), and molecular function (MF), employing an adjusted p-value (padj) threshold of less than 0.05 to determine significant enrichment. The total numbers of differentially expressed genes enriched by GO analysis in the comparisons of O vs. G, R vs. G, and R vs. O were 3632, 5613, and 465, respectively. The enriched differential genes comprised 500, 588, and 289 genes identified through Biological Process (BP); 87, 123, and 16 genes identified through Cellular Component (CC); and 336, 397, and 176 genes identified through Molecular Function (MF). In the comparative analyses of O vs. G and R vs. G, within the Biological Process (BP) category, the three Gene Ontology (GO) terms exhibiting the highest enrichment of differential genes were movement of cell or subcellular component (GO:0006928), microtubule-based movement (GO:0007018), and microtubule-based process (GO:0007017). In the Cellular Component (CC) category, the three GO terms with the greatest abundance in differential gene enrichment were extracellular region (GO:0005576), cell wall (GO:0005618), and external encapsulating structure (GO:0030312). The three most GO terms associated with differential gene enrichment in the Molecular Function (MF) category are microtubule binding (GO:0008017), microtubule motor activity (GO:0003777), and tubulin binding (GO:0015631). In the comparison between R and O, the GO terms most significantly enriched for differential genes within the Biological Process (BP) category are the isoprenoid metabolic process (GO:0006720), isoprenoid biosynthetic process (GO:0008299), and cellular lipid metabolic process (GO:0044255); GO terms associated with the Cellular Component (CC) category are as follows: preribosome (GO:0030684), nucleolus (GO:0005730), and the eukaryotic translation initiation factor 3 complex (GO:0005852). Within the Molecular Function (MF) category, the GO terms include oxidoreductase activity, acting on paired donors with incorporation or reduction in molecular oxygen (GO:0016705), O-methyltransferase activity (GO:0008171), and iron ion binding (GO:0005506). By comparing the KEGG database, differentially expressed genes were enriched into various metabolic pathways. As shown in Figure 5B–D, flavonoid biosynthesis (ko00941) was enriched in all three comparison combinations.

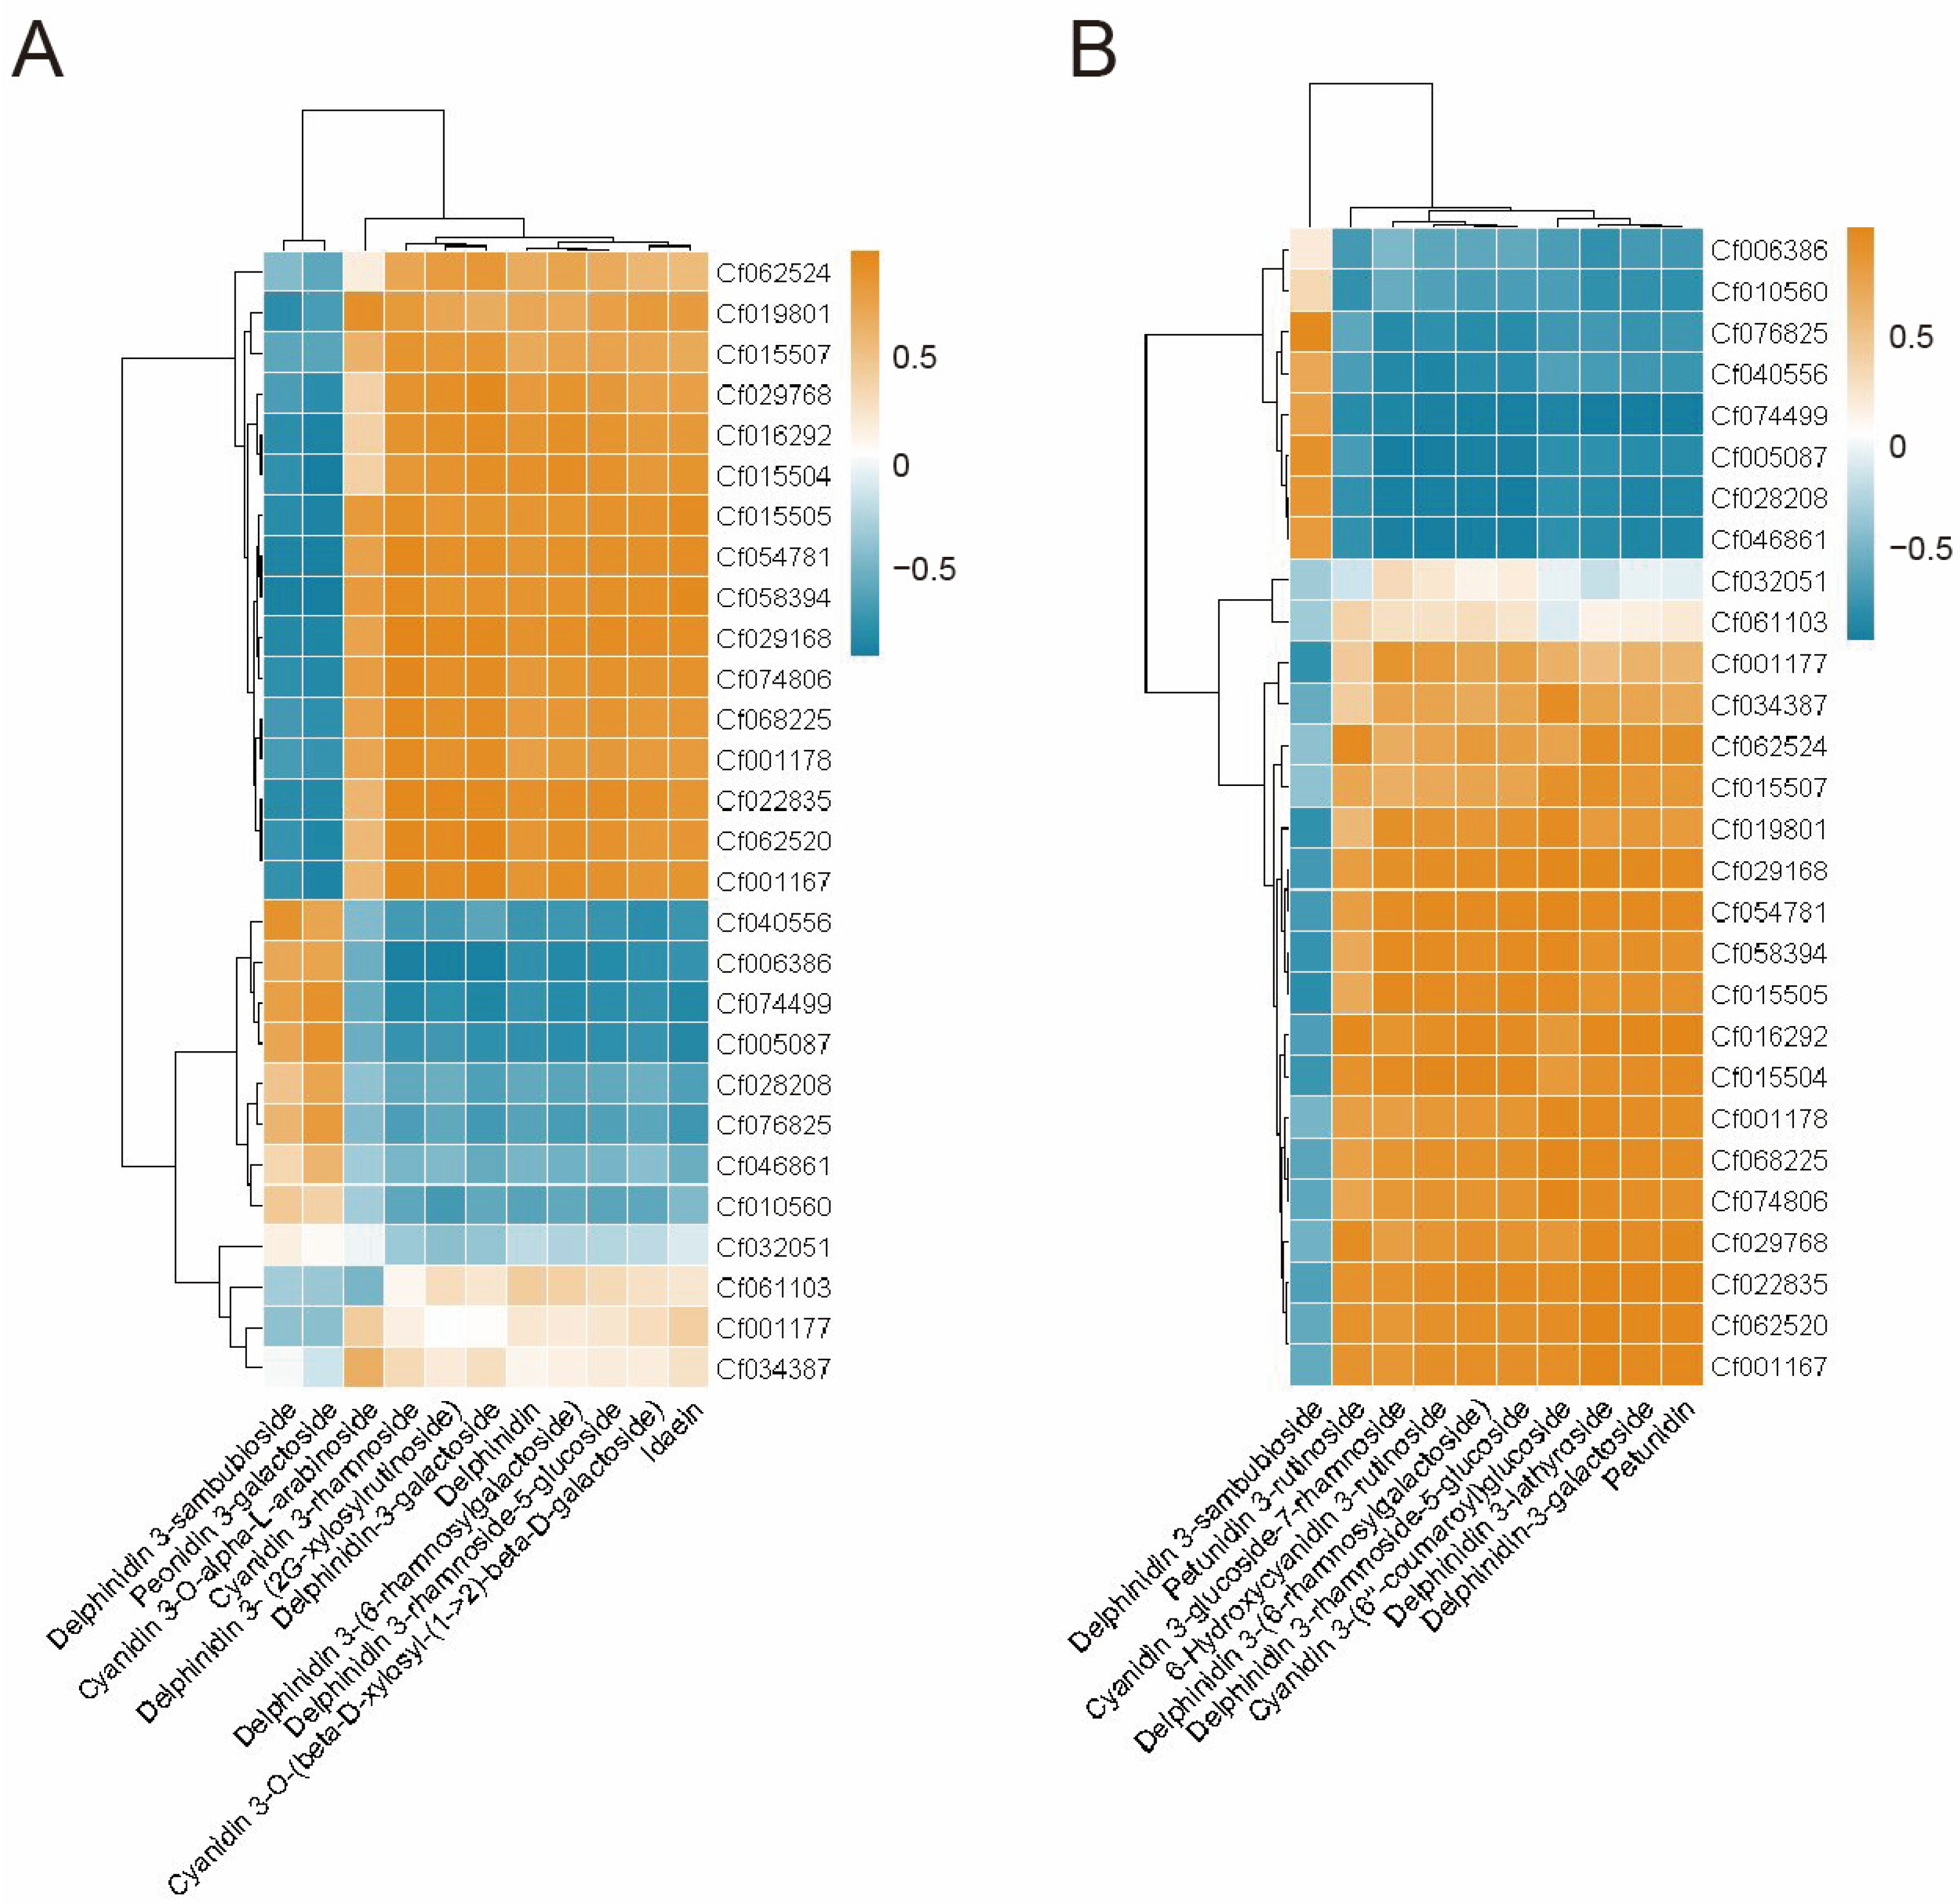
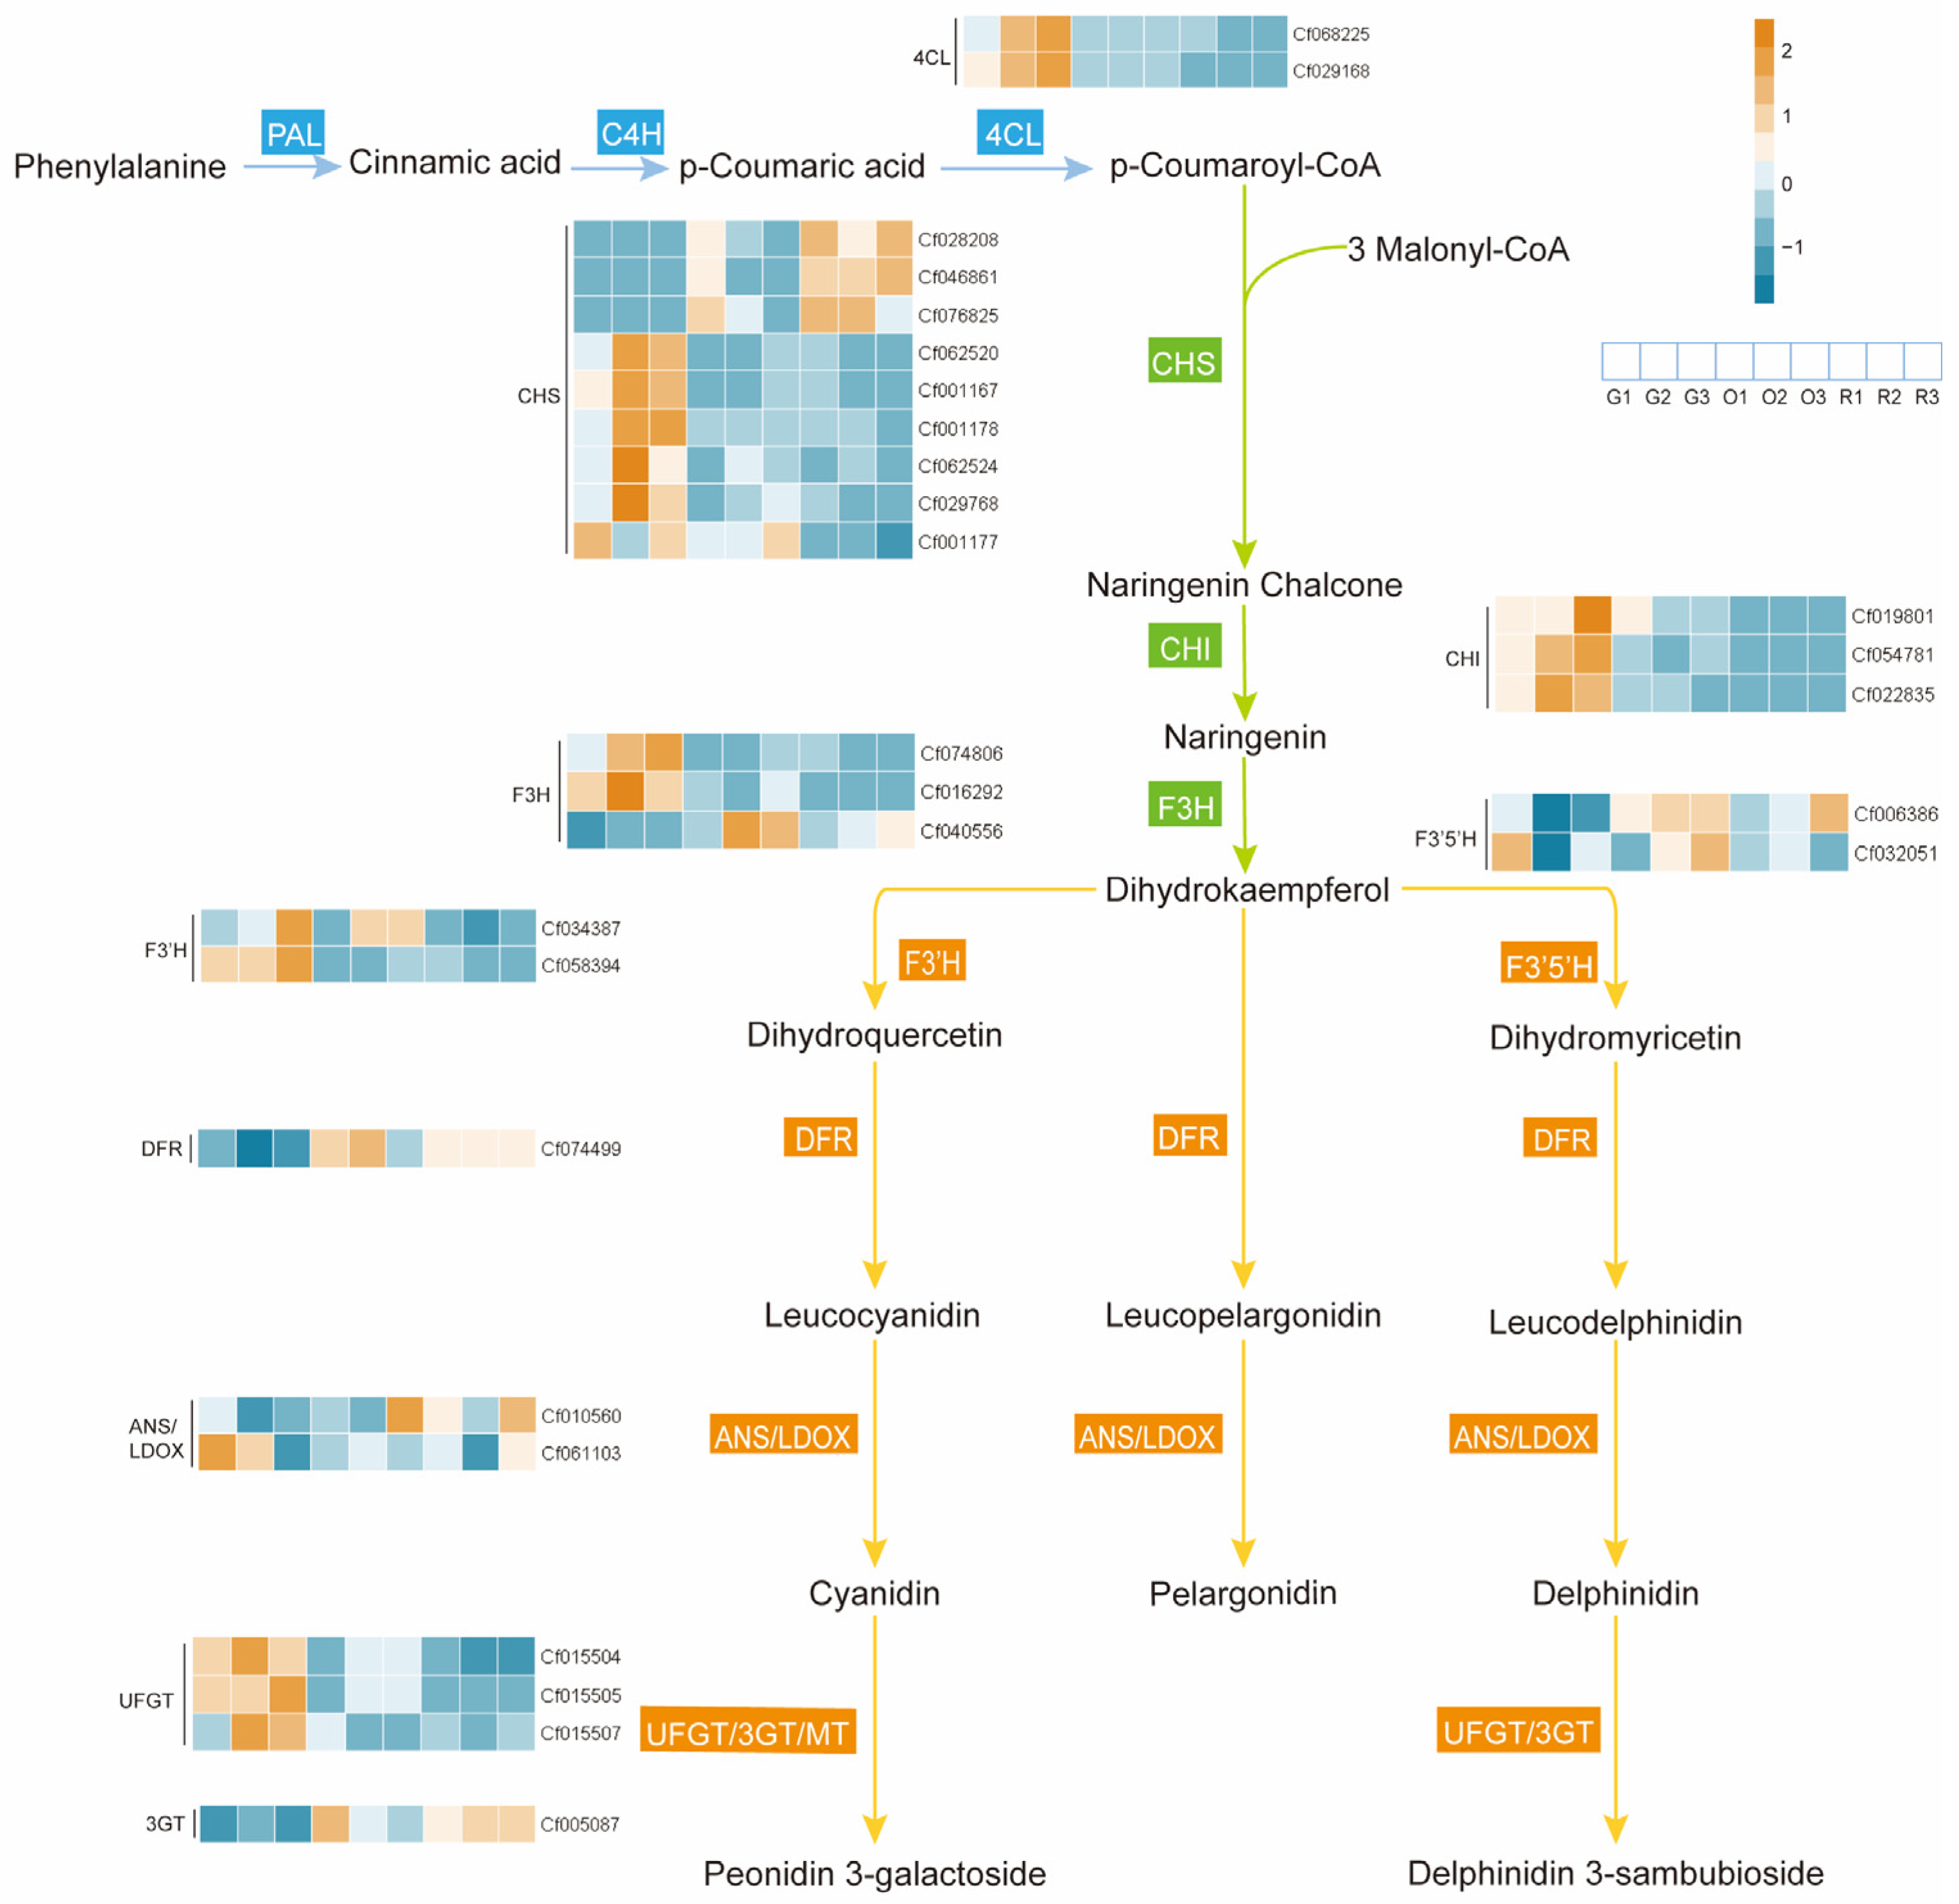
2.4. Combined Analysis of Integrated Transcriptomics and Metabolomics

The correlation between genes and metabolites was plotted in a clustered heat map (Table 1). As shown in Figure 6, the comparative analysis of O vs. G revealed that Delphinidin 3-sambubioside exhibited a positive correlation with a total of ten genes; specifically, delphinidin 3-sambubioside was associated with CfCHS3_1, CfCHS3_2, CfCHS3_3, CfF3H_3, CfCYP75B2_1, CfCYP75A6_1, CfCYP75A6_2, CfDFRA, CfANS, and Cf3GGT. A more significant positive correlation was observed with five specific genes: CfCHS3_3, CfF3H_3, CfCYP75A6_1, CfDFRA, and Cf3GGT. Peonidin 3-galactoside exhibited a positive correlation with the genes CfCHS3_1, CfCHS3_2, CfCHS3_3, CfF3H_3, CfCYP75A6_1, CfCYP75A6_2, CfDFRA, CfANS, and Cf3GGT. Among these, a more substantial positive correlation was noted with six genes: CfCHS3_1, CfCHS3_3, CfF3H_3, CfCYP75A6_1, CfDFRA, and Cf3GGT. Both differential metabolites were significantly negatively correlated with the 4CL and CHI gene categories. In the R vs. G comparison, delphinidin 3-sambubioside showed a positive correlation with eight genes: CfCHS3_1, CfCHS3_2, CfCHS3_3, CfF3H_3, CfCYP75A6_1, CfDFRA, CfANS, and Cf3GGT. It also positively correlated with six genes: CfCHS3_1, CfCHS3_2, CfCHS3_3, CfF3H_3, CfDFRA, and Cf3GGT, while maintaining a significant negative correlation with 4CL and CHI genes. The biological pathway of anthocyanin synthesis was further elucidated by integrating the metabolic pathway map with a heat map (Figure 6). Analysis of these results indicated that CfCHS3_1, CfCHS3_2, CfCHS3_3, CfF3H_3, CfCYP75A6_1, CfDFRA, and Cf3GGT predominantly contribute to the anthocyanins delphinidin 3-sambubioside and peonidin 3-galactoside.

2.5. qRT-PCR Validation Results

To evaluate the gene expression analysis, 20 enriched genes were selected for validation using qRT-PCR. As shown in Figure 7, these genes include six CHSs (Cf046861, Cf076825, Cf062520, Cf001167, Cf001178, Cf062524), two CHIs (Cf054781, Cf022835), two F3Hs (Cf016292, Cf040556), two CYP75B2s (Cf034387, Cf058394), two CfCYP75A6s (Cf006386, Cf032051), one DFRA (Cf074499), one ANS (Cf010560), one LDOX (Cf061103), two UFGTs (Cf015504, Cf015507), and one 3GGT (Cf005087). The qRT-PCR analysis demonstrated that the expression levels of CHS, CHI, F3H, CYP75B2, and UFGT genes agreed with the transcriptomic data across the four developmental stages from green to red. Notably, the genes CfCHS3_2, CfCHS3_3, CfF3H_3, CfCYP75A6_1, and Cf3GGT exhibited a continuous up-regulation trend. Conversely, the expression of CfCHS_1, CfCHS_2, CfCHS_3, CfCHS_4, CfCHI2_1, CfCHI2_2, CfF3H_2, CfCYP75B2_1, CfCYP75B2_2, and CfUFGT_3 was progressively downregulated, corroborating the transcriptomic analysis findings. CfDFRA exhibited a pattern of rising and then falling, ultimately showing a downward trend that did not align with the upregulation observed in the transcriptomics data. CfANS displayed a pattern of rising, then falling, and rising again, with an overall upward trend in expression, aligning with the transcriptomics analysis. CfCYP75A6_2 and CfLDOX showed a pattern of rising, then falling, and rising again, with an overall downward trend, which was generally consistent with the transcriptomics results. The expression pattern of CfUFGT_1 exhibited an initial increase followed by a decrease, ultimately demonstrating an overall declining trend. This pattern was largely consistent with the findings from the transcriptomics analysis.
In conclusion, the qRT-PCR results for 15 out of the 20 selected genes aligned with the transcriptomics analysis, successfully fulfilling the experimental objectives. In the qRT-PCR experiments, a gradual transition from green to red was incorporated, along with a refinement of the red phase at various maturation stages, revealing a dynamic gene expression process. The findings were largely consistent with the transcriptome results, except for CfDFRA, which deviated from the transcriptomic data.

3. Discussion

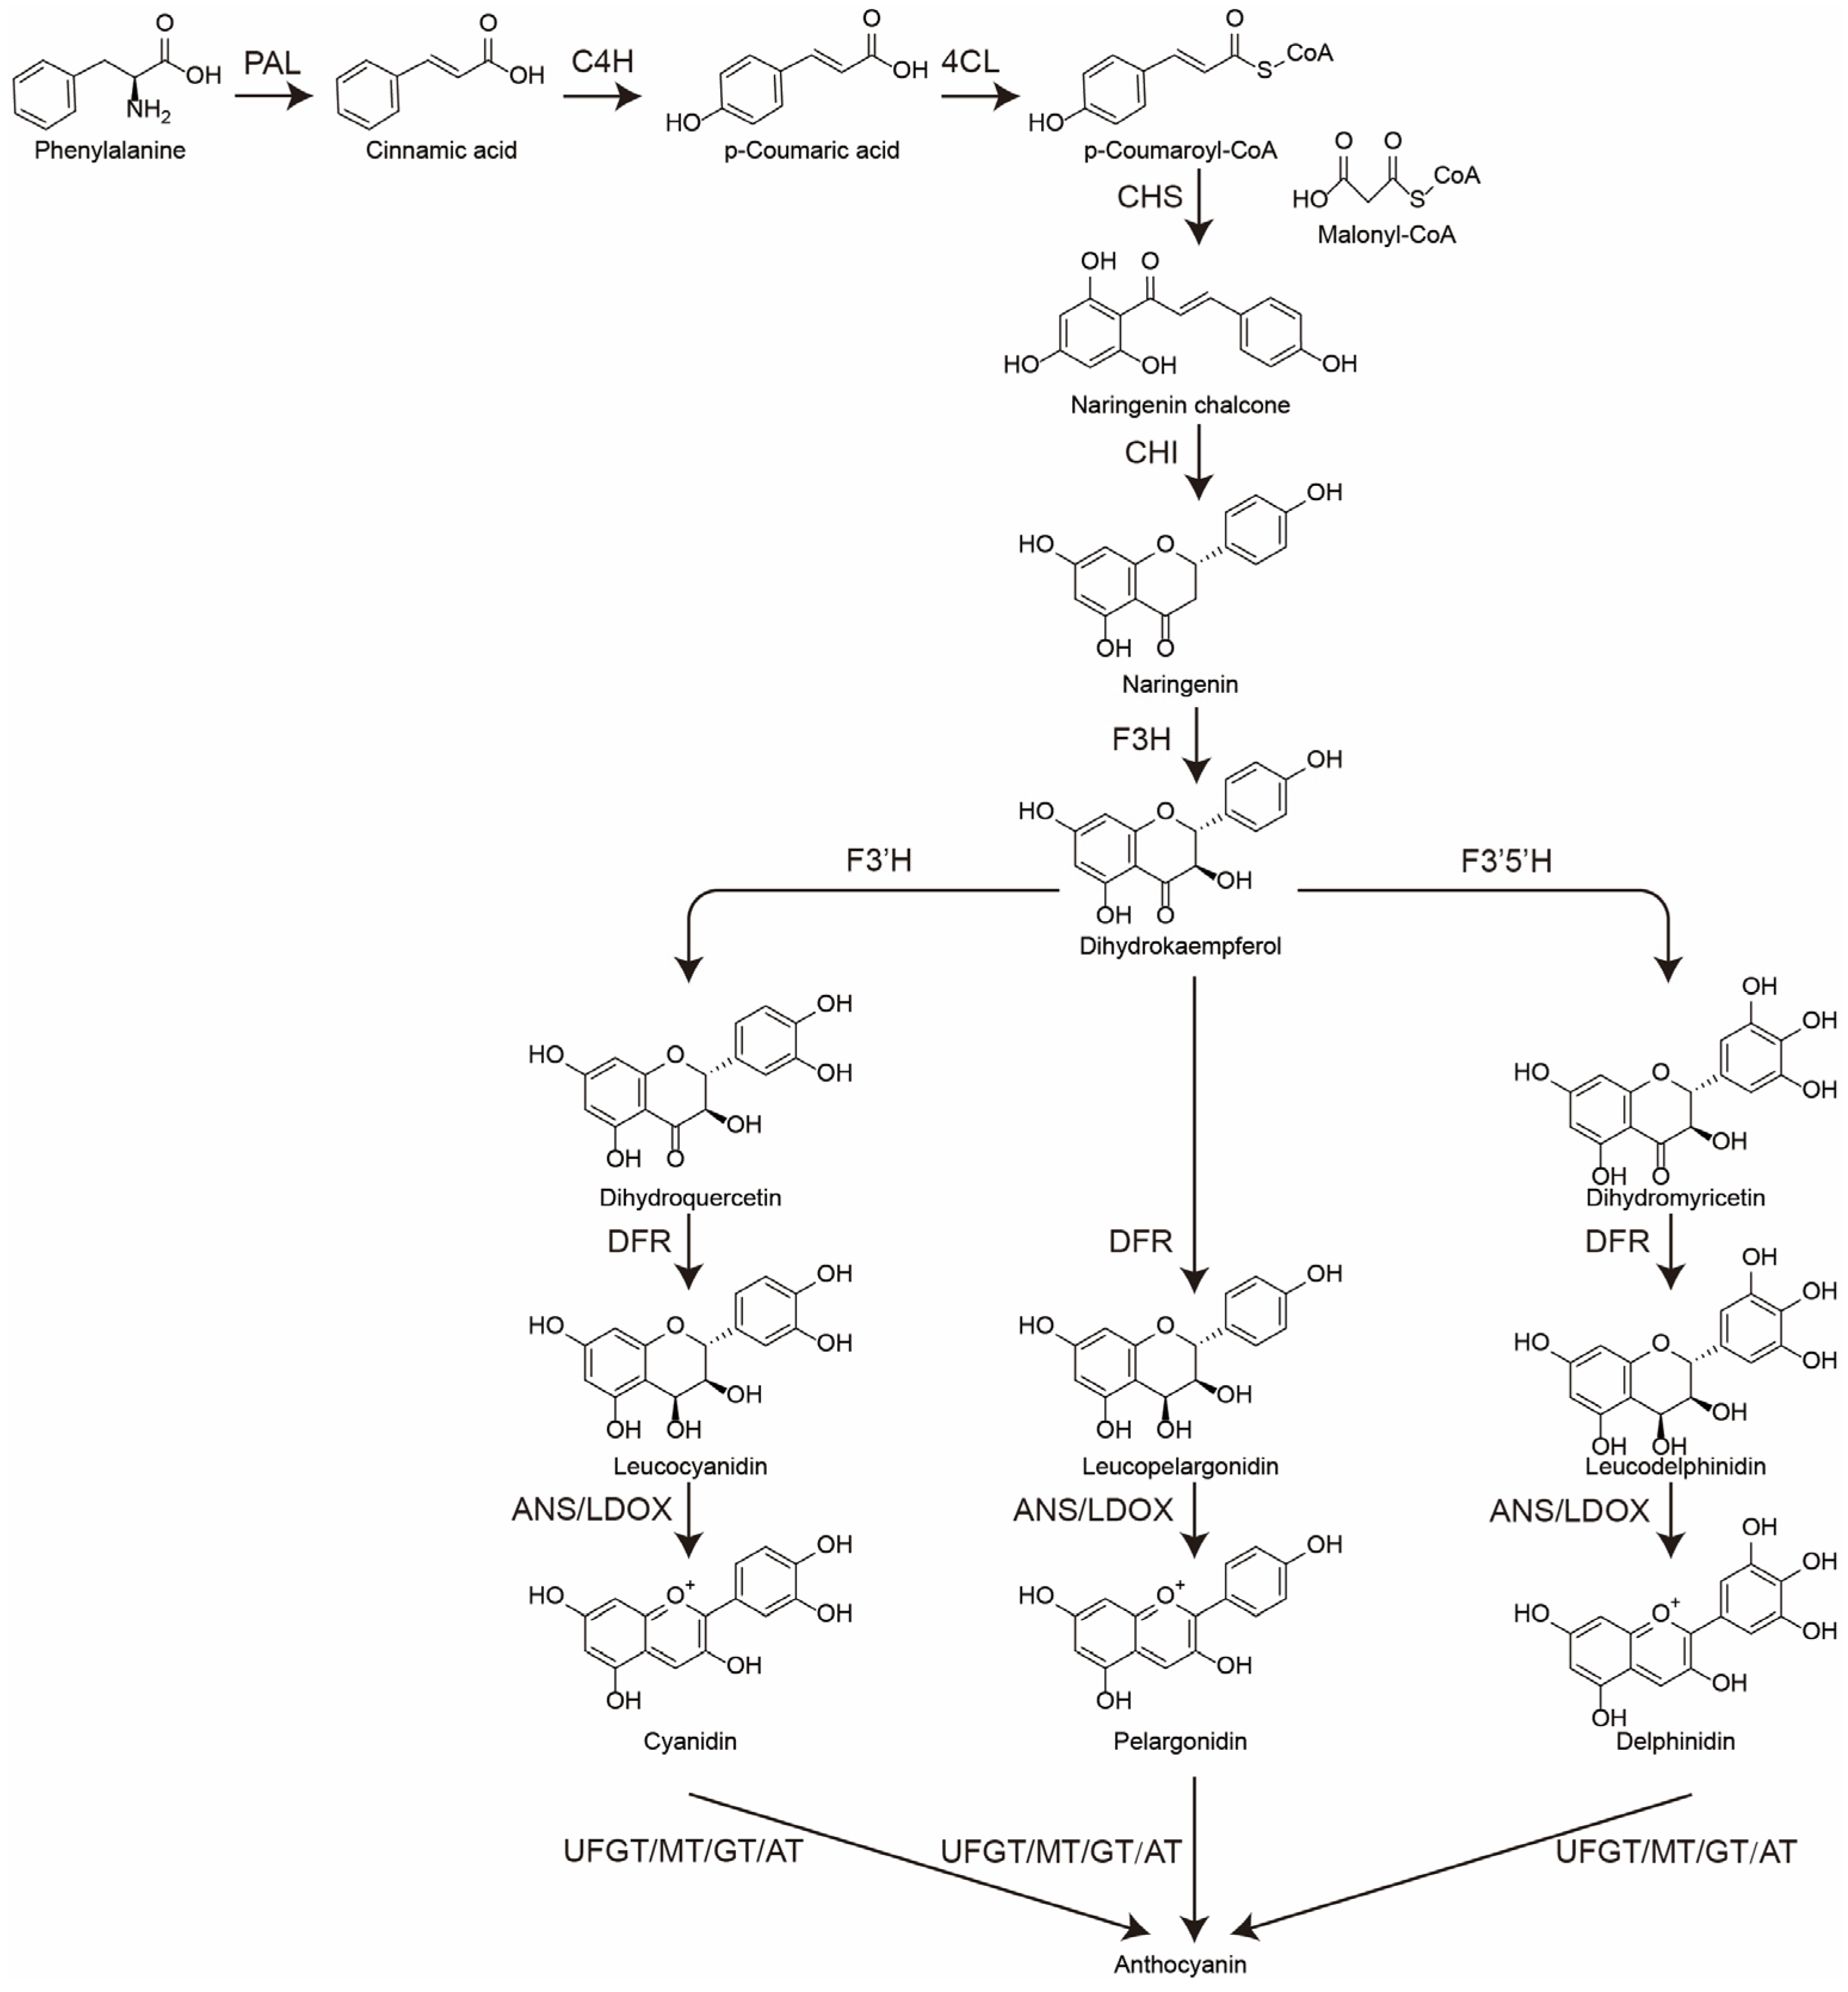
3.1. The Biosynthesis of Anthocyanins in the Spike of Djulis

Natural pigments derived from natural sources are integral to the vibrant coloration observed in various plant species. Among these pigments, anthocyanins, betalains, and carotenoids have garnered significant research interest due to their distinctive biological properties and their role in plant coloration mechanisms. Nonetheless, there remains an absence of pertinent studies concerning the key structural genes implicated in anthocyanin biosynthesis within the spikes of djulis. To elucidate the presence of anthocyanins and the potential molecular mechanisms underlying their formation in the spicules of djulis, this study employed an integrated approach combining metabolomic and transcriptomic analyses. This comprehensive examination was conducted on spicule samples of djulis collected across various color developmental stages.
Through the detection of anthocyanin content in the spike of djulis, targeted anthocyanin metabolomics analysis, and non-targeted metabolomics analysis, we found that there are significant changes in anthocyanin during the process of transitioning from green to red or orange. Specifically, during the process of djulis from the flowering stage to the maturation stage, most of the anthocyanin content increases, and only a small portion of anthocyanin content accumulates. We have identified two types of anthocyanins, delphinidin 3-sambubioside and peonidin 3-galactoside, that accumulate during the process of transitioning from green to red or orange. A combined analysis of transcriptomics and targeted metabolomics further elucidated differential anthocyanins and key genes that facilitate anthocyanin biosynthesis, predominantly active during the color transition phase. Through transcriptomic analysis, we identified 28 differentially expressed genes associated with anthocyanin biosynthesis. These include 2 4-coumarate-CoA ligases (4CLs), 9 chalcone synthases (CHSs), 3 chalcone isomerases (CHIs), 3 flavanone 3-hydroxylases (F3Hs), 2 flavonoid 3′-hydroxylases (F3′Hs), 2 flavonoid 3′,5′-hydroxylases (F3′5’Hs), 1 dihydroflavonol 4-reductase (DFR), 1 anthocyanidin synthase (ANS), 1 leucoanthocyanidin dioxygenase (LDOX), 3 UDP-glucose: flavonoid 3-O-glucosyltransferases (UFGTs), and 1 anthocyanin 3-O-glucoside-6″O-malonyltransferase (3GGT). Concurrently, targeted metabolomic analysis revealed 17 differentially expressed anthocyanin metabolites. Among these, delphinidin 3-sambubioside and peonidin 3-galactoside were identified as the primary metabolites exhibiting up-regulated expression. The correlation analysis between differential genes and metabolites revealed that seven genes, specifically three CHSs (CfCHS3_1, CfCHS3_2, CfCHS3_3), one F3H (CfF3H_3), one F3’5’H (CfCYP75A6_1), one DFR (CfDFRA), and one 3GGT (Cf3GGT), exhibited significant positive correlation with the up-regulated anthocyanins, delphinidin 3-sambubioside and peonidin 3-galactoside. Conversely, the genes 4CL and CHI showed significant negative correlations with these anthocyanins. Consequently, it is highly probable that the seven genes serve as the principal structural genes governing the biosynthesis of delphinidin 3-sambubioside and peonidin 3-galactoside.
CHS serves as a pivotal enzyme in the initial crucial step of the flavonoid biosynthesis pathway [53]. Similarly, F3H represents a significant enzyme class involved in the formation of dihydroflavonols and is regarded as a key enzyme at the branching point of the flavonoid biosynthesis pathway [54]. Furthermore, F3′5′H facilitates the production of delphinidin [26], corroborating the findings of our study, which demonstrated that the synthetic pathway involving F3′5′H resulted in delphinidin production. DFR plays a crucial role in the catalysis of anthocyanin biosynthesis by reducing dihydroflavonols to colorless anthocyanidins [55]. According to Cheng et al. [56], 3GGT is responsible for the subsequent glycosylation of anthocyanin 3-O-glucosides, a process that not only stabilizes anthocyanins but also facilitates their transport into vesicles. Ueyama et al. [57] reported that delphinidin is the predominant anthocyanidin in Nierembergia sp. and that the genes CHS, F3′5’H, and DFR are coordinately regulated in relation to delphinidin accumulation. Similarly, Suzuki et al. [58] observed in their investigation of perianth pigmentation in Asiatic hybrid lilies (Lilium spp.) that the expression levels of CHS and DFR were significantly elevated in pigmented regions containing anthocyanins compared to unpigmented parts. In their study on the purple pods of Lablab purpureus (L.) Sweet, Cui et al. [59] identified five anthocyanin derivatives, specifically those of malvidin, delphinidin, and petunidin, with delphinidin derivatives being the most prevalent. Furthermore, the expression levels of the genes PAL, F3H, F3’H, DFR, and ANS were significantly increased in the purple pods compared to the green pods. In the research conducted by Shi et al. [60], the results showed that CHS and DFR are crucial in influencing the pigmentation of Paeonia rockii, primarily by modulating the ratio of cyanidin to peonidin, thereby resulting in dark purple or purple-red hues. Similarly, a study by Mei et al. [61] demonstrated that 3GT expression was significantly up-regulated, contributing to the accumulation of delphinidin and cornflowerin in the “Zijuan” tea plant (Camellia sinensis var. assamica). The study by Zhang et al. [62] highlighted the role of CHS genes in the development of pink pigmentation in quinoa leaves. Our findings corroborate these results, demonstrating that CHS, F3H, F3′5′H, DFR, and 3GGT are integral to the biosynthesis of anthocyanins.
Based on the results of this experiment, we propose the potential presence of anthocyanins in the spikes of djulis (Figure 8). We hypothesize that the high expression of the genes CfCHS3_1, CfCHS3_2, CfCHS3_3, CfF3H_3, CfCYP75A6_1, CfDFRA, and Cf3GGT are pivotal in the biosynthesis of the two anthocyanins, delphinidin 3-sambubioside and peonidin 3-galactoside. Our findings offer a molecular theoretical foundation for understanding the mechanism underlying spike color formation in djulis. This study exclusively investigated the structural genes associated with the biosynthesis of delphinidin 3-sambubioside and peonidin 3-galactoside. Currently, it remains undetermined whether these anthocyanins contribute to the coloration of djulis spikes, warranting further investigation in this context.

3.2. The Change in Spike Color May Be the Result of the Combined Action of Anthocyanins and Betalains

Although the content of betalains in the spike of djulis was not determined in this study, a noteworthy finding in our study is that the betalains and anthocyanin were identified in the metabolites through non-targeted metabolomics. Djulis and quinoa, which are closely related crops in the genus Quinoa of the Amaranthaceae family, exhibit similar biological properties [63,64]. Our non-targeted metabolomic and targeted anthocyanin metabolomic analyses revealed the presence of anthocyanins in the spikes of djulis. Gorinstein et al. [65] and Paśko et al. [66] conducted studies to characterize the antioxidant activity of quinoa seeds and shoots by quantifying compounds such as total phenolics and anthocyanins. In a subsequent study, Zhang et al. [62] elucidated the biosynthetic pathway of anthocyanins in quinoa leaves, indicating that anthocyanins are present in the leaves and contribute to their pink coloration. The results of this experiment and previous research suggest the presence of anthocyanins in Quinoa spp. However, in previous studies, it has also been reported that betalains are the compounds responsible for the pigmentation in quinoa and djulis [23,67,68]. Many studies have mentioned the mutual exclusivity of anthocyanins and betalains [35,69]. In their investigation of betalain biosynthesis and its evolution in purple jasmine (Mirabilis jalapa L.), Polturak et al. [70] discovered that genes associated with anthocyanin synthesis, especially anthocyanin synthase (MjANS), exhibit high expression levels in petals accumulating betalains. However, the synthesis of anthocyanin is impeded due to the absence of the requisite active site region. Furthermore, a study conducted by Pucker et al. [71] proposed several mechanisms to elucidate the reduction in anthocyanins in beet-pigmented Caryophyllales. These mechanisms primarily involve the loss of a key enzyme, the downregulation of synthesis genes, and the degeneration of regulatory complexes. Consequently, the current experiment detected the presence of both anthocyanins and betalains, suggesting a potential coexistence of these pigments. Lu et al. [72], in their investigation into the impact of nitrogen non-thermal pressure plasma on the natural bioactive compounds in djulis seeds, observed a significant increase in the levels of betacyanin and anthocyanin in seeds treated with nitrogen non-thermal plasma. These findings align with the concurrent detection of anthocyanins and betacyanins reported in the present study. The longstanding notion of the non-coexistence and mutual exclusivity of anthocyanins and betacyanins has been well-documented. This study provides a significant case for further investigation into the potential coexistence of these pigments.

4. Materials and Methods

4.1. Plant Materials

The experimental material used in this study was djulis, sourced from Chengdu University. Seven different developmental stages, ranging from the onset of full bloom to complete maturity, were selected to determine the anthocyanin content. Samples for omics analysis were specifically selected from green spikes at the mid-developmental stage, as well as from red and orange spikes at the mature stage (Figure 9). For the convenience of description in the article, these three kinds of samples were labeled as green (G), red (R), and orange (O), respectively.

4.2. Determination of Anthocyanin Content

To ascertain the presence of anthocyanins in the spikes, we collected samples from seven distinct developmental stages, specifically from the full bloom stage to 15, 20, 25, 30, 35, and 40 days after pollination (DAP). Anthocyanin content from each sample was detected utilizing the Leagene anthocyanin test kit (Leagene. Beijing, China) [62,73]. Firstly, 0.25 g of the sample from each developmental stage was accurately weighed and mixed with 8 mL of a 0.1 mol/L hydrochloric acid methanol solution. The samples were then enveloped in aluminum foil and stored at 4 °C, shielded from light, overnight to allow the sample tissue to turn white. Following this, the supernatant was obtained by centrifugation at 9569× g (cence, Changsha, China) for ten minutes. A volume of 200 µL of the extraction solution was aspirated using a sterile pipette and transferred into the wells of a 96-well plate. The acidic methanol extraction solution served as a blank control. The absorbance at 530 nm was subsequently measured using a BioTek SYNERGY HTX microplate reader (BioTek, Winooski, America). Definition of Anthocyanin Unit: An anthocyanin unit (U) is defined as the concentration of anthocyanin corresponding to an optical density (OD) value of 0.1. Calculation Method: The anthocyanin content in tissue samples, expressed as units per gram (U/g), is calculated using the formula: (A_sample − A_blank)/(0.1 × 0.25 g), where A_sample represents the OD value of the anthocyanin extract measured at 530 nm.

4.3. Anthocyanins Targeted Metabolomics Analysis

The materials used for targeted metabolomics detection were green (G), red (R), and orange (O), with three biological replicates for each color of spike. The samples were accurately weighed, and 1000 μL of 60% methanol (containing 0.1 mol/L hydrochloric acid and 0.1% ethylenediaminetetraacetic acid disodium salt by mass) was added and vortexed for 60 s. The samples were added with steel beads and then put into a tissue grinder and ground at 50 Hz for 120s. The samples were ultrasonicated at 40 °C for 10 min with 60% ultrasound power and then centrifuged at 4 °C for 10 min at 13,780× g. The supernatant was filtered through a 0.22 μm membrane, and the filtrate was added to the assay bottle for LC-MS/MS detection.
The raw mass spectra were converted to mzML file format using the MS Convert tool in the Proteowizard package (v3.0.8789). Peak detection, peak filtering, and peak alignment were performed using the XCMS software (version 1.42.0) package to obtain a list of peak areas of substances. The data were batch normalized for peak area to allow comparison of different magnitudes. The public databases KNApSAcK (http://www.knapsackfamily.com/KNApSAcK/ (accessed on 9 January 2025)), HMDB (http://www.hmdb.ca/ (accessed on 9 January 2025)), LipidMaps, PubChem, and KEGG were used for the identification of the substances, and the parameters were set to ppm < 30 ppm. The total peak normalization method was used to achieve data correction and eliminate systematic errors. The Ropls from the R software package (version 3.3.2) were used to perform principal component analysis (PCA), partial least squares-discriminant analysis (PLS-DA), and orthogonal partial least squares-discriminant analysis (OPLS-DA) for dimensionality reduction in the sample data. Score plots, loading plots, and S-plot plots were plotted to demonstrate the differences in anthocyanin composition among the samples. Based on the statistical test to calculate the p-value, the OPLS-DA dimensionality reduction method to calculate the variable projection importance (VIP), and Fold Change to calculate the multiplicity of differences between groups, we measured the intensity of the influence of the content of each anthocyanin component on the classification discrimination of the samples and the explanatory ability, which assisted in the screening of marker anthocyanins. The screening threshold was p-value ≤ 0.05 and VIP ≥ 1.

4.4. Non-Targeted Metabolomics Analysis

The materials used for the non-targeted metabolome assay comprised 18 djulis spike tissue samples, with an equal distribution of six samples each for the green (G), red (R), and orange (O) categories. The samples were accurately weighed to 200 mg (±1%) and prepared by the addition of 0.6 mL of 2-chlorophenylalanine (4 ppm) dissolved in methanol at −20 °C. The mixture was subjected to vortexing and oscillation for 30 s. Subsequently, 100 mg of glass beads were incorporated, and the samples were processed using a TissueLysis II tissue grinder (Thermo, Waltham, America) at a frequency of 25 Hz for 60 s. The sample was subjected to ultrasonication at room temperature for 15 min. Subsequently, centrifugation was performed at 1750× g for 10 min at 25 °C. A volume of 300 μL of the resulting supernatant was then filtered through a 0.22 μm membrane. The filtrate was transferred into assay vials, and 20 μL from each sample was combined to create quality control (QC) samples. The remaining samples were used for the liquid chromatography-mass spectrometry (LC-MS) analysis.
The raw data collected were converted into the mzXML format (xcms input file format) by ProteoWizard software (version 3.0.8789). Subsequent processes of peak identification, filtering, and alignment were performed using the XCMS package for R (version 3.3.2). This resulted in the generation of a data matrix containing detailed information on mass-to-charge ratios, retention times, and peak areas. To facilitate the comparison of datasets with varying magnitudes, batch normalization of the peak area data was performed. Multivariate statistical analyses, including principal component analysis (PCA), partial least squares discriminant analysis (PLS-DA), and orthogonal-partial least squares discriminant analysis (OPLS-DA), were conducted using the SIMCA-P software package (version 13.0) and the ropls package within the R programming language. The p-value was calculated according to the statistical test, while the variable importance in projection (VIP) was calculated through the OPLS-DA dimensionality reduction method. Fold Change (FC) was used to evaluate the magnitude of differences between groups, indicating the influence and explanatory power of each metabolite’s content on sample classification. These metrics aided in identifying marker metabolites, with differential metabolites screened using thresholds of p-value ≤ 0.05 and VIP ≥ 1.

4.5. Transcriptomics Analysis

The samples used for transcriptome analysis were green (G), red (R), and orange (O). RNA was extracted from the samples using kits (Tengen polysaccharide polyphenol kit, QIAGEN, Dusseldorf, Germany). Rigorous quality control of RNA samples was performed with the Agilent 2100 bioanalyzer to accurately detect RNA integrity. Subsequently, cDNA libraries were constructed for Illumina sequencing, with three biological replicates performed for each group.
Following quality control, the clean reads were efficiently and accurately aligned to the hexaploid djulis reference genome (accessible at https://www.ncbi.nlm.nih.gov/bioproject/840947 (accessed on 9 January 2025)) using the HISAT2 software (version 2.0.5). Subsequently, novel transcripts were assembled using StringTie software (version 1.3.3b). These newly assembled transcripts were then annotated by retrieving information from various databases, including Pfam (http://pfam.xfam.org/ (accessed on 9 January 2025)), SUPERFAMILY (https://supfam.org/SUPERFAMILY/ (accessed on 9 January 2025)), GO (https://www.geneontology.org/ (accessed on 9 January 2025)), and KEGG (https://www.genome.jp/kegg/ (accessed on 9 January 2025)) to obtain annotation information.

4.6. Differential Genes Identification, GO, and KEGG Enrichment Analysis

Raw read count values were obtained by quantitative analysis using the FeatureCounts tools in the Subread software suite (version 1.5.0-p3). Gene expression levels were quantified using Fragments Per Kilobase Million (FPKM) to account for variations in sequencing depth and gene length. Differential gene expression analysis was conducted using the DESeq2 software (version 1.20.0), wherein the raw read counts were initially normalized, followed by the application of a statistical model to compute the probability values (p-values) for hypothesis testing. Finally, corrections for multiple hypothesis testing were conducted to calculate the false discovery rate (FDR), with the adjusted p-value (padj) being a commonly used metric. The criteria for identifying differentially expressed genes were set as |log2 (FoldChange)| ≥ 1 and padj ≤ 0.05.
After obtaining differential genes based on gene expression scores, gene functions will be enriched for analysis. The enrichment analysis is based on the principle of hypergeometric distribution, where the set of differential genes is the set of differential genes obtained from differential significant analysis and annotated to the GO or KEGG database. The software used was Cluster Profiler software (version 3.8.1). The GO function enrichment and KEGG enrichment analyses were performed using the GO database (https://www.geneontology.org/ (accessed on 9 January 2025)) and the KEGG database (https://www.genome.jp/kegg/ (accessed on 9 January 2025)), respectively. GO function enrichment and KEGG pathway enrichment were performed with a padj ≤ 0.05 as the threshold for being a significant enrichment.

4.7. Combined Transcriptomics and Metabolomics Analysis

Transcriptomic and metabolomic data were integrated to investigate the interactions between genes and metabolites. The Pearson correlation coefficient (PCC) method was employed to calculate the correlation coefficients between the selected genes and metabolites. A PCC value of 0.6 or higher was considered indicative of a significant correlation between the genes and metabolites.

4.8. qRT-PCR Validation

Four stages of djulis spike tissues were selected at the 20th, 30th, 35th, and 40th days after the end of the full flowering period. These stages were designated as periods 1, 2, 3, and 4, respectively. For each period, three biological replicates were prepared. RNA was extracted from each sample and subsequently reverse-transcribed to synthesize complementary DNA (cDNA) using the Mei5bio kit. This cDNA served as a template for quantitative reverse transcription polymerase chain reaction (qRT-PCR) verification. The experimental protocol involved an initial pre-denaturation step at 95 °C for 1 min, followed by denaturation at 95 °C for 15 s, annealing at 60 °C for 15 s, and extension at 72 °C for 30 s, across a total of 40 cycles. UBI3 was selected as the internal reference gene. The coding sequence (CDS) of the target gene, as identified in the annotation file, was utilized in conjunction with SnapGene version 6.0.2 and the NCBI Primer Design tool (https://www.ncbi.nlm.nih.gov/tools/primer-blast (accessed on 9 January 2025)). The relative expression levels of the target genes were quantified using the 2−ΔΔCt method [74].

4.9. Statistical Analysis

Data analysis and plotting for each histology section were analyzed and generated using R packages, including ropls, reshape2, ggplot2, and heatmap in Rstudio software (version 4.2.2). Additionally, qRT-PCR results were analyzed and visualized using GraphPad Prism version 10.2.2 software. The results were calculated in x ± n. The RNA-seq data were submitted to the NCBI BioProjects database (accession number: PRJNA1199591).

5. Conclusions

The integrated transcriptomic and metabolomic analysis revealed that there are alterations in anthocyanin level changes during the transition of spike color from green to red or orange in djulis, both prior to and following maturation. The metabolites associated with anthocyanin synthesis were predominantly enriched in the flavonoid biosynthesis pathway (ko00941) and the anthocyanin biosynthesis pathway (ko00942). Two anthocyanins, delphinidin 3-sambubioside and peonidin 3-galactoside, progressively accumulated during the transition of spike color from green to red or orange in djulis, and the high expression levels of CfCHS3_1, CfCHS3_2, CfCHS3_3, CfF3H_3, CfCYP75A6_1, CfDFRA, and Cf3GGT are pivotal in facilitating the synthesis of these two anthocyanins. Our findings provide a foundation for exploring the potential coexistence of anthocyanins and betalains.

Author Contributions

Conceptualization, X.W. (Xiaoyong Wu) and C.Z.; methodology, X.W. (Xiaoyong Wu); software, C.Z., W.G., and X.L.; validation, C.Z., X.L., and X.W. (Xiuzhang Wang); data curation, C.Z. and X.W. (Xiuzhang Wang); writing—original draft preparation, C.Z. and X.W. (Xiaoyong Wu); writing—review and editing, Y.S. and X.W. (Xiaoyong Wu); visualization, C.Z. and W.G.; supervision, X.W. (Xiaoyong Wu); project administration, X.W. (Xiaoyong Wu); funding acquisition, X.W. (Xiaoyong Wu). All authors have read and agreed to the published version of the manuscript.

Funding

This work was supported by the Sichuan Province Science and Technology Program (Grant 2022YFQ0041) and the Project of Sichuan Provincial Administration of Traditional Chinese Medicine (2023MS273).

Data Availability Statement

The raw RNA-seq data were submitted to the NCBI BioProjects database (accession number: PRJNA1199591).

Conflicts of Interest

The authors declare no conflicts of interest.

References

  1. Yang, B.-Y.; Cheng, M.-H.; Ko, C.-H.; Wang, Y.-N.; Chen, W.-H.; Hwang, W.-S.; Yang, Y.-P.; Chen, H.-T.; Chang, F.-C. Potential bioethanol production from Taiwanese chenopods (Chenopodium formosanum). Energy 2014, 76, 59–65. [Google Scholar] [CrossRef]
  2. Huang, H.W.; Cheng, M.C.; Chen, B.Y.; Wang, C.Y. Effects of high pressure extraction on the extraction yield, phenolic compounds, antioxidant and anti-tyrosinase activity of Djulis hull. J. Food Sci. Technol. 2019, 56, 4016–4024. [Google Scholar] [CrossRef] [PubMed]
  3. Li, P.-H.; Chan, Y.-J.; Lu, W.-C.; Huang, D.-W.; Chang, T.-C.; Chang, W.-H.; Nie, X.-B.; Jiang, C.-X.; Zhang, X.-L. Bioresource Utilization of Djulis (Chenopodium formosanum) Biomass as Natural Antioxidants. Sustainability 2020, 12, 5926. [Google Scholar] [CrossRef]
  4. Chao, Y.-Y.; Hsueh, I.E. Insights into Physiological Mechanisms of Salt Stress Tolerance in Djulis (Chenopodium formosanum Koidz.) Sprouts. J. Plant Biol. 2019, 62, 263–273. [Google Scholar] [CrossRef]
  5. Lin, P.H.; Chao, Y.Y. Different Drought-Tolerant Mechanisms in Quinoa (Chenopodium quinoa Willd.) and Djulis (Chenopodium formosanum Koidz.) Based on Physiological Analysis. Plants 2021, 10, 2279. [Google Scholar] [CrossRef] [PubMed]
  6. Tsai, P.-J.; Chen, Y.-S.; Sheu, C.-H.; Chen, C.-Y. Effect of Nanogrinding on the Pigment and Bioactivity of Djulis (Chenopodium formosanum Koidz.). J. Agric. Food Chem. 2011, 59, 1814–1820. [Google Scholar] [CrossRef] [PubMed]
  7. Hong, Y.H.; Huang, Y.L.; Liu, Y.C.; Tsai, P.J. Djulis (Chenopodium formosanum Koidz.) Water Extract and Its Bioactive Components Ameliorate Dermal Damage in UVB-Irradiated Skin Models. BioMed Res. Int. 2016, 2016, 7368797. [Google Scholar] [CrossRef] [PubMed]
  8. Hsu, B.Y.; Lin, S.W.; Inbaraj, B.S.; Chen, B.H. Simultaneous determination of phenolic acids and flavonoids in Chenopodium formosanum Koidz. (djulis) by HPLC-DAD-ESI-MS/MS. J. Pharm. Biomed. Anal. 2017, 132, 109–116. [Google Scholar] [CrossRef] [PubMed]
  9. Chao, Y.-Y.; Wang, W.-J.; Liu, Y.-T. Effect of Calcium on the Growth of Djulis (Chenopodium formosanum Koidz.) Sprouts. Agronomy 2021, 11, 82. [Google Scholar] [CrossRef]
  10. Hsu, B.-Y.; Pan, S.-Y.; Wu, L.-Y.; Ho, C.-T.; Hwang, L.S. Hypoglycemic activity of Chenopodium formosanum Koidz. components using a glucose uptake assay with 3T3-L1 adipocytes. Food Biosci. 2018, 24, 9–16. [Google Scholar] [CrossRef]
  11. Li, P.H.; Chan, Y.J.; Hou, Y.W.; Lu, W.C.; Chen, W.H.; Tseng, J.Y.; Mulio, A.T. Functionality of Djulis (Chenopodium formosanum) By-Products and In Vivo Anti-Diabetes Effect in Type 2 Diabetes Mellitus Patients. Biology 2021, 10, 160. [Google Scholar] [CrossRef] [PubMed]
  12. Tung, Y.T.; Zeng, J.L.; Ho, S.T.; Xu, J.W.; Li, S.; Wu, J.H. Anti-NAFLD Effect of Djulis Hull and Its Major Compound, Rutin, in Mice with High-Fat Diet (HFD)-Induced Obesity. Antioxidants 2021, 10, 1694. [Google Scholar] [CrossRef] [PubMed]
  13. Chen, S.-Y.; Chu, C.-C.; Chyau, C.-C.; Yang, J.-W.; Duh, P.-D. Djulis (Chenopodium formosanum) and its bioactive compounds affect vasodilation, angiotensin converting enzyme activity, and hypertension. Food Biosci. 2019, 32, 100469. [Google Scholar] [CrossRef]
  14. Chyau, C.C.; Chu, C.C.; Chen, S.Y.; Duh, P.D. The Inhibitory Effects of Djulis (Chenopodium formosanum) and Its Bioactive Compounds on Adipogenesis in 3T3-L1 Adipocytes. Molecules 2018, 23, 1780. [Google Scholar] [CrossRef] [PubMed]
  15. Chen, S.-Y.; Chu, C.-C.; Lin, Y.-C.; Duh, P.-D. Djulis (Chenopodium formosanum) and Its Bioactive Compounds for Management of Hyperlipidemia and Hyperglycemia in High-Fat Diet-Fed Mice. J. Food Nutr. Res. 2019, 7, 452–457. [Google Scholar] [CrossRef]
  16. Lee, C.W.; Chen, H.J.; Xie, G.R.; Shih, C.K. Djulis (Chenopodium Formosanum) Prevents Colon Carcinogenesis via Regulating Antioxidative and Apoptotic Pathways in Rats. Nutrients 2019, 11, 2168. [Google Scholar] [CrossRef]
  17. Chu, C.-C.; Chen, S.-Y.; Chyau, C.-C.; Fu, Z.-H.; Liu, C.-C.; Duh, P.-D. Protective effect of Djulis (Chenopodium formosanum) and its bioactive compounds against carbon tetrachloride-induced liver injury, in vivo. J. Funct. Foods 2016, 26, 585–597. [Google Scholar] [CrossRef]
  18. Lin, T.A.; Ke, B.J.; Cheng, C.S.; Wang, J.J.; Wei, B.L.; Lee, C.L. Red Quinoa Bran Extracts Protects against Carbon Tetrachloride-Induced Liver Injury and Fibrosis in Mice via Activation of Antioxidative Enzyme Systems and Blocking TGF-β1 Pathway. Nutrients 2019, 11, 395. [Google Scholar] [CrossRef]
  19. Chu, C.-C.; Chen, S.-Y.; Chyau, C.-C.; Wu, Y.-C.; Chu, H.-L.; Duh, P.-D. Anticancer activity and mediation of apoptosis in hepatoma carcinoma cells induced by djulis and its bioactive compounds. J. Funct. Foods 2020, 75, 104225. [Google Scholar] [CrossRef]
  20. Tu, D.G.; Chyau, C.C.; Chen, S.Y.; Chu, H.L.; Wang, S.C.; Duh, P.D. Antiproliferative Effect and Mediation of Apoptosis in Human Hepatoma HepG2 Cells Induced by Djulis Husk and Its Bioactive Compounds. Foods 2020, 9, 1514. [Google Scholar] [CrossRef] [PubMed]
  21. Lin, Y.-H.; Lin, Y.-K.; Chan, S.-T.; Chun, Y.-M.; Lin, Y.-T.; Kan, K.-W.; Yu, C.-H. Anti Cutaneous Aging Effect of Red Djulis (Chenopodium formosanum) Extract on Gene Expression of Human Dermal Fibroblast. Preprints 2019, 2019090028. [Google Scholar] [CrossRef]
  22. Lin, Y.-M.; Chung, Y.-C.; Chen, P.-Y.; Chang, Y.-C.; Chen, W.-L. Fermentation of Chenopodium formosanum Leaf Extract with Aspergillus oryzae Significantly Enhanced Its Physiological Activities. Appl. Sci. 2023, 13, 2917. [Google Scholar] [CrossRef]
  23. Tsai, P.J.; Sheu, C.H.; Wu, P.H.; Sun, Y.F. Thermal and pH stability of betacyanin pigment of Djulis (Chenopodium formosanum) in Taiwan and their relation to antioxidant activity. J. Agric. Food Chem. 2010, 58, 1020–1025. [Google Scholar] [CrossRef] [PubMed]
  24. Chio, E.H.; Yang, E.-C.; Huang, H.-T.; Hsu, E.-L.; Chen, C.-R.; Huang, C.-G.; Huang, R.-N. Toxicity and repellence of Taiwanese indigenous djulis, Chenopodium formosaneum, against Aedes albopictus (Diptera: Culicidae) and Forcipomyia taiwana (Diptera: Ceratopogonidae). J. Pest Sci. 2013, 86, 705–712. [Google Scholar] [CrossRef]
  25. Chuang, K.J.; Chen, Z.J.; Cheng, C.L.; Hong, G.B. Investigation of the Antioxidant Capacity, Insecticidal Ability and Oxidation Stability of Chenopodium formosanum Seed Extract. Int. J. Mol. Sci. 2018, 19, 2726. [Google Scholar] [CrossRef]
  26. Jaakola, L. New insights into the regulation of anthocyanin biosynthesis in fruits. Trends Plant Sci. 2013, 18, 477–483. [Google Scholar] [CrossRef] [PubMed]
  27. Spelt, C.; Quattrocchio, F.; Mol, J.N.; Koes, R. anthocyanin1 of Petunia Encodes a Basic Helix-Loop-Helix Protein That Directly Activates Transcription of Structural Anthocyanin Genes. Plant Cell 2000, 12, 1619–1632. [Google Scholar] [CrossRef] [PubMed]
  28. Yin, Y.-c.; Zhang, X.-d.; Gao, Z.-q.; Hu, T.; Liu, Y. The Research Progress of Chalcone Isomerase (CHI) in Plants. Mol. Biotechnol. 2018, 61, 32–52. [Google Scholar] [CrossRef] [PubMed]
  29. Hong, S.; Wang, J.; Wang, Q.; Zhang, G.; Zhao, Y.; Ma, Q.; Wu, Z.; Ma, J.; Gu, C. Decoding the formation of diverse petal colors of Lagerstroemia indica by integrating the data from transcriptome and metabolome. Front. Plant Sci. 2022, 13, 970023. [Google Scholar] [CrossRef] [PubMed]
  30. Wu, Y.; Han, T.; Lyu, L.; Li, W.; Wu, W. Research progress in understanding the biosynthesis and regulation of plant anthocyanins. Sci. Hortic. 2023, 321, 112374. [Google Scholar] [CrossRef]
  31. Wan, L.; Lei, Y.; Yan, L.; Liu, Y.; Pandey, M.K.; Wan, X.; Varshney, R.K.; Fang, J.; Liao, B. Transcriptome and metabolome reveal redirection of flavonoids in a white testa peanut mutant. BMC Plant Biol. 2020, 20, 161. [Google Scholar] [CrossRef] [PubMed]
  32. Zhao, D.; Zhao, L.; Liu, Y.; Zhang, A.; Xiao, S.; Dai, X.; Yuan, R.; Zhou, Z.; Cao, Q. Metabolomic and Transcriptomic Analyses of the Flavonoid Biosynthetic Pathway for the Accumulation of Anthocyanins and Other Flavonoids in Sweetpotato Root Skin and Leaf Vein Base. J. Agric. Food Chem. 2022, 70, 2574–2588. [Google Scholar] [CrossRef]
  33. Shoeva, O.Y.; Glagoleva, A.Y.; Khlestkina, E.K. The factors affecting the evolution of the anthocyanin biosynthesis pathway genes in monocot and dicot plant species. BMC Plant Biol. 2017, 17, 256. [Google Scholar] [CrossRef] [PubMed]
  34. Liu, Y.; Tikunov, Y.; Schouten, R.E.; Marcelis, L.F.M.; Visser, R.G.F.; Bovy, A. Anthocyanin Biosynthesis and Degradation Mechanisms in Solanaceous Vegetables: A Review. Front. Chem. 2018, 6, 52. [Google Scholar] [CrossRef]
  35. Tanaka, Y.; Sasaki, N.; Ohmiya, A. Biosynthesis of plant pigments: Anthocyanins, betalains and carotenoids. Plant J. 2008, 54, 733–749. [Google Scholar] [CrossRef] [PubMed]
  36. Shi, Q.; Du, J.; Zhu, D.; Li, X.; Li, X. Metabolomic and Transcriptomic Analyses of Anthocyanin Biosynthesis Mechanisms in the Color Mutant Ziziphus jujuba cv. Tailihong. J. Agric. Food Chem. 2020, 68, 15186–15198. [Google Scholar] [CrossRef] [PubMed]
  37. Zhong, Y.; Chen, C.; Gong, X.; Luan, X.; Wu, Z.; Li, H.; Liu, Q.; Xu, M.; Yu, F. Transcriptome and metabolome analyses reveal a key role of the anthocyanin biosynthetic pathway cascade in the pigmentation of a Cinnamomum camphora red bark mutant (‘Gantong 1’). Ind. Crop. Prod. 2022, 175, 114236. [Google Scholar] [CrossRef]
  38. Zhang, X.; Lin, S.; Peng, D.; Wu, Q.; Liao, X.; Xiang, K.; Wang, Z.; Tembrock, L.R.; Bendahmane, M.; Bao, M.; et al. Integrated multi-omic data and analyses reveal the pathways underlying key ornamental traits in carnation flowers. Plant Biotechnol. J. 2022, 20, 1182–1196. [Google Scholar] [CrossRef] [PubMed]
  39. Wang, H.; Kong, Y.; Dou, X.; Yang, Y.; Chi, X.; Lang, L.; Zhang, Q.; Pan, H.; Bai, J. Integrative Metabolomic and Transcriptomic Analyses Reveal the Mechanism of Petal Blotch Formation in Rosa persica. Int. J. Mol. Sci. 2024, 25, 4030. [Google Scholar] [CrossRef] [PubMed]
  40. Chen, Q.; Li, Y.; Han, H.; Ma, Y.; Xie, X.; Feng, Y.; Zhao, Q.; Dong, Y.; Zhao, X.; Gu, H.; et al. Transcriptome and metabolite profiling analyses reveal the molecular mechanism underlying the characteristic accumulation of anthocyanins and flavonols in Fritillaria unibracteata and F. delavayi. Ind. Crop. Prod. 2022, 186, 115183. [Google Scholar] [CrossRef]
  41. Koes, R.; Verweij, W.; Quattrocchio, F. Flavonoids: A colorful model for the regulation and evolution of biochemical pathways. Trends Plant Sci. 2005, 10, 236–242. [Google Scholar] [CrossRef]
  42. Liu, Y.; Lv, J.; Liu, Z.; Wang, J.; Yang, B.; Chen, W.; Ou, L.; Dai, X.; Zhang, Z.; Zou, X. Integrative analysis of metabolome and transcriptome reveals the mechanism of color formation in pepper fruit (Capsicum annuum L.). Food Chem. 2020, 306, 125629. [Google Scholar] [CrossRef]
  43. Shen, N.; Wang, T.; Gan, Q.; Liu, S.; Wang, L.; Jin, B. Plant flavonoids: Classification, distribution, biosynthesis, and antioxidant activity. Food Chem. 2022, 383, 132531. [Google Scholar] [CrossRef]
  44. Xue, Q.; Zhang, X.; Yang, H.; Li, H.; Lv, Y.; Zhang, K.; Liu, Y.; Liu, F.; Wan, Y.; Filiz, E. Transcriptome and Metabolome Analysis Unveil Anthocyanin Metabolism in Pink and Red Testa of Peanut (Arachis hypogaea L.). Int. J. Genom. 2021, 2021, 5883901. [Google Scholar] [CrossRef] [PubMed]
  45. Lee, Y.-M.; Yoon, Y.; Yoon, H.; Park, H.-M.; Song, S.; Yeum, K.-J. Dietary Anthocyanins against Obesity and Inflammation. Nutrients 2017, 9, 1089. [Google Scholar] [CrossRef]
  46. Khoo, H.E.; Azlan, A.; Tang, S.T.; Lim, S.M. Anthocyanidins and anthocyanins: Colored pigments as food, pharmaceutical ingredients, and the potential health benefits. Food Nutr. Res. 2017, 61, 1361779. [Google Scholar] [CrossRef]
  47. Song, H.; Yi, H.; Lee, M.; Han, C.-T.; Lee, J.; Kim, H.; Park, J.-I.; Nou, I.-S.; Kim, S.-J.; Hur, Y. Purple Brassica oleracea var. capitata F. rubra is due to the loss of BoMYBL2–1 expression. BMC Plant Biol. 2018, 18, 82. [Google Scholar] [CrossRef] [PubMed]
  48. Wei, J.; Wu, H.; Zhang, H.; Li, F.; Chen, S.; Hou, B.; Shi, Y.; Zhao, L.; Duan, H. Anthocyanins inhibit high glucose-induced renal tubular cell apoptosis caused by oxidative stress in db/db mice. Int. J. Mol. Med. 2018, 41, 1608–1618. [Google Scholar] [CrossRef]
  49. Mattioli, R.; Francioso, A.; Mosca, L.; Silva, P. Anthocyanins: A Comprehensive Review of Their Chemical Properties and Health Effects on Cardiovascular and Neurodegenerative Diseases. Molecules 2020, 25, 3809. [Google Scholar] [CrossRef]
  50. Hazafa, A.; Rehman, K.-U.; Jahan, N.; Jabeen, Z. The Role of Polyphenol (Flavonoids) Compounds in the Treatment of Cancer Cells. Nutr. Cancer 2019, 72, 386–397. [Google Scholar] [CrossRef] [PubMed]
  51. Brockington, S.F.; Walker, R.H.; Glover, B.J.; Soltis, P.S.; Soltis, D.E. Complex pigment evolution in the Caryophyllales. New Phytol. 2011, 190, 854–864. [Google Scholar] [CrossRef] [PubMed]
  52. Jarvis, D.E.; Sproul, J.S.; Navarro-Dominguez, B.; Krak, K.; Jaggi, K.; Huang, Y.F.; Huang, T.Y.; Lin, T.C.; Jellen, E.N.; Maughan, P.J. Chromosome-Scale Genome Assembly of the Hexaploid Taiwanese Goosefoot “Djulis” (Chenopodium formosanum). Genome Biol. Evol. 2022, 14, 1–7. [Google Scholar] [CrossRef] [PubMed]
  53. Deng, X.; Bashandy, H.; Ainasoja, M.; Kontturi, J.; Pietiäinen, M.; Laitinen, R.A.E.; Albert, V.A.; Valkonen, J.P.T.; Elomaa, P.; Teeri, T.H. Functional diversification of duplicated chalcone synthase genes in anthocyanin biosynthesis of Gerbera hybrida. New Phytol. 2013, 201, 1469–1483. [Google Scholar] [CrossRef]
  54. Zhao, D.; Tao, J. Recent advances on the development and regulation of flower color in ornamental plants. Front. Plant Sci. 2015, 6, 261. [Google Scholar] [CrossRef] [PubMed]
  55. Lim, S.-H.; Park, B.; Kim, D.-H.; Park, S.; Yang, J.-H.; Jung, J.-A.; Lee, J.; Lee, J.-Y. Cloning and Functional Characterization of Dihydroflavonol 4-Reductase Gene Involved in Anthocyanin Biosynthesis of Chrysanthemum. Int. J. Mol. Sci. 2020, 21, 7960. [Google Scholar] [CrossRef] [PubMed]
  56. Cheng, J.; Wei, G.; Zhou, H.; Gu, C.; Vimolmangkang, S.; Liao, L.; Han, Y. Unraveling the Mechanism Underlying the Glycosylation and Methylation of Anthocyanins in Peach. Plant Physiol. 2014, 166, 1044–1058. [Google Scholar] [CrossRef]
  57. Ueyama, Y.; Katsumoto, Y.; Fukui, Y.; Mizutani, M.F.; Ohkawa, H.; Kusumi, T.; Iwashita, T.; Tanaka, Y. Molecular characterization of the flavonoid biosynthetic pathway and flower color modification of Nierembergia sp. Plant Biotechnol. 2006, 23, 19–24. [Google Scholar] [CrossRef]
  58. Suzuki, K.; Suzuki, T.; Nakatsuka, T.; Dohra, H.; Yamagishi, M.; Matsuyama, K.; Matsuura, H. RNA-seq-based evaluation of bicolor tepal pigmentation in Asiatic hybrid lilies (Lilium spp.). BMC Genom. 2016, 17, 611. [Google Scholar] [CrossRef]
  59. Cui, B.; Hu, Z.; Zhang, Y.; Hu, J.; Yin, W.; Feng, Y.; Xie, Q.; Chen, G. Anthocyanins and flavonols are responsible for purple color of Lablab purpureus (L.) sweet pods. Plant Physiol. Biochem. 2016, 103, 183–190. [Google Scholar] [CrossRef]
  60. Shi, Q.; Li, L.; Zhang, X.; Luo, J.; Li, X.; Zhai, L.; He, L.; Zhang, Y. Biochemical and Comparative Transcriptomic Analyses Identify Candidate Genes Related to Variegation Formation in Paeonia Rockii. Molecules 2017, 22, 1364. [Google Scholar] [CrossRef] [PubMed]
  61. Mei, Y.; Xie, H.; Liu, S.; Zhu, J.; Zhao, S.; Wei, C. Metabolites and Transcriptional Profiling Analysis Reveal the Molecular Mechanisms of the Anthocyanin Metabolism in the “Zijuan” Tea Plant (Camellia sinensis var. assamica). J. Agric. Food Chem. 2020, 69, 414–427. [Google Scholar] [CrossRef] [PubMed]
  62. Zhang, M.; Li, Y.; Wang, J.; Shang, S.; Wang, H.; Yang, X.; Lu, C.; Wang, M.; Sun, X.; Liu, X.; et al. Integrated transcriptomic and metabolomic analyses reveals anthocyanin biosynthesis in leaf coloration of quinoa (Chenopodium quinoa Willd.). BMC Plant Biol. 2024, 24, 203. [Google Scholar] [CrossRef]
  63. Kolano, B.; McCann, J.; OskĘDra, M.; Chrapek, M.; Rojek, M.; Nobis, A.; Weiss-Schneeweiss, H. Parental origin and genome evolution of several Eurasian hexaploid species of Chenopodium (Chenopodiaceae). Phytotaxa 2019, 392, 163–185. [Google Scholar] [CrossRef]
  64. Huang, C.Y.; Chu, Y.L.; Sridhar, K.; Tsai, P.J. Analysis and determination of phytosterols and triterpenes in different inbred lines of Djulis (Chenopodium formosanum Koidz.) hull: A potential source of novel bioactive ingredients. Food Chem. 2019, 297, 124948. [Google Scholar] [CrossRef] [PubMed]
  65. Gorinstein, S.; Vargas, O.J.M.; Jaramillo, N.O.; Salas, I.A.; Ayala, A.L.M.; Arancibia-Avila, P.; Toledo, F.; Katrich, E.; Trakhtenberg, S. The total polyphenols and the antioxidant potentials of some selected cereals and pseudocereals. Eur. Food Res. Technol. 2006, 225, 321–328. [Google Scholar] [CrossRef]
  66. Paśko, P.; Bartoń, H.; Zagrodzki, P.; Gorinstein, S.; Fołta, M.; Zachwieja, Z. Anthocyanins, total polyphenols and antioxidant activity in amaranth and quinoa seeds and sprouts during their growth. Food Chem. 2009, 115, 994–998. [Google Scholar] [CrossRef]
  67. Narkprasom, K.; Wang, S.-P.; Hsiao, S.-M.; Tsai, P.-J. Kinetics of Color Loss of Djulis (Chenopodium formosanum Koidz.) Extracts during Storage in Different Concentrations of Alcohol and Temperature. APCBEE Procedia 2012, 2, 32–36. [Google Scholar] [CrossRef]
  68. Laqui-Vilca, C.; Aguilar-Tuesta, S.; Mamani-Navarro, W.; Montaño-Bustamante, J.; Condezo-Hoyos, L. Ultrasound-assisted optimal extraction and thermal stability of betalains from colored quinoa (Chenopodium quinoa Willd) hulls. Ind. Crop. Prod. 2018, 111, 606–614. [Google Scholar] [CrossRef]
  69. Yuan, L.; Niu, H.; Yun, Y.; Tian, J.; Lao, F.; Liao, X.; Gao, Z.; Ren, D.; Zhou, L. Analysis of coloration characteristics of Tunisian soft-seed pomegranate arils based on transcriptome and metabolome. Food Chem. 2022, 370, 131270. [Google Scholar] [CrossRef] [PubMed]
  70. Polturak, G.; Heinig, U.; Grossman, N.; Battat, M.; Leshkowitz, D.; Malitsky, S.; Rogachev, I.; Aharoni, A. Transcriptome and Metabolic Profiling Provides Insights into Betalain Biosynthesis and Evolution in Mirabilis jalapa. Mol. Plant 2018, 11, 189–204. [Google Scholar] [CrossRef] [PubMed]
  71. Pucker, B.; Walker-Hale, N.; Dzurlic, J.; Yim, W.C.; Cushman, J.C.; Crum, A.; Yang, Y.; Brockington, S.F. Multiple mechanisms explain loss of anthocyanins from betalain-pigmented Caryophyllales, including repeated wholesale loss of a key anthocyanidin synthesis enzyme. New Phytol. 2023, 241, 471–489. [Google Scholar] [CrossRef]
  72. Lu, W.C.; Chan, Y.J.; Tseng, F.Y.; Chiang, P.Y.; Li, P.H. Production and Physicochemical Properties of Starch Isolated from Djulis (Chenopodium formosanum). Foods 2019, 8, 551. [Google Scholar] [CrossRef] [PubMed]
  73. Lai, J.-X.; Lin, F.-R.; Huang, P.; Guo, W.-Y.; Han, L.-B.; Zheng, Y.-Q. Seasonal variation of flavonoid metabolites in leaves of Liquidambar formosana ‘Nanlinhong’ trees revealed by UPLC-ESI–MS/MS. Braz. J. Bot. 2021, 44, 575–586. [Google Scholar] [CrossRef]
  74. Livak, K.J.; Schmittgen, T.D. Analysis of relative gene expression data using real-time quantitative PCR and the 2(-Delta Delta C(T)) Method. Methods 2001, 25, 402–408. [Google Scholar] [CrossRef] [PubMed]
Figure 1. Anthocyanin biosynthesis pathway. PAL: phenylalanine ammonia-lyase; C4H: cinnamate-4-hydroxylase; 4CL: 4-coumarate-CoA ligase; CHS: chalcone synthase; CHI: chalcone isomerase; F3H: flavanone 3-hydroxylase; F3′H: flavonoid 3′-hydroxylase; F3′5′H: flavonoid 3′,5′-hydroxylase; DFR: dihydroflavonol 4-reductase; ANS: anthocyanidin synthase; LDOX: leucoanthocyanidin dioxygenase; UFGT: flavonoid-glucosyl transferase; MT: methyltransferase; GT: glucosyltransferase; AT: acyltransferase.
Plants 14 00197 g001
Figure 2. Detection of anthocyanin content. (AG) Seven stages of spike development in djulis. The labels (AG) represent seven developmental phases, specifically from the full bloom stage to 15, 20, 25, 30, 35, and 40 days after pollination (DAP). (H) Line graph of changes in anthocyanin content in djulis spikes at different developmental stages.
Plants 14 00197 g002
Figure 3. Targeted metabolomics analysis. (A) Pie chart of anthocyanin full identification classification.by targeted metabolome. (B) Different anthocyanin quantities in different comparison combinations (C) Heatmap of O vs. G differential anthocyanin hierarchical clustering. (D) Heatmap of R vs. G differential anthocyanin hierarchical clustering.
Plants 14 00197 g003
Figure 4. Non-targeted metabolomics analysis. (A) PCA score plot in positive ion mode. (B) PCA score plot in negative ion mode. (C) The number of differential metabolites in each comparison combination under positive ion mode. (D) The number of differential metabolites in each comparison combination under negative ion mode.
Plants 14 00197 g004
Figure 5. Transcriptomics analysis. The red box in the figure represents the flavonoid biosynthesis. (A) Differential gene Wayne plots. (B) O vs. G KEGG enrichment scatter plot. (C) R vs. G KEGG enrichment scatter plot. (D) R vs. O KEGG enrichment scatter plot.
Plants 14 00197 g005
Figure 6. Heatmap of the correlation between differential genes and differential anthocyanin metabolites. (A) O versus G. (B) R versus G.
Plants 14 00197 g006
Figure 7. Line graph of real-time PCR analysis of anthocyanin biosynthesis-related genes in the spike of djulis. 1–4 represent the 20th, 30th, 35th, and 40th days after the end of the full flowering period, respectively. A B, and C represent three biological replicates. (A) CfCHS_1(Cf062520, chalcone synthase). (B) CfCHS_2(Cf001167, chalcone synthase). (C) CfCHS_3(Cf001178, chalcone synthase). (D) CfCHS_4(Cf062524, chalcone synthase). (E) CfCHS3_3(Cf076825, chalcone synthase 3). (F) CfCHI2_1(Cf054781, chalcone isomerase). (G) CfCHI2_2(Cf022835, chalcone isomerase). (H) CfF3H_2(Cf016292, flavanone 3-hydroxylase). (I) CfF3H_3(Cf040556, flavanone 3-hydroxylase). (J) CfCYP75B2_1(Cf034387, flavonoid 3′-monooxygenase). (K) CfCYP75B2_2(Cf058394, flavonoid 3′-monooxygenase). (L) CfCYP75A6_1(Cf006386, flavonoid 3′,5′-hydroxylase). (M) CfCYP75A6_2(Cf032051, flavonoid 3′,5′-hydroxylase). (N) CfDFRA(Cf074499, dihydroflavonol 4-reductase). (O) CfANS(Cf010560, anthocyanidin synthase). (P) CfLDOX(Cf061103, leucoanthocyanidin dioxygenase). (Q) CfUFGT_1(Cf015504, anthocyanidin 3-O-glucosyltransferase). (R) CfUFGT_3(Cf015507, anthocyanidin 3-O-glucosyltransferase). (S) Cf3GGT (Cf005087, anthocyanidin 3-O-glucoside 2″-O-glucosyltransferase).
Plants 14 00197 g007
Figure 8. Anthocyanin biosynthesis pathway in the spike of djulis. PAL: phenylalanine ammonialyase; C4H: cinnamate-4-hydroxylase; 4CL: 4-Coumarate-CoA ligase; CHS: chalcone synthase; CHI: chalcone isomerase; F3H: flavanone 3-hydroxylase; F3′H: flavonoid 3′-hydroxylase; F3’5’H: flavonoid 3’,5’-hydroxylase; DFR: dihydroflavonol 4-reductase; ANS: anthocyanidin synthase; LDOX: leucoanthocyanidin dioxygenase; UFGT: UDP-glucose flavonoid 3-O-glucosyl transferase; GT: glucosyltransferase.
Plants 14 00197 g008
Figure 9. Djulis in different color periods. (A) The spike of djulis during the green period before maturity. (B) The spike of djulis during the red period after maturity. (C) The spike of djulis during the orange period after maturity.
Plants 14 00197 g009
Table 1. Anthocyanin and flavonoid biosynthesis of putative unigenes involved in spike color variation.
Unigene_IdShort Gene NameFull Gene Name
Cf068225Cf4CL2_14-Coumarate-CoA ligase 2
Cf029168Cf4CL2_24-Coumarate-CoA ligase 2
Cf062520CfCHS_1Chalcone synthase
Cf001167CfCHS_2Chalcone synthase
Cf001178CfCHS_3Chalcone synthase
Cf062524CfCHS_4Chalcone synthase
Cf029768CfCHS_5Chalcone synthase
Cf028208CfCHS3_1Chalcone synthase 3
Cf046861CfCHS3_2Chalcone synthase 3
Cf076825CfCHS3_3Chalcone synthase 3
Cf001177CfCHS3_4Chalcone synthase 3
Cf019801CfCHI_1Chalcone-flavanone isomerase
Cf054781CfCHI2_1Chalcone isomerase
Cf022835CfCHI2_2Chalcone isomerase
Cf074806CfF3H_1Flavanone 3-hydroxylase
Cf016292CfF3H_2Flavanone 3-hydroxylase
Cf040556CfF3H_3Flavanone 3-hydroxylase
Cf034387CfCYP75B2_1Flavonoid 3′-monooxygenase
Cf058394CfCYP75B2_2Flavonoid 3′-monooxygenase
Cf006386CfCYP75A6_1Flavonoid 3′,5′-hydroxylase
Cf032051CfCYP75A6_2Flavonoid 3′,5′-hydroxylase
Cf074499CfDFRADihydroflavonol 4-reductase
Cf010560CfANSAnthocyanidin synthase
Cf061103CfLDOXLeucoanthocyanidin dioxygenase
Cf015504CfUFGT_1Anthocyanidin 3-O-glucosyltransferase
Cf015505CfUFGT_2Anthocyanidin 3-O-glucosyltransferase
Cf015507CfUFGT_3Anthocyanidin 3-O-glucosyltransferase
Cf005087Cf3GGTAnthocyanidin 3-O-glucoside 2″-O-glucosyltransferase
Disclaimer/Publisher’s Note: The statements, opinions and data contained in all publications are solely those of the individual author(s) and contributor(s) and not of MDPI and/or the editor(s). MDPI and/or the editor(s) disclaim responsibility for any injury to people or property resulting from any ideas, methods, instructions or products referred to in the content.

