Abstract
Rice (Oryza sativa), particularly the japonica subspecies, is a vital global food source but often suffers from short grain length and heat sensitivity, highlighting the need for genetic improvement. This study employed CRISPR/Cas9 technology to investigate the effects of Grain Size3 (GS3) gene editing in the japonica cultivar, ‘Nipponbare’. Successful GS3 editing increased grain size across stable T3 and T4 generations. Importantly, different GS3-edited lines, even when all targeted within exon 1, resulted in varied effects on grain length and other yield components. Transcriptomic analyses revealed unique gene expression profiles for each edited line, highlighting the fact that subtle GS3 mutations trigger diverse transcriptional cascades. While common differentially expressed genes (DEGs) were enriched in ethylene signaling and chitinase activity, line-specific KEGG analyses showed distinct pathway enrichments. Crucially, the CR-L5 line exhibited significantly enhanced heat tolerance at heading stage. Under high-temperature stress, CR-L5 maintained a higher relative seed setting rate and a 15% greater grain yield than the wild type. This enhanced thermotolerance in CR-L5 correlated with differing expressions of several wax biosynthesis and chitinase-related genes. Our study provides evidence that specific gs3 mutations can confer enhanced reproductive-stage thermotolerance, offering a strategy for breeding climate-resilient japonica rice with improved grain quality and yield under stress.
Keywords:
CRISPR/Cas9; GS3; japonica; grain size; heat tolerant; reproductive stage; chitinase-related genes 1. Introduction
Rice (Oryza sativa) is an important staple food globally, with over 90% of its cultivation and consumption concentrated in Asia [1,2]. Asian cultivated rice is classified into two geographically and genetically divergent subspecies: O. sativa ssp. japonica and O. sativa ssp. indica. The japonica subspecies is primarily cultivated in temperate regions at higher latitudes, such as northeastern China (Heilongjiang, Jilin, and Liaoning provinces), Japan, South Korea, California in the United States, and parts of southern Europe including Italy. In contrast, the indica subspecies is predominantly grown in subtropical and tropical regions at lower latitudes or altitudes, including South and Southeast Asia, particularly India, Bangladesh, Indonesia, and Thailand. This ecological separation has contributed to their distinct morphological, physiological, and genetic characteristics [3,4]. Among its diverse forms, the japonica subspecies holds particular significance. Japonica rice can be divided into two subgroups: temperate japonica and tropical japonica. Temperate japonica is more widely produced and consumed than tropical japonica. Many temperate japonica rice varieties are valued for their sticky texture and high grain quality, which are distinct from those of indica varieties. However, temperate japonica rice plants exhibit poor adaptability to tropical environments [5]. In general, japonica rice is highly sensitive to temperature variations. High temperatures, particularly during the reproductive stages (flowering and grain filling), can severely reduce yield and grain quality [6]. Due to this limitation, the production of temperate japonica rice has been very limited in tropical areas. Thus, it is crucial to develop new japonica cultivars that possess both high grain quality and resistance to high temperatures.
Nipponbare, a representative japonica cultivar, is critically important for rice genomics research, given its high-quality sequenced genome [7,8,9]. Furthermore, breeding efforts involving Nipponbare have successfully improved key agronomic traits like grain yield and quality [10,11]. However, a significant limitation of Nipponbare and many other temperate japonica varieties is their short grain length and susceptibility to high temperatures. This presents a challenge, as consumer preference strongly leans towards slender grain shapes, which are associated with higher-quality appearance [12,13]. Indeed, visual characteristics such as grain size, shape, and the presence of chalkiness profoundly influence consumer purchasing decisions [12].
Grain size is a primary determinant of grain weight, which directly impacts overall grain yield, alongside the number of panicles per plant and grains per panicle [14]. Decades of genetic research have illuminated the molecular basis of grain shape, identifying and cloning numerous genes and quantitative trait loci (QTL) that govern this trait [15]. Key genes controlling grain length include GS3, qGL3, GL7/GW7, GL4, TGW3/GL3.3, GS9, GL10, GSW3.1 and GSW3.2 [16,17,18,19,20,21,22,23,24,25]. Among these, GS3 (Grain Size3) is particularly significant due to its consistent role in enhancing grain length when mutated, making it an attractive target for yield improvement [26].
The GS3 locus on chromosome 3 has been consistently identified as a major quantitative trait locus (QTL) governing both grain weight and length, acting as a negative regulator of grain and organ size [16,26]. A pivotal single nucleotide polymorphism (SNP) in the second exon of GS3 distinguishes long-grain varieties (TGA, a termination codon) from small-grain varieties (TGC, a cysteine codon) [27]. Extensive research confirms that the gs3 allele and this C/A SNP are functional mutations leading to longer grains [27,28]. Recent advancements in CRISPR/Cas9-mediated gene editing have allowed for precise manipulation of GS3. For example, editing targets in the first and fifth exons of GS3 increased panicle length and grain size [29]. While simultaneous editing of GS3 and GL3.1 in Nipponbare led to longer grains, it also reduced grain number and overall yield [30]. Conversely, knocking out GS3 in the first exon enhanced both grain length and yield per plant [31]. These findings collectively demonstrate that manipulating GS3 can consistently increase grain size, a desirable trait for yield. However, the exact impact of gs3 knockout on other yield components can vary significantly, depending on the rice cultivar’s genetic background [13].
Beyond grain traits, climate change, particularly rising global temperatures, poses a severe and growing threat to rice yield and quality worldwide [32]. Therefore, identifying genetic resources that confer both improved yield and enhanced heat tolerance in a model japonica variety like Nipponbare is highly relevant and practical. Such discoveries could provide crucial solutions for adapting japonica rice cultivation to a warming climate. Intriguingly, recent studies have investigated the molecular mechanisms of thermotolerance involving natural variations in the G-protein γ subunits, GS3/TT2, in African and Asian rice. These studies reported that under heat stress, GS3 promotes an increase in cytosolic Ca2+ levels, fostering downstream interactions between calmodulin and the transcription factor SCT1. This interaction suppresses OsWR2 gene expression, leading to reduced cuticular wax content and increased thermosensitivity. Conversely, loss-of-function gs3 alleles disrupt this process, preventing Ca2+ accumulation and CaM–SCT1 interaction, thereby inducing OsWR2 gene expression and promoting cuticular wax synthesis [33,34]. These findings suggest that gs3 could be a valuable target for improving rice yield under high-temperature conditions. Indeed, [13] recently demonstrated that knocking out the GS3 gene improved the thermotolerance of Geng/Japonica (GJ) rice varieties at the seedling stage under a hydroponic culture solution. While [13] recently reported improved seedling thermotolerance in broader Geng/Japonica varieties, the precise, integrated impact of GS3 knockout on both desirable grain morphology and critical reproductive-stage yield components under heat stress in a genetically defined model japonica cultivar like Nipponbare remains a significant knowledge gap. Understanding this interplay is vital for climate-resilient rice breeding.
Against this background, our study provides critical advancement by investigating the pleiotropic effects of gs3 mutation using CRISPR/Cas9 technology in the highly characterized japonica model cultivar, Nipponbare. Building on preliminary observations of increased grain length in mutant transgenic lines, our research aimed to quantitatively assess the comprehensive effects of gs3 mutation on grain length and vital yield components across stable T3 and T4 generations and elucidate the underlying molecular mechanisms by conducting in-depth transcriptomic analyses to identify affected genes and pathways. Finally, we determined the direct impact of high-temperature treatment on the yield and yield components of gs3 mutants in Nipponbare at agriculturally relevant growth stages, a critical area not fully addressed by previous work.
2. Results
2.1. Effects of GS3 Editing on Grain Length and Yield Components
To investigate the effect of GS3 editing on yield components, a CRISPR/Cas9 construct targeting GS3 was introduced into ‘Nipponbare’ (NB). Grain lengths of T0 transgenic plants were measured, and those exhibiting longer grains than NB were self-pollinated to obtain seeds. The resulting seeds were planted, and transgenic plants were selected and advanced by self-pollination up to the T3 generation.
Seven T3 GS3-edited plants from different families were subjected to sequencing. All selected transgenic plants displayed distinct mutations within the GS3 gene (Figure 1A). Regarding agronomic traits, all transgenic lines showed a significant increase in grain length, ranging from 8.37 mm to 9.18 mm, compared to NB’s grain length of 7.30 mm (Figure 1B,C).
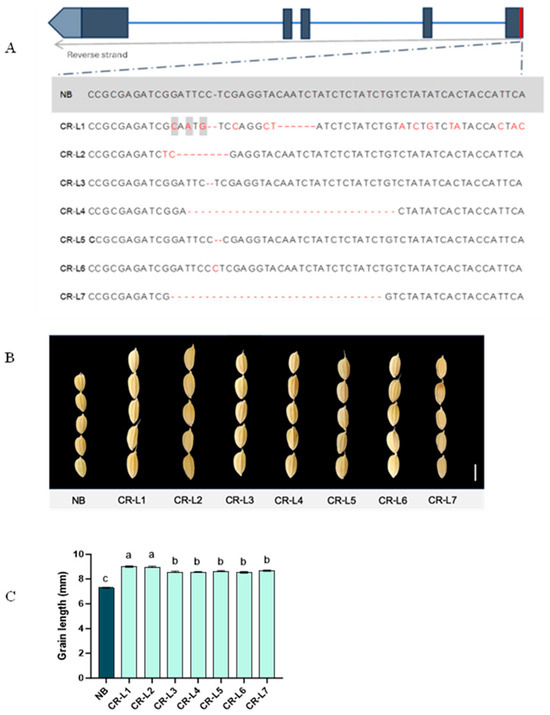
Figure 1.
GS3 sequences and effects of GS3 on grain length. (A) Sequence comparison between wild-type Nipponbare (NB) and seven T3 GS3-edited plants that exhibit longer grain lengths. The wild-type sequence is highlighted in gray, while CR-L1 to CR-L7 represent the seven T3 GS3-edited lines. Red fonts represent the mismatch bases; hyphens represent deletion. (B) Representative images of grain shape from wild type and their GS3-edited plants. The scale bar represents 5 mm. (C) Grain length measurements for wild type and GS3-edited plants. Data are presented as mean ± standard error (SE), from 14–17 plants for edited lines and 10 plants for the NB control line. Different letters above the bars indicate significant differences (p < 0.05), determined by a Tukey’s multiple range test.
Regarding the effects of GS3 editing on plant height, GS3 editing had a varied impact on plant height. While some of the edited plants showed significant differences, others were not significantly different from the non-edited control (NB). Specifically, CR-L1, CR-L2, and CR-L3 were significantly shorter than CR-L5 and CR-L7, though most of these lines showed no significant difference in height when compared to NB (Figure 2A,B).
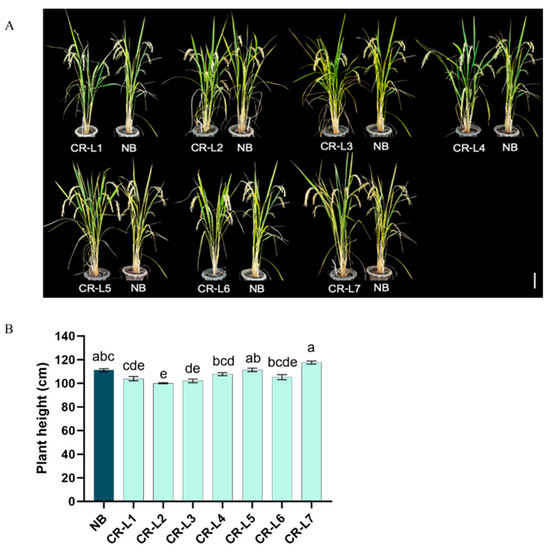
Figure 2.
Effects of GS3 Editing on Plant Height. (A) Representative images of wild-type Nipponbare (NB) and GS3-edited plants, Scale bar = 20 cm. (B). Plant height of wild-type Nipponbare (NB) and GS3-edited plants. Data are presented as mean ± standard error (SE), from 14–17 plants. Different letters indicate significant differences (p < 0.05) based on a Tukey’s multiple range test.
Significant differences in yield components were found between the GS3-edited plants and the non-edited control (NB) (Figure 3A–H). Editing the GS3 gene led to a significant increase in panicle length for line CR-L7, compared to NB (Figure 3A,C). This line’s panicle length was also longer than all other tested lines, except for CR-L4.
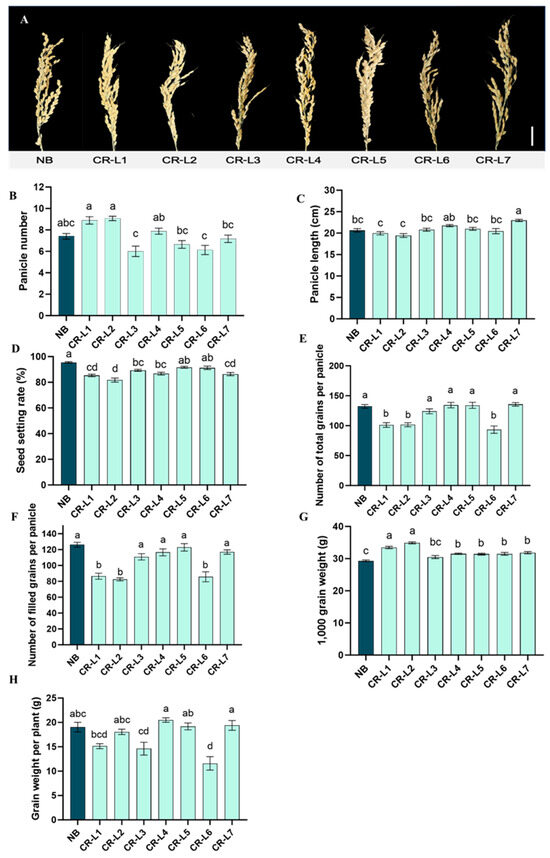
Figure 3.
Effects of GS3 on yield-related traits. (A) Representative images of panicles of wild-type Nipponbare (NB) and GS3-edited lines. (B) Panicle number. (C) Panicle length. (D) Seed setting rate (%). (E) The number of filled grains per panicle. (F) The number of total grains per panicle. (G) 1000-grain weight. (H) Grain weight per plant. Scale bar = 20 cm. Data are presented as mean ± standard error (SE), from 14–17 plants for edited lines and 10 plants for NB control line. Different letters indicate significant differences (p < 0.05) based on a Tukey’s multiple range test.
Regarding panicle number, lines CR-L1 and CR-L2 had significantly more panicles than CR-L3, CR-L5, CR-L6, and CR-L7, but none of the edited lines differed significantly from NB (Figure 3B).
Conversely, all tested GS3-edited lines showed no significant positive effect on seed setting rate, the number of filled grains per panicle, or the number of total grains per panicle (Figure 3D–F). In fact, lines CR-L1, CR-L2, and CR-L7 had significantly lower seed setting rates than CR-L5, CR-L6, and NB (Figure 3D). Additionally, CR-L1, CR-L2, and CR-L6 had fewer filled and total grains per panicle than most other lines and NB (Figure 3E,F).
Notably, the editing had a strong positive effect on 1000-grain weight, which was significantly increased in all edited lines except CR-L3, compared to NB (Figure 3G). Despite this, there was no significant positive effect on grain weight per plant between the edited lines and NB, although CR-L4 CR-L5 and CR-L7 did have higher grain weight per plant than NB (Figure 3H).
2.2. Identification of DEGs Between Wild-Type and GS3-Edited Lines and Prediction of Their Functions
To further examine expression changes between wild type and GS3-edited lines with potential phenotypic improvements, five GS3-edited lines, including CR-L1, CR-L2, CR-L4, CR-L5, and CR-L6, were selected. Differentially expressed genes (DEGs) were identified in comparison with Nipponbare (NB). The results showed 3926 DEGs in CR-L1, 4190 in CR-L2, 4476 in CR-L4, 5411 in CR-L5, and 6110 in CR-L6, respectively (Figure 4A).
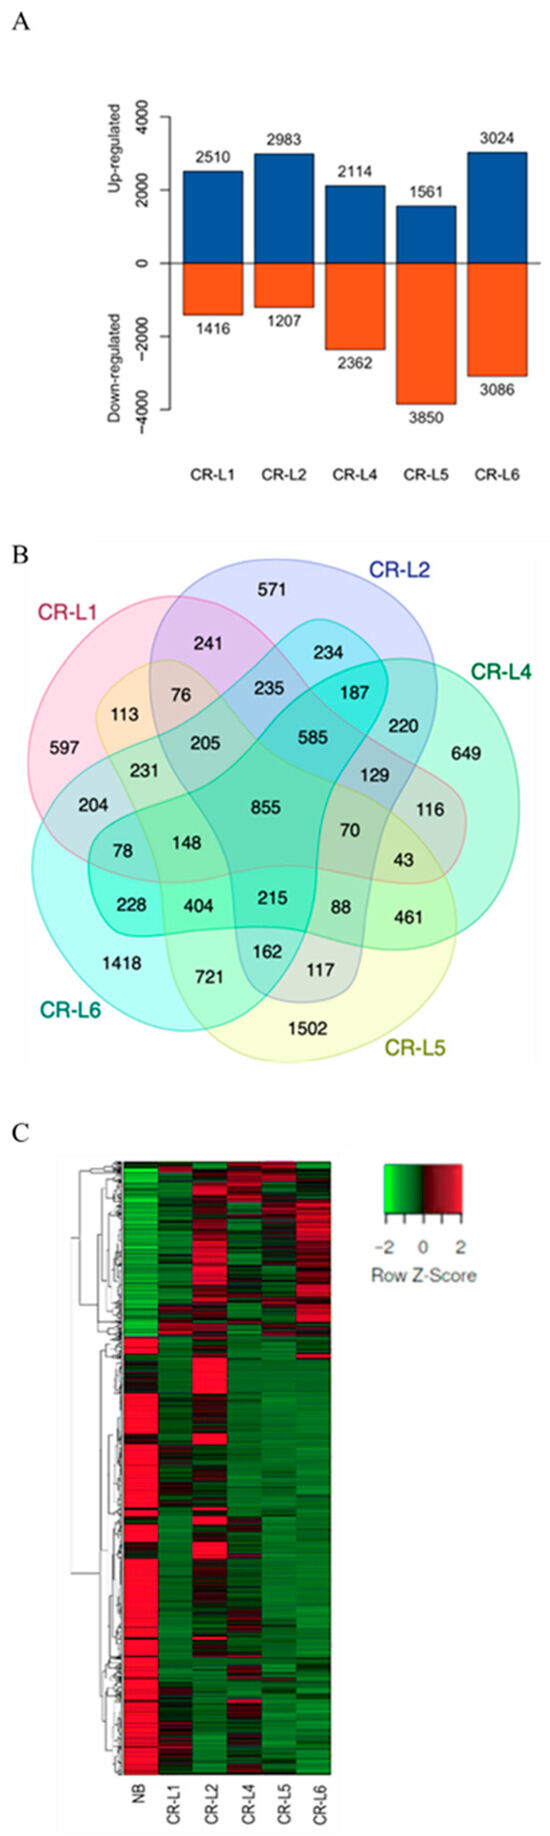
Figure 4.
Transcriptome analysis. Differentially expressed genes (DEGs) in each GS3-edited line were identified by comparison with the wild-type Nipponbare (NB). (A) The number of upregulated and downregulated DEGs in each GS3-edited line. (B) Venn diagram presenting co-expression of DEGs expressed in each sample, with overlapping regions indicating the number of genes expressed in all samples. (C) Hierarchical clustering of DEGs expressed in wild type (NB) and their GS3-edited lines, based on FPKM values. Blue and red represent upregulated and downregulated DEGs, respectively, and the numbers on the columns indicate the count of DEGs. Green represents lower expression, while red represents higher expression. Columns indicate individual experiments, and rows indicate DEGs.
A total of 855 DEGs were commonly expressed in all samples, while 597, 571, 649, 1502, and 1418 genes were specifically expressed in CR-L1, CR-L2, CR-L4, CR-L5, and CR-L6, respectively (Figure 4B). These results indicated that variability in gene expression exists between NB and each of the GS3-edited lines (Figure 4C).
To predict the functions of both the 855 common DEGs and the specific DEGs in each GS3-edited line, Gene Ontology (GO) and Kyoto Encyclopedia of Genes and Genomes (KEGG) analyses were performed. The top ten significant GO terms and KEGG enrichments were collected based on a p-value (p-adj) ≤ 0.05 and a false discovery rate (FDR) ≤ 0.05.
GO enrichment analysis indicated that the 855 common DEGs were significantly enriched in biological processes (BPs) related to the ethylene hormone, including the ethylene-activated signaling pathway, cellular response to ethylene stimulus, and response to ethylene (Figure S2A). For cellular component (CC), the most enriched term was apoplast, which is associated with programmed cell death (Figure S2B). In terms of molecular function (MF), the common DEGs showed enrichment in chitinase activity (Figure S2C).
For the GO analysis of specific DEGs within each CR-L line, distinct enrichments were observed in BP. Both CR-L1 and CR-L2 showed similar enrichments for “response to water deprivation” and “water response,” suggesting a role in water stress pathways. In contrast, “hydrogen peroxide catabolic process” and “regulation of transcription DNA-templated” were enriched in both CR-L4 and CR-L5 (Figure S3A–D), indicating involvement in oxidative stress and gene regulation. The “regulation of macromolecule biosynthetic process” was uniquely identified in the CR-L6 line (Figure S3E). Regarding CC, “apoplast” and “extracellular region” were enriched in CR-L1, CR-L2, and CR-L4. However, in CR-L5, “anchored components of membrane” were enriched, while “plant-type cell wall” components were enriched in CR-L6 (Figure S4). For MF, chitinase activity was the most highly enriched term across all CR-L lines (Figure S5), which suggests a broad involvement of chitinases in the responses triggered by GS3 editing.
KEGG pathway analyses revealed that 11 of the 855 common DEGs were significantly enriched in pathways related to amino sugar and nucleotide sugar metabolism (Table 1). Among these eleven genes, six showed particularly high expression in the CR-L5 line: Os01g0660200 (Acidic class III chitinase OsChib3a precursor), Os05g0247100 (similar to Glycosyl hydrolases family 18), Os11g0462100 (Glycoside hydrolase, family 18 protein), Os11g0700900 (Glycoside hydrolase, subgroup, catalytic core domain-containing protein), Os11g0701400 (Chitinase (EC 3.2.1.14) III C10150-rice), and Os11g0702100 (similar to Class III chitinase homologue). Additionally, Os07g0446800 (similar to Hexokinase) and Os11g0462100 (Glycoside hydrolase, family 18 protein) exhibited high expression across all CR-L lines when compared to Nipponbare (NB) (Table 1).

Table 1.
Eleven common differentially expressed genes (DEGs) in all CR-L lines in amino sugar and nucleotide sugar metabolism and their expression value in RNA seq.
The expression profiles of genes assigned to the highest fold-enrichment pathways were further analyzed for each GS3-edited CR-L line. The highest fold enrichment of each CR-L line was 11 genes assigned to osa00280 (valine, leucine, and isoleucine degradation) in the CR-L1 line; 9 genes assigned to osa00904 (diterpenoid biosynthesis) in the CR-L2 line; 49 genes assigned to osa00940 (phenylpropanoid biosynthesis) in the CR-L4 line; and 11 genes each assigned to osa00073 (cutin, suberin, and wax biosynthesis) in both the CR-L5 and CR-L6 lines (Figure 5; Supplementary Table S1). All of the genes in CR-L1 were upregulated. A similar trend was observed in CR-L2, except for Os06g011000, which was downregulated. Several of these genes exhibited strong upregulation. Interestingly, in CR-L4, most of the genes belonged to the class III peroxidase family and displayed both strong up- and downregulation. For CR-L5 and CR-L6, the DEGs were enriched in the same pathway; however, there were notable differences. Os04g0511200 (EF-hand, abscisic acid–responsive 27-kDa protein) was highly upregulated in CR-L6, but downregulated in CR-L5. Additionally, Os06g0254600 was included in the most highly enriched pathway in CR-L5 but not in CR-L6, whereas Os03g0167600 was present in the most highly enriched pathway in CR-L6 but not in CR-L5. Notably, most of the genes in CR-L5 and CR-L6 were downregulated (Supplementary Table S1).
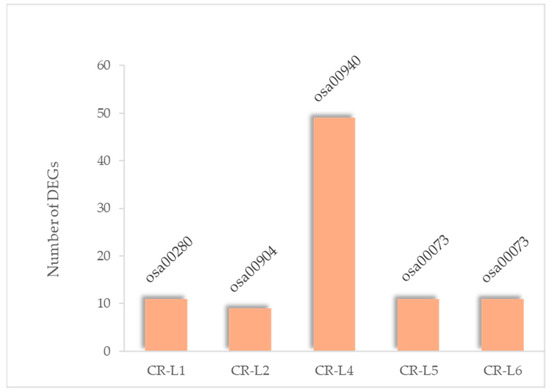
Figure 5.
Highest fold-enrichment KEGG pathways of DEGs identified in each CR-L line.
2.3. Effects of GS3 on Yield and Yield Components Under High-Temperature Treatment
Wild-type Nipponbare and four selected T4 GS3-edited lines including CR-L2, CR-L5, CR-L6 and CR-L7 were used to assess the effects of high temperature (38/30 °C for 7 days compared to normal condition, 28/22 °C) on yield and yield components using artificial climatic chambers. The control and treatment groups were grown under natural conditions. The high-temperature treatment was applied for 7 days, beginning at the heading stage.
Under normal conditions, the number of panicles per pot, number of filled grains per plant, total grain number per plant, and seed setting rate in all GS3-edited lines were not higher than those in the wild-type Nipponbare. However, the GS3-edited lines showed increased grain number per panicle and 1000-grain weight, though not all differences were statistically significant. In terms of grain yield per pot, CR-L2 and CR-L5 outperformed the wild type, while CR-L6 and CR-L7 yielded less (Table 2).
Table 2.
Effects of high-temperature treatment on yield and yield components of GS3-edited lines.
Under high-temperature stress, panicle number per pot, grain number per panicle, and total grain number per plant were not significantly affected in any tested line. However, filled grain number per plant, seed setting rate, and grain yield per pot declined across all tested lines. Notably, CR-L5 exhibited a higher seed setting rate than the wild type under stress, although this difference was not statistically significant. Notably, the relative seed setting rate of CR-L5 (58.81%) was significantly higher than that of the wild type and the other edited lines. Moreover, CR-L5 showed approximately 15% higher grain yield than the wild type, whereas the other GS3-edited lines yielded less. Interestingly, under high-temperature stress, all GS3-edited lines had significantly higher grain number per panicle than the wild type. Additionally, CR-L7 demonstrated a significantly greater 1000-grain weight than the wild type (Table 2).
3. Discussion
3.1. The Pleiotropic and Allele-Specific Effects of GS3 Mutations on Agronomic Traits
Consumer preference for elongated, slender rice grains significantly influences market value and purchasing decisions [12]. Our study confirms the well-established role of the GS3 gene as a potent negative regulator of grain size [16,26,31]. All seven independent CRISPR/Cas9-edited T3 lines, each carrying a distinct mutation in GS3, exhibited a significant increase in grain length and 1000-grain weight compared to the wild-type Nipponbare (NB). This finding aligns perfectly with established knowledge and highlights the effectiveness of GS3 as a target for breeding programs aimed at improving grain appearance, a trait that significantly influences consumer preference and market value [12,13,31].
However, a key takeaway from our research is the extensive phenotypic diversity observed among these edited lines, even though they all have mutations within the same exon. The results showed that the main effects of GS3 editing on grain length and grain weight were highly significant. Notably, GS3 editing may exert minor effects on other phenotypic variations. This reveals that a specific mutation can have significant pleiotropic effects on other important agronomic traits. For example, while all lines had longer grains, their plant height varied: CR-L1, CR-L2, and CR-L3 were significantly shorter than CR-L5 and CR-L7. This demonstrates that different mutations can differentially impact plant architecture. While off-target effects could not be completely ruled out, off-target effects were minimized by designing gRNAs with unique target sequences and using a high-fidelity Cas9 variant. Potential off-target sites were further assessed by in silico prediction. Therefore, the observed differences are most likely attributable to GS3 editing. Indeed, the results showed that each line with distinct sequence mutations exhibited corresponding differences in phenotypes and gene expression.
It should be noted that in this study, sequencing validation was performed only at the GS3 target region. Although additional sequencing of predicted off-target sites or whole-genome resequencing would provide further confirmation, such analyses were beyond the scope of the present work. Importantly, some published CRISPR/Cas9 studies in rice have adopted a similar approach of validating only the target-site mutations [35,36,37]. Future research incorporating more extensive off-target assessment, including whole-genome sequencing, will be valuable to further strengthen confidence in the precision of GS3 editing.
This allele-specific effect was even more evident in yield components. Panicle length increased significantly only in line CR-L7, while panicle number increased in CR-L1 and CR-L2. This suggests that the specific mutations in these lines may uniquely affect panicle development, a trait not consistently altered across all edited lines. This variability, depending on the specific gs3 allele and genetic background, has been previously noted [13].
Crucially, the increase in grain size did not consistently translate to higher overall yield under normal conditions. In fact, we observed a potential trade-off, as seed setting rate, the number of filled grains per panicle, and the number of total grains per panicle were not positively affected across all lines, and were even significantly lower in lines like CR-L1 and CR-L2 compared to the wild type and other edited lines. Despite the universal increase in 1000-grain weight in most lines, grain weight per plant was not significantly higher than NB, except for CR-L4, CR-L5 and CR-L7. This underscores the need to characterize specific mutant alleles to avoid negative pleiotropic effects on yield, a finding consistent with prior work by [30].
3.2. Molecular Basis of Phenotypic Variation: Insights from Gene Expression
To unravel the molecular mechanisms underlying these diverse phenotypes, we performed transcriptome analysis on five selected edited lines (CR-L1, CR-L2, CR-L4, CR-L5, and CR-L6). CR-L7 was excluded because it carried sequence mutations very similar to those of CR-L4, and thus was not expected to provide additional transcriptomic insights. The results were that each line showed a distinct set of differentially expressed genes (DEGs), with the number of DEGs ranging from 3926 in CR-L1 to 6110 in CR-L6. This variability in gene-expression profiles directly correlates with the phenotypic differences observed among the lines, and demonstrates that even subtle mutations within GS3 can trigger unique downstream transcriptional cascades.
GO analysis provided further insights into these distinct genetic responses. While a core set of 855 common DEGs showed enrichment in pathways related to ethylene signaling and chitinase activity across all lines, the line-specific DEGs revealed unique functional enrichments. For example, CR-L1 and CR-L2 showed enrichment in stress pathways related to water deprivation. In contrast, CR-L4 and CR-L5 showed enrichment in processes related to oxidative stress and transcription regulation. These findings suggest that the specific mutation in each line triggers a unique compensatory response in gene expression, leading to their distinct phenotypes.
The KEGG analysis showed that 11 out of the 855 common DEGs were significantly enriched in pathways related to amino-sugar and nucleotide-sugar metabolism, including genes associated with chitinase and its precursor. However, the KEGG analysis of DEGs specific for each line further highlighted the specificity, with each line showing the highest enrichment in different metabolic pathways. For example, CR-L1 showed enrichment in amino acid degradation, CR-L2 in diterpenoid biosynthesis, and CR-L4 in phenylpropanoid biosynthesis. Most notably, both CR-L5 and CR-L6 showed a significant enrichment in the cutin, suberin, and wax biosynthesis pathway, which is associated with heat tolerance. This finding is particularly interesting, given recent reports that link GS3 mutations to enhanced thermotolerance through increased cuticular wax content [13,33,34]. Despite this shared enrichment, differences in gene numbers and expression levels within this pathway between CR-L5 and CR-L6 may explain their varying heat tolerance. Furthermore, among the eleven common DEGs, six exhibited the highest expression in CR-L5, with three of these being chitinase-related genes. The elevated expression of chitinase-related genes in CR-L5 suggests a potential link to its observed phenotypes. Accordingly, although the primary function of chitinase in rice is recognized for biotic stress defense, there are indications and broader plant studies suggesting its involvement in abiotic stress responses, including heat [38,39].
While our transcriptome analysis provided valuable insights into allele-specific expression patterns and enriched pathways, we acknowledge that additional statistical validation—such as Pearson correlation and principal component analyses—would further strengthen the assessment of sample reliability and clustering quality. Due to current constraints, these analyses were not performed in the present study. Nevertheless, the clear and biologically meaningful differences observed among the edited lines, together with the consistency between transcriptomic profiles and phenotypic outcomes, support the robustness of our findings. Future studies incorporating correlation and clustering analyses will be valuable to confirm and extend these interpretations.
3.3. Allele-Specific Thermotolerance at the Reproductive Stage
Under normal conditions, our results from T3 and T4 generations confirm the expected function of GS3 editing in increasing grain size [13,31]. The most significant and novel finding of our research, however, lies in the differential response of these edited lines to high-temperature stress during the crucial heading stage—an agriculturally vital and heat-sensitive developmental period [6]. While a general decline in yield components was observed across all lines under heat stress, line CR-L5 exhibited a significantly higher relative seed setting rate and a 15% higher grain yield per pot than the wild-type Nipponbare. This superior performance was not observed in the other edited lines (CR-L2, CR-L6, and CR-L7), which all yielded less than the wild type. This result provides strong genetic evidence that the specific gs3 mutation in CR-L5 confers enhanced thermotolerance at the reproductive stage. This is a crucial distinction from previous studies that focused on seedling thermotolerance [13]. This result perfectly aligns with our gene expression analysis, which showed CR-L5 and CR-L6 were specifically enriched for pathways involved in wax biosynthesis, a known contributor to heat stress tolerance [33]. While both lines showed this enrichment, CR-L5’s superior phenotype suggests its unique mutation and subsequent gene expression profile may be more effective in enhancing thermotolerance. Specifically, the differing expressions of several wax-biosynthesis and chitinase-related genes in CR-L5 may directly contribute to its superior performance, highlighting a powerful link between a specific gene mutation, its transcriptional consequences, and a desirable agronomic trait under stress.
4. Materials and Methods
4.1. Plant Materials
Wild-type Oryza sativa L. ssp. japonica ‘Nipponbare’ served as the genetic background for GS3 gene editing. Transgenic plants were cultivated in pots within a greenhouse at the National Science and Technology Development Agency, Pathum Thani Province, Thailand, up to the T3 generation. In each generation, 20 plants per family were grown and self-pollinated. Transgenic lines exhibiting longer grains than ‘Nipponbare’ were selected for advancement. From the T3 generation, seven GS3-edited lines with elongated grains were chosen for assessing yield and yield components under greenhouse conditions, as well as for transcriptome analysis. T4 plants derived from these seven selected T3 lines were subsequently subjected to high-temperature treatment in artificial climatic chambers.
4.2. Construction of Vectors and Plant Transformation
To produce the GS3 gene editing, one pair of specific target primers near the 5′ of GS3 gene location were selected to generate CRSIPR/Cas9 vectors. The specific primers were designed using the web-based tool (https://crispr.cos.uni-heidelberg.de/index.html, accessed on 5 July 2019). The PAM sequence was selected within the first exon of the GS3 gene. Two target adaptors were first ligated into the pYLgRNA-OsU6a vector, respectively, and then connected into the pYLCRISPR/Cas9-MH vector. The detailed method of vector construction was described previously [40]. The final construct vector was transformed into Agrobacterium tumefaciens strain EHA105 by electroporation. Transgenic plants were generated by the rice transformation, using the method described preciously [41]. The GS3 gene-edited lines were analyzed by the Sanger sequencing (BGI, Shenzhen, China) using the specific primers of GS3C-F1/R1. The primers were created using the sequences located at 400 base pairs before and after the specific target site (Table S1).
4.3. Assessment of Yields and Yield Components of T3 GS3-Edited Lines
To assess yield and yield components, wild-type ‘Nipponbare’ and T3 GS3-edited lines were cultivated in an air-conditioned greenhouse (28 ± 5 °C) with supplemental lighting on cloudy days. These plants were grown individually in pots at the National Center for Genetic Engineering and Biotechnology, part of the National Science and Technology Development Agency in Pathum Thani Province, Thailand. Planting started on 21 December 2021. For each line, 20 plants were grown in individual pots. From each T3 line, 14–17 plants were used to determine yields and yield components. This assessment took place 45 days after heading, following the protocols established by [42].
4.4. Transcriptome Analysis
A transcriptome assay was performed on wild-type ‘Nipponbare’ and their T3 GS3-edited lines to identify downstream genes of GS3 involved in regulating grain size, grain quality, and thermotolerance. Total RNA was extracted from young panicles (2–4 cm) at the booting stage of both wild type and GS3-edited lines. For each line, three biological replicates were prepared from nine young panicles (three panicles per plant), using the RNeasy Plant Mini Kit (QIAGEN, Darmstadt, Germany), and subsequently pooled. The resulting libraries were sequenced using the Illumina HiSeq™ 2000 platform at Novogene Co., Ltd. (Beijing, China).
Raw sequence data have been deposited in the NCBI database under accession number PRJNA1308765. High-quality paired-end reads were mapped to the Nipponbare reference genome (IRGSP1.0) using HISAT2 [43]. Gene expression levels were calculated as Fragments Per Kilobase of transcript per Million mapped reads (FPKM) values. Differentially expressed genes (DEGs) between wild type and GS3-edited lines were analyzed using the EdgeR (version 4.4.1) R package. The analysis employed TMM (Trimmed Mean of M-values) normalization, a negative binomial distribution model, and a cut-off for DEGs set at a ∣log2(Fold change)∣ ≥ 1 and a p-value ≤ 0.05 [44]. DEGs were annotated for Gene Ontology (GO) terms, specifically in Biological Processes (BPs), Cellular Components (CCs), and Molecular Functions (MFs), with a corrected p-value ≤ 0.05 and a False Discovery Rate (FDR) ≤ 0.05. Kyoto Encyclopedia of Genes and Genomes (KEGG) pathway analysis was conducted using ShinyGO v0.75 [45].
4.5. High-Temperature Treatment Experiment
A high-temperature treatment experiment was conducted using artificial climatic chambers. Rice seeds were sown on 15 June 2024 and transplanted on 6 July 2024. Compound fertilizer was applied to the pots one day before transplanting the seedlings. Seedlings were transplanted into plastic buckets (two seedlings per bucket), with nine buckets (eighteen plants) used for each line. Each bucket contained 11 kg of dry bluish soil sourced from the local field. The soil composition was as follows: organic matter 36.5 g/kg, total nitrogen 2.75 g/kg, total phosphorus 0.63 g/kg, total potassium 20.3 g/kg, alkali-hydrolyzed nitrogen 236 mg/kg, ammonium nitrogen 9.6 mg/kg, available phosphorus 24.2 mg/kg, and available potassium 62 mg/kg. The soil pH was 6.5.
Before initiating the heat treatment, both control and treatment groups were grown under natural conditions. The high-temperature treatment started at the beginning of the heading stage of rice. Two temperature treatments were set: (1) control (CK), with an average temperature of 28/22 °C; and (2) high-temperature treatment, with an average temperature controlled at 38/30 °C for 7 days. After the seven-day heat treatment, both groups were returned to a normal environment until maturity. Before relocating the plants, panicles that had completed flowering were tagged, and only these tagged panicles were harvested upon maturity. The relative seed setting rate was then used to evaluate the heat resistance of the rice varieties.
4.6. Statistical Analysis
Statistical analysis was performed to compare traits between edited lines and the Nipponbare control line. Significant differences were assessed using one-way ANOVA (SPSS 17.0 software) followed by Tukey’s test for multiple comparisons. For clarity, statistically significant differences are indicated with different letter designations.
5. Conclusions
Our study demonstrates that CRISPR/Cas9-mediated editing of GS3 consistently increases grain size, and the specific mutation generated can lead to variable and unpredictable pleiotropic effects on other agronomic traits. We identified a gs3 allele in the CR-L5 line that confers superior reproductive-stage thermotolerance, resulting in significantly higher grain yield under heat stress. Transcriptomic analysis revealed differential expression of key genes, including those involved in wax biosynthesis and chitinase activity, which may underline this advantage. Although we did not perform additional sequencing to identify potential off-target mutations, our results provide genetic evidence that a specific gs3 allele can enhance thermotolerance. These findings highlight the need for allele-specific characterization when using genome editing and provide a framework for developing high-yielding, heat-resilient japonica rice varieties through precise gene-editing strategies.
Supplementary Materials
The following supporting information can be downloaded at: https://www.mdpi.com/article/10.3390/plants14182897/s1, Figure S1: Target sites and adjacent genomic sequences of GS3. Figure S2: The GO analysis of 855 common DEGs of all tested CR-L lines. Figure S3: The GO analysis of DEGs specific to each GS3-edited line assigned to the biological process. Figure S4: The GO analysis of DEGs specific to each GS3-edited line assigned to the cellular component. Figure S5: The GO analysis of DEGs specific to each GS3-edited line assigned to molecular function. Figure S6: The KEGG analysis of DEGs specific to each GS3-edited line assigned to molecular function. Table S1: The highest fold enrichment of DEGs in each CR-L line assigned to a pathway using Kyoto Encyclopedia of Genes and Genomes (KEGG) pathway database.
Author Contributions
Y.Q., funding acquisition, investigation, methodology, writing—original draft. N.S., K.T. and S.C., investigation, methodology. L.W., data analysis. A.M., conceptualization, writing—original draft, writing—review and editing, supervision. All authors have read and agreed to the published version of the manuscript.
Funding
This work was supported by the Project of the Science and Technology Department of Zhejiang Province, China (Grant Number 2021C02063-2) and the ZAAS Fund for International Cooperation.
Data Availability Statement
Data will be made available on request. During the preparation of this work, the authors used Gemini (Gemini 2.5 Flash) and ChatGPT (GPT-4 and GPT-5 versions by OpenAI) in the writing process to improve the readability and language of the manuscript. After using this tool/service, the authors reviewed and edited the content as needed and take full responsibility for the content of the published article.
Acknowledgments
The authors would like to thank Kanokwan Kaewmungkun for her contribution to data collection and a preliminary draft of the manuscript. We are grateful to Suriyan Cha-um for providing access to the facility for growing transgenic plants.
Conflicts of Interest
The authors declare no conflicts of interest.
References
- Khush, G.S. Origin, dispersal, cultivation and variation of rice. Plant Mol. Biol. 1997, 35, 25–34. [Google Scholar]
- Cordero-Lara, K.I. Temperate japonica rice (Oryza sativa L.) breeding: History, present and future challenges. Chil. J. Agric. Res. 2020, 80, 303–314. [Google Scholar] [CrossRef]
- Wang, Z.; Cheng, D.; Fan, C.; Zhang, C.; Zhang, C.; Liu, Z. Cell type-specific differentiation between indica and japonica rice root tip responses to different environments based on single-cell RNA sequencing. Front. Genet. 2021, 12, 659500. [Google Scholar] [CrossRef] [PubMed]
- Hori, K.; Suzuki, K.; Ishikawa, H.; Nonoue, Y.; Nagata, K.; Fukuoka, S.; Tanaka, J. Genomic Regions Involved in Differences in Eating and Cooking Quality Other than Wx and Alk Genes between indica and japonica Rice Cultivars. Rice 2021, 14, 8. [Google Scholar] [CrossRef] [PubMed]
- Pacleb, M.; Jeong, O.-Y.; Lee, J.-S.; Padolina, T.; Braceros, R.; Pautin, L.; Torollo, G.; Sana, E.E.; Del-Amen, J.Y.; Baek, M.-K.; et al. Breeding Temperate Japonica Rice Varieties Adaptable to Tropical Regions: Progress and Prospects. Agronomy 2021, 11, 2253. [Google Scholar] [CrossRef]
- Nevame, A.Y.M.; Emon, R.M.; Malek, M.A.; Hasan, M.M.; Alam, M.A.; Muharam, F.M.; Aslani, F.; Rafii, M.Y.; Ismail, M.R. Relationship between high temperature and formation of chalkiness and their effects on quality of rice. Biomed. Res. Int. 2018, 2018, 1653721. [Google Scholar] [CrossRef]
- Kawahara, Y.; de la Bastide, M.; Hamilton, J.P.; Kanamori, H.; McCombie, W.R.; Ouyang, S.; Schwartz, D.C.; Tanaka, T.; Wu, J.; Zhou, S.; et al. Improvement of the Oryza sativa Nipponbare reference genome using next generation sequence and optical map data. Rice 2013, 6, 4. [Google Scholar] [CrossRef]
- Arai-Kichise, Y.; Shiwa, Y.; Ebana, K.; Shibata-Hatta, M.; Yoshikawa, H.; Yano, M.; Wakasa, K. Genome-wide DNA polymorphisms in seven rice cultivars of temperate and tropical japonica groups. PLoS ONE 2014, 9, e86312. [Google Scholar] [CrossRef] [PubMed]
- Matsumoto, T.; Wu, J.; Itoh, T.; Numa, H.; Antonio, B.; Sasaki, T. The Nipponbare genome and the next- generation of rice genomics research in Japan. Rice 2016, 9, 33. [Google Scholar] [CrossRef]
- Ishimaru, K.; Kashiwagi, T.; Hirotsu, N.; Madoka, Y. Identification and physiological analyses of a locus for rice yield potential across the genetic background. J. Exp. Bot. 2005, 56, 2745–2753. [Google Scholar] [CrossRef]
- Zhang, L.; Yu, H.; Ma, B.; Liu, G.; Wang, J.; Wang, J.; Gao, R.; Li, J.; Liu, J.; Xu, J.; et al. A natural tandem array alleviates epigenetic repression of IPA1 and leads to superior yielding rice. Nat. Commun. 2017, 8, 14789. [Google Scholar] [CrossRef]
- Cuevas, R.P.; Pede, V.O.; McKinley, J.; Velarde, O.; Demont, M. Rice Grain Quality and Consumer Preferences: A Case Study of Two Rural Towns in the Philippines. PLoS ONE 2016, 11, e0150345. [Google Scholar] [CrossRef]
- Xu, N.; Qiu, Y.; Cui, X.; Fei, C.; Xu, Q. Enhancing grain shape, thermotolerance, and alkaline tolerance via Gγ protein manipulation in rice. Theor. Appl. Genet. 2024, 137, 154. [Google Scholar] [CrossRef]
- Ren, D.; Ding, C.; Qian, Q. Molecular bases of rice grain size and quality for optimized productivity. Sci. Bull. 2023, 68, 314–350. [Google Scholar] [CrossRef] [PubMed]
- Huang, R.; Jiang, L.; Zheng, J.; Wang, T.; Wang, H.; Huang, Y.; Hong, Z. Genetic bases of rice grain shape: So many genes, so little known. Trends Plant Sci. 2013, 18, 218–226. [Google Scholar] [CrossRef] [PubMed]
- Mao, H.; Sun, S.; Yao, J.; Wang, C.; Yu, S.; Xu, C.; Li, X.; Zhang, Q. Linking differential domain functions of the GS3 protein to natural variation of grain size in rice. Proc. Natl. Acad. Sci. USA 2010, 107, 19579–19584. [Google Scholar] [CrossRef] [PubMed]
- Zhang, X.; Wang, J.; Huang, J.; Lan, H.; Wang, C.; Yin, C.; Wu, Y.; Tang, H.; Qian, Q.; Li, J.; et al. Rare allele of OsPPKL1 associated with grain length causes extra-large grain and a significant yield increase in rice. Proc. Natl. Acad. Sci. USA 2012, 109, 21534–21539. [Google Scholar] [CrossRef]
- Wang, S.; Li, S.; Liu, Q.; Wu, K.; Zhang, J.; Wang, S.; Wang, Y.; Chen, X.; Zhang, Y.; Gao, C.; et al. The OsSPL16-GW7 regulatory module determines grain shape and simultaneously improves rice yield and grain quality. Nat. Genet. 2015, 47, 949–954. [Google Scholar] [CrossRef]
- Wu, W.; Liu, X.; Wang, M.; Meyer, R.S.; Luo, X.; Ndjiondjop, M.N.; Tan, L.; Zhang, J.; Wu, J.; Cai, H.; et al. A single-nucleotide polymorphism causes smaller grain size and loss of seed shattering during African rice domestication. Nat. Plants 2017, 3, 17064. [Google Scholar] [CrossRef]
- Xia, D.; Zhou, H.; Liu, R.; Dan, W.; Li, P.; Wu, B.; Chen, J.; Wang, L.; Gao, G.; Zhang, Q.; et al. GL3.3, a Novel QTL Encoding a GSK3/SHAGGY-like Kinase, Epistatically Interacts with GS3 to Produce Extra-long Grains in Rice. Mol. Plant 2018, 11, 754–756. [Google Scholar] [CrossRef]
- Ying, J.Z.; Ma, M.; Bai, C.; Huang, X.H.; Liu, J.L.; Fan, Y.Y.; Song, X.J. TGW3, a Major QTL that Negatively Modulates Grain Length and Weight in Rice. Mol. Plant 2018, 11, 750–753. [Google Scholar] [CrossRef] [PubMed]
- Zhao, D.S.; Li, Q.F.; Zhang, C.Q.; Zhang, C.; Yang, Q.Q.; Pan, L.X.; Ren, X.Y.; Lu, J.; Gu, M.H.; Liu, Q.Q. GS9 acts as a transcriptional activator to regulate rice grain shape and appearance quality. Nat. Commun. 2018, 9, 1240. [Google Scholar] [CrossRef]
- Zhan, P.; Ma, S.; Xiao, Z.; Li, F.; Wei, X.; Lin, S.; Wang, X.; Ji, Z.; Fu, Y.; Pan, J.; et al. Natural variations in grain length 10 (GL10) regulate rice grain size. J. Genet. Genom. 2022, 49, 405–413. [Google Scholar] [CrossRef]
- Bai, F.; Ma, H.; Cai, Y.; Shahid, M.Q.; Zheng, Y.; Lang, C.; Chen, Z.; Wu, J.; Liu, X.; Wang, L. Natural allelic variation in GRAIN SIZE AND WEIGHT 3 of wild rice regulates the grain size and weight. Plant Physiol. 2023, 193, 502–518. [Google Scholar] [CrossRef]
- Liang, X.; Liu, Y.; Tian, M.; Jiang, W.; Zheng, Y.; Chen, Z.; Liu, X.; Wang, L. The natural variation allele OsGSW3.2 in Oryza rufipogon is involved in brassinosteroid signaling and influences grain size and weight. Plant J. 2025, 121, e70110. [Google Scholar] [CrossRef]
- Fan, C.; Xing, Y.; Mao, H.; Lu, T.; Han, B.; Xu, C.; Li, X.; Zhang, Q. GS3, a major QTL for grain length and weight and minor QTL for grain width and thickness in rice, encodes a putative transmembrane protein. Theor. Appl. Genet. 2006, 112, 1164–1171. [Google Scholar] [CrossRef]
- Fan, C.; Yu, S.; Wang, C.; Xing, Y. A causal C-A mutation in the second exon of GS3 highly associated with rice grain length and validated as a functional marker. Theor. Appl. Genet. 2009, 118, 465–472. [Google Scholar] [CrossRef]
- Wang, C.; Chen, S.; Yu, S. Functional markers developed from multiple loci in GS3 for fine marker-assisted selection of grain length in rice. Theor. Appl. Genet. 2011, 122, 905–913. [Google Scholar] [CrossRef]
- Zeng, Y.; Wen, J.; Zhao, W.; Wang, Q.; Huang, W. Rational Improvement of Rice Yield and Cold Tolerance by Editing the Three Genes OsPIN5b, GS3, and OsMYB30 With the CRISPR-Cas9 System. Front. Plant Sci. 2020, 10, 1663. [Google Scholar] [CrossRef] [PubMed]
- Yuyu, C.; Aike, Z.; Pao, X.; Xiaoxia, W.; Yongrun, C.; Beifang, W.; Yue, Z.; Liaqat, S.; Shihua, C.; Liyong, C.; et al. Effects of GS3 and GL3. 1 for grain size editing by CRISPR/Cas9 in rice. Rice Sci. 2020, 27, 405–413. [Google Scholar] [CrossRef]
- Huang, J.; Gao, L.; Luo, S.; Liu, K.; Qing, D.; Pan, Y.; Dai, G.; Deng, G.; Zhu, C. The genetic editing of GS3 via CRISPR/Cas9 accelerates the breeding of three-line hybrid rice with superior yield and grain quality. Mol. Breed. 2022, 42, 22. [Google Scholar] [CrossRef]
- Zhao, D.; Zhang, C.; Li, Q.; Liu, Q. Genetic control of grain appearance quality in rice. Biotechnol. Adv. 2022, 60, 108014. [Google Scholar] [CrossRef]
- Kan, Y.; Mu, X.R.; Zhang, H.; Gao, J.; Shan, J.X.; Ye, W.W.; Lin, H.X. TT2 controls rice thermotolerance through SCT1-dependent alteration of wax biosynthesis. Nat. Plants 2022, 8, 53–67. [Google Scholar] [CrossRef] [PubMed]
- Liu, Q.; Fu, X. Can heterotrimeric G proteins improve sustainable crop production and promote a more sustainable Green Revolution? Innov. Life 2023, 1, 100024-1–100024-2. [Google Scholar]
- Xu, R.; Yang, Y.; Qin, R.; Li, H.; Qiu, C.; Li, L.; Wei, P. Rapid improvement of grain weight via highly efficient CRISPR/Cas9-mediated multiplex genome editing in rice. J. Genet. Genom. 2016, 43, 529–532. [Google Scholar] [CrossRef]
- Li, M.; Li, X.; Zhou, Z.; Wu, P.; Fang, M.; Pan, X.; Lin, Q.; Luo, W.; Wu, G.; Li, H. Reassessment of the four yield-related genes Gn1a, DEP1, GS3, and IPA1 in rice using a CRISPR/Cas9 system. Front. Plant Sci. 2016, 7, 377. [Google Scholar] [CrossRef]
- Sun, Y.; Jiao, G.; Liu, Z.; Zhang, X.; Li, J.; Guo, X.; Du, W.; Du, J.; Francis, F.; Zhao, Y.; et al. Generation of high-amylose rice through CRISPR/Cas9-mediated targeted mutagenesis of starch branching enzymes. Front. Plant Sci 2017, 8, 298. [Google Scholar] [CrossRef]
- Hidangmayum, A.; Dwivedi, P.; Katiyar, D.; Hemantaranjan, A. Application of chitosan on plant responses with special reference to abiotic stress. Physiol. Mol. Biol. Plants 2019, 25, 313–326. [Google Scholar] [CrossRef] [PubMed]
- Widiastuti, A.; Yoshino, M.; Hasegawa, M.; Nitta, Y.; Sato, T. Heat shock-induced resistance increases chitinase-1 gene expression and stimulates salicylic acid production in melon (Cucumis melo L.). Physiol. Mol. Plant Pathol. 2013, 82, 51–55. [Google Scholar] [CrossRef]
- Ma, X.; Zhang, Q.; Zhu, Q.; Liu, W.; Chen, Y.; Qiu, R.; Wang, B.; Yang, Z.; Li, H.; Lin, Y.; et al. A Robust CRISPR/Cas9 system for convenient, high-efficiency multiplex genome editing in monocot and dicot plants. Mol. Plant 2015, 8, 1274–1284. [Google Scholar] [CrossRef]
- Hiei, Y.; Ohta, S.; Komari, T.; Kumashiro, T. Efficient transformation of rice (Oryza sativa L.) mediated by Agrobacterium and sequence analysis of the boundaries of the T-DNA. Plant J. 1994, 6, 271–282. [Google Scholar] [CrossRef] [PubMed]
- Li, X.; Wu, L.; Wang, J.; Sun, J.; Xia, X.; Geng, X.; Wang, X.; Xu, Z.; Xu, Q. Genome sequencing of rice subspecies and genetic analysis of recombinant lines reveals regional yield-and quality-associated loci. BMC Biol. 2018, 16, 102. [Google Scholar] [CrossRef]
- Mortazavi, A.; Williams, B.A.; McCue, K.; Schaeffer, L.; Wold, B. Mapping and quantifying mammalian transcriptomes by RNA-Seq. Nat. Methods 2008, 5, 621–628. [Google Scholar] [CrossRef]
- Robinson, M.D.; Mc Carthy, D.J.; Smyth, G.K. Edge R: A Bioconductor package for differential expression analysis of digital gene expression data. Bioinformatics 2010, 26, 139–140. [Google Scholar] [CrossRef] [PubMed]
- Ge, S.X.; Jung, D.; Yao, R. Shiny GO: A graphical gene-set enrichment tool for animals and plants. Bioinformatics 2020, 36, 2628–2629. [Google Scholar] [CrossRef] [PubMed]


Disclaimer/Publisher’s Note: The statements, opinions and data contained in all publications are solely those of the individual author(s) and contributor(s) and not of MDPI and/or the editor(s). MDPI and/or the editor(s) disclaim responsibility for any injury to people or property resulting from any ideas, methods, instructions or products referred to in the content. |
© 2025 by the authors. Licensee MDPI, Basel, Switzerland. This article is an open access article distributed under the terms and conditions of the Creative Commons Attribution (CC BY) license (https://creativecommons.org/licenses/by/4.0/).