Article

Corn Stover Biochar Amendment Enhances Nitrogen and Phosphorus Transformations, Microbial Community Diversity, and Enzyme Activities in Agricultural Soil

College of Agricultural Science and Engineering, Hohai University, Nanjing 210098, China
*
Authors to whom correspondence should be addressed.
Plants 2025, 14(17), 2787; https://doi.org/10.3390/plants14172787
Submission received: 13 August 2025 / Revised: 2 September 2025 / Accepted: 4 September 2025 / Published: 5 September 2025
(This article belongs to the Special Issue Advances in Microbial Solutions for Sustainable Agriculture)

Abstract

Corn stover biochar amendment significantly influences nitrogen (N) and phosphorus (P) transformations, microbial community composition, and enzyme activities in continuous cropping soils. This study aimed to identify the optimal biochar application rate for enhancing N and P nutrient availability in Solanum lycopersicum L. continuous cropping systems, providing theoretical and technical foundations for mitigating continuous cropping obstacles. A soil experiment under rain-out shelters employed four treatments: 1% biochar (BA1), 3% biochar (BA3), 5% biochar (BA5), and a non-amended control (BA0). The results indicated that biochar amendment significantly elevated available phosphorus content in the soil while effectively suppressing its vertical migration; nitrate N content increased under BA1 treatment but decreased in the BA3 and BA5 groups; and the strength of the inhibition effect of biochar treatment on the vertical migration of nitrate N was BA1 > BA5 > BA0 > BA3. The addition of biochar treatment had no significant effect on the content of ammonium N but could inhibit the vertical migration of ammonium N. The addition of biochar treatment could increase the soil’s ammonium N content. The addition of biochar treatment increased soil catalase and urease and sucrase activities, decreased alkaline phosphatase activity, led to the promotion of nitrate reductase activity at low doses and its inhibition at high doses, and resulted in BA1 treatment having the largest soil enzyme index (SEI), which was the most favorable to increase the overall level of soil enzyme activities. Biochar significantly increased the relative abundance of Patescibacteria and Ciliophora while reducing Gemmatimonadota, Acidobacteriota, Nitrospirota, Ascomycota, and Chlorophyta. Comprehensive evaluation using gray relational analysis (GRA) demonstrated that the addition of 5% biochar resulted in the optimal overall performance, enhancing nitrogen and phosphorus transformation, improving microbial community structure, and harmonizing enzyme activities, thereby exhibiting considerable potential for alleviating the nutrient limitations of nitrogen and phosphorus in continuous cropping soils.

1. Introduction

Nitrogen and phosphorus are essential macronutrients crucial for plant growth and sustaining crop productivity [1,2]. However, in intensive vegetable production systems, continuous cropping practices are widely adopted to maximize economic returns. Numerous studies indicate that prolonged monocropping severely degrades soil structure, manifesting as increased bulk density, reduced air-filled porosity, and disrupted N/P stoichiometry [3,4]. These alterations impair root nutrient acquisition and plant development, ultimately hindering the sustainable development of protected vegetable cultivation [5]. Biochar amendment offers a promising solution by enhancing soil nutrient use efficiency, suppressing pathogenic fungi proliferation [6], and facilitating N and P turnover to alleviate continuous cropping obstacles.
Corn stover biochar is thermally produced with corn stover under oxygen-limited conditions. The advantage of corn stover utilization is its wide abundance and low cost, and it therefore provides a plentiful, renewable, and cost-effective feedstock for biochar production. Corn stover biochar, with high stability and a strong aroma, has a highly organic carbon and aperture structure, a large surface area with various functional groups, and a higher cation-exchange capacity [7]. Fuertes et al. [8] reported that biochar from corn stover pyrolysis at a peak temperature of 550 °C was highly aromatic and had low H/C and O/C molar ratios For instance, the corn straw-derived biochar used in this study is particularly noted for its well-developed pore structure and significant nutrient retention capacity, making it highly suitable for soil amendment. Its application in soil remediation improves soil porosity, adsorbs root exudates, provides favorable habitats for beneficial microbes, and suppresses soil-borne pathogens [9]. However, it is important to note that the high pH characteristic of corn straw biochar may pose limitations for use in already alkaline soils.
Extensive research confirms that biochar enhances nitrogen and phosphorus availability by modifying soil properties and regulating key biochemical processes in N and P cycling [10,11,12,13]. Specifically, biochar mitigates nutrient leaching in continuous cropping systems through adsorption mechanisms that effectively inhibit vertical migration of phosphorus and nitrate [14]. Concurrently, Liang et al. [15] demonstrated that biochar amendment increases soil nitrogen availability while reducing N losses. Yang et al. [16] further established biochar’s capacity to sequester soil phosphorus, significantly elevate organic P content, and facilitate the conversion of inorganic P to labile phosphorus forms.
Research indicates that biochar amendment significantly influences soil microbial activity and community composition, consequently altering nutrient content and availability [17,18]. Diverse microbial communities accelerate organic matter decomposition, providing plant-available nitrate and ammonium nitrogen alongside microbial metabolites, thereby playing pivotal roles in nitrogen and phosphorus cycling [19]. Xu et al. [20] reported increased Bacteroidetes abundance following biochar application, Dempster et al. [21] paradoxically observed reduced soil microbial biomass. Vanek et al. [22] demonstrated that biochar enhances phosphorus bioavailability via interactions with arbuscular mycorrhizal (AM) fungi, facilitating phosphorus uptake in common beans. Similarly, Wang et al. [23] documented increased abundance of nitrogen-cycling functional microbiota in degraded agricultural soils amended with rice straw and sludge-derived biochars. Critically, biochar’s ameliorative effects exhibit dose dependency [24], as excessive application may potentially compromise nutrient bioavailability or disrupt microbial functionality [25].
Soil microbial-driven nitrogen and phosphorus transformations are primarily mediated by metabolic enzymes within microorganisms. Extensive research documents that biochar amendment significantly influences the activity of key enzymes involved in N and P cycling [26,27,28]. Notably, biochar frequently enhances phosphatase activity [19]—which can catalyze the hydrolysis of organically bound phosphorus, thereby potentially increasing soil P bioavailability. Supporting this, Khadem and Raiesi [29] demonstrated that maize-derived biochar stimulated alkaline phosphatase activity, accelerating organic phosphate mineralization in arid soils. Conversely, Liu et al. [30] observed suppressed activities of certain N-cycling enzymes following biochar application. Pokharel et al. [31] reported divergent findings, indicating that biochar enhanced urease activities, while concurrently inhibiting alkaline phosphatase synthesis.
Current research mostly focuses on the effects of biochar dosage on specific soil indicators but lacks a systematic quantification of its comprehensive effects. This study targeted yellow-brown soil that had been cultivated for three consecutive tomato crops. Four different biochar application rates were established to examine variations in soil microbial community composition, key enzyme activities, and nitrogen and phosphorus contents. A comprehensive evaluation model was developed using gray relational analysis (GRA) to identify (1) the vertical migration pattern of N and P and the driving factors of N and P content in continuous cropping soil under biochar addition and (2) the optimal dosage of nitrogen and phosphorus nutrients in continuous cropping soil improved by biochar. It provides a reference for the improvement of continuous crop soil and the popularization and application of biochar.

2. Results

2.1. Effect of Biochar Amendment on Vertical Transport of Soil-Available P, Nitrate N, and Ammonium N

As shown in Figure 1a,b, the increase in available phosphorus and nitrate N in 8–10 cm compared to those in the 0–2 cm soil layer under BA0, BA1, BA3, and BA5 treatments were 990.48%, 51.35%, 724.14%, and 514.29% and 23.40%, 2.94%, 52.56%, and 6.36%. BA0 treatment indicated that available phosphorus and nitrate N in natural soil were easily transported downward and enriched in the deep layer. The addition of biochar could effectively inhibit the vertical migration of available phosphorus, and the effect size was BA1 > BA5 > BA3 > BA0. Conversely, biochar differentially impacted the vertical migration of nitrate N; BA1 and BA5 treatments inhibited the vertical migration of nitrate N, whereas BA3 promoted the vertical migration of nitrate N, and the effect was 2.2 times more than that of BA0. The BA5 treatment had the highest content of ammonium N at a depth of 0–2 cm, and its content was twice that of BA0. Biochar addition could inhibit the vertical migration of ammonium N, and the content of ammonium N was similar to that of BA0 at a depth of 8–10 cm, indicating that the BA5 treatment could effectively inhibit the vertical migration of ammonium N. The changes in the content of ammonium N at all depths of the soil in the BA1 and BA3 treatments were smaller than those of BA0 (Figure 1c), which indicated that the BA1 and BA3 treatments also inhibited the vertical migration of ammonium N. The BA5 treatment had the highest content at a depth of 0–2 cm, which was two times as effective as BA0.

2.2. Effect of Biochar Amendment on Soil-Available P, Nitrate N, and Ammonium N Content

Biochar treatments significantly elevated soil-available phosphorus content (Table 1); BA1 treatment increased the content of nitrate N, but there was no significant difference from BA0 treatment; BA3 treatment reduced the content of nitrate N, which decreased by 26.64%; BA5 treatment significantly reduced the content of nitrate N by 33.99%; and biochar did not significantly affect ammonium N.

2.3. Effects of Biochar Amendment on Soil Field Capacity

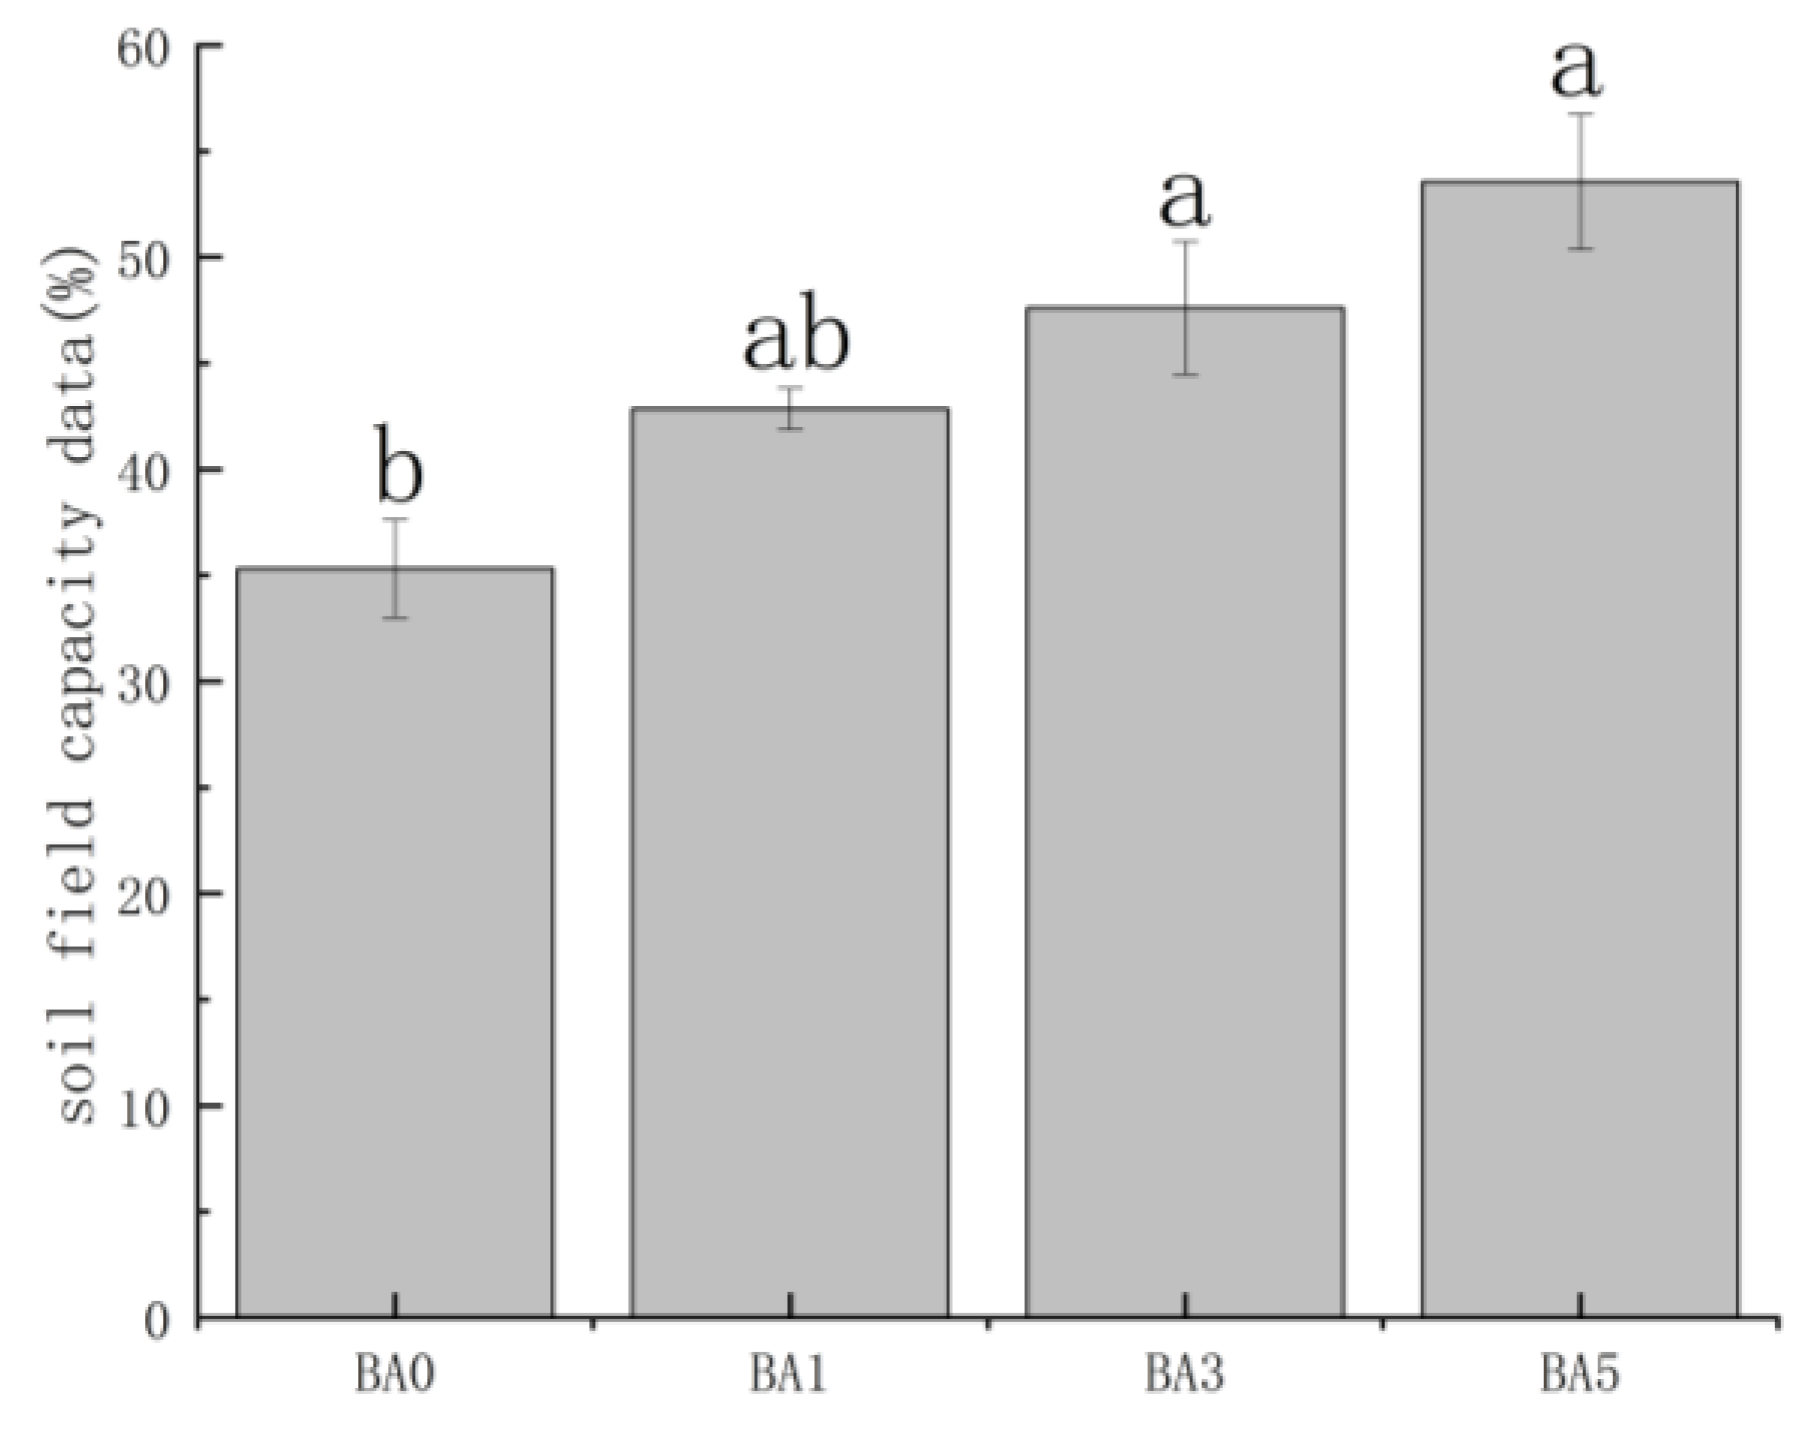
The application of biochar significantly influenced the soil’s water retention capacity, as measured by the field capacity (FC). As illustrated in Figure 2, the field capacity exhibited a pronounced increasing trend with higher biochar application rates. The FC of the control treatment (BA0) was measured at 35.3%. The addition of 1% (BA1), 3% (BA3), and 5% (BA5) biochar progressively increased the field capacity to 42.8%, 47.9%, and 53.5%, respectively. Statistical analysis confirmed that all biochar-amended treatments resulted in a significantly higher field capacity (p < 0.05) compared to the control, with the BA5 treatment demonstrating the most substantial enhancement.

2.4. Effects of Biochar Amendment on Microbial Community Composition

2.4.1. Effect of Biochar Amendment on the Relative Abundance Composition of Microorganisms

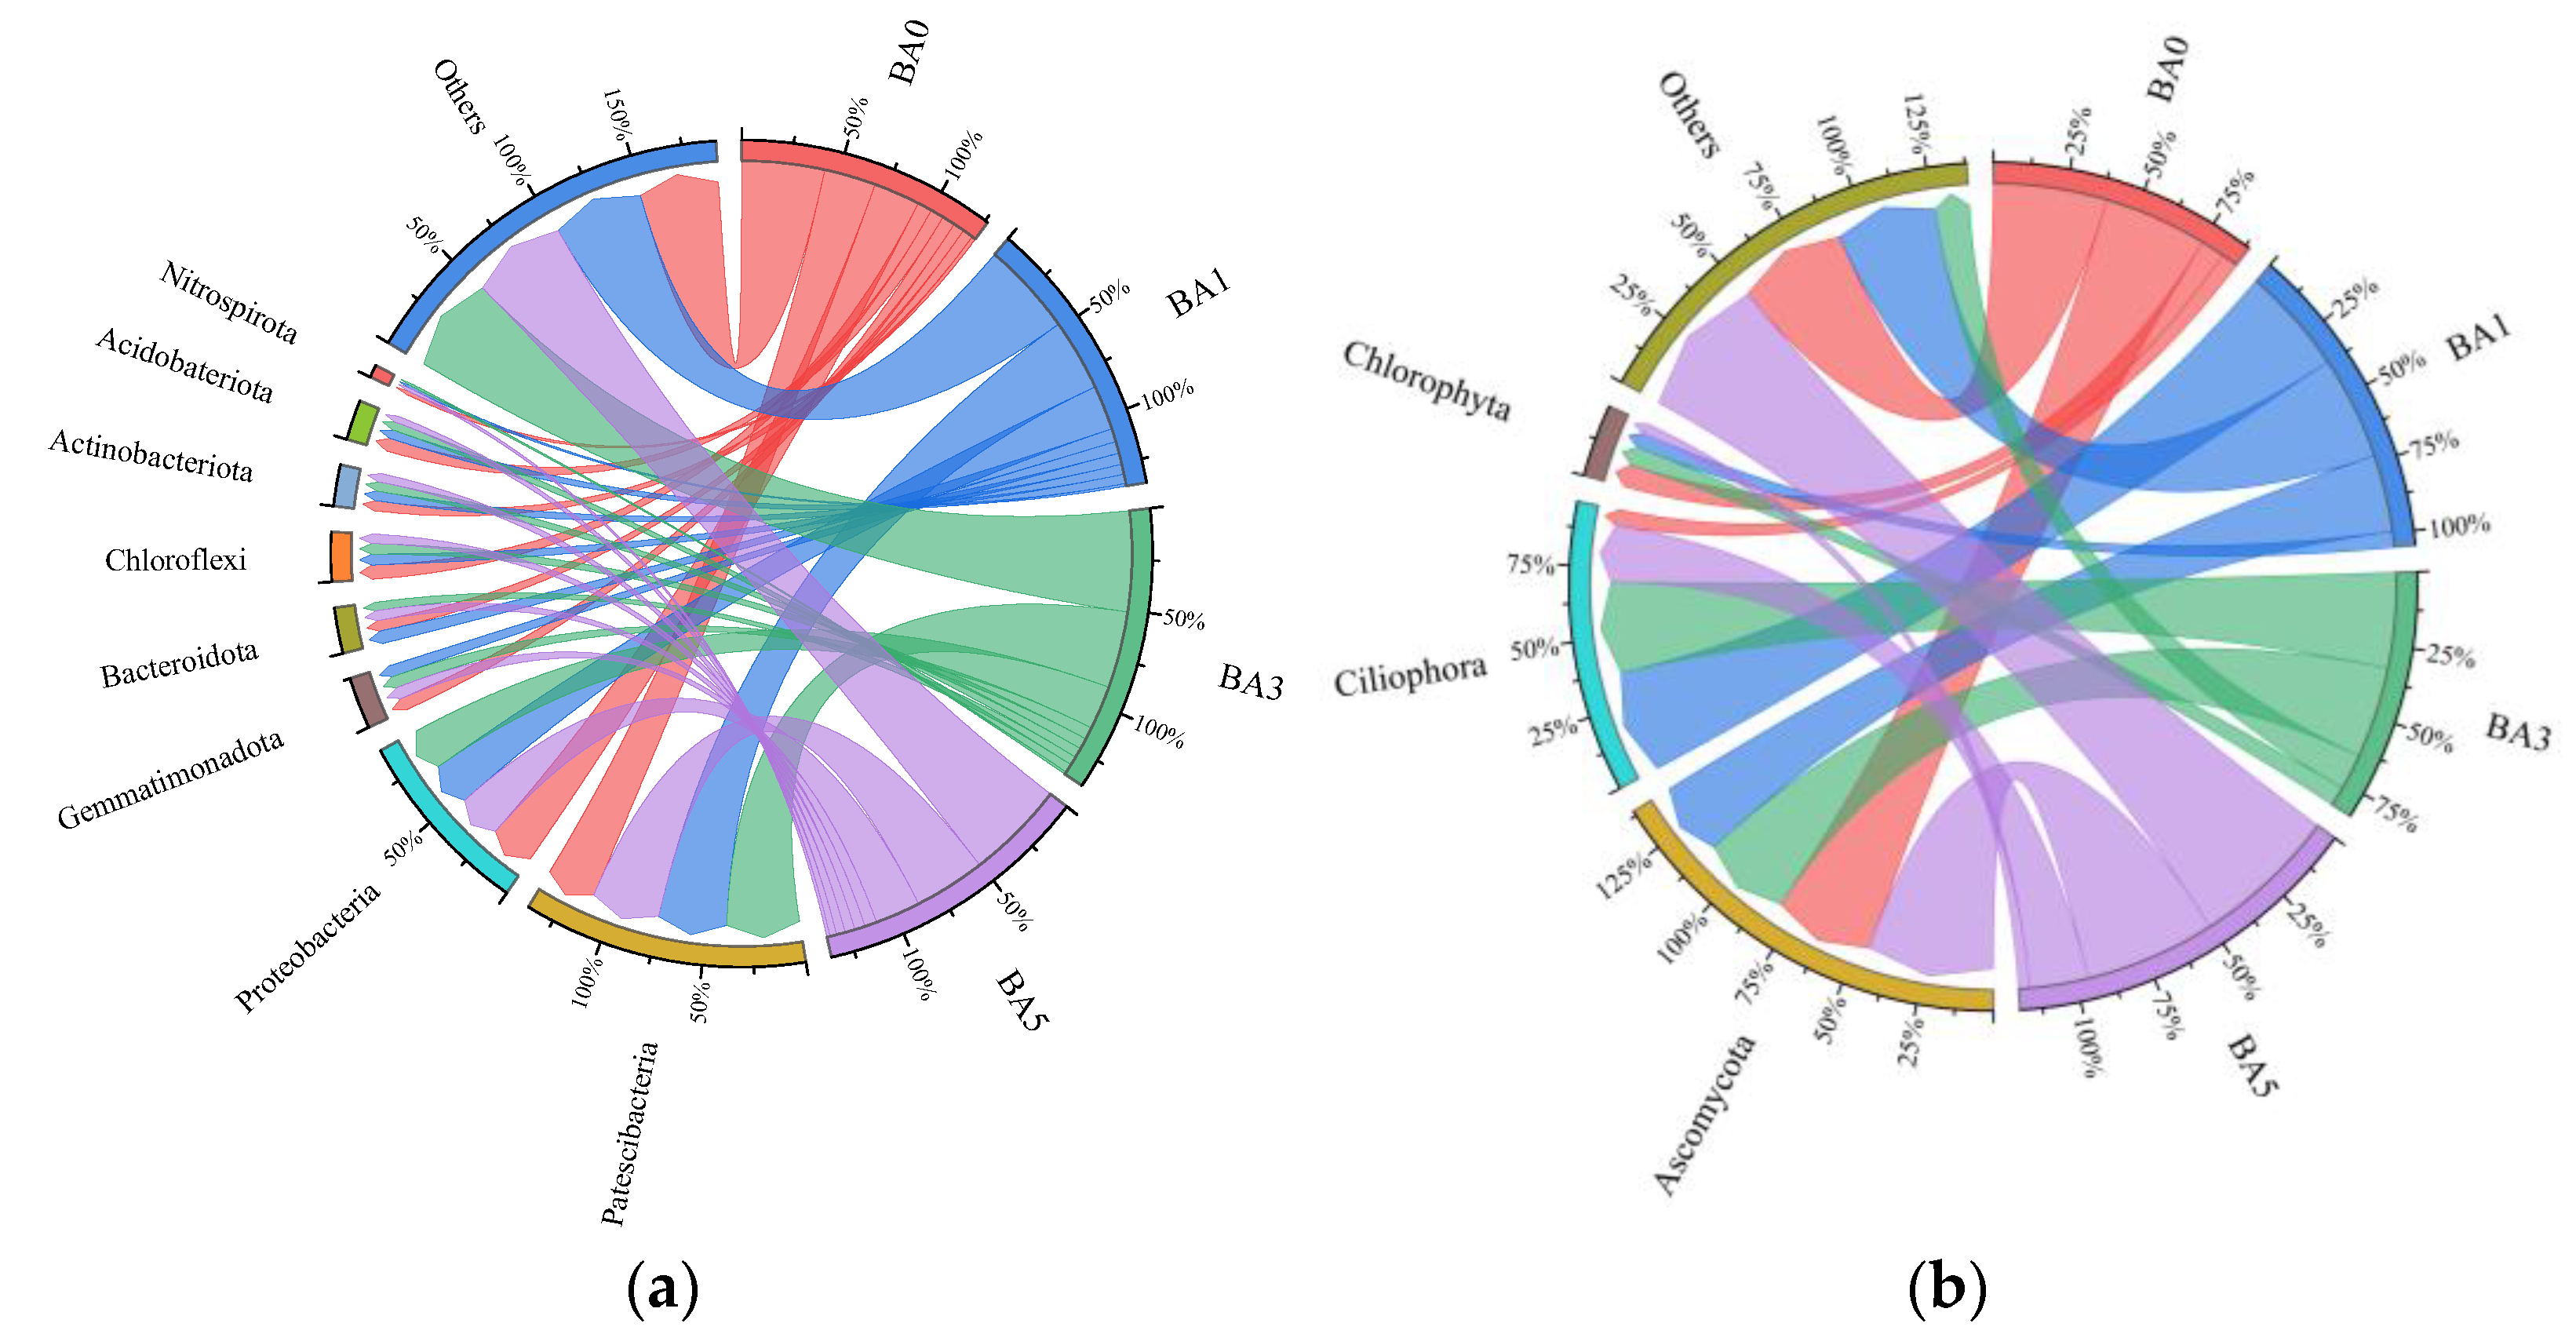
The composition of the bacterial and fungal phyla under the application of different biochar treatments to the continuous soil is analyzed in Figure 3. Under the bacterial phyla, the application of biochar treatments increased the relative abundance of the Patescibacteria phyla compared to BA0; the application decreased the relative abundance of Gemmatimonadota, Bacteroidota, Acidobateriota, Nitrospirota, and Chloroflexi phyla. For fungal phylum classification, biochar application decreased the relative abundance of Ascomycota phylum compared to BA0; BA1 treatment significantly increased the relative abundance of Ciliophora phylum, and BA3 treatment increased the relative abundance of Ciliophora phylum.

2.4.2. Effect of Biochar Amendment on Dominant Microbial Populations

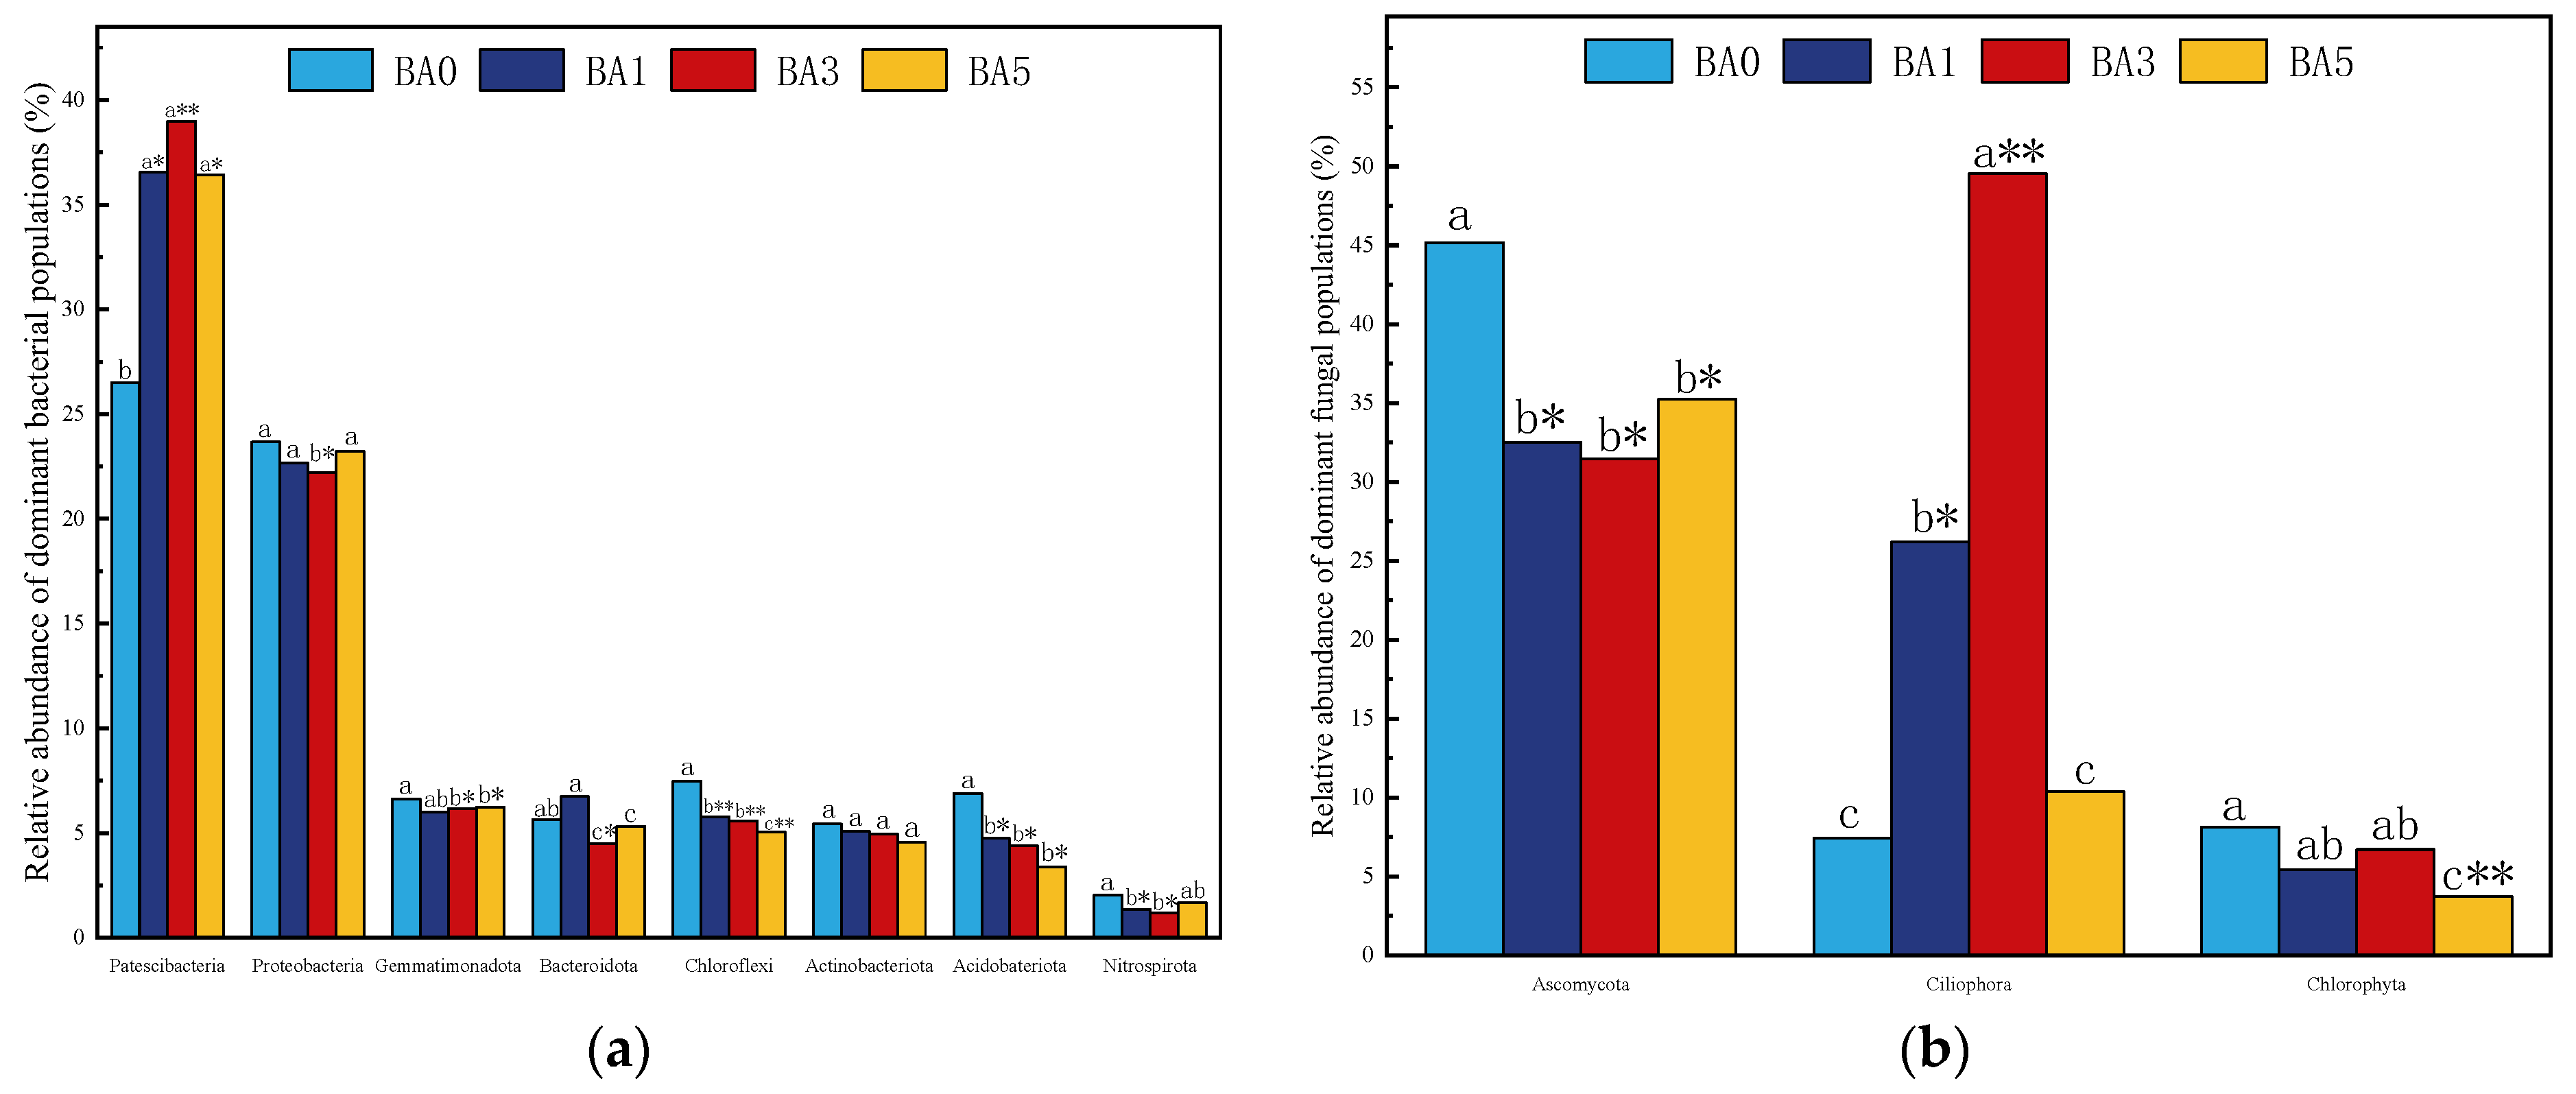
As can be seen in Figure 4, the major bacterial phyla of the soil bacterial phyla measured were Patescibacteria, Proteobacteria, Gemmatimonadota, Bacteroidetes, Chloroflexi, Actinobacteria, Acidobateriota, and Nitrospirota phylum, and the cumulative abundance of the BA0, BA1, BA3, and BA5 treatments amounted to 84.23%, 88.89%, 87.90%, and 85.81%, respectively. The top three dominant species groups in each treatment of fungi were Ascomycota, Ciliophora, and Chlorophyta, and the cumulative abundance of the top three phyla in the BA0, BA1, BA3, and BA5 treatments amounted to 60.73%, 64.11%, 87.70%, and 49.35%, respectively.
Biochar application had significant effects on the dominant fungal and bacterial phyla compared to no biochar application (Figure 5). For bacterial phyla, biochar application significantly or very significantly increased the relative abundance of Patescibacteria phylum, significantly decreased the relative abundance of Gemmatimonadota, Acidobateriota, and Nitrospirota phyla, and very significantly decreased the relative abundance of Chloroflexi phyla compared to BA0. The BA3 treatment significantly reduced the relative abundance of the Proteobacteria phylum, and there were no significant differences between BA1, BA5, and the unapplied biochar treatment.
On the fungal phylum, the application of biochar significantly reduced the abundance of Ascomycota phylum, and the abundance of Ascomycota phylum in the BA1, BA3, and BA5 treatments decreased by 28.36%, 28.36%, and 22.37%, respectively, compared with the BA0 treatment. The treatments of BA1 and BA3 significantly increased the abundance of the Ciliophora phylum, and the abundance of the Ciliophora phylum was significantly increased by the application of 3% biochar treatment. There was no significant difference between the BA5 and BA0 treatments. The highest abundance was observed in the BA5 and BA0 treatments, with no significant difference between them. The BA5 treatment decreased the relative abundance of Chlorophyta very significantly.

2.5. Effect of Biochar Amendment on Enzyme Activity

As shown in Table 2, there were differences in the effects of different biochar addition treatments on soil enzyme activities. Compared with BA0, the activities of catalase and sucrase in soil increased by 2.06% to 7.28% and 26.16% to 58.65%, respectively, while alkaline phosphatase activity was significantly decreased by 23.68% to 34.21%, and this trend in increase or decrease increased with the increase in addition. It is noteworthy that nitrate reductase activity increased by 26.67% to 31.11% in BA1 and BA3 treatments, while it decreased by 40.00% in BA5 treatment. The activities of catalase and urease were significantly or highly significantly increased under BA5 treatment compared to BA0, but the effects of BA1 and BA3 treatments were not significant. Both the sucrase activity and alkaline phosphatase activity of soil treated with added biochar were significantly different from the BA0 group. Nitrate reductase activity showed greater fluctuation with the increase in biochar addition compared to BA0.
The soil enzyme index (SEI) reflects the combined value of soil enzyme activities after the application of different biochar additions. As shown in Table 3, the weighting coefficients of soil catalase, urease, sucrase, and neutral phosphatase were 0.30, 0.32, 0.31, 0.18, and 0.21, respectively. As shown in Table 4, the SEI exhibited an initial increase followed by a decline with rising biochar addition, and the SEI was BA1 > BA5 > BA3 > BA0. The SEI reached the maximum value when biochar was 1%, which was most favorable to improve the overall level of soil enzyme activity.

2.6. Correlation Analysis

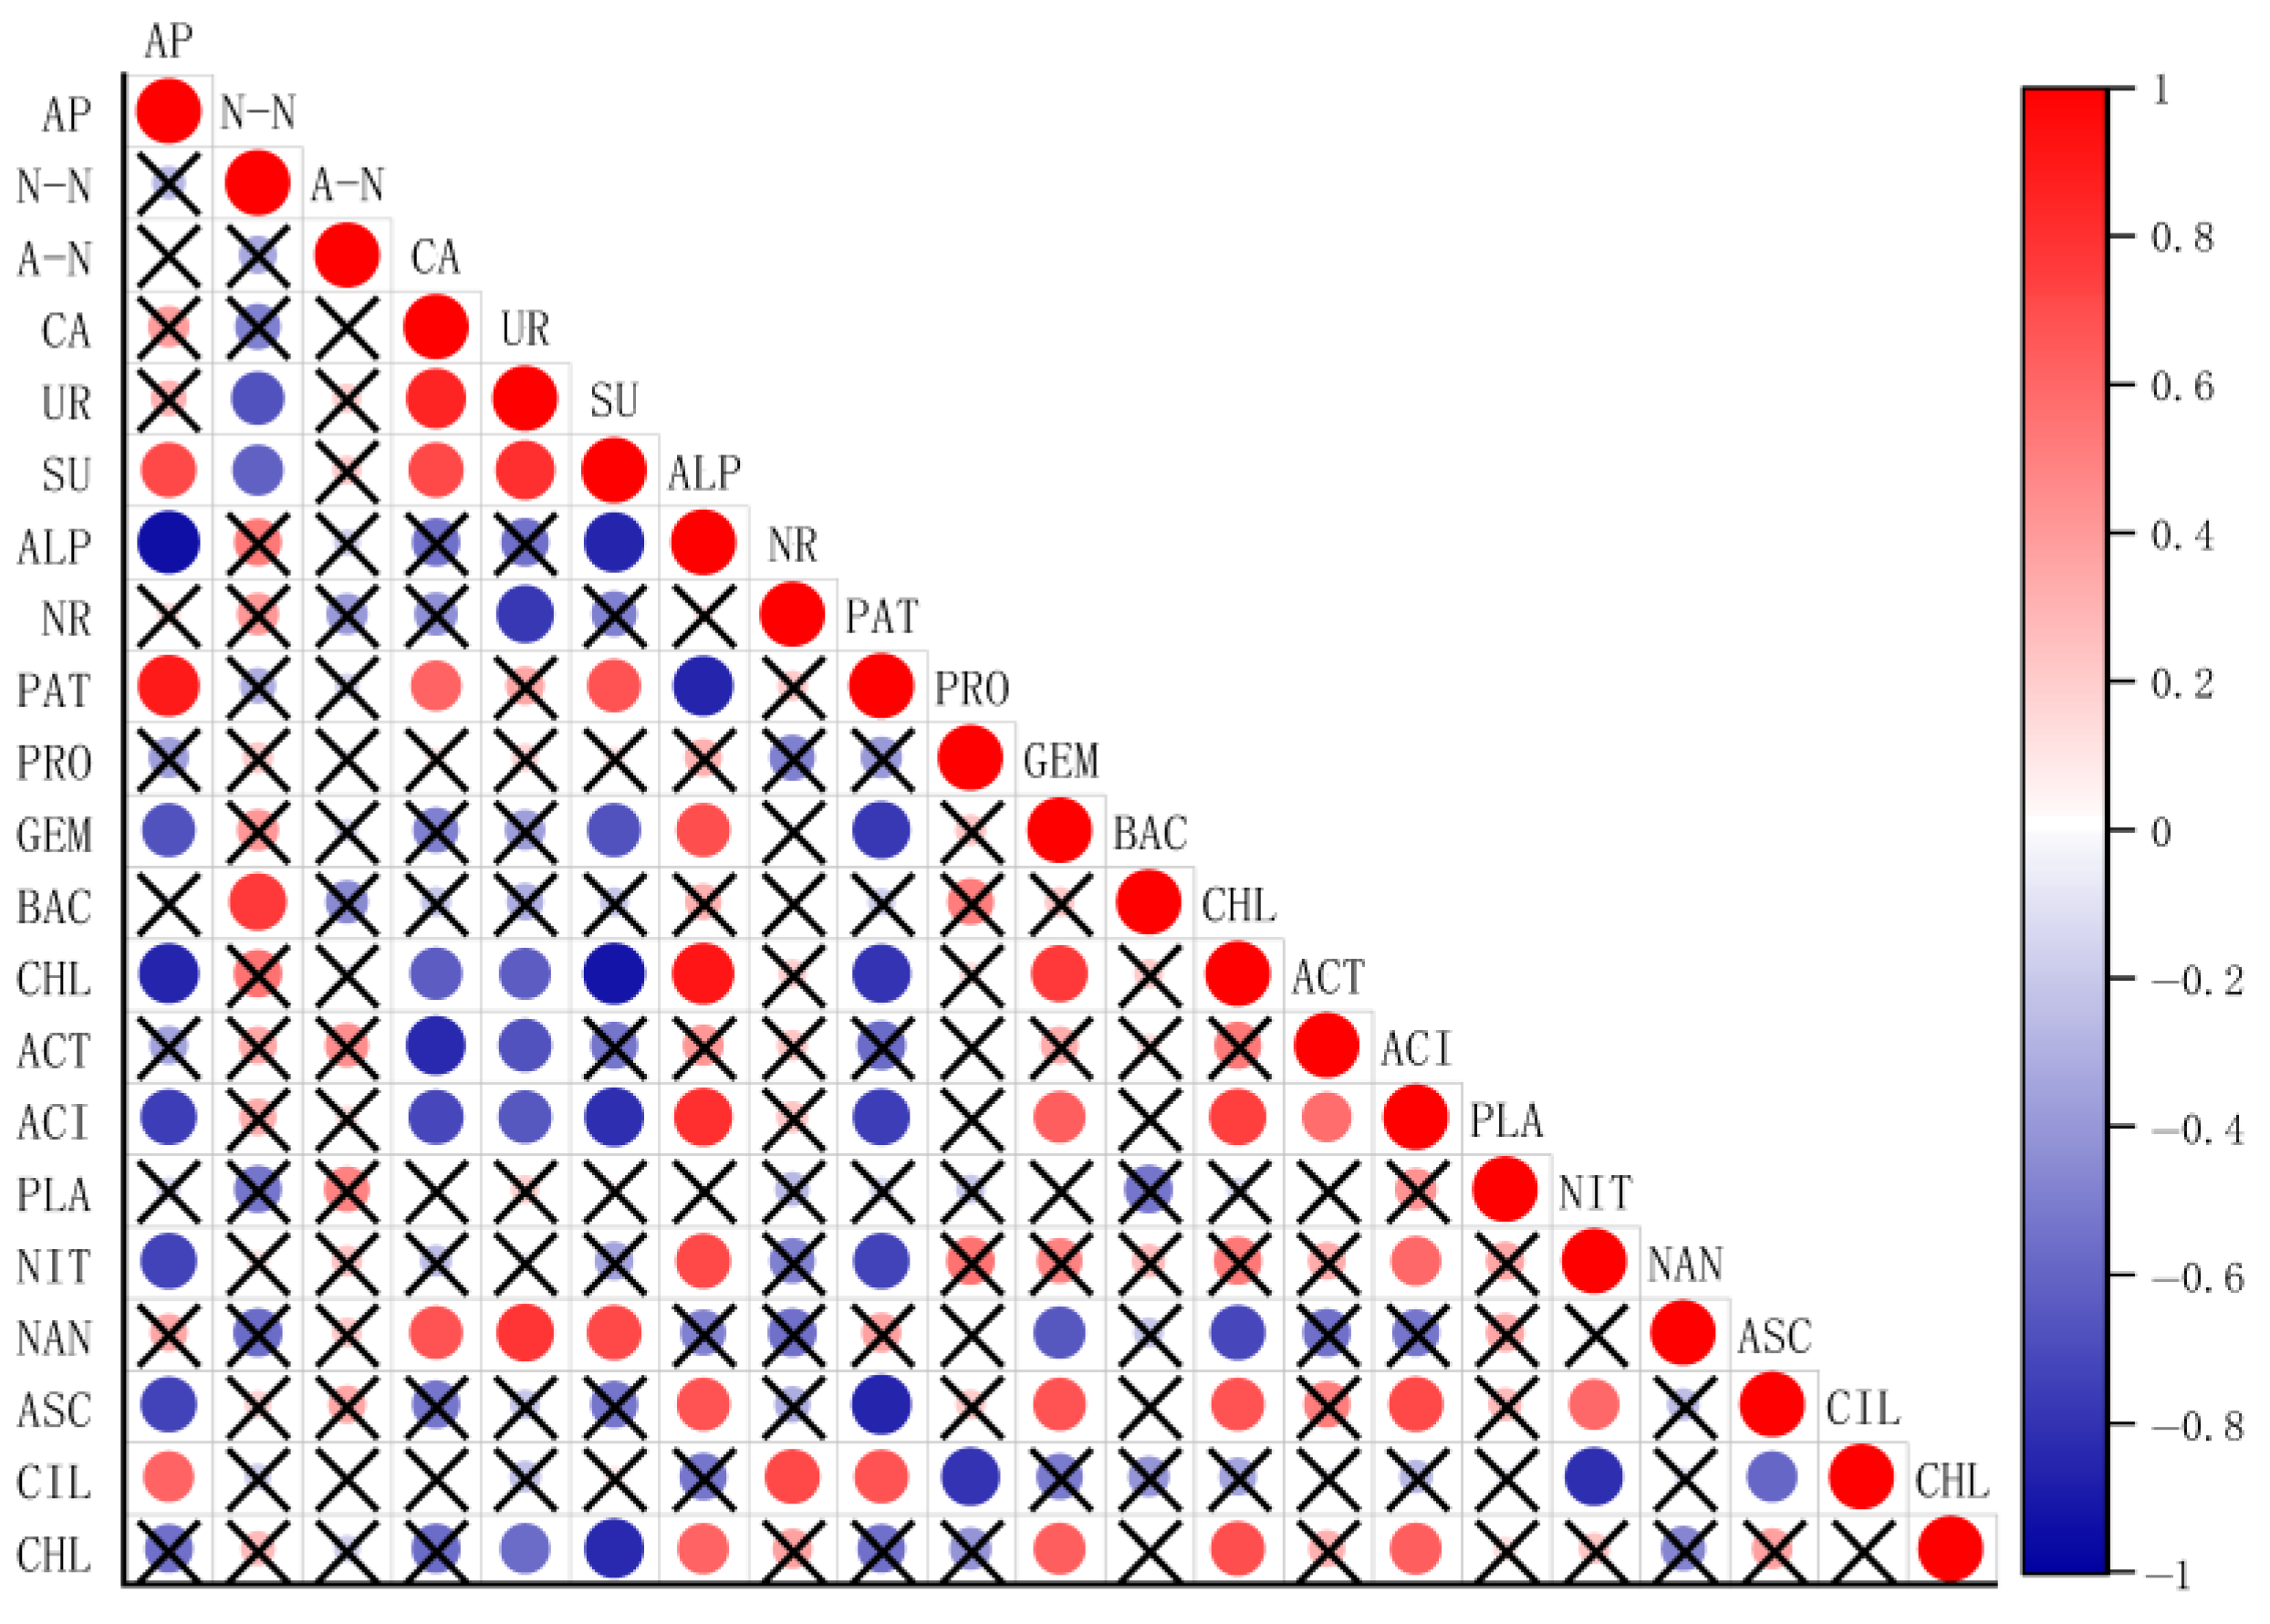
From the correlation analysis (Figure 6), soil-available phosphorus was negatively correlated with alkaline phosphatase, Gemmatimonadota, Chloroflexi, Acidobateriota, Nitrospirota, and Ascomycota phylum, and with positively correlated sucrase, Patescibacteria, Ciliophora phylum; soil nitrate N correlated negatively with urease and sucrase activities but positively with Bacteroidota abundance.

2.7. Gray Correlation Analysis

Due to the differences in soil nitrogen and phosphorus content, microbial dominant population abundance, and enzyme activity among treatments was evaluated in order to better evaluate the effect of biochar addition, the average concentration of soil-available phosphorus, nitrate N, ammoniacal N, nitrogen and phosphorus cycling-related microbial phylum and soil enzyme activity indicators, with a total of 14 indicators from four treatments used to construct a gray system (Table 5). Soil improvement efficacy positively correlated with total weighted correlation magnitude. Experimental treatments were ranked by gray correlation degree as BA5 > BA1 > BA3 > BA0 (Table 6). The results showed that the addition of 5% biochar had the best comprehensive performance effect in this experiment.

3. Discussion

3.1. Effects of Biochar Amendment on Vertical Migration and Concentrations of Soil-Available Phosphorus, Nitrate N, and Ammoniacal N

Biochar amendment effectively enhanced soil nutrient retention while suppressing nitrogen and phosphorus leaching. The increased soil available phosphorus content following biochar application supports crop health and growth, thereby improving agricultural ecosystem productivity. This aligns with the findings of Chintala et al. [32], who demonstrated that corn stover biochar can enhance the adsorption and sequestration of available phosphorus. The pronounced ability of biochar to elevate soil-available phosphorus and reduce phosphorus loss, as observed in our study, can be attributed to its inherent properties [33]. Our experiment further demonstrated that the addition of biochar not only significantly increased the available phosphorus content but also effectively inhibited its vertical migration. This suppression may be attributed to phosphorus immobilization through adsorption or passivation mechanisms specific to biochar [34,35,36]. The alkaline nature of corn stover biochar likely plays a key role by promoting phosphate precipitation via soil pH modulation, thereby reducing leaching risks [37]. Furthermore, its microporous structure enhances the adsorption of mobile phosphorus fractions, consequently limiting downward translocation through the soil profile [38]. Although biochar amendment increased soil field capacity (Figure 2), the inhibition of phosphorus leaching is likely dominated by chemical and physical adsorption rather than by alterations in soil water dynamics.
The response of soil inorganic nitrogen to biochar amendment displayed a complex, non-linear relationship with the application rate. BA1 treatment increased soil nitrate-N content, whereas both BA3 and BA5 treatments decreased it. Concurrently, BA1 and BA5 effectively inhibited the vertical migration of nitrate-N, while BA3 promoted its downward translocation. This differential behavior may be attributed to distinct mechanisms governed by the application rate. (1) BA1 (1%): The reduction in nitrate-N leaching at this low rate is likely achieved through direct electrostatic adsorption by biochar functional groups, which effectively immobilizes nitrate ions without drastically altering soil physical properties. (2) BA3 (3%): This treatment significantly increased soil field capacity (Figure 2). We hypothesize that this enhancement in soil water retention potentially facilitates the infiltration and downward translocation of soluble nitrate, explaining the promoted vertical migration observed in our results. (3) BA5 (5%): Despite resulting in the highest soil field capacity (Figure 2), this treatment effectively inhibited nitrate leaching. This suggests that at high application rates, the mechanism shifts. The immense surface area and microporous structure of the large amount of biochar likely dominate the process, providing ample sites for the physical retention and adsorption of nitrate. Furthermore, the excessive biochar may create a complex porous network that increases the tortuosity of water flow paths, prolonging hydraulic residence time and potentially enhancing denitrification opportunities, thereby retarding vertical movement despite the high water-holding capacity. Biochar minimally affected ammonium N. Still, biochar addition could inhibit the vertical transport of ammoniacal N, probably because although ammoniacal N only accounts for a very small portion of soil nitrogen, biochar’s extensive surface area and porous structure offer ample adsorption sites for ammoniacal N [39] so that it is not easy to be leached out to downward seepage.

3.2. Effects of Different Biochar Amendment on Microbial Community Structure

Corn stover biochar application increased the abundance of the soil microbial community. It changed the community composition of soil bacteria and fungi to some extent [40], which is consistent with the results of this study. With the increase in biochar addition, the relative abundance of microbial community showed a tendency of increasing and then decreasing, which was due to the fact that the increase in biochar addition would promote the growth of some types of bacteria while inhibiting the growth of some bacteria, resulting in the change in soil bacterial community structure [41]. In this study, it was found that different biochar additions did not change the main composition of bacteria and fungi on the phylum. Still, corn stover biochar additions significantly increased the relative abundance of Patescibacteria phylum. It was suggested that the unique structure of biochar can provide a favorable place for soil bacteria to reproduce, rich in nutrients, which is conducive to the growth of the bacteria and their increase in relative abundance [42]. Meanwhile, this study found that the relative abundance of Gemmatimonadota, Acidobateriota, Nitrospirota, and Chloroflexi phylum was significantly reduced by the application of corn stover biochar, which may be because the application of biochar into the soil can improve the microecological environment of the soil to a certain extent, but it may be beneficial to the increase in the relative abundance of individual taxa only [43,44,45]. In addition, the addition of biochar treatment significantly decreased the relative abundance of the phylum Ascomycota. It significantly increased the relative abundance of the Ciliophora phylum compared to the BA0 treatment, which may be due to the fact that the bacterial proliferation facilitated by biochar may further inhibit ascomycetes through nutrient competition or antibiotic secretion, and, on the contrary, the ciliates gained their energy through ingesting the bacteria; the expansion of their populations may be directly related to the bacterial biomass increase. For example, it was found that fast-growing ciliates could cause rapid death or cyst formation of 12 pathogenic fungi, suggesting that biochar may ameliorate the barriers to succession by inhibiting the growth of pathogenic fungi, reflecting the alteration of fungal–bacterial interactions mediated by biochar [25], which is in line with the mechanism of Kolton et al. [46] on the enhancement of plant disease resistance by biochar.

3.3. Effect of Different Biochar Amendment on Enzyme Activity

Due to its unique physicochemical properties, corn stover biochar can alter soil physicochemical properties after application and impact soil enzyme activities to some extent. Table 3 shows that BA5 treatment significantly increased the activities of catalase and urease in continuous cropping soil in tomato compared with BA0 treatment. Additionally, the activities of catalase and urease were increased under BA1 and BA3 treatments, but the differences were not significant. Different biochar addition treatments significantly increased sucrase activity, which may be due to the promotion of microbial metabolism and organic matter decomposition through the improvement of soil aeration and organic matter stabilization [47], thus promoting the increase in soil enzyme activity. However, alkaline phosphatase activity decreased with increasing corn stover biochar addition, probably since biochar contains fewer easily decomposable components, which reduces substrate effectiveness and thus inhibits enzyme synthesis. Nitrate reductase activity increased and then decreased with the addition of corn stover biochar, which indicated that the nitrate reductase activity could be significantly increased by adding the appropriate proportion of biochar. The addition of too much biochar was detrimental to the soil nitrate reductase activity, which might be related to the fact that the excessive addition of biochar altered the pH or released inhibitory substances, thus interfering with the nitrification–denitrification equilibrium.

3.4. Correlation of Soil Nitrogen and Phosphorus Content with Soil Enzyme Activity and Microbial Community After Biochar Application

Soil microorganisms play a crucial role in N and P turnover [19,48], which directly impacts soil nutrient content and effectiveness [49]. The soil microbe-driven nitrogen and phosphorus transformation process is primarily driven by a series of metabolism-related enzymes (proteins) present in microorganisms. Numerous studies have found that the activities of enzymes related to both nitrogen and phosphorus cycling in the soil were significantly affected by the application of biochar [26,27,28,50]. As shown in Figure 6, urease was negatively correlated with nitrate nitrogen, which is probably because soil urease catalyzes urea decomposition and is involved in regulating biological nitrogen metabolism [51]. Additionally, alkaline phosphatase showed a negative correlation with available phosphorus, which is probably because alkaline phosphatase can catalyze the mineralization of organophosphorus compounds (e.g., phytic acid) and is involved in regulating the biological phosphorus cycle [52]. The results of this study showed that sucrase was positively correlated with available phosphorus and negatively correlated with nitrate N, and the positive correlation with available phosphorus was stronger. These relationships can be further explained by the varying influences of corn stover biochar amendment levels on microbial community structure and function. Specifically, with increasing corn stover biochar addition, the increased abundance of Patescibacteria may enhance sucrose metabolism and organic acid secretion, facilitating phosphorus mobilization. In contrast, the suppression of nitrifying bacteria such as Nitrospirota under biochar amendment likely contributed to reduced nitrate nitrogen levels, aligning with the negative correlation with sucrase activity. Feng et al. demonstrated that the addition of biochar significantly enhanced soil enzyme activity and soil nutrient levels, and that these changes in soil nutrients and physicochemical properties influenced the inter-root soil bacterial community. The effect of high additions of biochar was greater than that of low additions of biochar [53], which was similar to the results of this study.

4. Materials and Methods

4.1. Experimental Materials

The biochar used in this study was produced from corn stalks through slow pyrolysis at 500 °C under oxygen-limited conditions for 2–3 h, provided by Henan Lize Environmental Protection Technology Co., Ltd. (Henan, China). The material was subsequently crushed and sieved through a 70-mesh sieve (0.2 mm particle size) prior to use. Its key properties were as follows: pH 9.30; organic carbon 410.96 g·kg−1; total N 8.34 g·kg−1; total P 2.34 g·kg−1; total K 15.91 g·kg−1; P2O5 5.34 g·kg−1; and K2O 19.17 g·kg−1.

4.2. Experimental Site Description

The experiments were conducted in plastic greenhouses located at the Water-saving Park, Jiangning Campus, Hohai University (31°91′ N, 118°79′ E), which lies within a north subtropical humid monsoon climate zone. The region has a mean annual temperature of 15.7 °C, with annual precipitation averaging 1072.9 mm and evaporation of 900 mm. The average annual sunshine duration is 2200 h, and the mean annual relative humidity reaches 81%. There are approximately 117.8 rainy days per year (daily rainfall ≥ 0.1 mm), and the maximum daily precipitation recorded is 299.0 mm.

4.3. Experimental Design and Treatments Application

Conducted from March to July 2020, the experiment included four treatments:
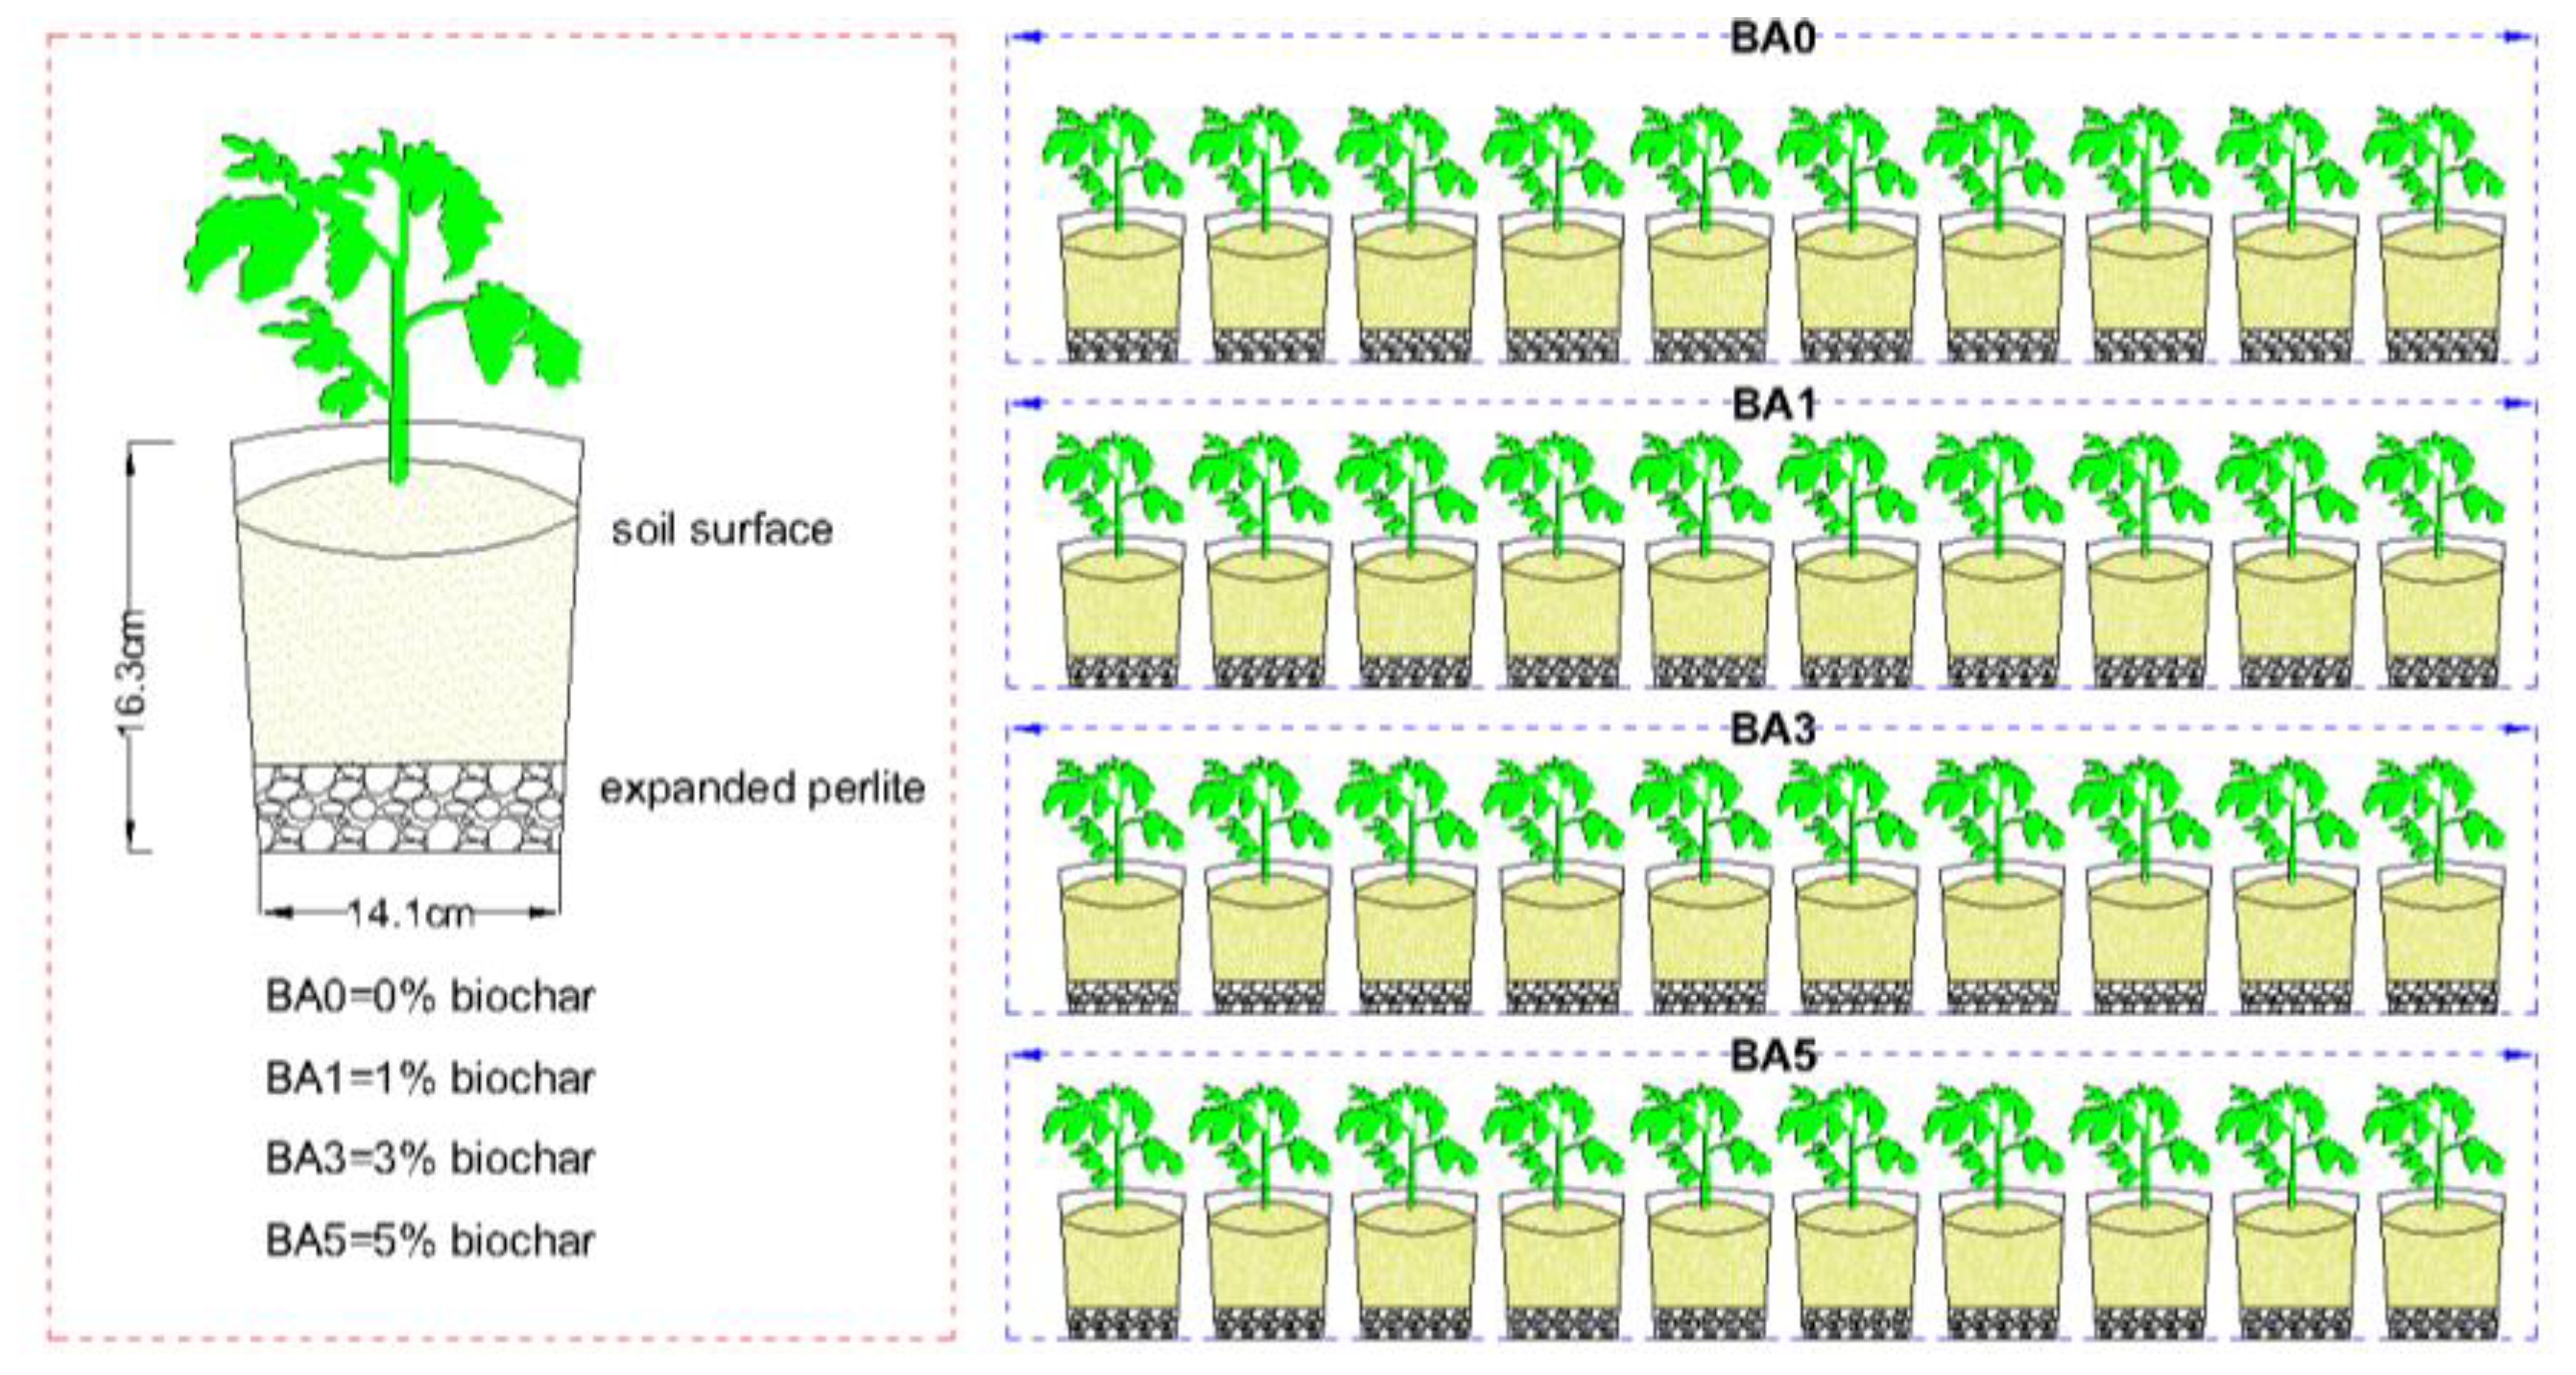
BA1 (1% biochar), BA3 (3% biochar), BA5 (5% biochar), and BA0 (biochar-free control), each with 10 replicates (Figure 7).
Soil was air-dried and sieved (≤2 mm) prior to amendment incorporation. Homogenized soil–amendment mixtures were loaded into 16.3 cm high × 14.1 cm diameter buckets (12 kg soil/barrel) over a 2 cm perlite base layer.
‘Cooperative 903’ tomato (45,000 plants·hm−2) was transplanted at the late seedling stage (one plant/bucket). Basal fertilization used 20 g of compound fertilizer (15:15:15 N:P:K) per barrel. Four fruits per inflorescence were retained, with thinning at the second-inflorescence pink stage. Routine field management was maintained.

4.4. Determination of Tomato Growth Indicators

Soil sampling was conducted after 105 days with three random replicates per treatment. Depth-specific fractions (0–2, 2–4, 4–6, 6–8, 8–10 cm) were collected, air-dried, sieved, and analyzed for physicochemical properties. The phosphomolybdenum blue color development method and an ultraviolet spectrophotometer were used to determine the content of soil effective phosphorus, and the content of nitrate nitrogen and ammoniacal nitrogen were determined by microtiter plate spectrophotometry.
The soil was collected from a depth of 0 to 10 cm for the analysis of microbial capacity and enzyme activities. Microbial sequences were amplified by PCR and analyzed by sequencing using microbial diversity amplicon sequencing. Total soil DNA was extracted using HiPure Soil DNA kit (model D3142, Guangzhou Magen Biotechnology Co., Ltd. (Guangzhou, China)). After genomic DNA was extracted from bacterial and fungal samples, the V3-V4 region of 16S rDNA (bacterial) and the ITS2 region of ITS (fungal) were amplified with specific primers with barcode, respectively, and the primer sequences are shown in Table 7.
Catalase activity was quantified via potassium permanganate titration; urease activity via sodium phenol-sodium hypochlorite colorimetry; sucrase activity via 3,5-dinitrosalicylic acid colorimetry; alkaline phosphatase activity via disodium phosphate colorimetry; and nitrate reductase activity via sulfanilamide colorimetry.
In order to eliminate the influence of the evaluation index scale on the factor loading of soil enzyme activity, this study used the soil enzyme index (SEI) to numerically synthesize and evaluate the comprehensive value of soil enzyme activity.
The formula for calculating SEI is as follows:
S E I = i = 1 n ω i × S E I ( x i   )
ω i = c i c
where ω i denotes the weight of soil enzyme activity ( i ); S E I ( x i ) denotes the value of soil enzyme affiliation; c i represents the mean correlation coefficient between soil enzyme activity ( i ) and all other soil enzyme activities; and c is the sum of the average of correlation coefficients between all soil enzyme activities.
Whether the distribution of the affiliation function was ascending or descending was determined from the inhibition or promotion of soil enzyme activities by biochar. In this study, the descending distribution function was used for soil alkaline phosphatase, the ascending distribution function was used for soil catalase, urease, and sucrase, the ascending distribution function was used for nitrate reductase biochar additions of 1% and 3% (BA1, BA3) treatments, and the descending distribution function was used for 5% biochar treatment (BA5).
S E I ( x i ) is calculated as follows:
A s c e n d i n g   d i s t r i b u t i o n   f u n c t i o n   S E I x i = x i x i   m i n x i   m a x x i   m i n
d e g e n e r a t e   d i s t r i b u t i o n   f u n c t i o n   S E I x i = x i   m a x x i x i   m a x x i   m i n
where x i denotes the soil enzyme activity; x i   m a x and x i   m i n denote the maximum and minimum values of soil enzyme activity ( i ) in the treatment, respectively.

4.5. Gray Relational Analysis Method

Gray correlation analysis quantifies inter-curve correlations by evaluating geometric shape similarity across sequences. This method measures time-series relationships through quantitative trend dynamics analysis, calculating gray correlation degrees between a reference series and comparison series. Lower correlation occurs when factor changes diverge substantially, while convergent changes yield higher correlations. Soil improvement outcomes were comprehensively evaluated using this method.
The following is the specific calculation method:
Index weight calculation (entropy weight method):
ω j = 1 e j j = 1 m 1 e j
where e j is the entropy value of the J th item.
Gray relational degree analysis:
x i j = x i j x 0 j
x i j = 1 x i j x 0 j
ξ i k = = m i n i m i n k X 0 k X i k + ρ m a x i m a x k X 0 k X i k X 0 k X i k + ρ m a x i m a x k X 0 k X i k
γ i = k = 1 n W k ξ i ( k )
where k represents the index identifier, i denotes the data sequence position, and ρ is the resolution coefficient set to 0.5. Gray correlation theory designates the reference series as the optimal standard for soil quality assessment. Therefore, increased correlation between evaluated indices and this reference series directly corresponds to improved soil quality status.

4.6. Statistical Analysis

Data processing employed Microsoft Excel 2021 and IBM SPSS Statistics 27.0, with graphical visualization using Origin 2021. Statistical analyses included univariate ANOVA with Duncan’s post hoc test (p < 0.05) and Pearson correlation analysis.

5. Conclusions

Biochar amendment effectively improved soil quality in the continuous cropping system, in a highly application-rate-dependent manner. The most integrated improvement was BA5, which significantly enhanced available phosphorus content and inhibited its vertical migration, while also reducing nitrate N content and limiting its vertical migration. In contrast, BA1 increased nitrate N but suppressed its vertical migration, whereas BA3 reduced nitrate N yet promoted its downward movement. All biochar treatments inhibited the vertical migration of ammoniacal N, though its content remained largely unaffected. Importantly, BA1 showed the highest soil enzyme activity index (SEI), indicating enhanced biochemical functionality. Biochar application also modified microbial community composition, and correlation analyses confirmed that soil microorganisms and enzymes played crucial roles in mediating nitrogen and phosphorus transformation. To facilitate practical application, it is recommended that biochar be applied as a basal amendment at a rate of 5% and thoroughly incorporated into the top 15–20 cm soil layer before planting. Attention should be paid to soil pH monitoring before large-scale application, as excessive biochar may elevate pH in alkaline-sensitive soils.
Nevertheless, this study was conducted solely on yellow-brown soil under tomato monoculture, and the physicochemical properties of the biochar were not characterized, limiting mechanistic insight into structure–function relationships. Future research should therefore involve multi-site long-term trials across different soil types and cropping systems and employ detailed biochar characterization to elucidate the mechanisms underlying biochar-induced improvements in soil nutrient cycling and microbial ecology.

Author Contributions

Conceptualization, J.Z. and T.C.; methodology, B.L.; software, B.L. and Q.W.; validation, B.L. and Q.W.; formal analysis, H.Z.; investigation, D.Z.; data curation, Q.W. writing—original draft preparation, B.L.; writing—review and editing, B.L.; supervision, J.Z. and T.C.; project administration, J.Z.; funding acquisition, J.Z. All authors have read and agreed to the published version of the manuscript.

Funding

This research received no external funding.

Data Availability Statement

The original contributions presented in this study are included in the article. Further inquiries can be directed to the corresponding author(s).

Conflicts of Interest

The authors declare no conflict of interest.

References

  1. Ye, J.Y.; Tian, W.H.; Jin, C.W. Nitrogen in plants: From nutrition to the modulation of abiotic stress adaptation. Stress Biol. 2022, 2, 4. [Google Scholar] [CrossRef]
  2. Ul Islam, M.; Ibrahim, M.M.; Liu, Y.; Jiang, F.H.; Islam, M.M.; Halder, M.; Hou, E.Q. Phosphorus fertilization is essential for sustaining crop yields on converted natural ecosystems: A global meta-analysis. Soil Tillage Res. 2025, 254, 106756. [Google Scholar] [CrossRef]
  3. Babin, D.; Deubel, A.; Jacquiod, S.; Sorensen, S.J.; Geistlinger, J.; Grosch, R.; Smalla, K. Impact of long-term agricultural management practices on soil prokaryotic communities. Soil Biol. Biochem. 2019, 129, 17–28. [Google Scholar] [CrossRef]
  4. Allard, S.M.; Walsh, C.S.; Wallis, A.E.; Ottesen, A.R.; Brown, E.W.; Micallef, S.A. Solanum lycopersicum (tomato) hosts robust phyllosphere and rhizosphere bacterial communities when grown in soil amended with various organic and synthetic fertilizers. Sci. Total Environ. 2016, 573, 555–563. [Google Scholar] [CrossRef]
  5. Guo, Y.H.; Wang, H.; Zhang, W.; Chen, B.; Song, D. Sustainability evaluation of protected vegetables production in China based on emergy analysis. J. Clean. Prod. 2023, 388, 135928. [Google Scholar] [CrossRef]
  6. Wang, G.F.; Ma, Y.; Chenia, H.Y.; Govinden, R.; Luo, J.; Ren, G.D. Biochar-Mediated Control of Phytophthora Blight of Pepper Is Closely Related to the Improvement of the Rhizosphere Fungal Community. Front. Microbiol. 2020, 11, 1427. [Google Scholar] [CrossRef]
  7. Zhao, W.; Cui, Y.T.; Sun, X.P.; Wang, H.Y.; Teng, X.H. Corn stover biochar increased edible safety of spinach by reducing the migration of mercury from soil to spinach. Sci. Total Environ. 2021, 758, 143883. [Google Scholar] [CrossRef]
  8. Fuertes, A.B.; Arbestain, M.C.; Sevilla, M.; Maciá-Agulló, J.A.; Fiol, S.; López, R.; Smernik, R.J.; Aitkenhead, W.P.; Arce, F.; Macias, F. Chemical and structural properties of carbonaceous products obtained by pyrolysis and hydrothermal carbonisation of corn stover. Aust. J. Soil Res. 2010, 48, 618–626. [Google Scholar] [CrossRef]
  9. Yang, Y.; Sun, K.; Liu, J.; Chen, Y.L.; Han, L.F. Changes in soil properties and CO2 emissions after biochar addition: Role of pyrolysis temperature and aging. Sci. Total Environ. 2022, 839, 156333. [Google Scholar] [CrossRef]
  10. Kamau, S.; Karanja, N.K.; Ayuke, F.O.; Lehmann, J. Short-term influence of biochar and fertilizer-biochar blends on soil nutrients, fauna and maize growth. Biol. Fertil. Soils 2019, 55, 661–673. [Google Scholar] [CrossRef]
  11. Li, H.X.; Li, Y.X.; Xu, Y.; Lu, X.Q. Biochar phosphorus fertilizer effects on soil phosphorus availability. Chemosphere 2020, 244, 125471. [Google Scholar] [CrossRef]
  12. Yang, L.; Wu, Y.C.; Wang, Y.C.; An, W.Q.; Jin, J.; Sun, K.; Wang, X.K. Effects of biochar addition on the abundance, speciation, availability, and leaching loss of soil phosphorus. Sci. Total Environ. 2021, 758, 143657. [Google Scholar] [CrossRef] [PubMed]
  13. Duan, P.P.; Zhang, X.; Zhang, Q.Q.; Wu, Z.; Xiong, Z.Q. Field-aged biochar stimulated N2O production from greenhouse vegetable production soils by nitrification and denitrification. Sci. Total Environ. 2018, 642, 1303–1310. [Google Scholar] [CrossRef] [PubMed]
  14. Brtnicky, M.; Mustafa, A.; Hammerschmiedt, T.; Kintl, A.; Trakal, L.; Beesley, L.; Ryant, P.; Omara-Ojungu, C.; Baltazar, T.; Holatko, J. Pre-activated biochar by fertilizers mitigates nutrient leaching and stimulates soil microbial activity. Chem. Biol. Technol. Agric. 2023, 10, 57. [Google Scholar] [CrossRef]
  15. Liang, X.Q.; Ji, Y.J.; He, M.M.; Su, M.M.; Liu, C.L.; Tian, G.M. Simple N Balance Assessment for Optimizing the Biochar Amendment Level in Paddy Soils. Commun. Soil Sci. Plant Anal. 2014, 45, 1247–1258. [Google Scholar] [CrossRef]
  16. Yang, C.D.; Lu, S.G. Straw and straw biochar differently affect phosphorus availability, enzyme activity and microbial functional genes in an Ultisol. Sci. Total Environ. 2022, 805, 150325. [Google Scholar] [CrossRef]
  17. Xu, W.H.; Whitman, W.B.; Gundale, M.J.; Chien, C.C.; Chiu, C.Y. Functional response of the soil microbial community to biochar applications. Glob. Change Biol. Bioenergy 2021, 13, 269–281. [Google Scholar] [CrossRef]
  18. Sarauer, J.L.; Coleman, M.D. Microbial communities of biochar amended forest soils in northwestern USA. Appl. Soil Ecol. 2023, 188, 104875. [Google Scholar] [CrossRef]
  19. Dai, Z.M.; Liu, G.F.; Chen, H.H.; Chen, C.R.; Wang, J.K.; Ai, S.Y.; Wei, D.; Li, D.M.; Ma, B.; Tang, C.X.; et al. Long-term nutrient inputs shift soil microbial functional profiles of phosphorus cycling in diverse agroecosystems. ISME J. 2020, 14, 757–770. [Google Scholar] [CrossRef]
  20. Xu, Y.X.; He, L.L.; Chen, J.Y.; Lyu, H.; Wang, Y.Y.; Yang, L.; Yang, S.M.; Liu, Y.X. Long-Term Successive Biochar Amendments Alter the Composition and α-Diversity of Bacterial Community of Paddy Soil in Rice-Wheat Rotation. Front. Environ. Sci. 2022, 10, 921766. [Google Scholar] [CrossRef]
  21. Khodadad, C.L.M.; Zimmerman, A.R.; Green, S.J.; Uthandi, S.; Foster, J.S. Taxa-specific changes in soil microbial community composition induced by pyrogenic carbon amendments. Soil Biol. Biochem. 2011, 43, 385–392. [Google Scholar] [CrossRef]
  22. Vanek, S.J.; Lehmann, J. Phosphorus availability to beans via interactions between mycorrhizas and biochar. Plant Soil 2015, 395, 105–123. [Google Scholar] [CrossRef]
  23. Wang, X.; Guo, G.; Zheng, R.; Zhong, M.; Zhu, Y. Effect of biochar on abundance of N-related functional microbial communities in degraded greenhouse soil. Acta Pedol. Sin. 2013, 50, 624–631. [Google Scholar]
  24. Zhao, J.Y.; Qiu, Y.B.; Yi, F.; Li, J.X.; Wang, X.Y.; Fu, Q.; Fu, X.H.; Yao, Z.Y.; Dai, Z.M.; Qiu, Y.P.; et al. Biochar dose-dependent impacts on soil bacterial and fungal diversity across the globe. Sci. Total Environ. 2024, 930, 172509. [Google Scholar] [CrossRef]
  25. Elad, Y.; Cytryn, E.; Harel, Y.M.; Lew, B.; Graber, E.R. The Biochar Effect: Plant resistance to biotic stresses. Phytopathol. Mediterr. 2011, 50, 335–349. [Google Scholar]
  26. Zhu, L.X.; Xiao, Q.; Cheng, H.Y.; Shi, B.J.; Shen, Y.F.; Li, S.Q. Seasonal dynamics of soil microbial activity after biochar addition in a dryland maize field in North-Western China. Ecol. Eng. 2017, 104, 141–149. [Google Scholar] [CrossRef]
  27. Sinsabaugh, R.L.; Shah, J.J.F. Ecoenzymatic Stoichiometry and Ecological Theory. Annu. Rev. Ecol. Evol. Syst. 2012, 43, 313–343. [Google Scholar] [CrossRef]
  28. Liao, N.; Li, Q.; Zhang, W.; Zhou, G.W.; Ma, L.J.; Min, W.; Ye, J.; Hou, Z.N. Effects of biochar on soil microbial community composition and activity in drip-irrigated desert soil. Eur. J. Soil Biol. 2016, 72, 27–34. [Google Scholar] [CrossRef]
  29. Khadem, A.; Raiesi, F. Response of soil alkaline phosphatase to biochar amendments: Changes in kinetic and thermodynamic characteristics. Geoderma 2019, 337, 44–54. [Google Scholar] [CrossRef]
  30. Liu, Y.; Ali, A.; Su, J.F.; Li, K.; Hu, R.Z.; Wang, Z. Microbial-induced calcium carbonate precipitation: Influencing factors, nucleation pathways, and application in waste water remediation. Sci. Total Environ. 2023, 860, 160439. [Google Scholar] [CrossRef]
  31. Pokharel, P.; Ma, Z.L.; Chang, S.X. Biochar increases soil microbial biomass with changes in extra- and intracellular enzyme activities: A global meta-analysis. Biochar 2020, 2, 65–79, Erratum in Biochar 2021, 3, 715. [Google Scholar] [CrossRef]
  32. Chintala, R.; Schumacher, T.E.; McDonald, L.M.; Clay, D.E.; Malo, D.D.; Papiernik, S.K.; Clay, S.A.; Julson, J.L. Phosphorus Sorption and Availability from Biochars and Soil/Biochar Mixtures. CLEAN-Soil Air Water 2014, 42, 626–634. [Google Scholar] [CrossRef]
  33. Gao, S.; DeLuca, T.H. Rangeland application of biochar and rotational grazing interact to influence soil and plant nutrient dynamics. Geoderma 2022, 408, 115572. [Google Scholar] [CrossRef]
  34. Troy, S.M.; Lawlor, P.G.; Flynn, C.J.O.; Healy, M.G. The Impact of Biochar Addition on Nutrient Leaching and Soil Properties from Tillage Soil Amended with Pig Manure. Water Air Soil Pollut. 2014, 225, 1900. [Google Scholar] [CrossRef]
  35. Sachdeva, V.; Hussain, N.; Husk, B.R.; Whalen, J.K. Biochar-induced soil stability influences phosphorus retention in a temperate agricultural soil. Geoderma 2019, 351, 71–75. [Google Scholar] [CrossRef]
  36. Peng, Y.T.; Sun, Y.Q.; Fan, B.Q.; Zhang, S.; Bolan, N.S.; Chen, Q.; Tsang, D.C.W. Fe/Al (hydr)oxides engineered biochar for reducing phosphorus leaching from a fertile calcareous soil. J. Clean. Prod. 2021, 279, 123877. [Google Scholar] [CrossRef]
  37. Lehmann, J.; Rillig, M.C.; Thies, J.; Masiello, C.A.; Hockaday, W.C.; Crowley, D. Biochar effects on soil biota—A review. Soil Biol. Biochem. 2011, 43, 1812–1836. [Google Scholar] [CrossRef]
  38. Shaaban, M.; Van Zwieten, L.; Bashir, S.; Younas, A.; Núñez-Delgado, A.; Chhajro, M.A.; Kubar, K.A.; Ali, U.; Rana, M.S.; Mehmood, M.A.; et al. A concise review of biochar application to agricultural soils to improve soil conditions and fight pollution. J. Environ. Manag. 2018, 228, 429–440. [Google Scholar] [CrossRef]
  39. Chen, M.; Wang, F.; Zhang, D.-L.; Yi, W.-M. Effect of Biochar Structure on Adsorption Characteristics of Ammonia Nitrogen. Huanjing Kexue 2019, 40, 5421–5429. [Google Scholar] [CrossRef]
  40. Gai, X.; Liu, H.; Zhai, L.; Ren, T.; Wang, H. Temporal fluctuations of impacts of corn-stover biochar on nutrients and microbial community structure in a neutral paddy soil. J. Agro-Environ. Sci. 2016, 35, 719–728. [Google Scholar]
  41. Zhang, Y.; Wu, T.; Zhao, J.; Liu, S.; Zhang, H. Effect of biochar amendment on bacterial community structure and diversity in straw-amended soils. Acta Sci. Circumstantiae 2017, 37, 712–720. [Google Scholar]
  42. Rillig, M.C.; Wagner, M.; Salem, M.; Antunes, P.M.; George, C.; Ramke, H.G.; Titirici, M.M.; Antonietti, M. Material derived from hydrothermal carbonization: Effects on plant growth and arbuscular mycorrhiza. Appl. Soil Ecol. 2010, 45, 238–242. [Google Scholar] [CrossRef]
  43. Chen, Z.B.; Gao, X.; Wang, D.B.; Guo, L.; Wang, D.K.; Xu, S.G. Effects of Different Biochar Application Rates on Rhizosphere Soil Microbial Diversity of Tobacco. Acta Agric. Boreali-Sin. 2018, 33, 224–232. [Google Scholar]
  44. Chen, J.; Liu, X.; Li, L.; Zheng, J.; Qu, J.; Zheng, J.; Zhang, X.; Pan, G. Consistent increase in abundance and diversity but variable change in community composition of bacteria in topsoil of rice paddy under short term biochar treatment across three sites from South China. Appl. Soil Ecol. 2015, 91, 68–79. [Google Scholar] [CrossRef]
  45. Wang, N.; Chang, Z.Z.; Xue, X.M.; Yu, J.G.; Shi, X.X.; Ma, L.Q.; Li, H.B. Biochar decreases nitrogen oxide and enhances methane emissions via altering microbial community composition of anaerobic paddy soil. Sci. Total Environ. 2017, 581–582, 689–696. [Google Scholar] [CrossRef]
  46. Kolton, M.; Harel, Y.M.; Pasternak, Z.; Graber, E.R.; Elad, Y.; Cytryn, E. Impact of Biochar Application to Soil on the Root-Associated Bacterial Community Structure of Fully Developed Greenhouse Pepper Plants. Appl. Environ. Microbiol. 2011, 77, 4924–4930. [Google Scholar] [CrossRef]
  47. Gul, S.; Whalen, J.K.; Thomas, B.W.; Sachdeva, V.; Deng, H.Y. Physico-chemical properties and microbial responses in biochar-amended soils: Mechanisms and future directions. Agric. Ecosyst. Environ. 2015, 206, 46–59. [Google Scholar] [CrossRef]
  48. Ollivier, J.; Töwe, S.; Bannert, A.; Hai, B.; Kastl, E.M.; Meyer, A.; Su, M.X.; Kleineidam, K.; Schloter, M. Nitrogen turnover in soil and global change. FEMS Microbiol. Ecol. 2011, 78, 3–16. [Google Scholar] [CrossRef]
  49. Berendsen, R.L.; Pieterse, C.M.J.; Bakker, P. The rhizosphere microbiome and plant health. Trends Plant Sci. 2012, 17, 478–486. [Google Scholar] [CrossRef] [PubMed]
  50. Bailey, V.L.; Fansler, S.J.; Smith, J.L.; Bolton, H. Reconciling apparent variability in effects of biochar amendment on soil enzyme activities by assay optimization. Soil Biol. Biochem. 2011, 43, 296–301. [Google Scholar] [CrossRef]
  51. He, X.L.; Yin, B.Y.; Zhang, J.R.; Zhou, S.S.; Li, Z.Y.; Zhang, X.Y.; Xu, J.Z.; Liang, B.W. Exogenous melatonin alleviates apple replant disease by regulating rhizosphere soil microbial community structure and nitrogen metabolism. Sci. Total Environ. 2023, 884, 163830. [Google Scholar] [CrossRef] [PubMed]
  52. Shi, J.Y.; Gong, J.R.; Li, X.B.; Zhang, Z.H.; Zhang, W.Y.; Li, Y.; Song, L.Y.; Zhang, S.Q.; Dong, J.J.; Baoyin, T.T. Phosphorus application promoted the sequestration of orthophosphate within soil microorganisms and regulated the soil solution P supply in a temperate grassland in northern China: A 31P NMR study. Soil Tillage Res. 2023, 227, 105612. [Google Scholar] [CrossRef]
  53. Feng, H.L.; Xu, C.S.; He, H.H.; Zeng, Q.; Liu, G.S. Effect of Biochar on Soil Enzyme Activity & the Bacterial Community and Its Mechanism. Huanjing Kexue 2021, 42, 422–432. [Google Scholar] [PubMed]
Figure 1. Vertical migration changes in soil-available phosphorus, nitrate N, and ammonium N. (a) Available phosphorus; (b) nitrate N; (c) ammonium N.
Plants 14 02787 g001
Figure 2. Soil field capacity as influenced by different biochar amendment rates. Values are means. Different letters indicate significant differences (p < 0.05).
Plants 14 02787 g002
Figure 3. Effect of biochar on bacterial and fungal phyla in soil: (a) bacterial; (b) fungi.
Plants 14 02787 g003
Figure 4. String diagram of phylum bacteria and phylum fungi: (a) bacteria; (b) fungi.
Plants 14 02787 g004
Figure 5. Dominant soil microbiome abundance (%): (a) bacteria; (b) fungi. Note: The lowercase letters indicate the significance analysis results of four treatments in the greenhouse (p < 0.05); Where mark “*” indicates a significant difference (p < 0.05) and “**” indicates a highly significant difference (p < 0.01) compared to the BA0 treatment.
Plants 14 02787 g005
Figure 6. Heat map for correlation analysis. Note: p < 0.01 means the two are correlated, and the x in the figure means p > 0.01, not correlated. AP stands for available phosphorus; N-N stands for soil nitrate N; A-N stands for soil ammonium N; CA stands for catalase enzyme; UR stands for urease enzyme; SU stands for sucrase; ALP stands for alkaline phosphatase; NR stands for nitrate reductase; PAT stands for Patescibacteria; PRO stands for Proteobacteria; GEM stands for Gemmatimonadota; BAC stands for Bacteroidota; CHL stands for Chloroflexi; ACT stands for Actinobacteriota; ACI stands for Acidobateriota; PLA stands for Planctomycetota; NIT stands for Nitrospirota; NAN stands for Nanoarchaeota; ASC stands for Ascomycota; CIL stands for Ciliophora; and CHL stands for Chlorophyta.
Plants 14 02787 g006
Figure 7. Experimental setup diagram.
Plants 14 02787 g007
Table 1. Effect of different treatments on the mean concentrations of available phosphorus, nitrate N, and ammonium N in soil.
TreatmentAvailable Phosphorus
(mg·kg−1)
Nitrate N
(mg·kg−1)
Ammonium N
(mg·kg−1)
BA01.2 ± 0.0060 b15 ± 1.2 a0.042 ± 0.0050 a
BA11.4 ± 0.043 a16 ± 0.11 a0.035 ± 0.0010 a
BA31.4 ± 0.021 a12 ± 0.15 b0.042 ± 0.011 a
BA51.4 ± 0.034 a11 ± 0.13 b0.046 ± 0.0040 a
BA01.2 ± 0.0060 b15 ± 1.2 a0.042 ± 0.0050 a
Note: values represent mean ± Standard Deviation. The lowercase letters indicate the significance analysis results of four treatments in the greenhouse; different letters in the same column represent significant differences (p < 0.05). BA0, BA1, BA3, and BA5 stand for no biochar, 1% biochar, 3% biochar, and 5% biochar.
Table 2. Comparison of different enzyme activities under different biochar addition treatments (mg·g−1·24 h−1).
TreatmentCatalase EnzymeUrease EnzymeSucraseAlkaline PhosphataseNitrate Reductase
BA06.32 ± 0.08 b0.24 ± 0.02 b43.00 ± 0.63 c0.38 ± 0.01 a0.45 ± 0.02 b
BA16.45 ± 0.07 ab0.24 ± 0.01 b54.25 ± 2.12 b **0.29 ± 0.02 b **0.57 ± 0.03 a
BA36.51 ± 0.29 ab0.27 ± 0.01 b56.55 ± 1.00 b **0.26 ± 0.02 c **0.59 ± 0.07 a *
BA56.78 ± 0.14 a *0.35 ± 0.02 a **68.22 ± 1.20 a **0.25 ± 0.02 c **0.27 ± 0.04 c **
Note: values represent mean ± Standard Deviation. The lowercase letters indicate the significance analysis results of four treatments in the greenhouse; different letters in the same column represent significant differences (p < 0.05). BA0, BA1, BA3, and BA5 stand for no biochar, 1% biochar, 3% biochar, and 5% biochar, where mark “*” indicates a significant difference (p < 0.05) and “**” indicates a highly significant difference (p < 0.01) compared to the BA0 treatment.
Table 3. Correlation coefficients and weighting coefficients of soil enzyme activities under different biochar addition treatments.
IndicatorsCatalase
Enzyme
Urease
Enzyme
SucraseAlkaline PhosphataseNitrate
Reductase
catalase enzyme1.00
urease enzyme0.831.00
sucrase0.690.821.00
alkaline phosphatase0.490.550.861.00
nitrate reductase0.460.780.490.081.00
mean value of correlation coefficient0.620.590.720.500.45
weighting factor0.280.270.320.220.20
Table 4. Affiliation values of soil enzyme activities and soil enzyme index under different biochar addition treatments.
TreatmentSEI Affiliation ValueSoil Enzyme Index (SEI)Soil Enzyme Index Ranking
Catalase EnzymeUrease
Enzyme
SucraseAlkaline PhosphataseNitrate
Reductase
BA00.350.390.370.380.410.494
BA10.560.390.500.300.650.621
BA30.370.420.580.220.390.533
BA50.380.290.590.430.680.612
Table 5. Indicator weighting data.
Soil IndexEjWeight
AP0.90220.0739
N-N0.85940.1062
A-N0.86040.1054
Patescibacteria0.90240.0737
Gemmatimonadota0.92940.0533
Bacteroidota0.91240.0662
Chloroflexi0.92430.0572
Acidobateriota0.95390.0348
Nitrospirota0.95060.0373
Ascomycota0.93830.0466
Ciliophora0.81530.1395
Urease enzyme0.93700.0476
Sucrase0.88020.0904
Alkaline phosphatase0.90990.0680
Table 6. Weighted correlation coefficients of soil indicators.
TreatmentWGCDWO
BA00.81234
BA10.86662
BA30.86383
BA50.87471
Table 7. Amplification primers and reaction conditions of PCR.
TypesSequencing RegionName of PrimerPrimer Sequence (5′-3′)
16S bacteriumV3-V4341FCCTACGGGNGGCWGCAG
806RGGACTACHVGGGTATCTAAT
ITS FungalITS2ITS3_KYO2GATGAAGAACGYAGYRAA
ITS4TCCTCCGCTTATTGATATGC
Disclaimer/Publisher’s Note: The statements, opinions and data contained in all publications are solely those of the individual author(s) and contributor(s) and not of MDPI and/or the editor(s). MDPI and/or the editor(s) disclaim responsibility for any injury to people or property resulting from any ideas, methods, instructions or products referred to in the content.