Article

Effect of Mosses and Long-Term N Addition on δ13C and δ18O Values of Respired CO2 Under a Temperate Forest Floor

by
Xingkai Xu
1,2,*,
Yuhua Kong
3,
Erpeng Feng
1,3,
Jin Yue
1,
Weiguo Cheng
4,
Dmitriy Khoroshaev
5 and
Sergey Kivalov
5
1
State Key Laboratory of Atmospheric Environment and Extreme Meteorology, Institute of Atmospheric Physics, Chinese Academy of Sciences, Beijing 100029, China
2
Department of Atmospheric Chemistry and Environmental Science, College of Earth and Planetary Sciences, University of Chinese Academy of Sciences, Beijing 100049, China
3
College of Forestry, Henan Agricultural University, Zhengzhou 450046, China
4
Faculty of Agriculture, Yamagata University, Tsuruoka 997-8555, Japan
5
Institute of Physicochemical and Biological Problems in Soil Science, Russian Academy of Sciences, Pushchino 142290, Russia
*
Author to whom correspondence should be addressed.
Plants 2025, 14(17), 2707; https://doi.org/10.3390/plants14172707
Submission received: 8 July 2025 / Revised: 20 August 2025 / Accepted: 24 August 2025 / Published: 31 August 2025
(This article belongs to the Section Plant–Soil Interactions)

Abstract

Static chambers combined with isotopic (δ13C and δ18O) and flux (CO2 and CH4) measurements were applied, to explore the effects of mosses and long-term nitrogen (N) addition at two levels (22.5 and 45 kg N ha−1 yr−1) on δ13C and δ18O values of respired CO2 across three autumn seasons under a temperate forest (northeastern China) and their relationships with CO2 and CH4 fluxes and with soil properties. Mosses generally depleted δ13C and enriched δ18O in respired CO2, likely by altering soil microenvironments or/and substrate use. The effect of N addition on the δ13C and δ18O values of respired CO2 varied with years, and its interaction with mosses had no effects on the isotopic values. The removal of mosses decreased CO2 fluxes and the addition of N at a high dose increased CH4 fluxes. The δ13C and δ18O values of respired CO2 decreased at soil moisture levels below and above an optimum, and the moisture-dependent effect became more pronounced for the δ18O than for the δ13C. The results of structural equation modeling showed that 70% of the variability of δ13C values of respired CO2. was accounted for by the N addition, mosses, soil moisture, and CH4 and CO2 fluxes, while only 22% of the variability of δ18O values of respired CO2 was explained by these factors. The results highlight that moss–soil interaction drives the isotopic shifts, which is modulated by N availability. Soil moisture regulates the δ18O values of respired CO2, but its drivers remain poorly understood. Future work should target processes influencing the δ18O shifts of respired CO2 and deep soil property interactions.

1. Introduction

Within terrestrial ecosystems, respiration and photosynthesis have contrasting impacts on δ13C and δ18O values of atmospheric carbon dioxide (CO2), via the discrimination against 13CO2 and C18O16O [1,2,3]. In the last three decades, many previous studies have documented that climate (precipitation, temperature, and light), vegetation types, and soil properties can significantly affect atmospheric CO2 concentration within terrestrial ecosystems and the δ13C and δ18O values of ecosystem-respired CO2 on time scales [1,4,5,6,7,8,9,10]. Unfortunately, due to a significant scarcity of site-specific δ13C and δ18O measurements for soil-respired CO2 across diverse terrestrial ecosystems [8,9,11,12,13,14], the specific driving factors controlling both δ13C and δ18O values of CO2 released from soil respiration, especially beneath moss-dominated forest floors, remain poorly understood [3,11,15,16,17,18,19].
As a species that prefers shade and dampness, bryophytes are widely distributed under forest floors in different climate zones around the world. It has been shown that the carbon (C) photosynthetically fixed by the forest floor moss species depends on different tree canopies and accounts for approximately 5–50% of gross primary productivity by tree canopy [20,21], probably affecting the soil C cycle and the isotopic discrimination of respired CO2. Unlike vascular plants on parallel evolutionary lines, mosses are characterized by the lack of stomata in moss photosynthetic tissues, thus resulting in a major limitation to CO2 diffusion in mosses at water content levels above an optimum [22,23]. There was a parabolic relationship between the C assimilation rates of mosses and moss water contents under laboratory conditions, with a maximum rate at an optimum moisture [15]. The conductance to water in mosses would increase with water content below an optimum and then decreased above the optimum moisture. Hence, the response of mosses to ambient water content would have important impacts on the discrimination against 13CO2 and C18O16O [15], affecting the changes in the δ13C and δ18O values of respired CO2 on time scales. There was a significant and negative correlation between δ13C values of CO2 released from forest ecosystem respiration and soil respiration and soil moisture contents at the depth of 40 cm in the Pacific Northwest of North America [24]. Pataki et al. reported that the average δ13C values of forest and grassland ecosystem respiration across North and South America had a parabolic relationship with the mean annual precipitation, with a minimum at approximately 2100 mm [4]. Ometto et al. showed that the δ18O values of respired CO2 in forest and pasture ecosystems were generally more depleted during the wet than during the dry seasons over the year [6]. These studies mostly focused on the changes in the δ13C and δ18O values of CO2 released from forest ecosystem respiration under varying moisture conditions, along with less attention under moss-dominated forest floors. Due to the lack of stomata in mosses, the responses of moss C assimilation and moss respiration to varying moisture levels are different from those in vascular plants, indicating that the responses of the carbon and oxygen isotopic discrimination to increased water availability would be in contrast to those observed in vascular plants [23]. More importantly, the presence of mosses has an important effect on soil nutrients and soil organic matter turnover in forest ecosystems via its biological N fixation and the leakage of moss photosynthates [21,25,26,27,28], which can in turn affect the discrimination against 13CO2 and C18O16O during respiration in the moss–soil continuum [11,15,16]. Unfortunately, to date there has been limited information about the responses of δ13C and δ18O signatures of respired CO2 in the presence and absence of mosses to soil moisture contents under well-drained forest floors [11,16]. In this study, we want to explore whether δ13C and δ18O values of CO2 released from the soil–moss continuum under well-drained forest floors would have a maximum at an optimum moisture level, like the moss C assimilation rates versus moss water contents relationship.
With the increase in anthropogenic activities and nitrogen (N) fertilizer usage, the global atmospheric N deposition has increased to 105 Tg N yr−1 [29,30], which will inevitably lead to the intensification of atmospheric N input into forest ecosystems. This will, in turn, profoundly affect the key processes of forest underground C and N cycles, partly via the function of mosses. The enhanced atmospheric N deposition and/or the addition of extraneous N, especially at high doses for a long-term duration, can have negative impacts on the characteristics of mosses such as biological N fixation [31,32] and the growth of mosses [33,34,35,36,37,38] in terrestrial ecosystems, which will, in turn, affect the discrimination against 13CO2 and C18O16O during photosynthesis and respiration. Following the surplus N input, the leakage of moss photosynthates may decrease with decreasing C assimilation, probably affecting soil C availability and the moss-mediated microbial decomposition of soil organic C. Based on a coupling method for a flow bioreactor and stable carbon isotope analyzer, Min et al. [17] pointed out that carbon availability can affect microbial respiration and microbial C use efficiency, which in turn affects the discrimination against 13CO2 and C18O16O during microbial C assimilation and microbial respiration. Furthermore, the decrease in soil pH [39] and easily decomposable components of soil organic C in forest ecosystems [40] following the long-term increased N input would lead to shifts in the δ13C and δ18O values of CO2 released from microbial respiration. Additionally, atmospheric methane (CH4) uptake under forest floors would be limited upon N addition [41,42], so that CO2 derived from CH4 oxidation can partly contribute to the changes in the δ13C values of CO2 accumulated during the opaque chamber closure period due to natural biogenic CH4 sources with an average δ13C value of approximately –63.0‰ [43]. Hence, the negative impacts of increased N input on the growth of mosses [33,34,35,36,37,38] and its N-fixing capacity [31,32], along with the following changes in soil properties (e.g., decreased C availability and low soil pH) and CH4 uptake [39,40,41,44], would have impacts on the δ13C and δ18O values of CO2 released from the soil–moss continuum under forest floors. Here, we propose that the presence of mosses, changes in soil properties, and CO2 and CH4 fluxes under the context of long-term N input can affect the changes in the δ13C and δ18O values of CO2 released beneath forest floors.
The objectives of this study are to explore the effect of mosses and N addition on the δ13C and δ18O values of CO2 released from temperate forest floors, using a long-term N manipulation experimental platform, and the main driving factors by considering CO2 and CH4 fluxes and soil properties. The results will help improve the understanding of how the moss–soil interaction drives the isotopic shifts of CO2 released from well-drained forest floors under the context of increased atmospheric N deposition.

2. Materials and Methods

2.1. Description of Study Site

The experiment was conducted on a gentle slope portion in a secondary mixed deciduous forest near the National Research Station of Changbai Mountain Forest Ecosystems (42°24′ N and 128°6′ E), at the foot of the Changbai mountains, northeastern China. The dominant trees of this forest are white birch (Betula platyphylla Suk.) and mountain poplar (Populus davidiana Dode), mostly >70 years old, and its stand density is 1402 stem ha−1, with a tree canopy coverage of approximately 66% [45]. Under the secondary forest stand, mosses are widely distributed around the base of tree trunks and beneath a forest floor mostly covered with a small amount of litter. The dominant species of mosses in the forest understory bottom layer include Haplocladium microphyllum (Hedw.) Broth., Heterophyllium affine Fleisch., and Pylaisia polyantha (Hedw.) Schimp. The annual mean temperature is approximately 4.1 °C, and annual mean rainfall is approximately 770 mm in the recent two decades, with more than 80% rainfall from May to October. The temperate forest soil is an andosol, with a <2 cm aboveground litter layer and approximately 10 cm depth of A layer. Soil total organic C and total N contents were 56.8 mg C g−1 and 4.5 mg N g−1, respectively. The bulk density of surface soil at 10 cm depth was approximately 0.96 g cm−3. The soil texture is that of silty loamy soil according to USDA-NRCS soil texture classes. The contents of sandy, silt, and clay were 22.9%, 75.9%, and 1.2%, respectively.

2.2. Layout of Field Experiment

This study was carried out in the long-term N simulation experimental measurement platform in the forest stand, which was started in October 2010 to measure soil greenhouse gas (GHG) fluxes. The long-term N simulation experiment included the addition of ammonium chloride at low and high doses (22.5 and 45 kg N ha yr−1, namely, low N and high N, respectively) and a control without artificial N addition. The low amount of added N corresponded to twice the dissolved total N input via natural throughfall under the forest stand on an annual scale. Within the long-term N simulation experiment, the effects of litter removal and root removal via trenching and their combinations with N addition on soil GHG fluxes were measured annually. Each experimental treatment had four independent plots with an area of 2 m × 8 m, and all plots were randomly interspersed, and separated mostly by more than 15 m wide buffer strips. The amount of added N was equally sprayed on the N-treated experimental plots monthly during the growing season (from May to October) each year, and an equal amount of water (10 L) was added to the control plots. Due to the removal of litter and grasses each year, mosses were distributed on the ground in the litter-free experimental plots. To study whether and how the presence of mosses in combination with the long-term N addition has impacts on the δ13C and δ18O signatures of respired CO2, following 9 years of N additions, measurements of δ13C and δ18O values of respired CO2 were performed in the autumn seasons of 2019, 2021, and 2024 in the litter-free experimental plots using soil collars with and without mosses.

2.3. Measurements of δ13C and δ18O Values of Respired CO2 as Well as CO2 and CH4 Fluxes

In each litter-free experimental plot, two paired UPVC (unplasticized polyvinyl chloride) collars (20 cm in diameter and 20 cm in height) were inserted into the soil at approximately 7 cm depth and placed permanently in the field with and without moss cover, for measurements of δ13C and δ18O values of respired CO2 as well as CO2 and CH4 fluxes. There were eight paired UPVC collars in total in each treatment. In the autumn seasons of 2019, 2021, and 2024, static chamber equipment was once used to collect gas samples using air-tight 100 mL syringes and 300 mL air-tight gas bags (NDEV41-0.3, Dalian Delin Gas Packing Co., Ltd., Dalian, China) at regular closure intervals (e.g., 0, 5, and 10 min, depending on the intensity of CO2 flux) in each experimental plot [46]. Within one week after gas sampling, a CO2 isotope spectrum analyzer (CCIA-38d-EP, Los Research Inc., Fremont, CA, USA) with a manual injection model was applied to determine CO2 concentration and its 13C/12C and 18O/16O isotopic ratios in gas samples (Figure 1). CO2 concentration and its 13C/12C and 18O/16O isotopic ratios were averaged over a period of 228 s at a frequency of 1 Hz, and the ratios were based on Pee Dee Belemnite (PDB) as the standard, expressed by δ13C and δ18O:
δ13C or δ18O (‰) = (Rsample/Rstandard − 1) × 100
where Rstandard and Rsample indicate the molar ratios of standard 13C/12C (or 18O/16O) and sample, respectively.
Prior to each assay, the CO2 isotope analyzer was calibrated using two standard CO2 mixture gases containing two different CO2 concentrations (CO2 concentrations and its δ13C and δ18O values: 398.60 µL L−1 and −22.31‰ and −31.00‰; 794.30 µL L−1 and −22.34‰ and –31.20‰), 1% Argon (w/w), and balance gas of air. The standard CO2 mixture gases were supplied by Air Products (Beijing Helium Pu North Branch Gas Industry Ltd., Beijing, China), and their δ13C and δ18O values were measured with a mass spectrometer combined with a Trace Gas System (Isoprime-100, Elementar Ltd., Langenselbold, Germany), using reference materials NBS 19 and IAEA-CO-8 by the Environmental Stable Isotope Laboratory, Chinese Academy of Agricultural Sciences. The analytical precision for CO2 concentration and its δ13C and δ18O values using the CO2 isotope spectrum analyzer (CCIA-38d-EP, Los Research Inc., Fremont, CA, USA) was 0.05 µmol CO2 mol−1, 0.1‰, and 1.0‰ for a 5-min integration time, respectively. The δ13C and δ18O values of respired CO2 across all experimental plots were calculated based on the Keeling plot approach [47,48] (Figure 1), namely, using the intercept of linear regressions of the δ13C or δ18O values of CO2 against the reciprocal of headspace CO2 concentrations at closure time scales (n = 3). The determination coefficient of linear regressions (R2) was mostly more than 0.97 for the δ13C-CO2 and more than 0.85 for the δ18O-CO2. Following the measurement of δ13C and δ18O values of respired CO2, soil samples at 10 cm depth in the N-treated and non-treated experimental plots with mosses were collected to determine soil properties such as bulk density, pH, microbial biomass C and N, dissolved organic C, and dissolved total N.
To effectively compare the relationships between CH4 and CO2 fluxes versus the δ13C and δ18O values of respired CO2 across N-treated and non-treated experimental plots with and without moss cover, CH4 and CO2 fluxes in all experimental plots were determined prior to the measurement of δ13C and δ18O values of respired CO2 (Figure 1), using a portable greenhouse gas analyzer (915-0011, Los Research Inc., Fremont, CA, USA) coupled to an opaque smart respiratory chamber (SC-11, Beijing LICA United Technology Limited, Beijing, China) [49]. The sampling frequency of the gas analyzer was 1 Hz for the measurement of CO2 and CH4 concentrations. During the 3-min closure, the record for the initial 90 s was automatically discarded due to a dynamic balance inside the analysis system, and the following records were used to calculate CO2 and CH4 fluxes using the slope of linear regressions of headspace gas concentrations against the opaque chamber closure time, along with the surface area of soil collars and atmospheric pressure data recorded on the gas analyzer upon each flux measurement. CO2 and CH4 fluxes were expressed as μmol CO2 m−2 s−1 and nmol CH4 m−2 s−1, respectively. Soil temperature and volumetric water content (%, v/v) at 7 cm depth in soil collars were determined using a temperature and moisture combination probe nicely attached to the portable gas analyzer (Figure 1). To study whether there are significant variations in the δ13C and δ18O values of respired CO2 after the removal of moss blankets, CO2 and CH4 fluxes as well as the δ13C and δ18O values of respired CO2 were measured prior to and immediately after the removal of mosses on 31 October 2024.

2.4. Measurements of Soil Properties

Soil moisture content was measured gravimetrically by drying soil samples at 105 °C for 48 h. Soil bulk density at 10 cm depth was determined using the intact soil core method [50]. The pH values of fresh soil (soil/water, 1/2.5, m/m) were measured using a portable pH meter (PB-10, Sartorius, Göttingen, Germany). Soil microbial biomass C (MBC) and N (MBN) concentrations were determined using the chloroform fumigation and extraction method [51]. Concentrations of K2SO4-extractable dissolved organic C (DOC) and dissolved total N (DTN) in fumigated and non-fumigated soils were determined by using a TOC/TN analyzer (Shimadzu TOC-VCSH/TN, Tokyo, Japan), and MBC and MBN concentrations were calculated by the differences of K2SO4-extractable DOC and DTN contents between fumigated and non-fumigated soils divided by 0.45 [52,53]. The specific UV absorbance of soil K2SO4 extracts at 254 nm (SUVA254) (L mg−1 cm−1) was calculated by the absorbance of soil extracts at 254 nm divided by the concentration of DOC and multiplied by 100 [54]. The UV absorbance of soil extracts at 254 nm was measured by using a spectrophotometer (Unic 2800A, Shanghai, China) with a 1 cm path-length quartz cell.

2.5. Calculation and Statistical Analysis

All measured variables were examined for normality using a Shapiro–Wilk test and homogeneity of variance using Levene’s test, and log-transformed where necessary. A two-factor repeated measures analysis of variance (ANOVA) with treatment and moss as fixed factors and year as a random factor was used to assess their effects on the δ13C and δ18O values of respired CO2. A univariate repeated measures ANOVA with treatment as a fixed factor and year as a random factor was used to assess their effects on soil properties. Box plots of daily CO2 and CH4 fluxes from N-treated and non-treated plots with and without mosses across the three autumn seasons were drawn using OriginPro 2021 (OriginLab Corporation, Northampton, MA, USA). A two-factor repeated measures ANOVA with N level and moss as fixed factors was performed to assess their effects on the daily CO2 and CH4 fluxes in the three autumn seasons, and the δ13C and δ18O values of respired CO2 each year. Pearson correlation analysis was carried out to evaluate the relationships between δ13C and δ18O values of respired CO2 versus CO2 and CH4 fluxes, and soil properties. All the data were analyzed by SPSS (version 19.0, IBM Corp., New York, NY, USA). Scatter plots were drawn to present the effects of CH4 and CO2 fluxes and soil moisture on the δ13C and δ18O values of respired CO2, and their relationships were fitted with curve regressions, using OriginPro 2021 (OriginLab Corporation, Northampton, MA, USA). A random forest analysis was performed to assess the variables significantly influencing the δ13C and δ18O values of respired CO2 using the ‘rfPermute’ package. The random forest analysis was performed using R 4.4.1 [55]. The evaluation of model performance was determined using mean squared error (MSE) and the determination coefficients of regressions (R2). Based on the results of principal analysis, N addition (added N versus control), moss (with moss versus without moss), CO2 and CH4 fluxes, and soil moisture were selected as predictors to establish a priori structural equation modeling (SEM) to evaluate the direct and indirect effect pathways on the δ13C and δ18O values of respired CO2 under the experimental conditions. The overall goodness of fit for the model was determined using the chi-squared test, comparative fit index, and the root-mean-square error of approximation index. The SEM analysis was performed using the software AMOS 24 (SPSS Inc., Chicago, IL, USA).

3. Results

3.1. Changes in Soil CO2 and CH4 Fluxes as Well as δ13C and δ18O Values of Respired CO2 Prior to and After the Removal of Moss Blankets

Immediately after the removal of moss blankets on 31 October 2024, the average soil CO2 and CH4 fluxes in the control decreased from 0.449 to 0.373 μmol CO2 m−2 s−1 and increased from –0.605 to –0.526 nmol CH4 m−2 s−1, respectively (Table S1). This indicated that, on average, the presence of mosses contributed to approximately 17% and 13% of the soil CO2 and CH4 fluxes under the moss-covered forest floors at a given duration. Furthermore, based on paired t-test results, the difference in the soil CH4 flux caused by the removal of moss blankets became significant at p < 0.05 (Table S1). Prior to and after the removal of moss blankets in the control, there were no significant differences in the δ13C and δ18O values of respired CO2, respectively (Table S1). This strongly indicated that autotrophic respiration of the moss species mentioned in this study would have no significant impacts on the δ13C and δ18O values of respired CO2 under the well-drained forest floors.

3.2. Effect of Long-Term N Addition on Soil Properties Under Moss-Covered Forest Floors

Following the decadal application of NH4Cl at low and high doses, soil pH values in all N-treated experimental plots were decreased by 0.4–0.7 units, relative to those in the control (p < 0.01) (Table 1). The soil dissolved total N contents and the SUVA254 values of soil K2SO4 extracts were significantly increased with increasing doses of added N (p < 0.05) (Table 1). There was a significant interannual difference in soil dissolved total N, pH, and MBC contents (p < 0.05) (Table 1). Soil bulk density was significantly affected by treatments and years of soil sampling (p < 0.05) (Table 1).

3.3. Effects of Mosses and Long-Term N Addition on the δ13C and δ18O Values of Respired CO2 as Well as CO2 and CH4 Fluxes

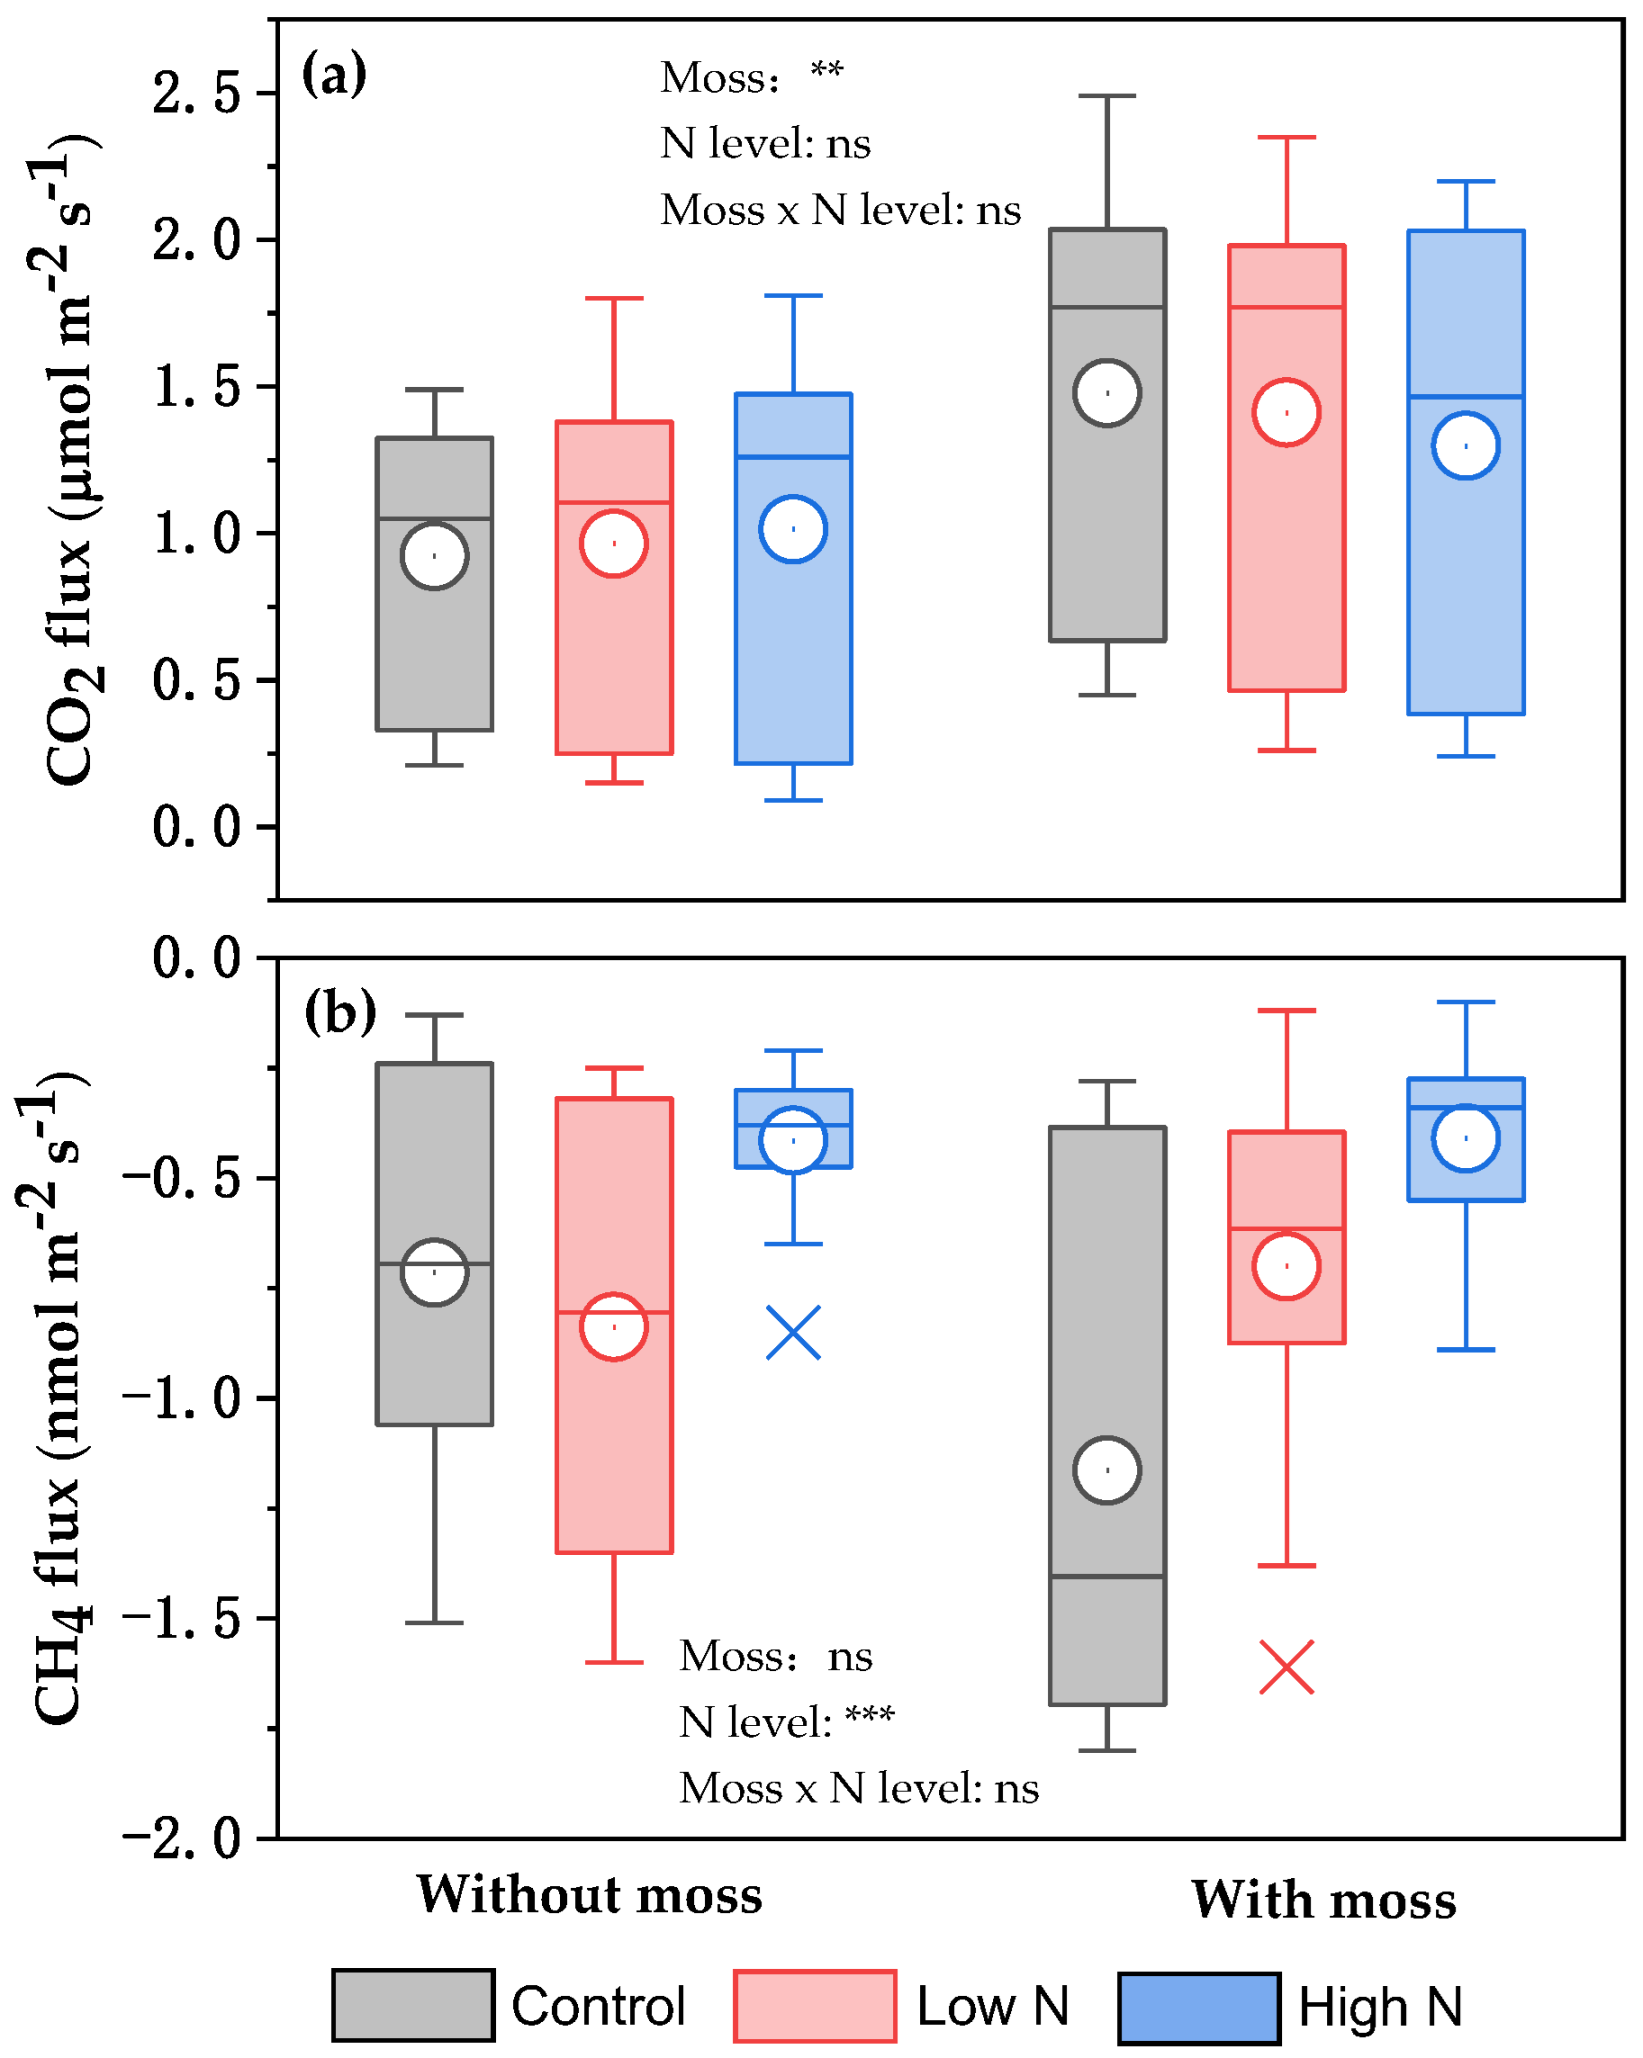
Compared with those recorded with the removal of mosses, average δ13C values of respired CO2 in the control and the low- and high-N treatments with mosses appeared to reduce by approximately 1.03‰, 1.06‰, and 0.60‰, respectively (Table 2). However, there were not significant differences across all treatments (Table 2). Regardless of moss species, the effect of N levels on the δ13C and δ18O values of respired CO2 varied with years (Table 2), with a significant effect for the δ13C in 2021 and for the δ18O in 2019 and 2024 (Tables S2 and S3). Based on the results of ANOVA analysis, the δ13C and δ18O values of respired CO2 were significantly affected by the presence of mosses over the experimental period (Table 2). There were no significant interaction effects between moss and N level on the δ13C and δ18O values of respired CO2 under the experimental conditions (Table 2, Tables S2 and S3). Based on the in situ measurement of CO2 and CH4 fluxes across the three autumn seasons, regardless of N levels, there were significant larger CO2 fluxes in the presence of mosses, compared with those in the absence of mosses (p < 0.01) (Figure 2a). Furthermore, the largest CH4 fluxes were observed in the high-N-treated experimental plots with and without mosses relative to those in the control and low-N treatment (p < 0.001) (Figure 2b).

3.4. Factors Affecting the δ13C and δ18O Values of Respired CO2 Under Well-Drained Forest Floors

The correlation analysis showed that the δ13C and δ18O values of respired CO2 under the experimental conditions were significantly correlated with soil CO2 and CH4 fluxes (p < 0.01), soil temperature and moisture at 7 cm depth (p < 0.01), as well as soil DTN content and bulk density (p < 0.05) in all moss-covered experimental plots (Table 3). The δ13C values of respired CO2 across all moss-covered plots had a significantly negative correlation with soil pH (p < 0.05) and MBC (p < 0.01) (Table 3).
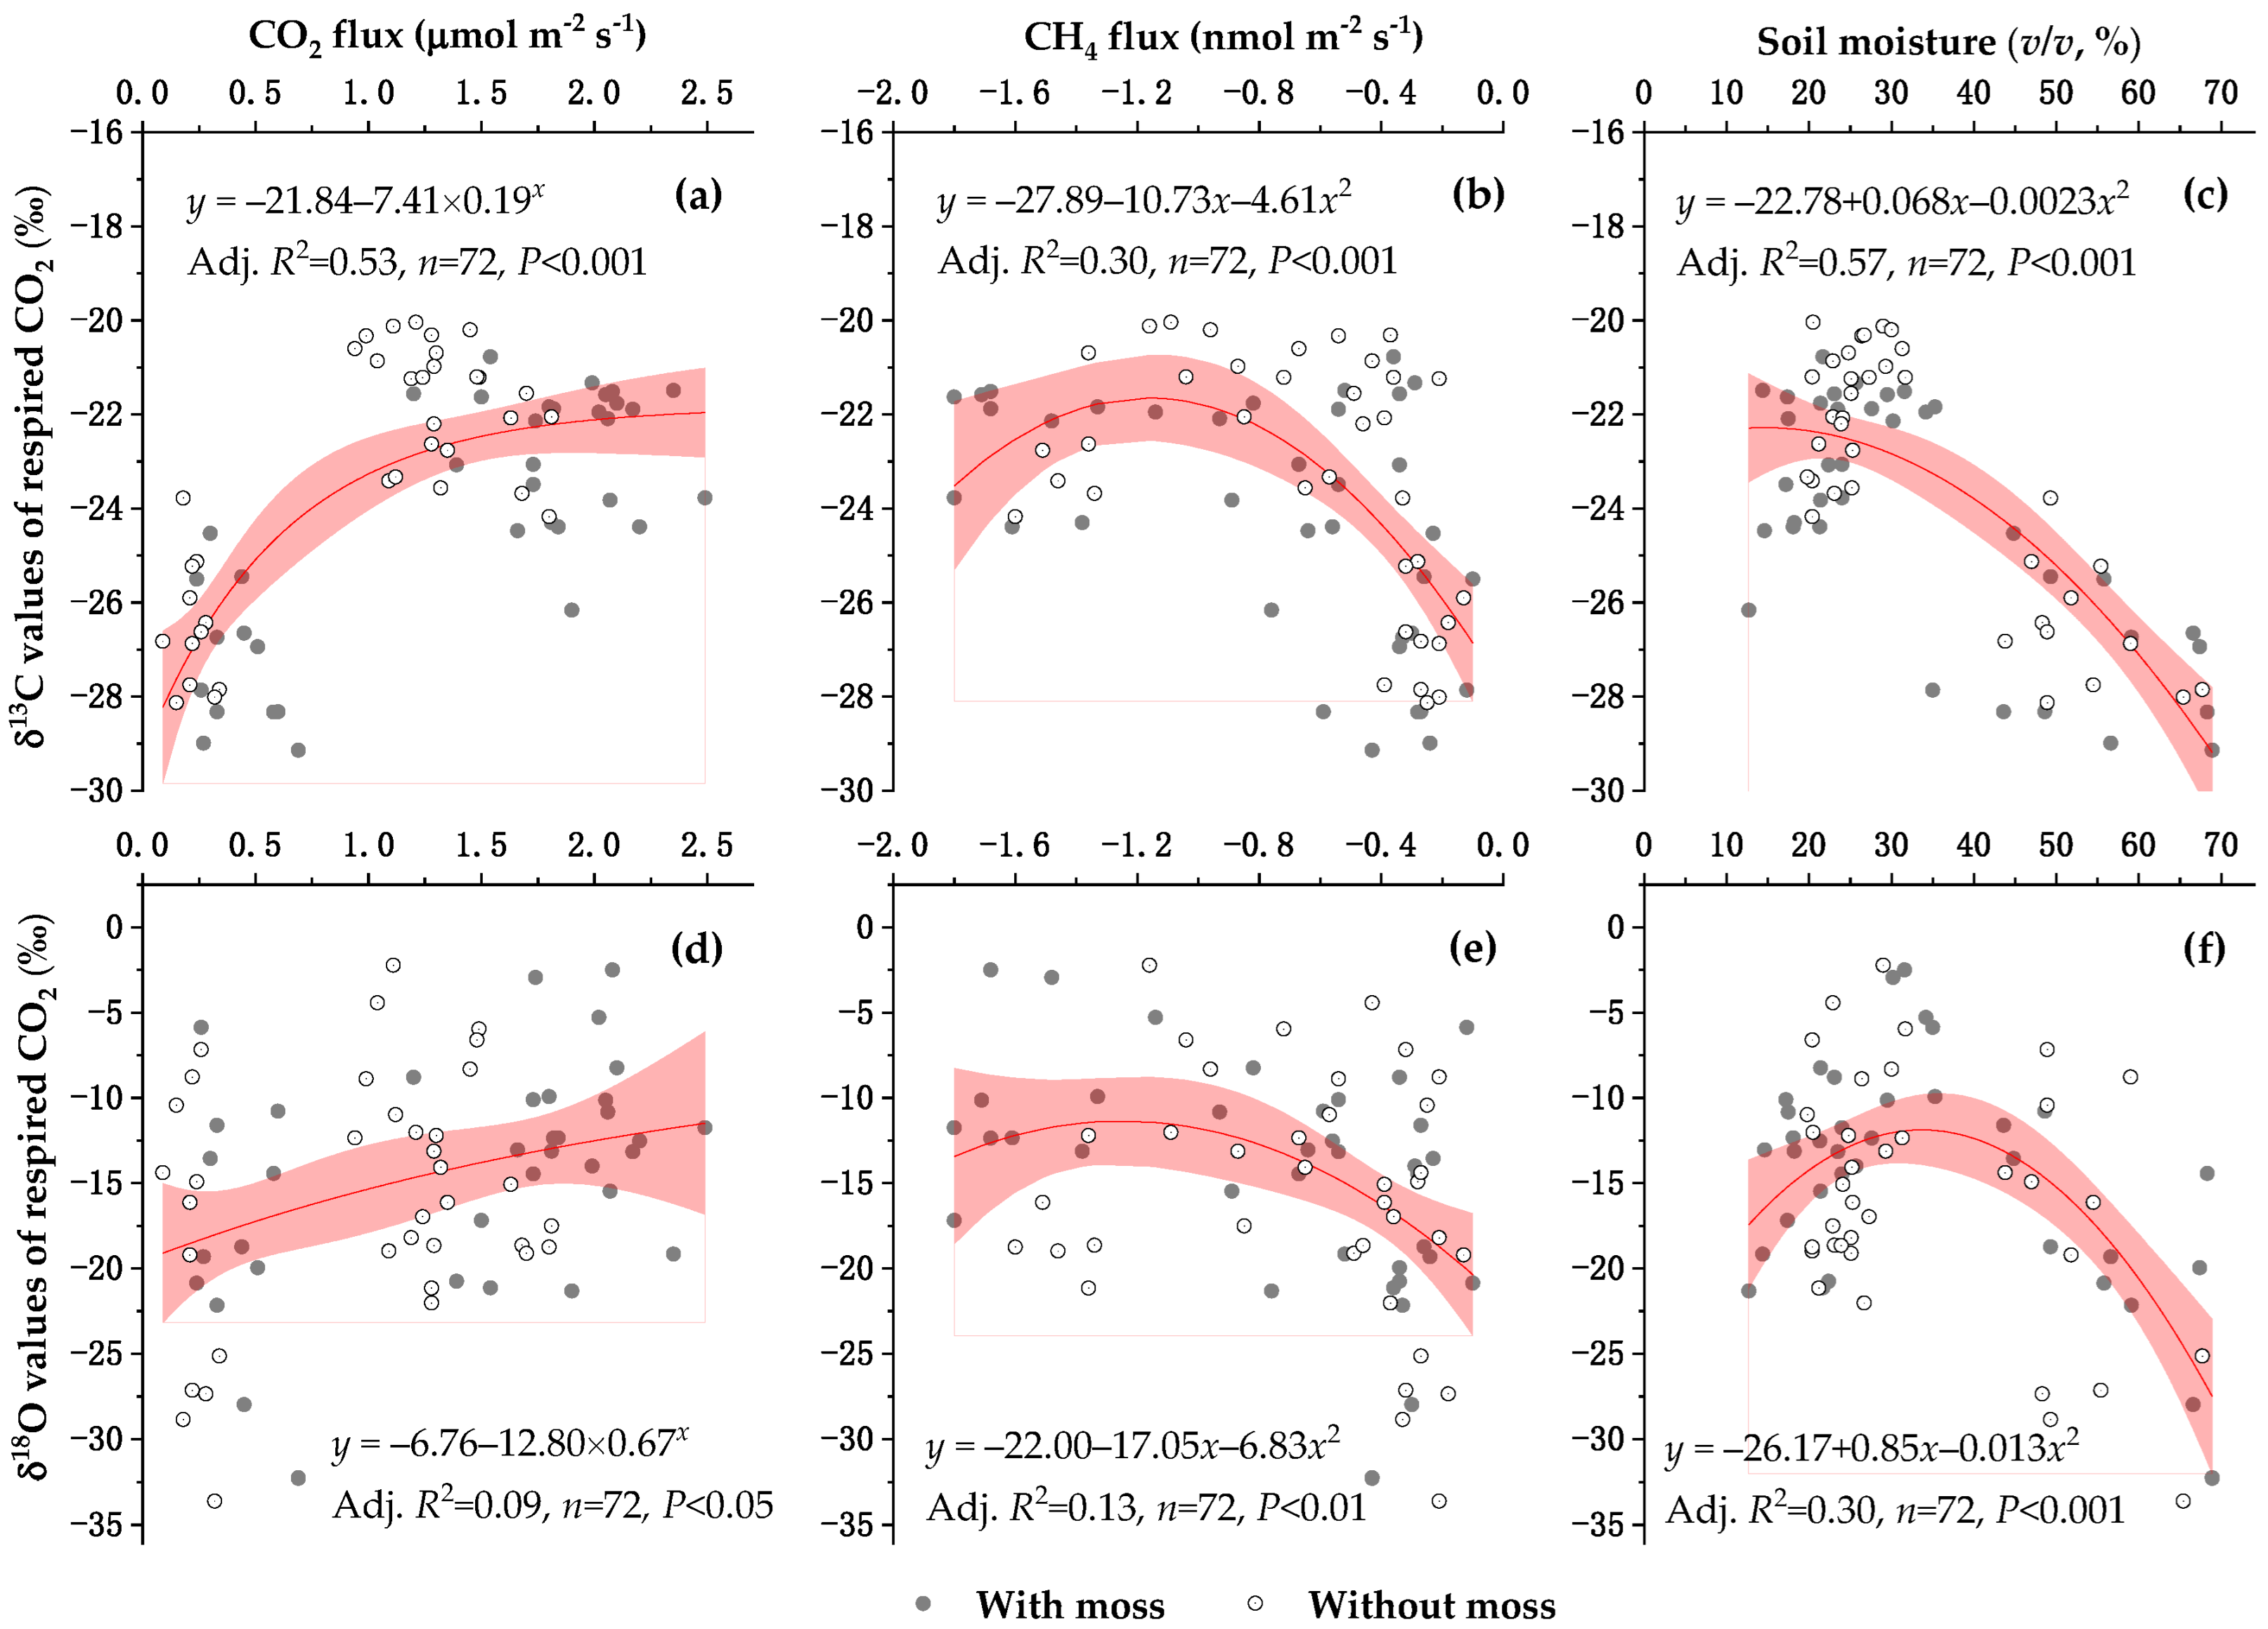
The CO2 flux could account for 53% of the variability in the δ13C values of respired CO2 across all experimental plots (p < 0.001), and 9% of the variability in the δ18O values of respired CO2 (p < 0.05) (Figure 3a,d). There was a parabolic relationship of δ13C and δ18O values of respired CO2 against CH4 fluxes under the experimental conditions (p < 0.01) (Figure 3b,e). The δ13C and δ18O values of respired CO2 under the experimental conditions decreased at soil moisture below and above an optimum, respectively, and the moisture-dependent effect became more pronounced for the δ18O than for the δ13C (Figure 3c,f).
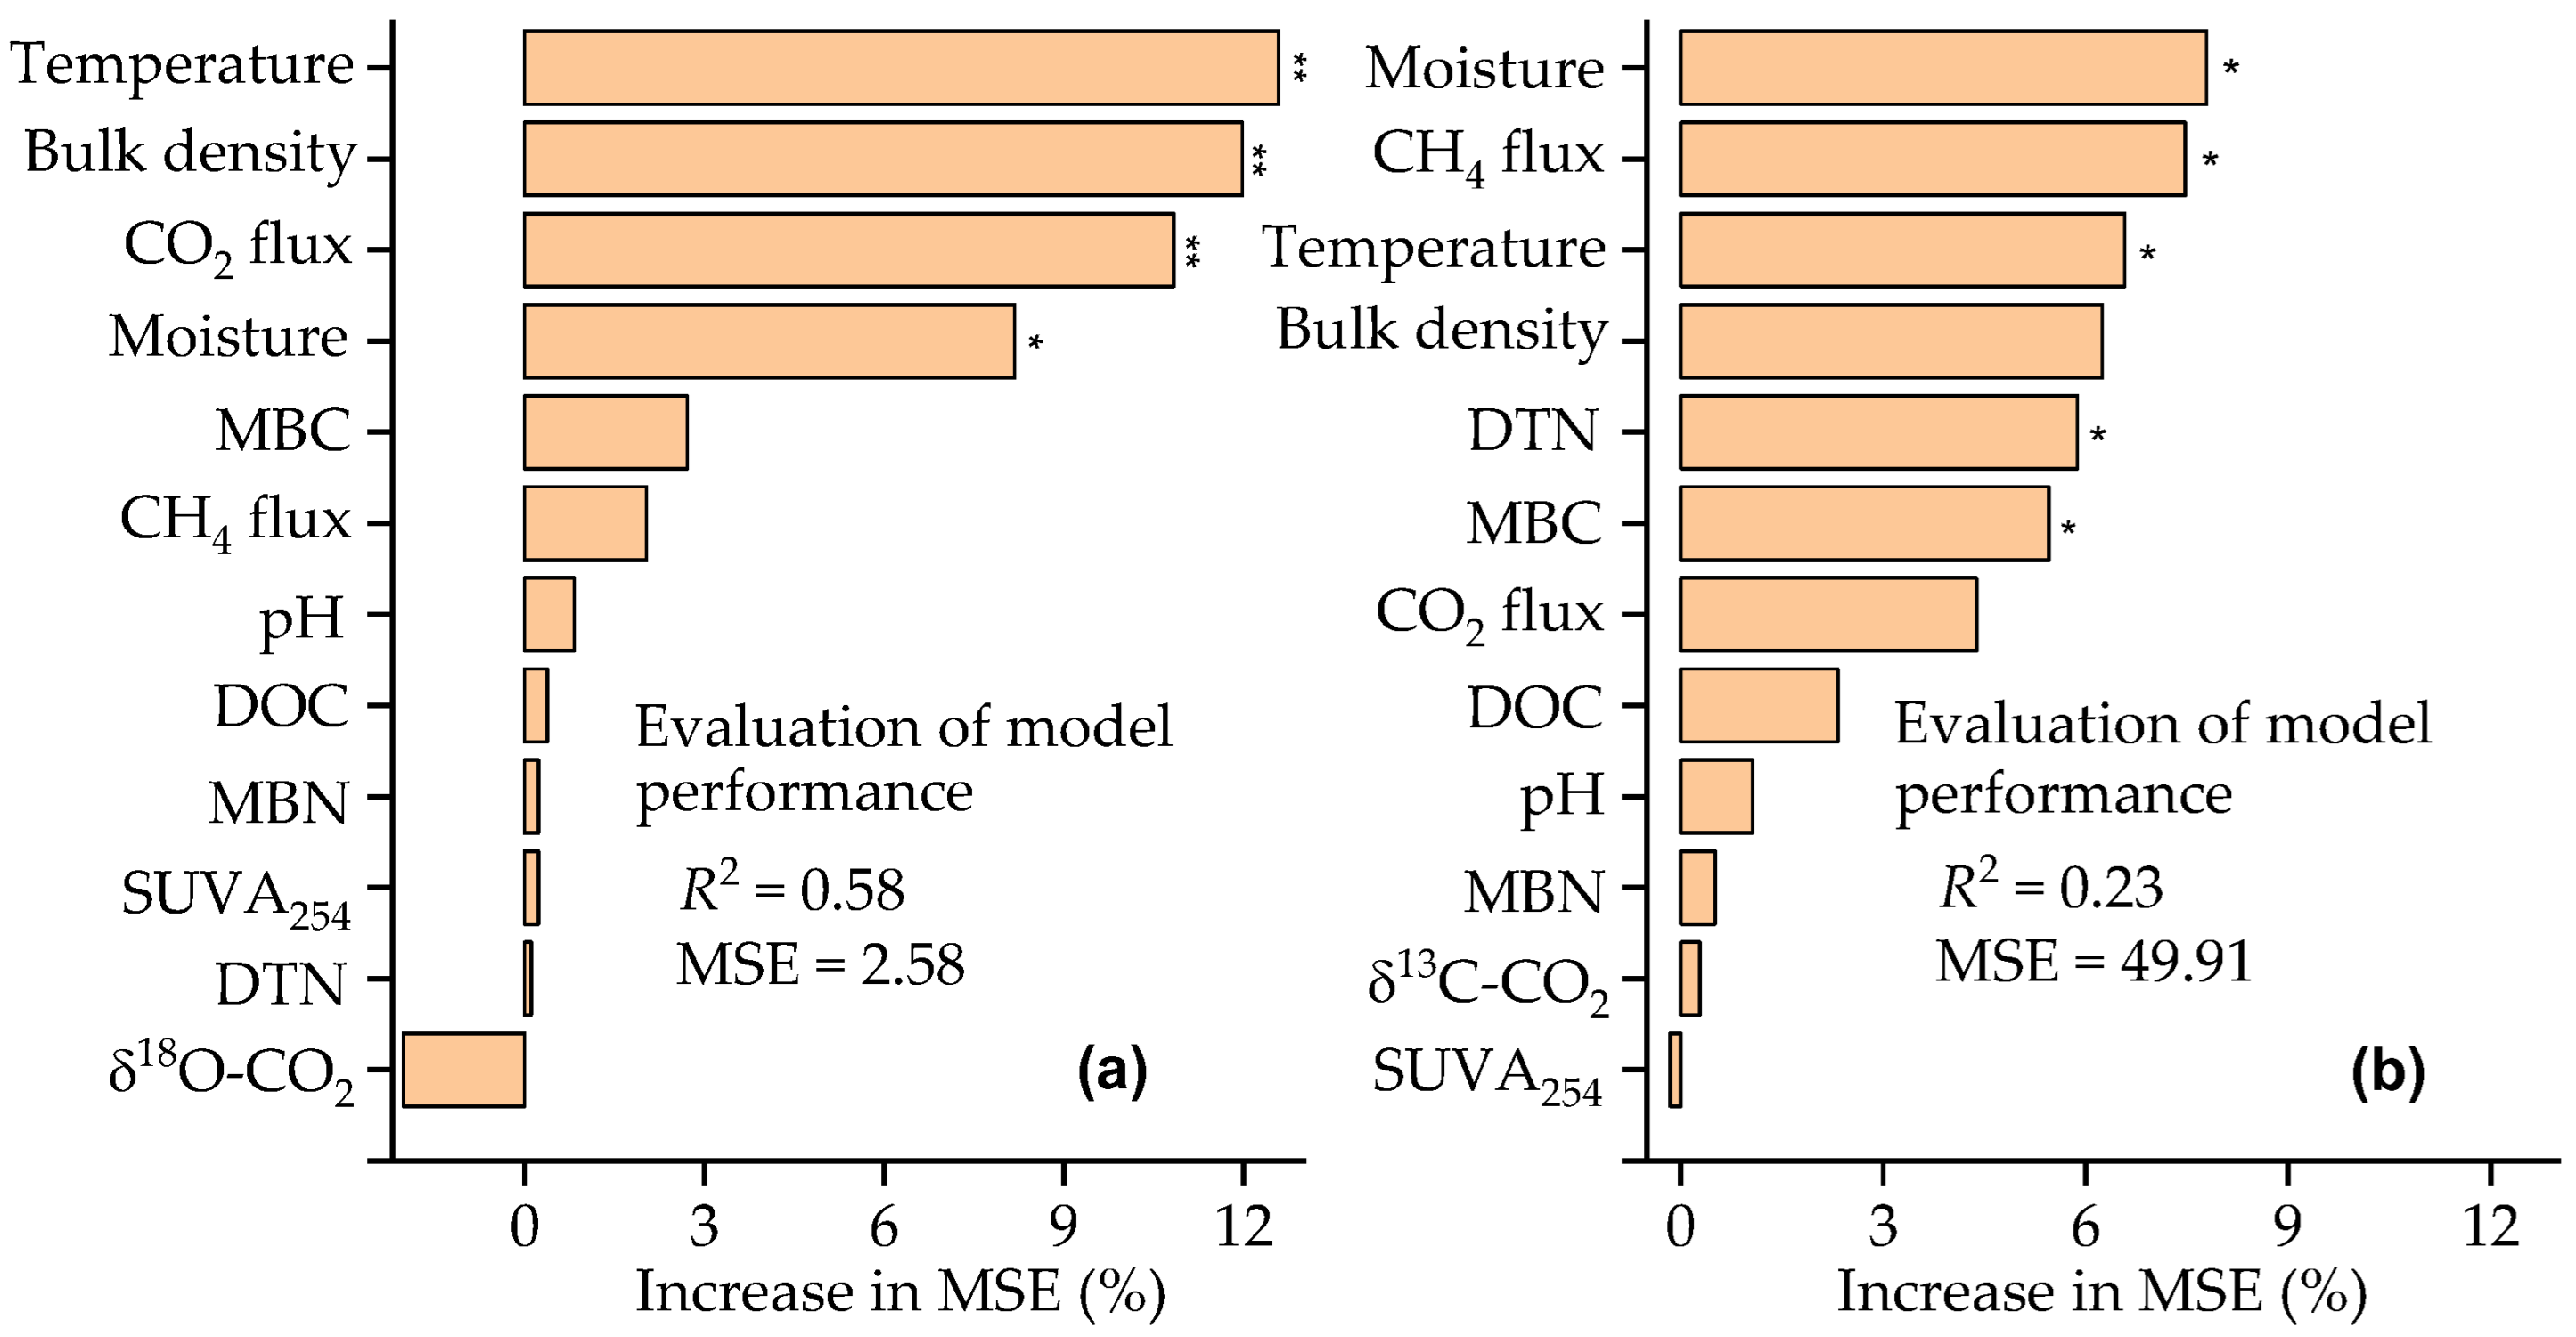
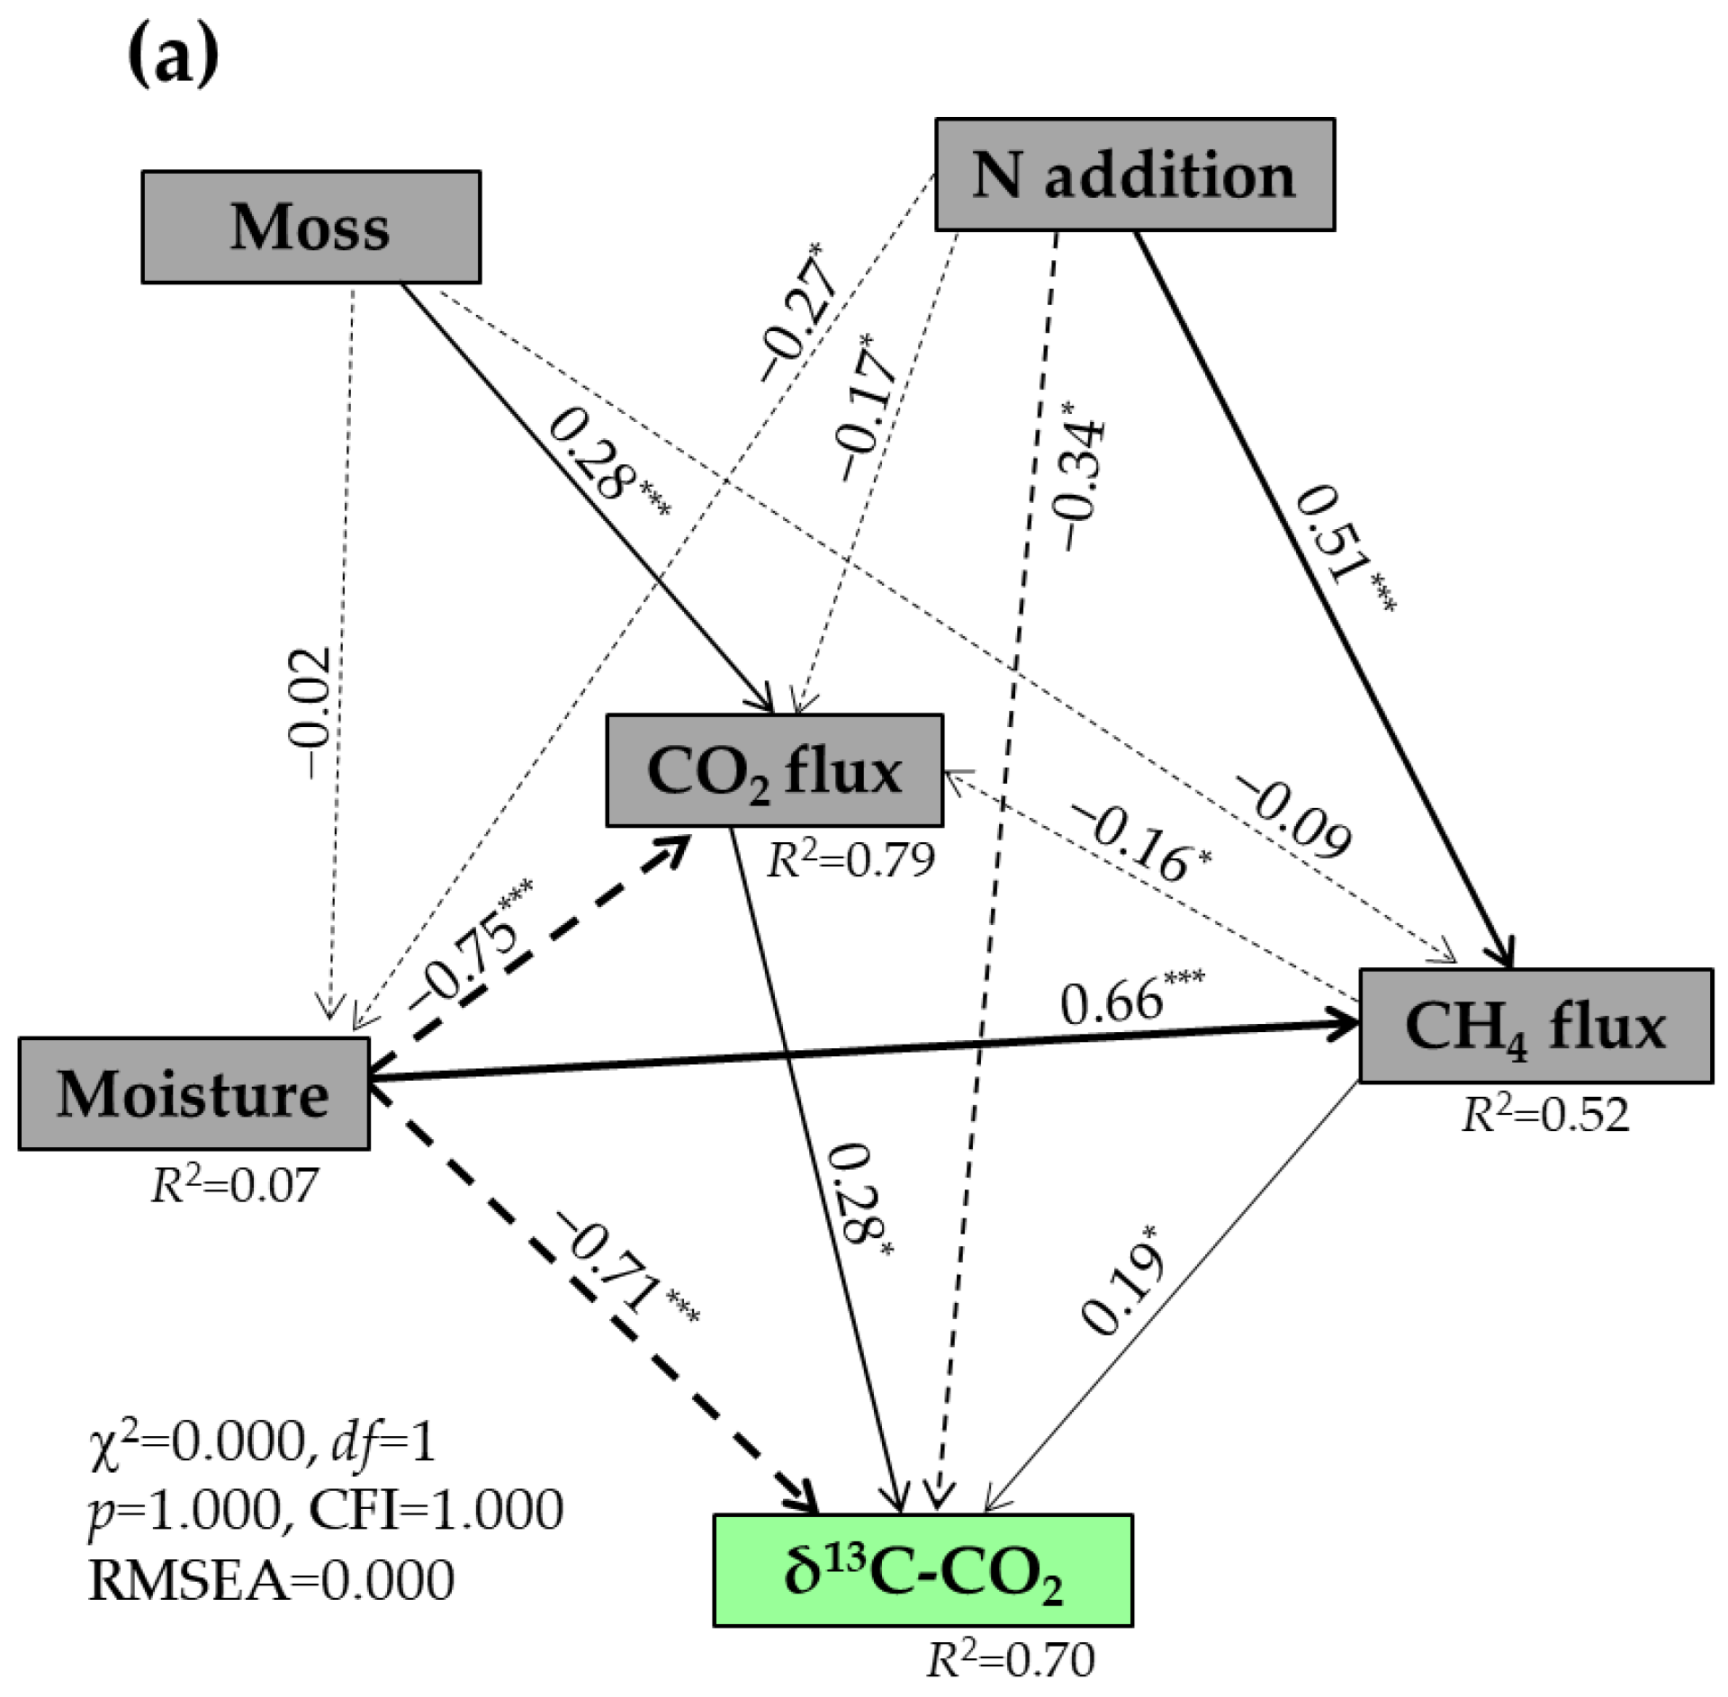
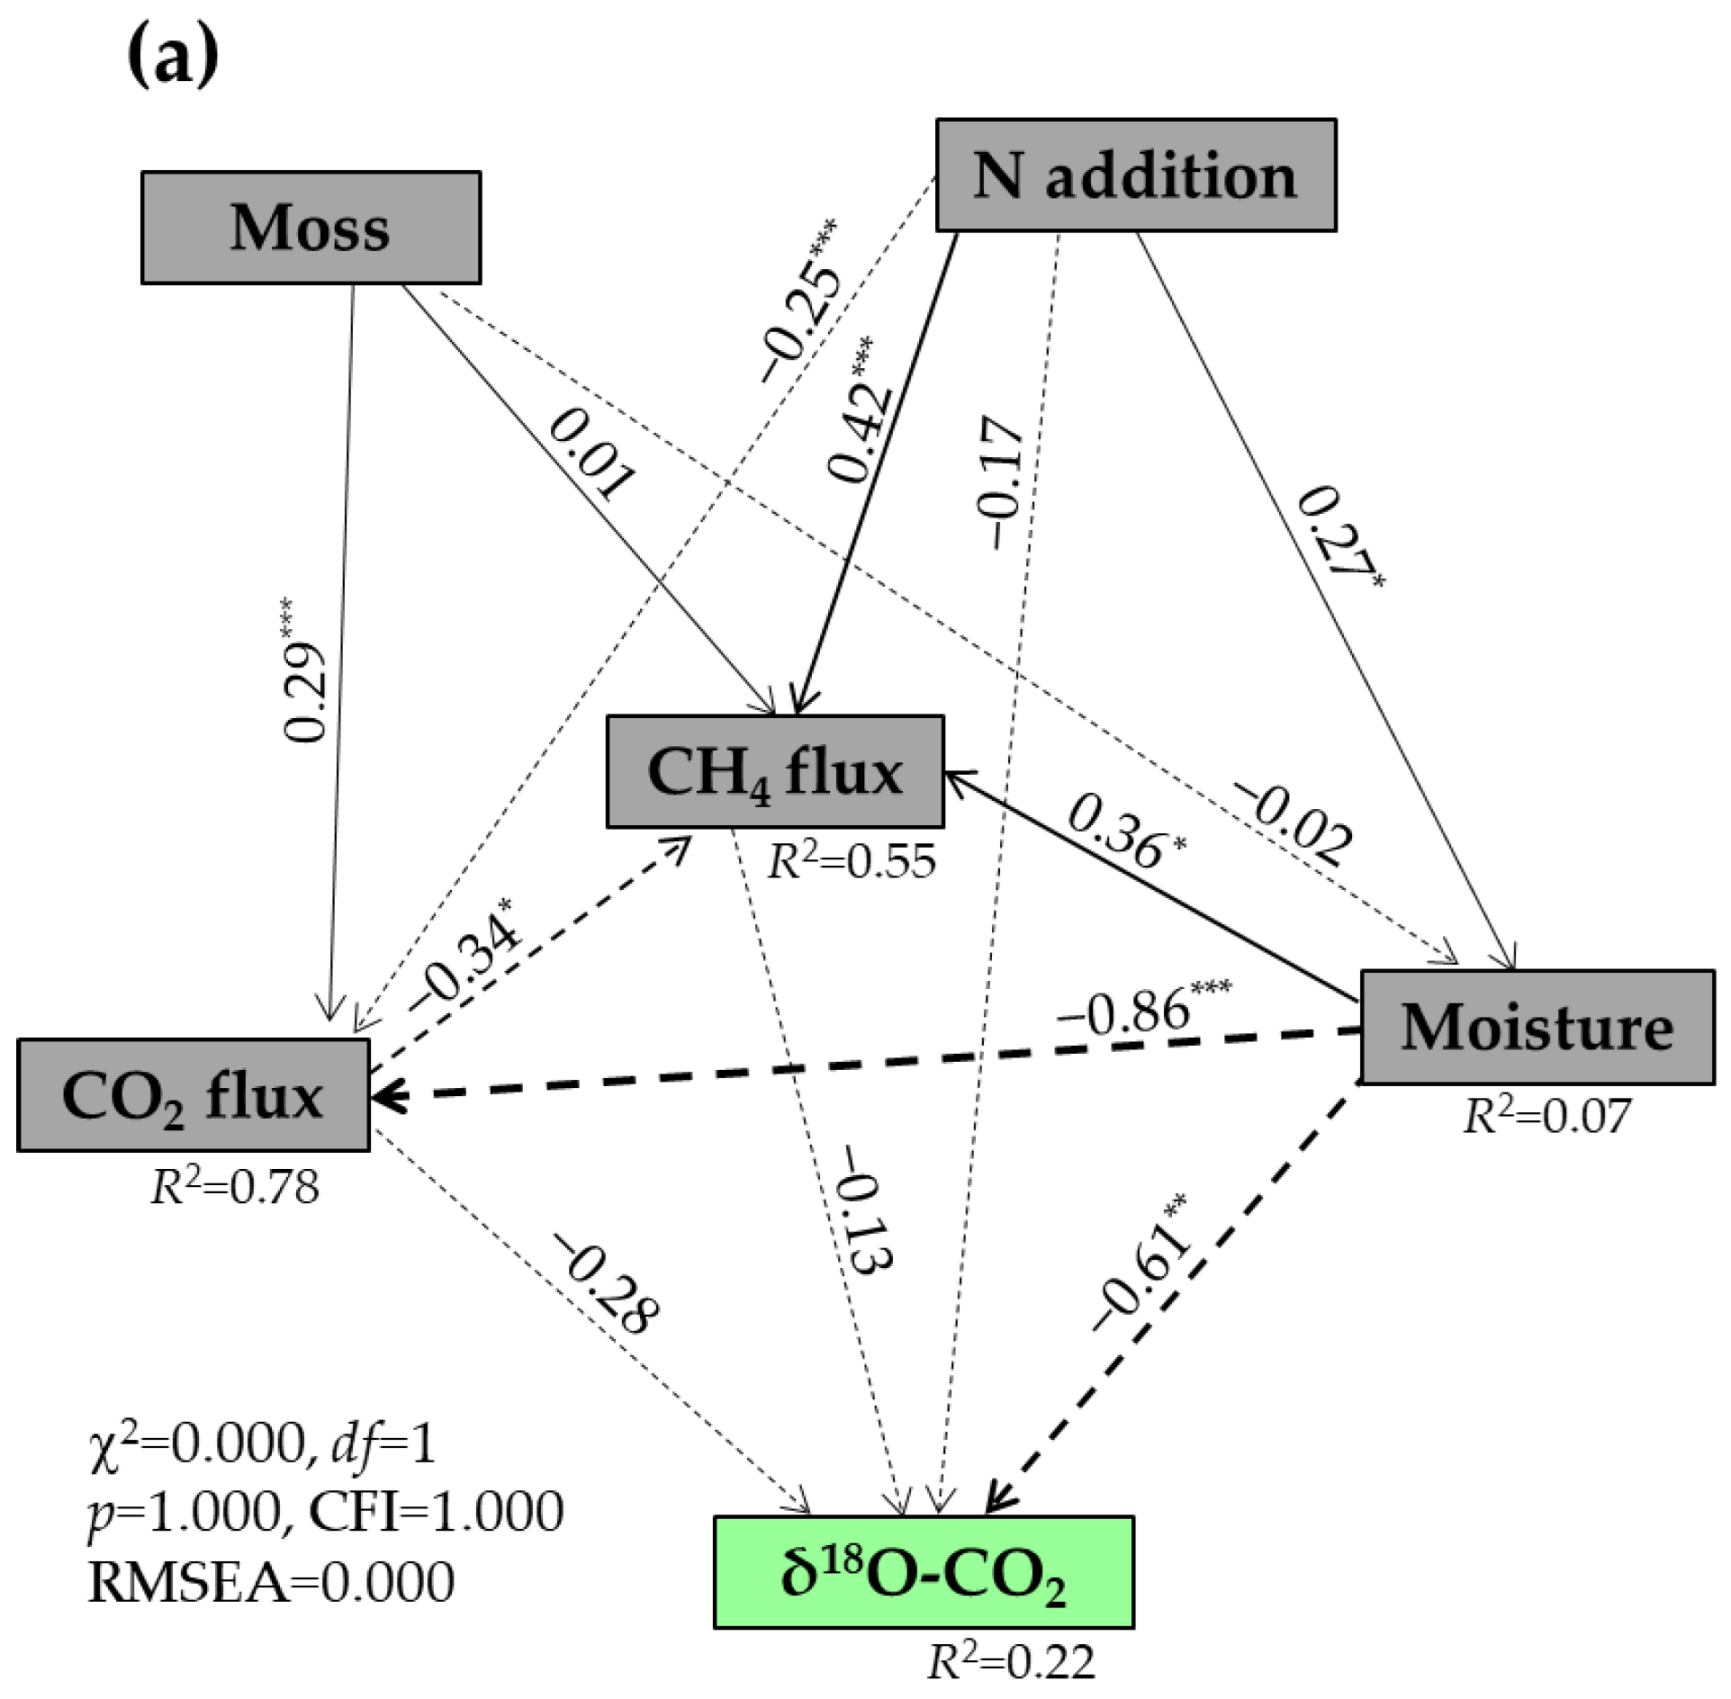
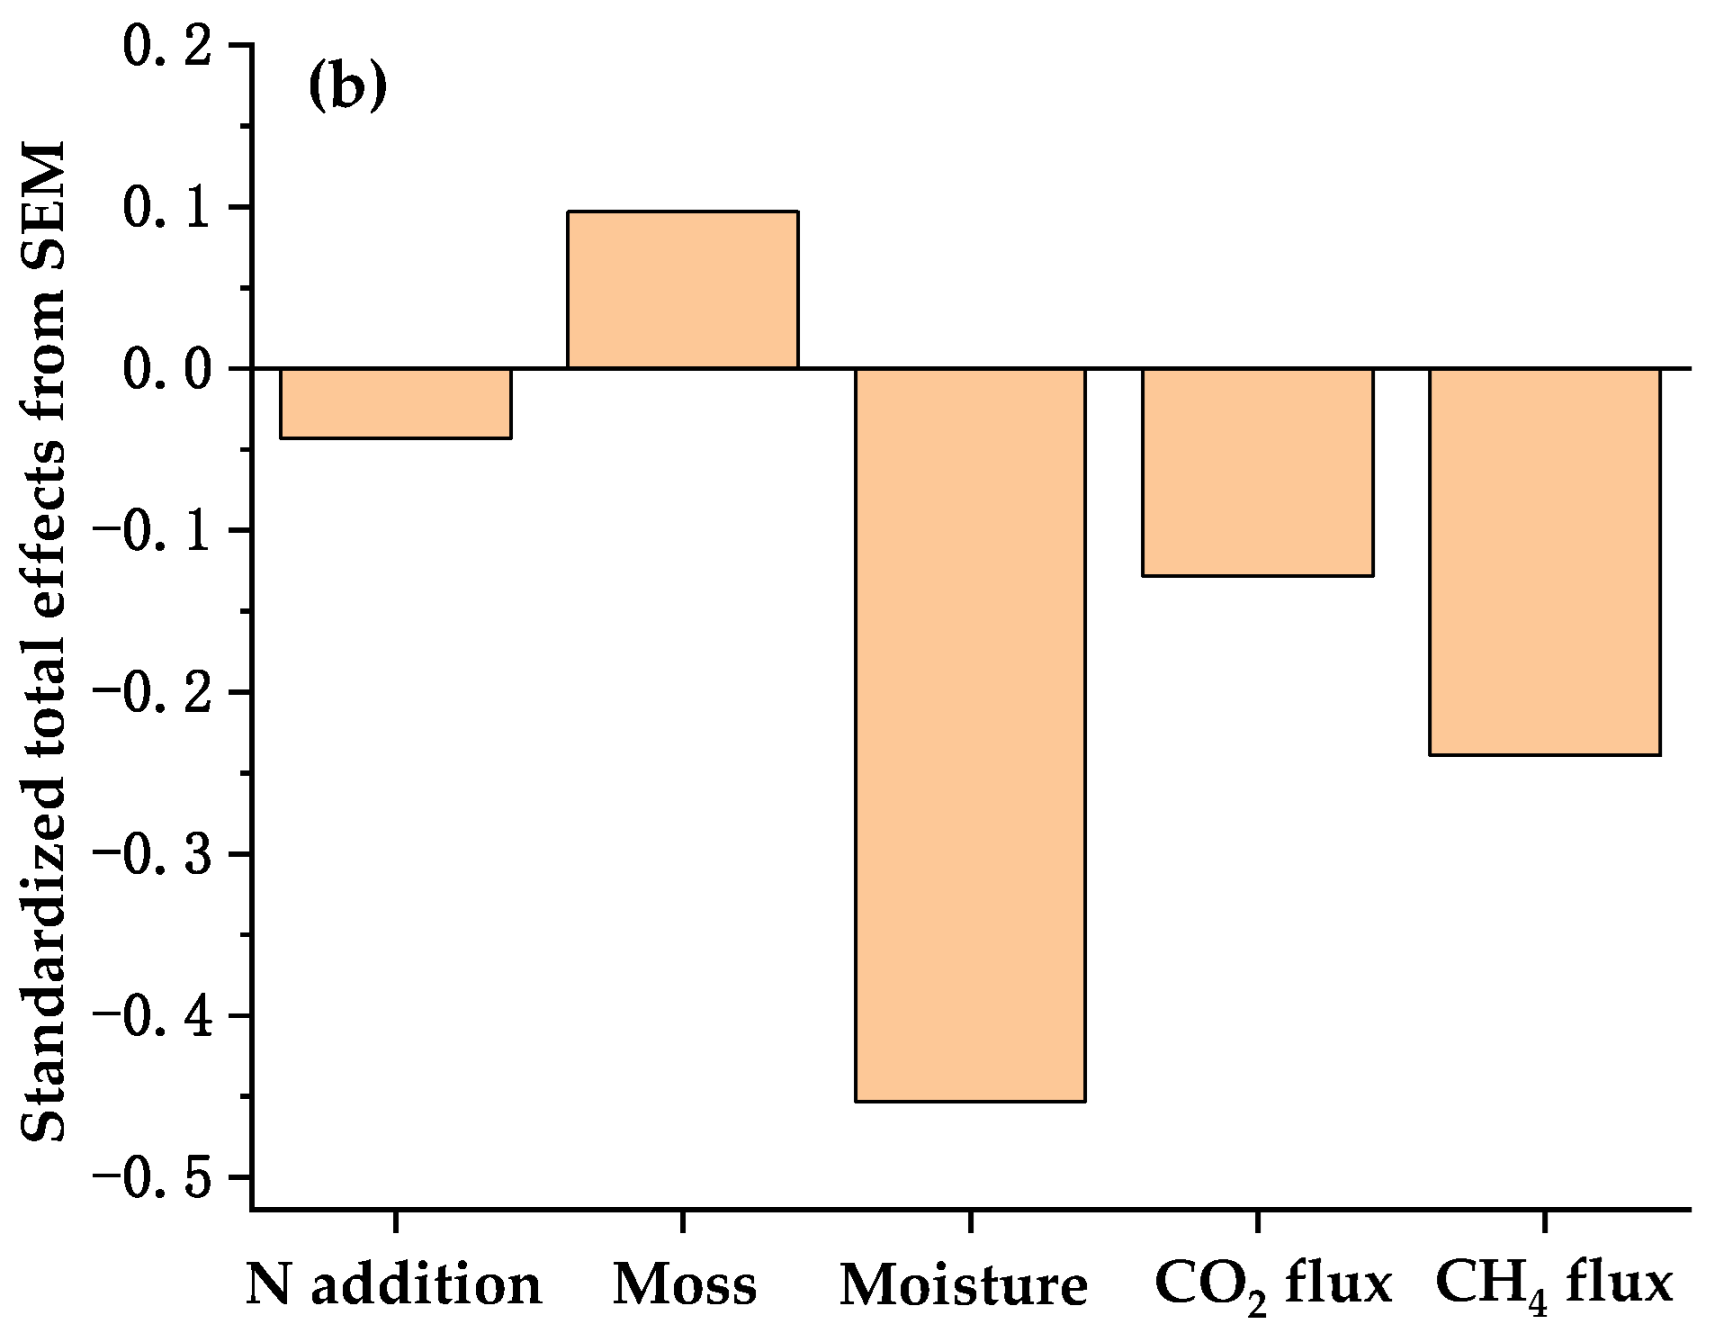
Random forest analysis showed that soil temperature and moisture, CO2 flux, and bulk density were the strongest predictors of δ13C values of respired CO2 (p < 0.05) (Figure 4a), while the δ18O values of respired CO2 were significantly predicted by the soil moisture and temperature, daily CH4 flux, DTN, and MBC (p < 0.05) (Figure 4b). The SEM results indicated that 70% of the variability in the δ13C values of respired CO2. was explained by the N addition, moss, soil moisture, and CH4 and CO2 fluxes (Figure 5a). The increases in the δ13C values of respired CO2 were positively associated with the decreases in soil moisture (p < 0.001) and with the increases in CH4 and CO2 fluxes (p < 0.05) (Figure 5b). Both N addition and moss would have negative impacts on the δ13C values of respired CO2 (Figure 5b). A total of 22% of the variability in the δ18O values of respired CO2 was explained by the N addition, moss, soil moisture, as well as CO2 and CH4 fluxes (Figure 6a), with a maximum negative effect of soil moisture (p < 0.01) (Figure 6b).

4. Discussion

4.1. In Situ Measurements of δ13C and δ18O Values of Respired CO2

Under the experimental conditions, the selection of chamber closure time (e.g., less than 10 min) in autumn could support the difference in CO2 concentrations among headspace gas samples collected during each measurement period being mostly larger than 75 ppm, while the closure time being as short as possible would minimize the disturbance of the soil-chamber system upon each gas sampling [46]. This should be considered an effective method to reduce the standard error in the y intercept obtained via the Keeling plot approach [4,46]. Across the three autumn seasons, there were generally nice determination coefficients of linear regressions, R2, for the δ13C and δ18O values of respired CO2 (mostly 0.97 and 0.85, respectively). Perhaps due to the difference in the measurement precision of δ13C and δ18O values of CO2 using the CO2 isotope spectrum analyzer (CCIA-38d-EP, Los Research Inc., Fremont, CA, USA) and the presence of non-steady conditions inside the soil-chamber system [46], R2 values for the δ18O values were mostly smaller relative to those for the δ13C values. Nevertheless, as shown in Figure 1, the measurement of δ13C and δ18O values of respired CO2 under forest floors can be nicely performed following a reasonable gas sampling procedure.

4.2. Effect of Mosses and Long-Term N Addition on the δ13C Values of Respired CO2

The δ13C values of respired CO2 with and without moss cover during the experimental period varied by as much as 6.4‰ and 6.6‰, respectively (Tables S2 and S3), indicating an obvious interannual difference in the δ13C. A similar change in the δ13C values of CO2 released from forest ecosystem respiration (4.4‰) and soil respiration (6.2‰) over the growing season was reported by Fessenden and Ehleringer [24] in the Pacific Northwest of North America. The more negative δ13C values of CO2 respired from all experimental plots with mosses than without mosses (Table 2) indicate that CO2 released from moss-induced respiration is more depleted in 13C. Due to the discrimination against 13CO2 during moss photosynthesis, moss biomass normally has a lower 13C/12C ratio than atmospheric CO2 and the following moss-induced respiration will lead to the release of CO2 depleted in 13C into the atmosphere [3]. At a high dose of added N, the growth of mosses was inhibited [33,34,35,36,37,38], and the difference in daily CO2 fluxes in the high-N treatment with and without mosses was, on average, the smallest across all treatments during the three autumn seasons (Figure 2a). This indicated that there would be a relatively smaller discrimination against 13CO2 during moss photosynthesis and the moss-induced respiration in the high-N-treated experimental plots than in the control, which in turn contributed to a small decrease in the moss-induced average δ13C value of respired CO2 in the high-N treatment (0.6‰) (Table 2). However, the δ13C values of respired CO2 in the control had no significant variations prior to and immediately after the removal of moss blankets at a given time (Table S1), indicating that autotrophic respiration of moss plant would have a small contribution to the δ13C values. Thus, changes in the moss-induced soil properties under the experimental conditions would have impacts on the δ13C values of respired CO2 beneath the moss-species-dominated temperate forest floors (Table 3 and Figure 4a).
The results of SEM (Figure 5) indicated that soil moisture and CH4 and CO2 fluxes should be considered as major factors controlling the changes in the δ13C values of respired CO2 under the moss-species-dominated forest floors after a long-term N application. Usually, atmospheric CH4 (biogenic source, with a mean of approximately –63.0‰) [43] appears more depleted in 13C than normal atmospheric CO2 (approximately –8.0‰), and an increased CH4 uptake caused by the presence of mosses in the control plots (Figure 2b) can, in turn, lead to more negative δ13C values of CO2 accumulated during the opaque chamber closure time. Although forest soil CH4 uptake in the region, even at low soil moisture, was three orders of magnitude lower than CO2 emission [56], the increase in the moss-induced atmospheric CH4 uptake could partly contribute to the larger decrease in the moss-induced average δ13C values of respired CO2 in the control (1.0‰) than in the high-N treatment (0.6‰) (Table 2). A parabolic relationship between soil CH4 flux and δ13C values of respired CO2 across all experimental plots (R2 = 0.30, p < 0.001) (Figure 3b) indicated an important function of CH4 uptake in regulating the δ13C values of respired CO2 under the moss-species-dominated forest floors. Furthermore, a relatively large uncertainty in the δ13C values of respired CO2 in response to low CH4 uptake under the experimental conditions (Figure 3b) showed that other factors would contribute to the δ13C values.
In addition to the contribution of CH4 uptake, the variations in δ13C values of CO2 released beneath the moss-species-dominated forest floors would be associated with the relative magnitude of moss cover, forest disturbance, and stand age, as well as heterotrophic soil respiration [3,16,17]. In autumn, the mineralization of deep soil organic matter enriched in 13C would be increased due to the legacy effect of summer warming and the input of root exudates, leading to the release of CO2 enriched in 13C from the moss–soil continuum under boreal forest floors [16]. The SUVA254 values of dissolved soil organic matter can, to some extent, reflect the biodegradation of soil organic C under forest floors [54], and the largest SUVA254 value of soil extracts recorded in the high-N-treated experimental plots (Table 1) would reflect the relatively low soil C availability. Based on the microbial nutrient stoichiometry theory [57,58], the low soil C availability in the high-N-treated experimental plots would stimulate the activity of soil microorganisms like K-strategist to release C-requiring enzymes under N-surplus conditions to degrade the recalcitrant organic C in soil, which is normally enriched in 13C. This can, to some extent, support the relatively small decrease in the moss-induced average δ13C values of respired CO2 in the high-N treatment (0.6‰) (Table 2). Based on the difference in the δ13C values between microbial biomass and microbial respired CO2, Min et al. [17] reported that carbon availability could promote the microbial respiratory fractionation. This would be consistent with the negative relationship between δ13C values of respired CO2 and MBC contents under the experimental conditions (p < 0.01) (Table 3). Hence, soil available C can, to some extent, affect the variations in the δ13C values of CO2 released from the moss-dominated forest floors. The negative relationship between the δ13C values of respired CO2 and soil moisture (Table 3) was in agreement with the results reported by Fessenden and Ehleringer [24], who pointed out that δ13C values of CO2 released from forest ecosystem respiration and soil respiration were negatively and significantly correlated with soil moisture levels at the depth of 40 cm. Together with the results obtained from the random forest analysis (Figure 4), soil moisture, available C pool, and CO2 and CH4 fluxes should be taken into account as priority variables to predict the changes in daily δ13C values of CO2 released under temperate forest floors. The results would have many potential applications in the climate–terrestrial C models for rationally predicting δ13C values of respired CO2 and soil organic C turnover beneath forest floors at large scales and their responses to the presence of mosses and increasing atmospheric N deposition.

4.3. Effect of Mosses and Long-Term N Addition on the δ18O Values of Respired CO2

The average δ18O values of CO2 released across all treatments beneath the moss-species-dominated temperate forest floors in northeastern China (Table 2) were close to the average δ18O value (–14.4‰) of CO2 released during vegetation and soil respiration under Canadian boreal forest floors during the growing season [11]. A similar average δ18O value (–13‰) of ecosystem-respired CO2 was also observed in Amazonian forests over the year [6]. The difference in the δ18O values of respired CO2 across site-specific forest stands would be ascribed to different precipitation sources with varying 18O signatures [59] and the oxygen isotopic discrimination during photosynthesis, respiration, and transpiration of water in forest ecosystems [6,11,18,60,61].
The δ18O values of CO2 released under the experimental conditions were mainly influenced by an equilibrium isotope effect that occurs between oxygen in soil water and plant chloroplast water and oxygen in CO2 dissolved into the water [3,11,18,62]. As shown in Figure 1, an opaque static chamber was used to collect gas samples at intervals for measuring the δ18O value of headspace CO2; thus, plant (including mosses and tree roots) and soil respiration as well as evaporation mainly contribute to the changes in the δ18O values of CO2 released under the experimental conditions. Under high soil moisture, evaporation of water from the moss–soil continuum would increase the discrimination against 18O [62], leading to a more negative δ18O value of any CO2 diffusing out of the moss and soil surface. This would explain the relatively lower δ18O values of CO2 released across all treatments under high soil moisture (Figure 3f). A much better parabolic relationship between soil moisture and δ18O values of plot-respired CO2 in the presence of mosses (the determination coefficient of regression, R2 = 0.50) than in the absence of mosses (R2 = 0.24) (Figure 3f) would, in turn, support the discrimination against C18O16O via the evaporation of moss water. Furthermore, the relatively larger uptake of hydrophilic substances in mosses under hydration than under desiccation conditions [63] and a pulse release of readily soluble C from mosses into the soil upon hydration [26] would stimulate the activity of the enzyme carbonic anhydrase in the moss–soil continuum, which may support a greater depletion of respired CO2 in 18O under high soil moisture [18] (Figure 3f). The more negative δ18O values of CO2 released under high soil moisture were in agreement with the results reported by Ometto et al. [6], who showed that CO2 released from Amazonian forest and pasture ecosystem respiration was generally more depleted in 18O during the wet than during dry seasons over the year. Based on the nice parabolic relationship between soil moisture and δ18O values of CO2 released across all treatments, there would be a maximum δ18O value of CO2 released at approximately 32.7% soil moisture (v/v). This indicated that there would be an optimum moisture for the largest δ18O values of respired CO2 beneath the moss-species-dominated temperate forest floors. At soil moisture below an optimum, soil respiration and plant respiration (including moss respiration and tree root respiration) became more sensitive to drought, and δ18O values of respired CO2 would decrease mainly due to increased conductance to CO2 diffusion out of the soil–moss continuum under dry conditions and the relatively lower 18O content in soil water than in plant leaf water [3,18,60].
The optimum soil moisture content recording the largest δ18O value of respired CO2 under the experimental conditions became larger than that for its maximal δ13C value (14.8% soil moisture, v/v) (Figure 3c,f). Under low moisture conditions, the decline in conductance to water vapor in mosses would increase the conductance to CO2 diffusion [15]. The increased CO2 diffusion out of mosses and evaporation in the soil–moss continuum would increase the discrimination against 13CO2 and C18O16O, thus leading to more negative δ13C and δ18O values of respired CO2 relative to those at an optimum moisture. At an optimum water content, there would be a maximum rate of C assimilation by the mosses [15], which results in CO2 depleted in 13C and 18O entering into plant chloroplast due to discrimination and can, in turn, enhance the release of depleted 13CO2 and C18O16O into the atmosphere via respiration [64,65]. However, the high evaporation potential at the optimum moisture level [15] would inhibit the conductance to CO2 diffusion in the soil–moss continuum, which can in turn eliminate the release of isotopically depleted CO2 into the atmosphere. This trade-off effect of C assimilation and evaporation potential in the soil–moss continuum on the isotopic discrimination against 13CO2 and C18O16O would provide some evidence for explaining the largest δ18C and δ18O values of CO2 released at an optimum soil moisture. Under high moisture conditions, the rate of C assimilation by the mosses and the ratio of chloroplastic CO2 to ambient CO2 concentration would decrease because of the creation of an aqueous diffusion barrier to CO2 in mosses, and the evaporation rate remained high [15,22]. Furthermore, the following low temperature under high moisture conditions in autumn would eliminate the growth of mosses, due to the temperature-dependent growth response of mosses [66]. These would lead to less discrimination against 13CO2 and C18O16O through moss photosynthesis as water content was increased above an optimum [15,23]. This cannot support the release of depleted 13CO2 and C18O16O into the atmosphere under high soil moisture in this study. However, beneath the moss-species-dominated forest floors, the roots of trees were included in all experimental plots, and unlike the lack of stomata in mosses, both 13C and 18O discriminations in vascular plants would increase with soil water availability due to changes in nonstructural carbohydrate content and carbonic anhydrase activity in the soil–moss continuum, when soil moisture was not saturated [18,67,68,69], thus promoting the release of depleted 13CO2 and C18O16O into the atmosphere, mainly via autotrophic respiration of tree roots. More importantly, moss and soil water under high moisture conditions would become depleted in 18O due to the new input of precipitation in autumn, relative to moss and soil water under dry conditions [11]. Based on the measurement and simulation, the mean precipitation δ18O values in Northeast China became more negative in winter than in summer, resulting from less contribution of warm western Pacific pool (59% in summer versus 36% in winter) with higher δ18O values relative to the continental air mass [59]. The equilibrium isotope effect that occurs between oxygen in CO2 dissolved in the water and oxygen in soil water and moss/tree roots water [6,11,18,60] would support a higher depletion of respired CO2 in 18O under high moisture conditions (Figure 3f). The more negative δ18O values of CO2 released under high moisture conditions was in agreement with the results reported by Ometto et al. [6], who showed that there were more negative δ18O values of ecosystem-respired CO2 in the Amazonian zone during the wet than during the dry seasons over the year.

5. Conclusions

Mosses act as a critical biological filter under forest floors, significantly depleting δ13C and enriching δ18O in respired CO2 under the experimental conditions. This study indicated that moss–soil interactions (e.g., moisture retention, C input, and microbial habitat) are key drivers of isotopic shifts (δ13C depletion and δ18O enrichment) in respired CO2 under the litter-free temperate forest floors. The magnitude and direction of these isotopic effects are modulated by N availability, with a significant cross-year difference. Soil moisture influences the two isotopic shifts, particularly the δ18O values of respired CO2. While N addition, moss, moisture, and CO2 and CH4 fluxes explained most of the δ13C variations, the drivers of the δ18O shifts remain largely unexplained by these factors. Besides these factors, other factors such as the δ18O values of plant water and soil water as well as the source of precipitation would need to be taken into account for reasonably explaining the changes in the δ18O signatures of respired CO2 under site-specific conditions. The stark contrast in the explained variance (70% for δ13C vs. 22% for δ18O) underscores a greater complexity and the influence of unmeasured processes (diffusion, microbial processes, or atmospheric exchange) on the oxygen isotope signatures of soil-respired CO2 compared to its carbon signatures. Future research must prioritize identifying and quantifying these drivers for the δ18O shifts of soil-respired CO2.
This study provides new insights into the factors driving the δ18O and δ13C values of CO2 released from total soil respiration under a temperate forest floor, yet offers no characterization of the two isotopic signatures for soil respiration components. To advance understanding of the forest ecosystem C cycle under global change, future research would move beyond total soil respiration isotopes and implement targeted, long-term field studies that explicitly measure and differentiate the δ18O and δ13C signatures of CO2 released from soil autotrophic and heterotrophic respiration across various site-specific terrestrial ecosystems. This component-specific data should be crucial for accurate partitioning and modeling of soil C dynamics in terrestrial ecosystems.

Supplementary Materials

The following supporting information can be downloaded at: https://www.mdpi.com/article/10.3390/plants14172707/s1, Table S1. Changes in δ13C and δ18O values of respired CO2 as well as CO2 and CH4 fluxes prior to and after the removal of moss blankets; Table S2. Means and standard errors (in bracket) of δ13C values of CO2 respired from N-treated and non-treated plots with and without mosses and the results of ANOVA analysis; Table S3. Means and standard errors (in bracket) of δ18O values of CO2 respired from N-treated and non-treated plots with and without mosses and the results of ANOVA analysis.

Author Contributions

Conceptualization, methodology, software, validation, resources, writing—original draft preparation, X.X.; investigation, X.X., J.Y. and W.C.; formal analysis, X.X., W.C., Y.K., S.K. and D.K.; writing—reviewing and editing, X.X., Y.K., E.F., J.Y., W.C., D.K. and S.K.; data curation, E.F. and X.X.; supervision, Y.K. and X.X.; projection administration, X.X.; funding acquisition, X.X., S.K. and D.K. All authors have read and agreed to the published version of the manuscript.

Funding

This work was supported by the National Natural Science Foundation of China (Grant Nos. 41775163, 41975121, and 42275130) and the Ministry of Science and High Education of the Russian Federation (State assignment 122040500037-6).

Data Availability Statement

The data are contained within the article.

Acknowledgments

The authors thank the National Research Station of Changbai Mountain Forest Ecosystems for support. Sincere thanks are given to Guo Shan, Xu Hao, Wang Xiaohua, Xu Tingting, and Wang Xiuxiu due to their assistance in field experiment management and measurement and laboratory analysis.

Conflicts of Interest

The authors declare no conflicts of interest.

References

  1. Farquhar, G.D.; Lloyd, J.; Taylor, J.A.; Flanagan, L.B.; Syversten, J.P.; Hubick, K.T.; Wong, S.C.; Ehleringer, J.R. Vegetation effects on the isotopic composition of oxygen in atmospheric CO2. Nature 1993, 363, 439–443. [Google Scholar] [CrossRef]
  2. Ciais, P.; Tans, P.P.; Trolier, M.; White, J.W.C.; Francey, R.J. A large northern hemisphere terrestrial CO2 sink indicated by the 13C/12C ratio of atmospheric CO2. Science 1995, 269, 1098–1102. [Google Scholar] [CrossRef] [PubMed]
  3. Ehleringer, J.R.; Bowling, D.R.; Flanagan, L.B.; Fessenden, J.; Helliker, B.; Martinelli, L.A.; Ometto, J.P. Stable isotopes and carbon cycle processes in forests and grasslands. Plant Biol. 2002, 4, 181–189. [Google Scholar] [CrossRef]
  4. Pataki, D.E.; Ehleringer, J.R.; Flanagan, L.B.; Yakir, D.; Bowling, D.R.; Still, C.J.; Buchmann, N.; Kaplan, J.O.; Berry, J.A. The application and interpretation of Keeling plots in terrestrial carbon cycle research. Glob. Biogeochem. Cycles 2003, 17, 1022. [Google Scholar] [CrossRef]
  5. McDowell, N.G.; Bowling, D.R.; Schauer, A.; Irvine, J.; Bond, B.J.; Law, B.E.; Ehleringer, J.R. Associations between carbon isotope ratios of ecosystem respiration, water availability and canopy conductance. Glob. Change Biol. 2004, 10, 1767–1784. [Google Scholar] [CrossRef]
  6. Ometto, J.P.H.; Flanagan, L.B.; Martinelli, L.A.; Ehleringer, J.R. Oxygen isotope ratios of waters and respired CO2 in Amozonian forest and pasture ecosystems. Ecol. Appl. 2005, 15, 58–70. [Google Scholar] [CrossRef]
  7. Barbour, M.M.; Hunt, J.E.; Kodama, N.; Laubach, J.; McSeveny, T.M.; Rogers, G.N.D.; Tcherkez, G.; Wingate, L. Rapid changes in δ13C of ecosystem-respired CO2 after sunset are consistent with transient 13C enrichment of leaf respired CO2. New Phytol. 2011, 190, 990–1002. [Google Scholar] [CrossRef]
  8. Mauritz, M.; Celis, G.; Ebert, C.; Hutchings, J.; Ledman, J.; Natali, S.M.; Pegoraro, E.; Salmon, V.G.; Schädel, C.; Taylor, M.; et al. Using stable carbon isotopes of seasonal ecosystem respiration to determine permafrost carbon loss. JGR Biogeosci. 2019, 124, 46–60. [Google Scholar] [CrossRef]
  9. Diao, H.Y.; Wang, A.Z.; Yuan, F.H.; Guan, D.X.; Dai, G.H.; Wu, J.B. Environmental effects on carbon isotope discrimination from assimilation to respiration in a coniferous and broad-leaved mixed forest of Northeast China. Forests 2020, 11, 1156. [Google Scholar] [CrossRef]
  10. Xu, X.K. Effect of changes in throughfall on soil respiration in global forest ecosystems: A meta-analysis. Forests 2023, 14, 1037. [Google Scholar] [CrossRef]
  11. Flanagan, L.B.; Brooks, J.R.; Varney, G.T.; Ehleringer, J.R. Discrimination against C18O16O during photosynthesis and the oxygen isotope ratio of respired CO2 in boreal forest ecosystems. Glob. Biogeochem. Cycles 1997, 11, 83–98. [Google Scholar] [CrossRef]
  12. Riley, W.J.; Still, C.J.; Helliker, B.R.; Ribas-Carbo, M.; Berry, J.A. 18O composition of CO2 and H2O ecosystem pools and fluxes in a tallgrass prairie: Simulations and comparisons to measurements. Glob. Change Biol. 2003, 9, 1567–1581. [Google Scholar] [CrossRef]
  13. Moyes, A.B.; Gaines, S.J.; Siegwolf, R.T.W.; Bowling, D.R. Diffusive fractionation complicates isotopic partitioning of autotrophic and heterotrophic sources of soil respiration. Plant Cell Environ. 2010, 33, 1804–1819. [Google Scholar] [CrossRef]
  14. Goffin, S.; Aubinet, M.; Maier, M.; Plain, C.; Schack-kirchner, H.; Longdoz, B. Characterization of the soil CO2 production and its carbon isotope composition in forest soil layers using the flux-gradient approach. Agric. For. Meteorol. 2014, 188, 45–57. [Google Scholar] [CrossRef]
  15. Williams, T.G.; Flanagan, L.B. Effect of changes in water content on photosynthesis, transpiration and discrimination against 13CO2 and C18O16O in Pleurozium and Sphagnum. Oecologia 1996, 108, 38–46. [Google Scholar] [CrossRef]
  16. Flanagan, L.B.; Kubien, D.S.; Ehleringer, J.R. Spatial and temporal variation in the carbon and oxygen stable isotope ratio of respired CO2 in a boreal forest ecosystem. Tellus B Chem. Phys. Meteorol. 1999, 51, 367–384. [Google Scholar] [CrossRef]
  17. Min, K.; Lehmeier, C.A.; Ballantyne, F.; Billings, S.A. Carbon availability modifies temperature responses of heterotrophic microbial respiration, carbon uptake affinity, and stable carbon isotope discrimination. Front. Microbiol. 2016, 7, 2083. [Google Scholar] [CrossRef]
  18. Wingate, L.; Ogée, J.; Cuntz, M.; Genty, B.; Reiter, L.; Seibt, U.; Yakir, D.; Maseyk, K.; Pendall, E.G.; Barbour, M.M.; et al. The impact of soil microorganisms on the global budget of δ18O in atmospheric CO2. Proc. Natl. Acad. Sci. USA 2009, 106, 22411–22415. [Google Scholar] [CrossRef]
  19. Wingate, L.; Ogée, J.; Burlett, R.; Bosc, A. Strong seasonal disequilibrium measured between the oxygen isotope signals of leaf and soil CO2 exchange. Glob. Change Biol. 2010, 16, 3048–3064. [Google Scholar] [CrossRef]
  20. Goulden, M.L.; Crill, P.M. Automated measurements of CO2 exchange at the moss surface of a black spruce forest. Tree Physiol. 1997, 17, 537–542. [Google Scholar] [CrossRef] [PubMed]
  21. Delucia, E.H.; Turnbull, M.H.; Walcroft, A.S.; Griffin, K.L.; Tissue, D.T.; Glenny, D.; McSeveny, T.M.; Whitehead, D. The contribution of bryophytes to the carbon exchange for a temperate rainforest. Glob. Change Biol. 2003, 9, 1158–1170. [Google Scholar] [CrossRef]
  22. Silvola, J. Combined effects of varying water content and CO2 concentration on photosynthesis in Sphagnum fuscum. Holarct. Ecol. 1990, 13, 224–228. Available online: https://www.jstor.org/stable/3682506 (accessed on 2 July 2025).
  23. Rice, S.K.; Giles, L. The influence of water content and leaf anatomy on carbon isotope discrimination and photosynthesis in Sphagnum. Plant Cell Environ. 1996, 19, 118–124. [Google Scholar] [CrossRef]
  24. Fessenden, J.E.; Ehleringer, J.R. Temporal variation in δ13C of ecosystem respiration in the Pacific Northwest: Links to moisture stress. Oecologia 2003, 136, 129–136. [Google Scholar] [CrossRef] [PubMed]
  25. Coxson, D.S.; Mcintyre, D.D.; Vogel, H.J. Pulse release of sugars and polyols from canopy bryophytes in tropical montane rain forest Guadeloupe French West Indies. Biotropica 1992, 24, 121–133. [Google Scholar] [CrossRef]
  26. Wilson, J.A.; Coxson, D.S. Carbon flux in a subalpine spruce-fir forest: Pulse release from Hylocomium splendens feather-moss mats. Can. J. Bot. 1999, 77, 564–569. [Google Scholar] [CrossRef]
  27. Deluca, T.H.; Zackrisson, O.; Nilsson, M.C.; Sellstedt, A. Quantifying nitrogen-fixation in feather moss carpets of boreal forests. Nature 2002, 419, 917–920. [Google Scholar] [CrossRef]
  28. Sun, S.Q.; Liu, T.; Wu, Y.H.; Wang, G.X.; Zhu, B.; DeLuca, T.H.; Wang, Y.Q.; Luo, J. Ground bryophytes regulate net soil carbon efflux: Evidence from two subalpine ecosystems on the east edge of the Tibet Plateau. Plant Soil 2017, 417, 363–375. [Google Scholar] [CrossRef]
  29. Vitousek, P.M.; Aber, J.D.; Howarth, R.W.; Likens, G.E.; Matson, P.A.; Schindler, D.W.; Schlesinger, W.H.; Tilman, D. Human alteration of the global nitrogen cycle: Sources and consequences. Ecol. Appl. 1997, 7, 737–750. [Google Scholar] [CrossRef]
  30. Galloway, J.N.; Townsend, A.R.; Erisman, J.W.; Bekunda, M.; Cai, Z.C.; Freney, J.R.; Martinelli, L.A.; Seitzinger, S.P.; Sutton, M.A. Transformation of the nitrogen cycle: Recent trends, questions, and potential solutions. Science 2008, 320, 889–892. [Google Scholar] [CrossRef]
  31. Leppänen, S.M.; Salemaa, M.; Smolander, A.; Mäkipää, R.; Tiirola, M. Nitrogen fixation and methanotrophy in forest mosses along a N deposition gradient. Environ. Exp. Bot. 2013, 90, 62–69. [Google Scholar] [CrossRef]
  32. Saiz, E.; Sgouridis, F.; Drijfhout, F.P.; Peichl, M.; Nilsson, M.B.; Ullah, S. Chronic atmospheric reactive nitrogen deposition suppress biological nitrogen fixation in peatlands. Environ. Sci. Technol. 2021, 55, 1310–1318. [Google Scholar] [CrossRef]
  33. Mäkipää, R. Sensitivity of forest floor bryophytees in boreal forests to sulphur and nitrogen deposition. Water Air Soil Pollut. 1995, 85, 1239–1244. [Google Scholar] [CrossRef]
  34. Gunnarsson, U.; Rydin, H. Nitrogen fertilization reduces Sphagnum production in bog communities. New Phytol. 2000, 147, 527–537. [Google Scholar] [CrossRef]
  35. Salemaa, M.; Mäkipää, R.; Oksanen, J. Differences in the growth response of three bryophyte species to nitrogen. Environ. Pollut. 2008, 152, 82–91. [Google Scholar] [CrossRef] [PubMed]
  36. Limpens, J.; Granath, G.; Gunnarsson, U.; Aerts, R.; Bayley, S.; Bragazza, L.; Bubier, J.; Buttler, A.; van den Berg, L.J.L.; Francez, A.J.; et al. Climatic modifiers of the response to nitrogen deposition in peatforming Sphagnum mosses: A meta-analysis. New Phytol. 2011, 191, 496–507. [Google Scholar] [CrossRef]
  37. Gundale, M.J.; Deluca, T.H.; Nordin, A. Bryophytes attenuate anthropogenic nitrogen inputs in boreal forests. Glob. Change Biol. 2011, 17, 2743–2753. [Google Scholar] [CrossRef]
  38. Lu, F.; Yi, B.L.; Qin, K.; Bu, Z.J. Long-term nitrogen addition eliminates the cooling effect on climate in a temperate peatland. Plants 2025, 14, 1183. [Google Scholar] [CrossRef] [PubMed]
  39. Tian, D.S.; Niu, S.L. A global analysis of soil acidification caused by nitrogen addition. Environ. Res. Lett. 2015, 10, 024019. [Google Scholar] [CrossRef]
  40. Yu, M.X.; Wang, Y.P.; Baldock, J.A.; Jiang, J.; Mo, J.M.; Zhou, G.Y.; Yan, J.H. Divergent responses of soil organic carbon accumulation to 14 years of nitrogen addition in two typical subtropical forests. Sci. Total Environ. 2020, 707, 136104. [Google Scholar] [CrossRef]
  41. Xu, X.K.; Han, L.; Luo, X.B.; Han, S.J. Synergistic effects of nitrogen amendments and ethylene on atmospheric methane uptake under a temperate old-growth forest. Adv. Atmos. Sci. 2011, 28, 843–854. [Google Scholar] [CrossRef]
  42. Xia, N.; Du, E.Z.; Wu, X.H.; Tang, Y.; Wang, Y.; de Vries, W. Effects of nitrogen addition on soil methane uptake in global forest biomes. Environ. Pollut. 2020, 264, 114751. [Google Scholar] [CrossRef]
  43. Jordan, S.F.A.; Schloemer, S.; Krüger, M.; Heffner, T.; Horn, M.A.; Blumenberg, M. Interferences caused by the biogeochemical methane cycle in peats during the assessment of abandoned oil wells. Biogeosciences 2025, 22, 809–830. [Google Scholar] [CrossRef]
  44. Xu, X.K.; Inubushi, K. Responses of ethylene and methane consumption to temperature and pH in temperate volcanic forest soils. Eur. J. Soil Sci. 2009, 60, 489–498. [Google Scholar] [CrossRef]
  45. Zhou, G.; Liu, Q.J.; Xu, Z.Z.; Du, W.X.; Yu, J.; Meng, S.W.; Zhou, H.; Qi, L.H.; Shah, S. How can the shade intolerant Korean pine survive under dense deciduous canopy? For. Ecol. Manag. 2020, 457, 117735. [Google Scholar] [CrossRef]
  46. Kammer, A.; Tuzson, B.; Emmenegger, L.; Knohl, A.; Mohn, J.; Hagedorn, F. Application of a quantum cascade laser-based spectrometer in a closed chamber system for real-time δ13C and δ18O measurements of soil-respired CO2. Agric. For. Meteorol. 2011, 151, 39–48. [Google Scholar] [CrossRef]
  47. Keeling, C.D. The concentration and isotopic abundances of atmospheric carbon dioxide in rural areas. Geochim. Cosmochim. Acta 1958, 13, 322–334. [Google Scholar] [CrossRef]
  48. Keeling, C.D. The concentration and isotopic abundances of carbon dioxide in rural and marine air. Geochim. Cosmochim. Acta 1961, 24, 277–298. [Google Scholar] [CrossRef]
  49. Xu, X.K.; Wu, H.H.; Yue, J.; Tang, S.R.; Cheng, W.G. Effects of snow cover on carbon dioxide emissions and their δ13C values of temperate forest soils with and without litter. Forests 2023, 14, 1384. [Google Scholar] [CrossRef]
  50. Al-Shammary, A.A.G.; Kouzani, A.Z.; Kaynak, A.; Khoo, S.Y.; Norton, M.; Gates, W. Soil bulk density estimation methods: A review. Pedosphere 2018, 28, 581–596. [Google Scholar] [CrossRef]
  51. Vance, E.D.; Brookesa, P.C.; Jenkinsona, D.S. An extraction method for measuring soil microbial biomass C. Soil Biol. Biochem. 1987, 19, 703–707. [Google Scholar] [CrossRef]
  52. Wu, J.; Joergensen, R.G.; Pommerening, B.; Chaussod, R.; Brookes, P.C. Measurement of soil microbial biomass C: An automated procedure. Soil Biol. Biochem. 1990, 22, 1167–1169. [Google Scholar] [CrossRef]
  53. Jenkinson, D.S.; Brookes, P.C.; Powlson, D.S. Measuring soil microbial biomass. Soil Biol. Biochem. 2004, 36, 5–7. [Google Scholar] [CrossRef]
  54. Xu, X.K.; Luo, X.B.; Jiang, S.H.; Xu, Z.J. Biodegradation of dissolved organic carbon in soil extracts and leachates from a temperate forest stand and its relationship to ultraviolet absorbance. Chin. Sci. Bull. 2012, 57, 912–920. [Google Scholar] [CrossRef]
  55. R Core Team. R: A Language and Environment for Statistical Computing; R Foundation for Statistical Computing: Vienna, Austria, 2024. [Google Scholar]
  56. Xu, X.K.; Duan, C.T.; Wu, H.H.; Luo, X.B.; Han, L. Effects of changes in throughfall on soil GHG fluxes under a mature temperate forest, northeastern China. J. Environ. Manag. 2021, 294, 112950. [Google Scholar] [CrossRef]
  57. Sinsabaugh, R.L.; Hill, B.H.; Shah, J.J.F. Ecoenzymatic stoichiometry of microbial organic nutrient acquisition in soil and sediment. Nature 2009, 462, 795–798. [Google Scholar] [CrossRef]
  58. Sinsabaugh, R.L.; Shah, J.J.F. Ecoenzymatic Stoichiometry and Ecological Theory. Annu. Rev. Ecol. Evol. Syst. 2012, 43, 313–343. [Google Scholar] [CrossRef]
  59. Fu, Y.W.; Li, Y.F.; Yu, Z.C. Last millennium hydroclimate and atmospheric circulation change in Northeast China: A dual δ13C and δ18O approach from a mountaintop Sphagnum bog. Quat. Sci. Rev. 2022, 295, 107781. [Google Scholar] [CrossRef]
  60. Flanagan, L.B.; Varney, G.T. Influence of vegetation and soil CO2 exchange on the concentration and stable oxygen isotope ratio of atmospheric CO2 within a Pinus resinosa canopy. Oecologia 1995, 101, 37–44. [Google Scholar] [CrossRef] [PubMed]
  61. Tans, P.P. Oxygen isotopic equilibrium between carbon dioxide and water in soils. Tellus B Chem. Phys. Meteorol. 1998, 50, 163–178. [Google Scholar] [CrossRef]
  62. Hesterberg, R.; Siegenthaler, U. Production and stable isotopic composition of CO2 in a soil near Bern, Switzerland. Tellus B Chem. Phys. Meteorol. 1991, 43, 197–205. [Google Scholar] [CrossRef]
  63. Kylin, H.; Bouwman, H. Hydration state of the moss hylocomium splendens and the lichen cladina stellaris governs uptake and revolatilization of airborne α and γ-hexachlorocyclohexane. Environ. Sci. Technol. 2012, 46, 10982–10989. [Google Scholar] [CrossRef] [PubMed]
  64. Knohl, A.; Werner, R.A.; Brand, W.A.; Buchmann, N. Short-term variations in δ13C of ecosystem respiration reveals link between assimilation and respiration in a deciduous forest. Oecologia 2005, 142, 70–82. [Google Scholar] [CrossRef] [PubMed]
  65. Gavrichkova, O.; Proietti, S.; Moscatello, S.; Portarena, S.; Battistelli, A.; Matteucci, G.; Brugnoli, E. Short-term natural δ13C and δ18O variations in pools and fluxes in a beech forest: The transfer of isotopic signal from recent photosynthates to soil respired CO2. Biogeosciences 2011, 8, 2833–2846. [Google Scholar] [CrossRef]
  66. Mironov, V.L. Threshold behavior hidden in the growth response of peat moss Sphagnum riparium to temperature. Plants 2024, 13, 3241. [Google Scholar] [CrossRef] [PubMed]
  67. Gillon, J.; Yakir, D. Influence of carbonic anhydrase activity in terrestrial vegetation on the 18O content of atmospheric CO2. Science 2001, 291, 2584–2587. [Google Scholar] [CrossRef]
  68. Gimeno, T.E.; Ogée, J.; Royles, J.; Gibon, Y.; West, J.B.; Burlett, R.; Jones, S.P.; Sauze, J.; Wohl, S.; Benard, C.; et al. Bryophyte gas-exchange dynamics along varying hydration status reveal a significant carbonyl sulphide (COS) sink in the dark and COS source in the light. New Phytol. 2017, 215, 965–976. [Google Scholar] [CrossRef]
  69. Ryhti, K.; Schiestl-Aalto, P.; Tang, Y.; Rinne-Garmston, K.T.; Ding, Y.Y.; Pumpanen, J.; Biaso, C.; Saurer, M.; Baeck, J.; Kulmala, L. Effects of variable temperature and moisture conditions on respiration and nonstructural carbohydrate dynamics of tree roots. Agric. For. Meteorol. 2022, 323, 109040. [Google Scholar] [CrossRef]
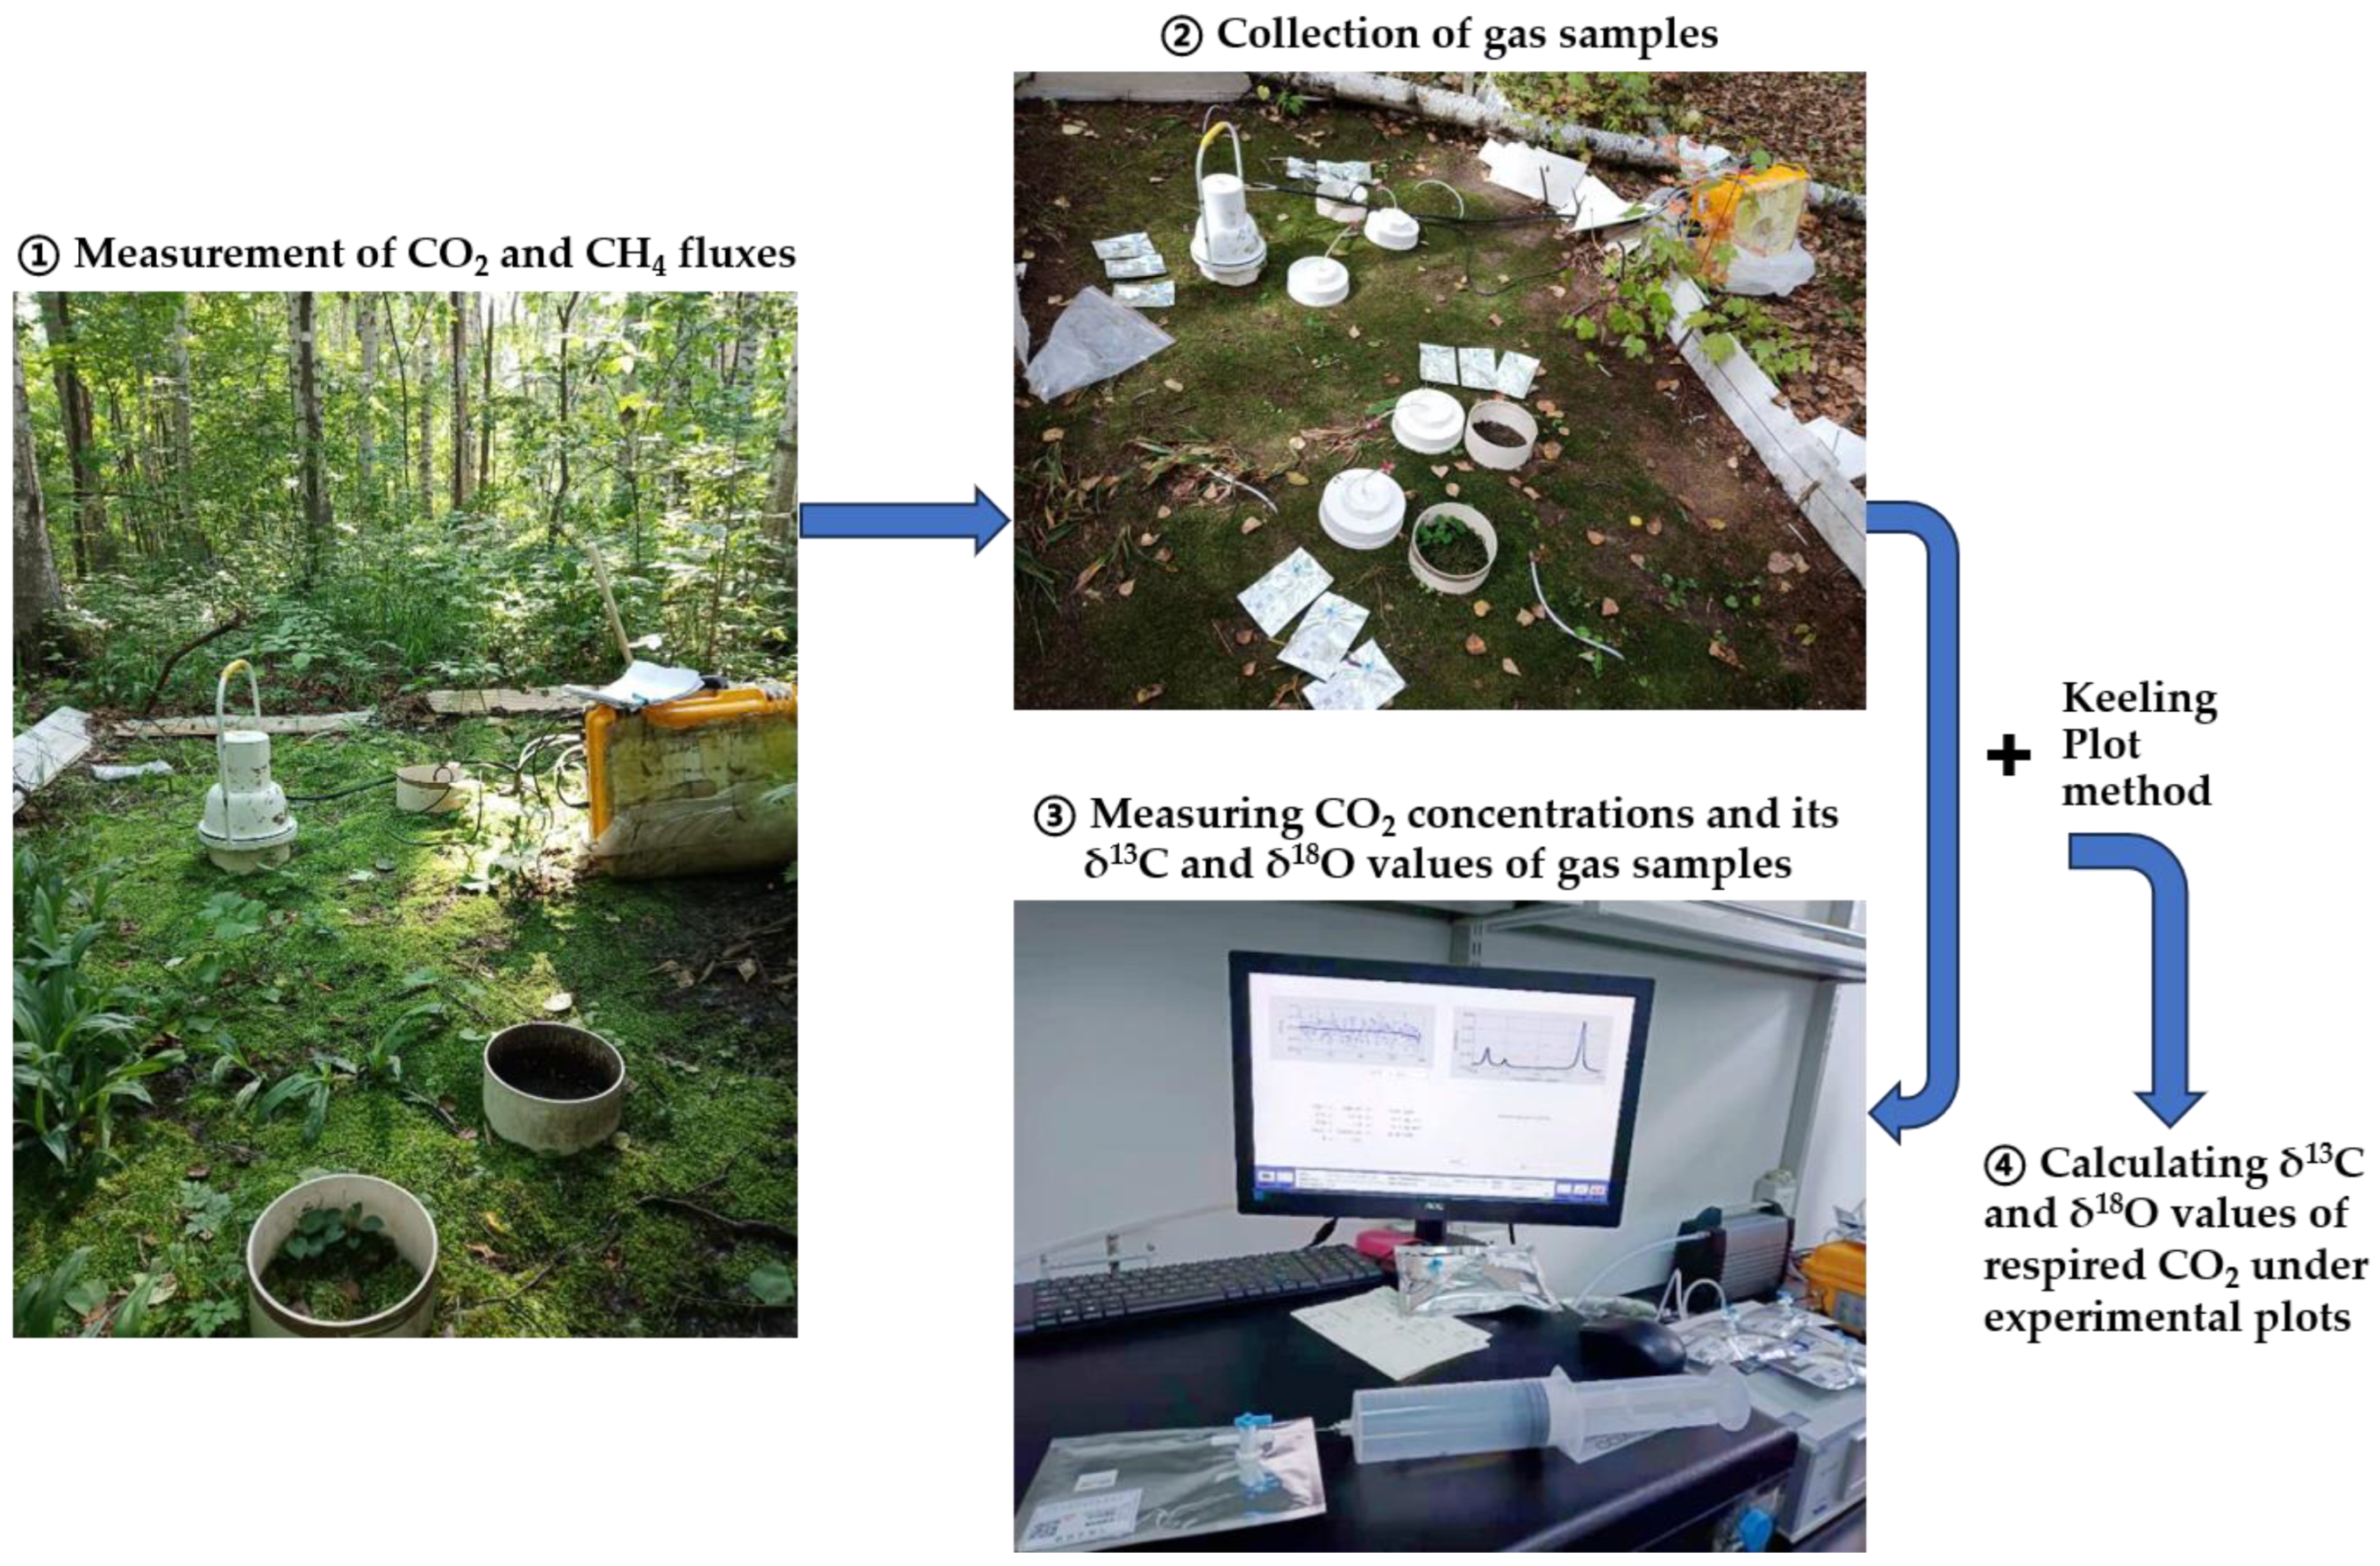
Figure 1. Apparatus for measuring CO2 and CH4 fluxes, δ13C and δ18O values of respired CO2 under experimental plots. Upon each flux measurement, grasses and litter in all the experimental plots and inside soil collars were removed artificially.
Plants 14 02707 g001
Figure 2. Box plots of daily CO2 (a) and CH4 (b) fluxes from N-treated and non-treated experimental plots with and without moss cover in autumn seasons of 2019, 2021, and 2024. Boxes show interquartile (IQR), and circles and horizontal lines in boxes show mean and median values, respectively. Lower and upper whiskers (x) represent 75 percentiles plus 1.5 IQR and 25 percentiles minus 1.5 IQR, respectively. Results of ANOVA are shown in Figure 2. **, p < 0.01; ***, p < 0.001; ns, not significant.
Plants 14 02707 g002
Figure 3. Relationships between δ13C (ac) and δ18O (df) values of respired CO2 versus CO2 and CH4 fluxes and soil moisture at 7 cm depth. Non-linear regressions were fitted according to all data with and without mosses, and 95% confidence bands were shown in red.
Plants 14 02707 g003
Figure 4. Random forest analysis explaining the effects of environmental variables on the δ13C (a) and δ18O values (b) of respired CO2. MSE, mean squared error; MBC, microbial biomass C; MBN, microbial biomass N; DOC, dissolved organic C; DTN; dissolved total N; δ13C-CO2 and δ18O-CO2 represent the δ13C and δ18O values of respired CO2, respectively. CH4 and CO2 fluxes represent CH4 and CO2 fluxes from experimental plots with mosses. *, p < 0.05; **, p < 0.01.
Plants 14 02707 g004
Figure 5. Structural equation modeling (SEM) analysis of causal relationships among N addition, moss, soil moisture, CO2 and CH4 fluxes, and δ13C-CO2 (a), and their standardized total effects from SEM (b). Single-headed arrows indicate the hypothesized direction of causation. δ13C-CO2 represents δ13C values of respired CO2. Solid and dash arrows indicate positive and negative relationships, respectively. The width of arrows is in proportion to the intensity of the relationship. The numbers near the arrows are the standardized path coefficients, and R2 values indicate the proportion of variations interpreted by relationships with other variables. χ2 stands for Chi-square, CFI for comparative fit index, and RMSEA for root-mean-square error of approximation. df and p show degrees of freedom and probability level, respectively. *, p < 0.05; ***, p < 0.001.
Plants 14 02707 g005aPlants 14 02707 g005b
Figure 6. Structural equation modeling (SEM) analysis of causal relationships among N addition, moss, soil moisture, CO2 and CH4 fluxes, and δ18O-CO2 (a), and their standardized total effects from SEM (b). δ18O-CO2 represents δ18O values of respired CO2. Single-headed arrows indicate the hypothesized direction of causation. Solid and dash arrows indicate positive and negative relationships, respectively. The width of arrows is in proportion to the intensity of the relationship. The numbers near the arrows are the standardized path coefficients, and R2 values indicate the proportion of variations interpreted by relationships with other variables. χ2 stands for Chi-square, CFI for comparative fit index, and RMSEA for root-mean-square error of approximation. df and p show degrees of freedom and probability level, respectively. *, p < 0.05; **, p < 0.01; ***, p < 0.001.
Plants 14 02707 g006aPlants 14 02707 g006b
Table 1. Means and ranges of soil properties across all treatments in the plots with mosses and the results of ANOVA analysis a.
TreatmentsDOC
(μg C g−1)
DTN
(μg N g−1)
SUVA254
(L mg−1 C m−1)
MBC
(μg C g−1)
MBN
(μg N g−1)
pH
(Water)
Bulk Density
(g cm−3)
Control90.2 (72.5–107.5)14.8 (9.4–22.5)1.92 (1.49–2.25)604.1 (390.1–996.7)140.5 (80.8–192.90)5.84 (5.49–6.10)0.95 (0.49–1.30)
Low N95.1 (67.8–141.7)15.4 (9.0–23.4)2.22 (1.56–2.87)527.5 (305.9–897.6)113.7 (79.7–156.7)5.45 (5.02–6.00)1.01 (0.56–1.31)
High N103.8 (80.2–139.2)27.8 (17.1–52.9)2.31 (1.85–3.45)734.5 (432.3–1226.2)168.2 (137.3–191.7)5.17 (4.95–5.55)0.90 (0.50–1.18)
ANOVA with treatment as a fixed factor and year as a random factor (p value)
Treatment0.2650.0150.0030.1200.0660.0040.012
Year0.5110.0490.3400.0120.5170.0200.000
Treatment × Year0.3150.1730.9750.0670.1020.0610.810
a DOC, dissolved organic C; DTN, dissolved total N; SUVA254, the specific UV absorbance of soil K2SO4 extracts at 254 nm; MBC, microbial biomass C; MBN, microbial biomass N.
Table 2. Means and ranges of δ13C and δ18O values of the CO2 respired from N-treated and non-treated experimental plots with and without mosses and the results of ANOVA analysis.
Treatmentsδ13C Values of Respired CO2 (‰)δ18O Values of Respired CO2 (‰)
With mosses
Control−23.95 (−29.14 to −21.51)−13.89 (−32.27 to −2.49)
Low N−24.76 (−28.32 to −21.49)−12.50 (−21.32 to −5.87)
High N−23.88 (−28.99 to −20.77)−16.78 (−22.16 to −8.79)
Without mosses
Control−22.92 (−28.01 to −20.12)−15.38 (−33.60 to −2.22)
Low N−23.70 (−28.13 to −20.04)−14.27 (−27.14 to −4.43)
High N−23.28 (−27.75 to −20.31)−17.48 (−28.86 to −8.77)
ANOVA with moss and treatment as fixed factors and year as a random factor (p value)
Treatment0.4800.715
Moss0.0250.003
Year0.0020.331
Treatment × Moss0.3120.935
Treatment × Year0.0070.029
Moss × Year0.3300.997
Treatment × Moss × Year0.9330.367
Table 3. Correlation between δ13C and δ18O values of respired CO2 versus CO2 and CH4 fluxes and soil properties a.
CO2 FluxCH4 FluxMoistureTemperatureDOCDTNpHBulk DensityMBCMBNSUVA254
δ13C0.65 **−0.44 **−0.74 **0.76 **−0.21−0.39 *−0.34 *0.79 **−0.61 **0.320.03
δ18O0.34 **−0.34 **−0.41 **0.30 **−0.25−0.40 **−0.090.41 *−0.330.180.00
a *, p < 0.05; **, p < 0.01. δ13C and δ18O represent δ13C and δ18O values of respired CO2, respectively. For other abbreviations, see Table 1.
Disclaimer/Publisher’s Note: The statements, opinions and data contained in all publications are solely those of the individual author(s) and contributor(s) and not of MDPI and/or the editor(s). MDPI and/or the editor(s) disclaim responsibility for any injury to people or property resulting from any ideas, methods, instructions or products referred to in the content.