Article

Comprehensive Evaluation and DNA Fingerprints of Liriodendron Germplasm Accessions Based on Phenotypic Traits and SNP Markers

1
State Key Laboratory of Tree Genetics and Breeding, Co-Innovation Center for Sustainable Forestry in Southern China, Nanjing Forestry University, Nanjing 210037, China
2
College of Architecture, Anhui Science and Technology University, Bengbu 233100, China
*
Author to whom correspondence should be addressed.
Plants 2025, 14(17), 2626; https://doi.org/10.3390/plants14172626
Submission received: 28 July 2025 / Revised: 20 August 2025 / Accepted: 21 August 2025 / Published: 23 August 2025
(This article belongs to the Section Plant Molecular Biology)

Abstract

Germplasm resources embody the genetic diversity of plants and form the foundation for breeding and the ongoing improvement of elite cultivars. The establishment of germplasm banks, along with their systematic evaluation, constitutes a critical step toward the conservation, sustainable use, and innovative utilization of these resources. Liriodendron, a rare and endangered tree genus with species distributed in both East Asia and North America, holds considerable ecological, ornamental, and economic significance. However, a standardized evaluation system for Liriodendron germplasm remains unavailable. In this study, 297 Liriodendron germplasm accessions were comprehensively evaluated using 34 phenotypic traits and whole-genome resequencing data. Substantial variation was observed in most phenotypic traits, with significant correlations identified among several characteristics. Cluster analysis based on phenotypic data grouped the accessions into three distinct clusters, each exhibiting unique distribution patterns. This classification was further supported by principal component analysis (PCA), which effectively captured the underlying variation among accessions. These phenotypic groupings demonstrated high consistency with subsequent population structure analysis based on SNP markers (K = 3). Notably, several key traits exhibited significant divergence (p < 0.05) among distinct genetic clusters, thereby validating the coordinated association between phenotypic variation and molecular markers. Genetic diversity and population structure were assessed using 4204 high-quality single-nucleotide polymorphism (SNP) markers obtained through stringent filtering. The results indicated that the Liriodendron sino-americanum displayed the highest genetic diversity, with an expected heterozygosity (He) of 0.18 and a polymorphic information content (PIC) of 0.14. In addition, both hierarchical clustering and PCA revealed clear population differentiation among the accessions. Association analysis between three phenotypic traits (DBH, annual height increment, and branch number) and SNPs identified 25 highly significant SNP loci (p < 0.01). Of particular interest, the branch number-associated locus SNP_17_69375264 (p = 1.03 × 10⁻⁵) demonstrated the strongest association, highlighting distinct genetic regulation patterns among different growth traits. A minimal set of 13 core SNP markers was subsequently used to construct unique DNA fingerprints for all 297 accessions. In conclusion, this study systematically characterized phenotypic traits in Liriodendron, identified high-quality and core SNPs, and established correlations between key phenotypic and molecular markers. These achievements enabled differential analysis and genetic diversity assessment of Liriodendron germplasm, along with the construction of DNA fingerprint profiles. The results provide crucial theoretical basis and technical support for germplasm conservation, accurate identification, and utilization of Liriodendron resources, while offering significant practical value for variety selection, reproduction and commercial applications of this species.

1. Introduction

The genus Liriodendron, belonging to the family Magnoliaceae, comprises two extant species: Liriodendron chinense, native to East Asia, and Liriodendron tulipifera, found in eastern North America. Liriodendron species are large deciduous trees that can grow up to 40 m tall and are characterized by their distinctive leaf shapes, showy flowers, and straight, upright trunks—traits that contribute to their ecological, ornamental, and timber value. The wood is lightweight, fine-textured, and naturally resistant to pests, while the trees themselves demonstrate strong environmental adaptability, including tolerance to air pollution [1]. Owing to their ecological resilience and economic utility, Liriodendron species hold significant potential for research on phylogeny, genetic diversity, and species conservation, as well as for breeding and practical applications in forestry and landscaping [2].
The comprehensive collection, preservation, and assessment of Liriodendron germplasm resources serve dual critical purposes of safeguarding genetic diversity and ecological functionality while establishing the essential foundation for breeding superior cultivars through contemporary forest tree improvement programs. Phenotypic characterization represents the most immediate and reliable methodology for germplasm evaluation, enabling thorough documentation of accession performance and revealing underlying genetic diversity and adaptive potential [3]. Recent investigations have yielded systematic advances in understanding key phenotypic attributes of L. tulipifera, L. chinense, and their interspecific hybrids. Notably, Zong et al. identified three AP2/ERF transcription factors exhibiting shoot apical meristem-specific expression patterns in Liriodendron through genome-wide analysis, potentially governing early leaf morphogenesis [4]. Significant progress has also been made in flowering trait research, with Sheng et al. elucidating floral transition regulatory mechanisms via comparative transcriptomic profiling [5]. Furthermore, Liu et al. characterized spatiotemporal expression dynamics among MADS-box transcription factors during floral development, providing mechanistic insights into floral architecture variation within the genus [6]. These meticulous phenotypic analyses have significantly advanced our comprehension of phenotypic plasticity and adaptive evolutionary processes in Liriodendron, while simultaneously informing practical applications in germplasm classification, conservation management, and genetic enhancement initiatives. Although many researchers have conducted extensive studies on phenotypic traits and genetic mechanisms in Liriodendron [7,8,9], the integrated evaluation systems combining phenotypic traits with SNP markers remains underdeveloped.
Evaluating and characterizing the genetic diversity of germplasm resources is essential for constructing core germplasm collections. To date, a variety of molecular markers have been utilized in plant genetic research, including conventional markers such as restriction fragment length polymorphism (RFLP), random amplified polymorphic DNA (RAPD), amplified fragment length polymorphism (AFLP), inter-simple sequence repeat (ISSR), and simple sequence repeat (SSR), as well as sequencing-based markers such as single nucleotide polymorphisms (SNPs) and insertion/deletion polymorphisms (InDels) [10]. Recent advances in high-throughput sequencing technologies have significantly enhanced association analyses between molecular markers and plant phenotypic traits, establishing this approach as a powerful methodology for elucidating genetic diversity and developing comprehensive germplasm resource maps. Representative studies demonstrate the effectiveness of this strategy. Wang et al. successfully identified multiple SCoT marker loci significantly associated with 12 ornamental traits through marker-trait association analysis of 65 chrysanthemum germplasm accessions [11]. In parallel research, Donkpegan et al. performed genome-wide association analysis on 23 fruit quality traits across 116 sweet cherry germplasm resources, pinpointing SNP markers strongly correlated with critical agronomic characteristics including fruit size and firmness [12]. These investigations collectively provide molecular-level insights into phenotypic expression patterns. In phenotypic–molecular association studies, SNPs have become the predominant marker class owing to their abundance, genome-wide coverage, and high information density [13]. Their effectiveness has been demonstrated across diverse taxa, including Acorus tatarinowii [14], Zea mays [15], and Dioscorea rotundata [16], in which these markers have proved useful for assessing genetic diversity and constructing DNA fingerprints.
With the advancement of DNA molecular marker technology, the evaluation of germplasm resources in an increasing number of species has shifted from phenotypic characterization to high-resolution genotyping, providing a foundation for the development of standardized DNA fingerprinting systems. In recent years, SNP-based and SSR-based fingerprinting platforms have been established in most tree species [17]. For example, Yan et al. [18] analyzed the genetic diversity and genetic structure of 161 clonal lines of Pinus koraiensis using SSR markers and successfully constructed a robust DNA fingerprinting system. Similar studies have also been conducted in Ailanthus altissima [19] and Camellia sinensis [20]. This technique has been widely applied across various taxa, including vegetables (e.g., Raphanus sativus [21], Brassica oleracea var. botrytis [22], Ipomoea batatas [23]) and fruits (e.g., Vaccinium corymbosum [24], Morus alba [25], Prunus avium [26]). However, to date, there is no efficient and high-resolution molecular identification system available for Liriodendron germplasm resources, which presents challenges for germplasm management, breeding, and intellectual property protection in this genus [27]. Therefore, establishing a comprehensive DNA fingerprinting platform for Liriodendron using high-throughput molecular markers has become a pressing research priority. As a fundamental tool for germplasm characterization, DNA fingerprinting enables the generation of unique molecular identifiers by detecting genomic variations with high specificity [19]. Compared with traditional phenotypic assessments, this approach offers significant advantages in accuracy, reproducibility, and scalability. The development of SNP-based DNA fingerprints for Liriodendron is thus of great significance for both theoretical research and practical applications in germplasm conservation and breeding programs.
This study utilized 297 Liriodendron germplasm accessions as experimental materials and performed systematic assessments of 34 phenotypic traits. Comprehensive analysis demonstrated considerable phenotypic variation in most evaluated traits, along with statistically significant inter-trait correlations. Based on high-throughput sequencing of 197 representative samples, a set of high-quality single-nucleotide polymorphism (SNP) markers was identified, from which core SNP markers were selected for downstream analysis. The resulting genome-wide SNP marker system enabled precise assessments of genetic diversity and genetic structure within the Liriodendron germplasm collection. Furthermore, a robust DNA fingerprinting platform with high discriminatory power was developed to support accurate resource authentication, digital archiving, and traceability. These methodological advances substantially improve the precision, efficiency, and reliability of Liriodendron germplasm conservation and utilization.

2. Results

2.1. Evaluation of Phenotypic Traits

2.1.1. Analysis of Phenotypic Diversity in Populations

Analysis of 34 phenotypic traits across 297 Liriodendron accessions (Table 1) revealed substantial patterns of morphological diversity. Growth-related traits exhibited particularly high variation, with annual DBH increment showing the greatest diversity (Shannon index H′ = 5.23; CV = 26.57%), followed by height growth (H′ = 4.71; CV = 24.25%), indicating pronounced genetic variation in growth performance. Architectural traits demonstrated moderate to high variability, including crown width (H′ = 0.89; CV = 38.46%) as well as branch characteristics—branch number (H′ = 3.33; CV = 37.68%) and branch density (H′ = 1.07; CV = 40.85%). Interestingly, the branching pattern, despite being a qualitative trait, exhibited unexpectedly high diversity (H′ = 0.96; CV = 40.85%). Phenological traits showed consistent but comparatively lower levels of variation, such as leaf budburst (H′ = 1.05; CV = 33.88%) and flowering time (H′ = 0.91; CV = 30.68%). Foliar color traits displayed intermediate levels of diversity, comparable to those of structural characteristics.

2.1.2. Phenotypic Trait Clustering and Correlation Analysis

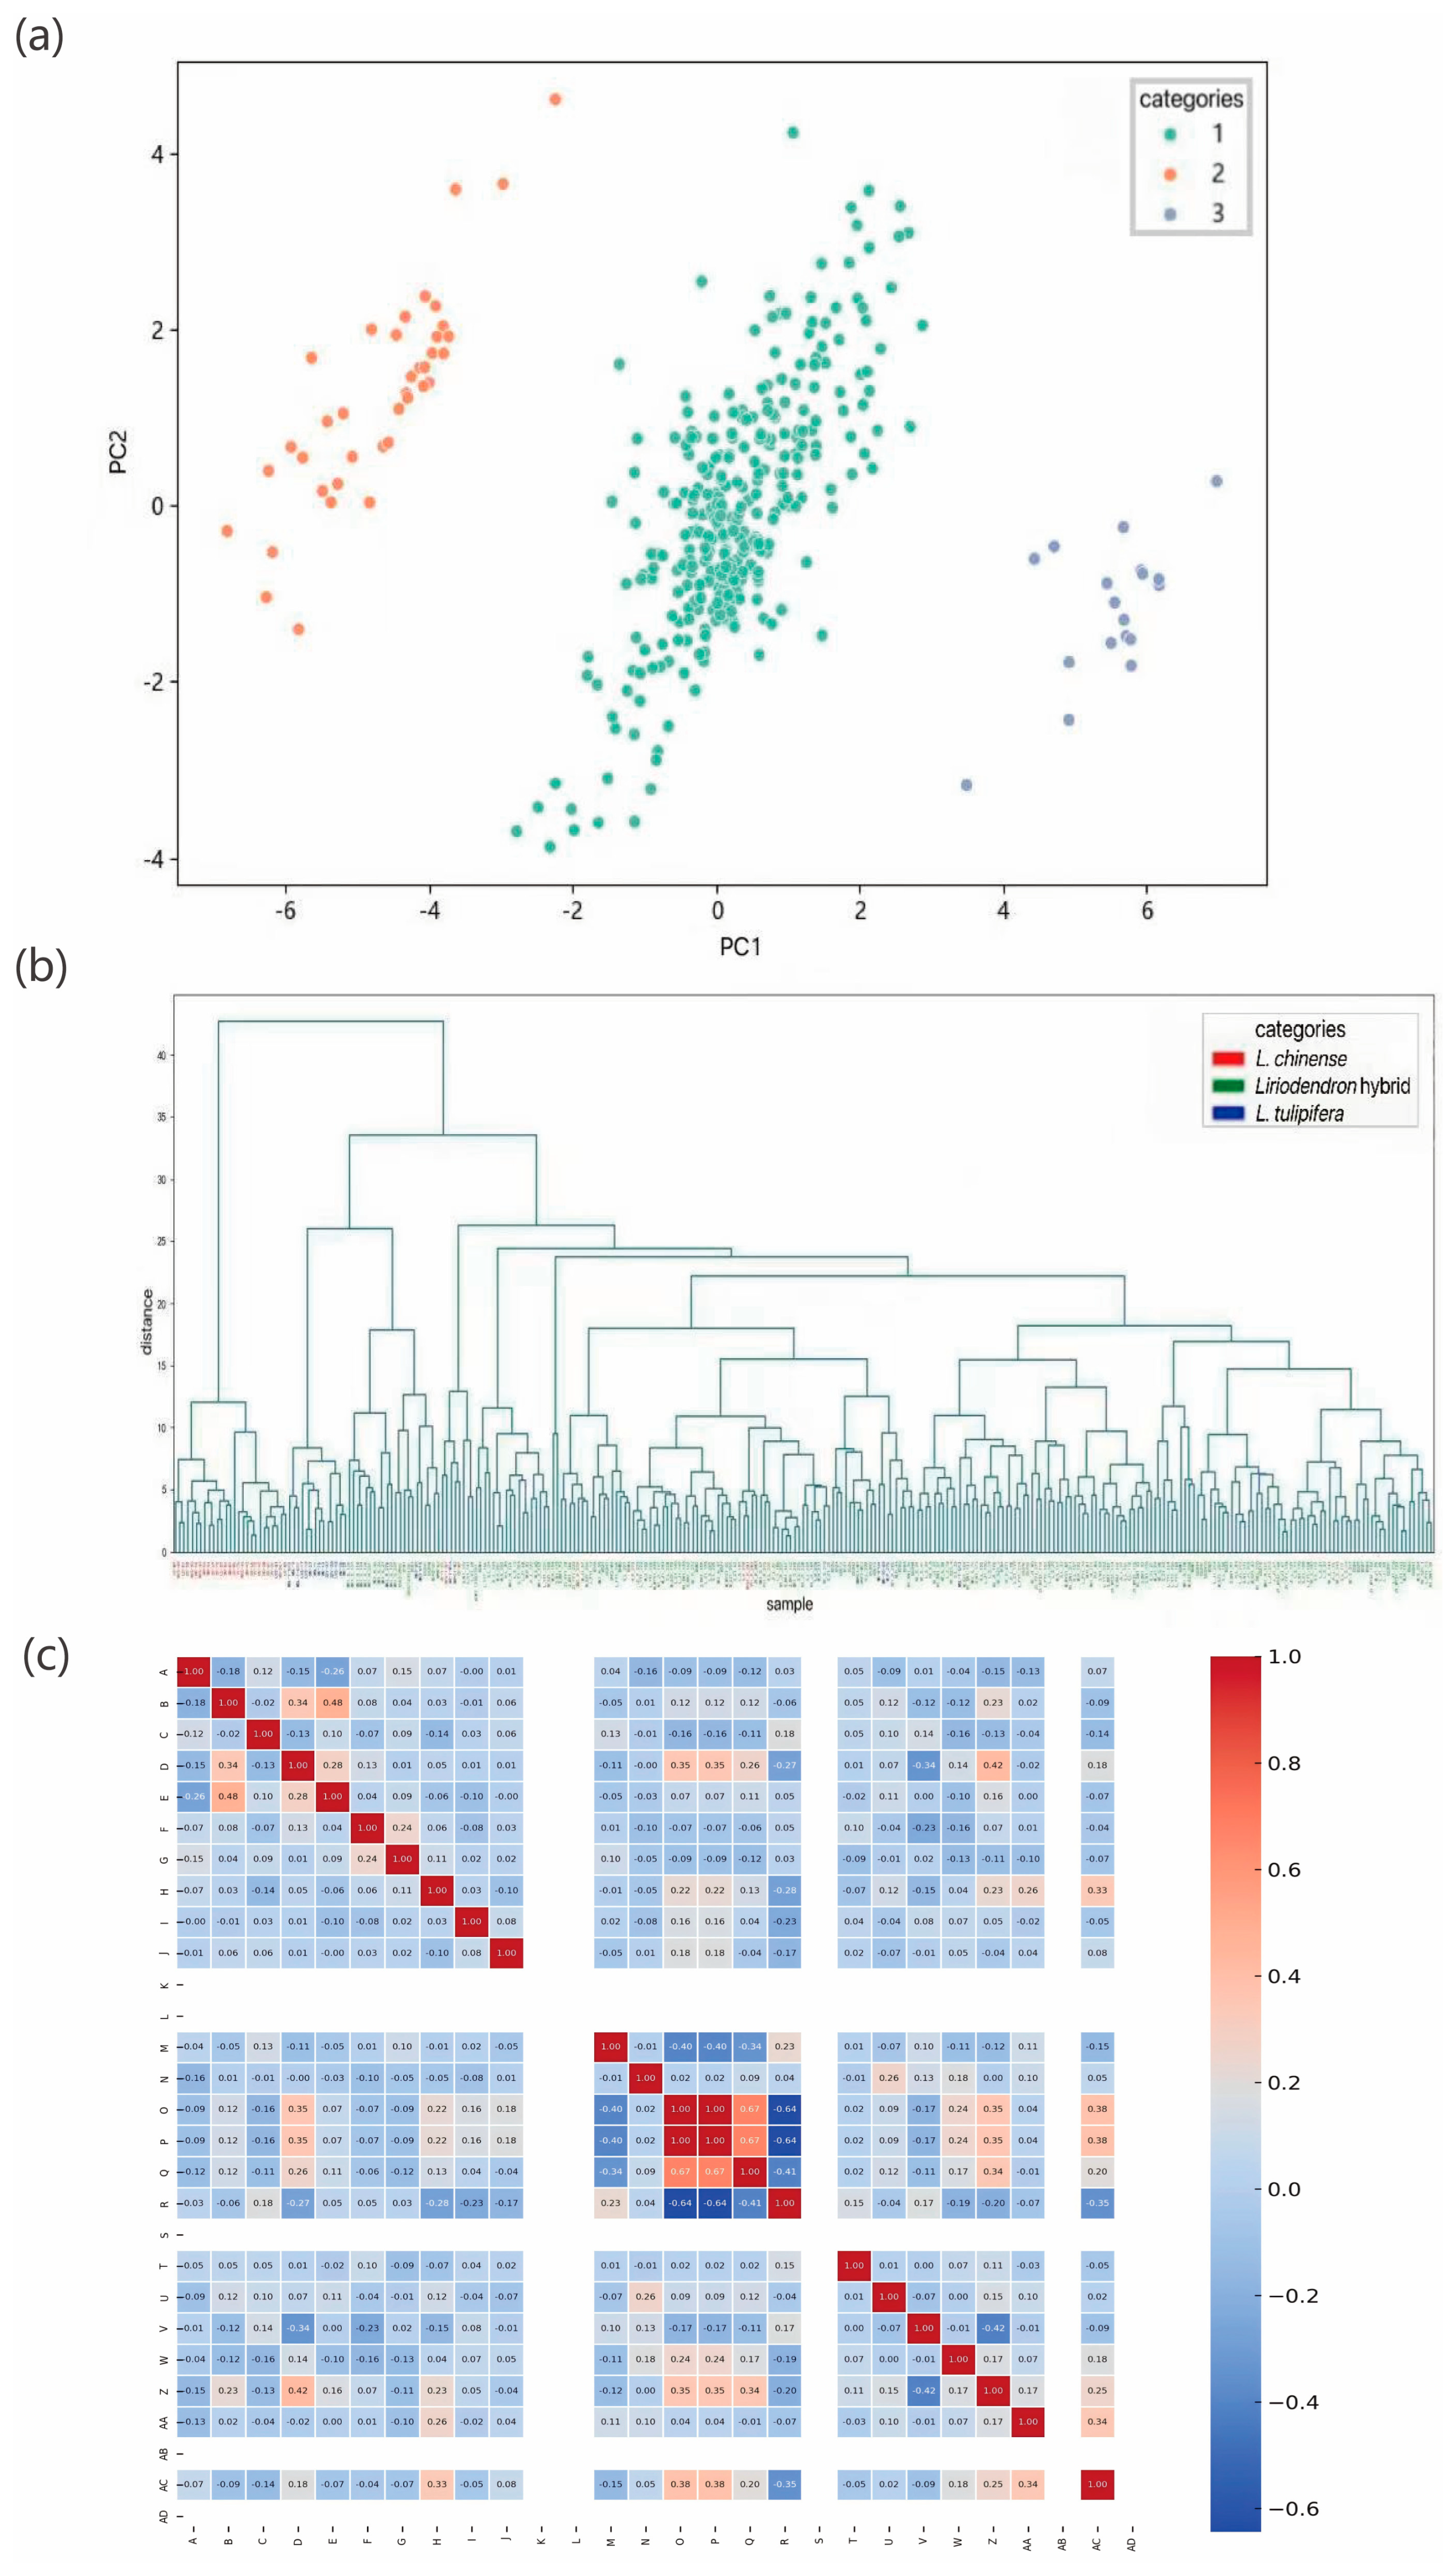
Principal component analysis (PCA) was conducted to reduce trait dimensionality and explore sample distribution patterns. The first two principal components (PC1 and PC2) accounted for 74.06% of the total phenotypic variance (Figure 1a), with samples clearly segregating into three distinct clusters. Hierarchical clustering (HC) analysis (Figure 1b) further supported this classification. Liriodendron sino-americanum individuals formed multiple branches that were partially intermixed with either L. chinense or L. tulipifera samples. L. tulipifera accessions clustered tightly within a separate branch, indicating strong genetic homogeneity. Most L. chinense samples were grouped within a single major cluster, reflecting a relatively conserved germplasm background with limited intra-population divergence. The sample groupings identified by HC were consistent with those from PCA, validating the robustness of the observed clustering pattern. These intergroup differences likely reflect underlying covariation among traits. To further investigate trait associations, Pearson correlation coefficients were calculated and visualized in a heatmap (Figure 1c).
The correlation analysis revealed three distinct patterns of phenotypic associations among the measured traits: (1) strong positive correlations were observed between specific trait combinations, including crown width and branch thickness, tree height and subbranch height, as well as branch density and crown width etc.; (2) significant negative correlations were identified between other trait pairs, such as crown shape and branch density, bark fissures and leaf bud break timing, and leaf abscission and autumn leaf coloration etc.; (3) weak or negligible correlations were observed between certain traits, such as crown width and bark coloration, as well as branch thickness and inner bark pigmentation. These findings collectively elucidate the comprehensive structure of phenotypic trait relationships.

2.2. SNP Marker Screening and Sanger Sequencing Validation

2.2.1. Selection of SNP Markers

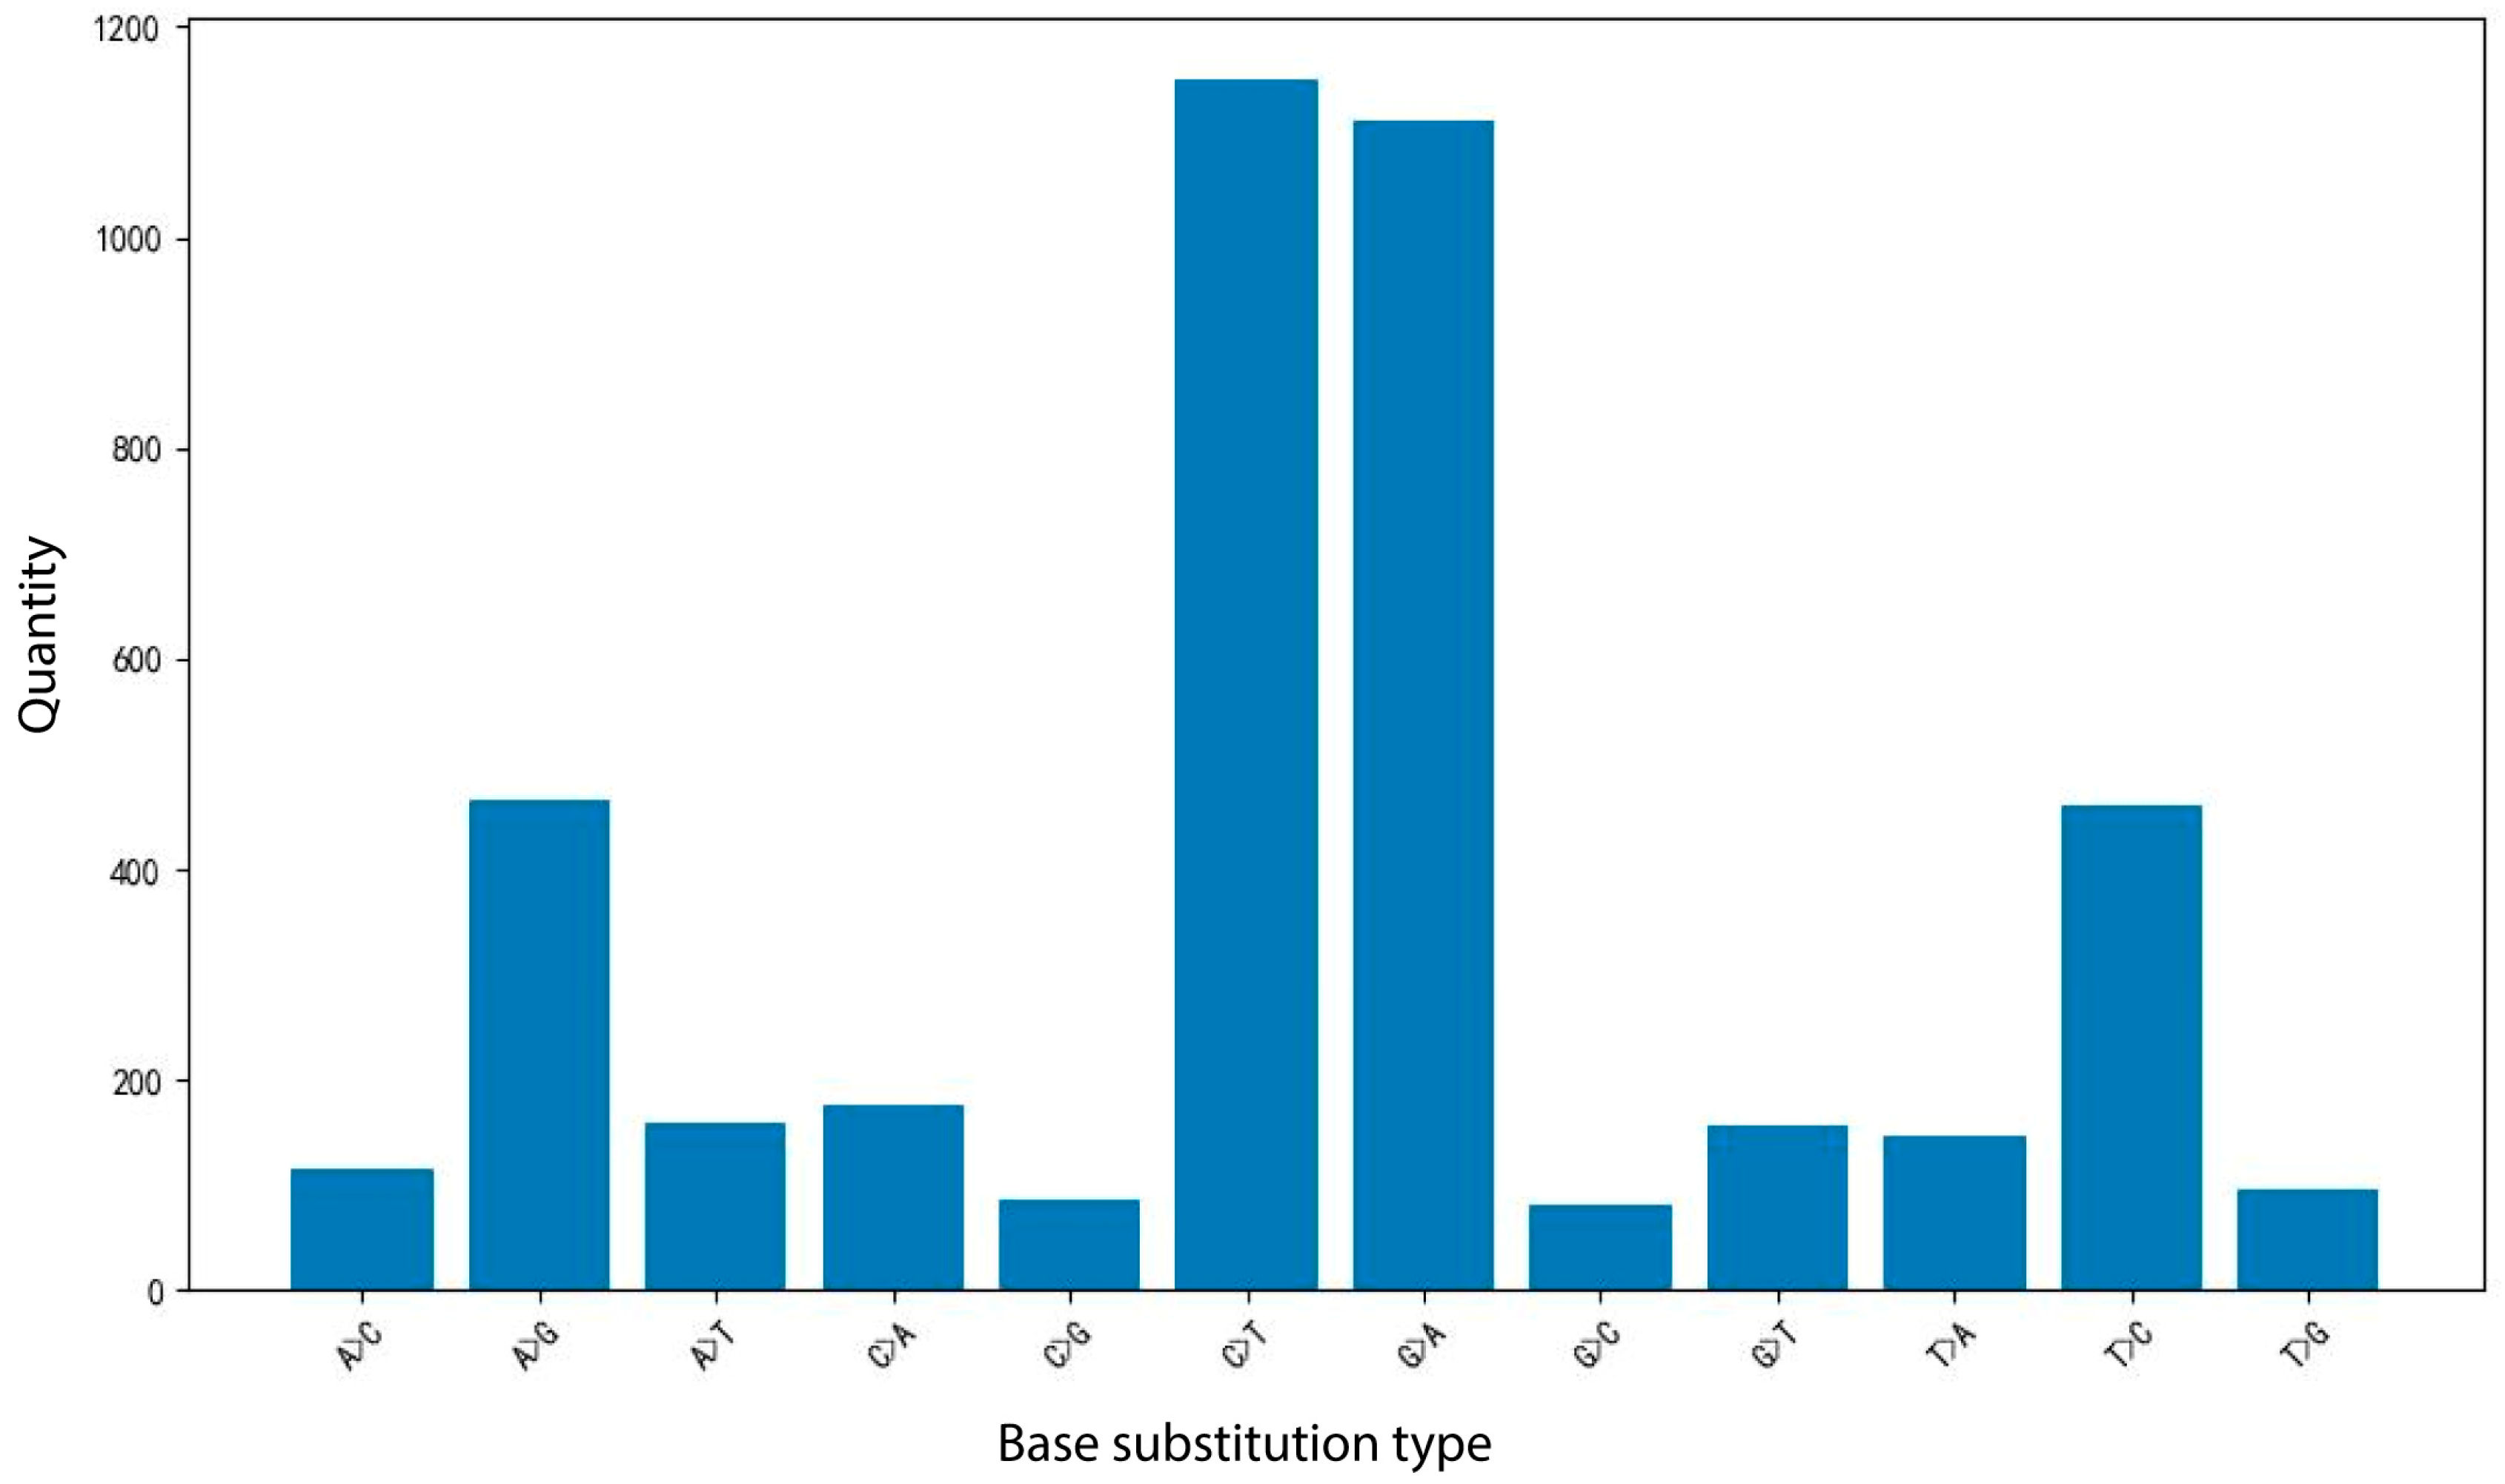
A total of 2165146 SNPs were identified using 197 whole-genome resequencing datasets. According to the filtering criteria, 4204 high-quality SNPs were ultimately obtained. In the statistics of SNP single-base substitution types, 12 types of variation were detected, indicating the presence of abundant variation types in the Liriodendron genome. Among them, 3189 transitions and 1015 transversions were detected, with a Ts/Tv ratio of 3.1419, indicating that the research data are highly reliable and consistent with the general characteristics of high-quality SNPs (Figure 2). Based on the screened high-quality SNPs, core SNPs were selected, resulting in 13 core SNP markers (Table 2) distributed across 8 chromosomes, ensuring broad genome coverage.

2.2.2. Sanger Sequencing Validation

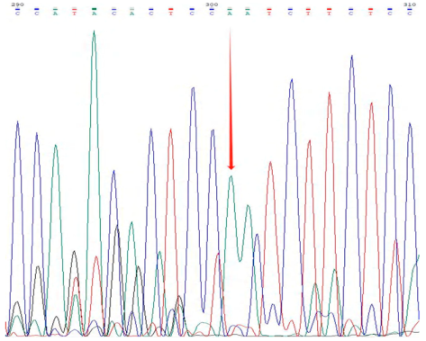
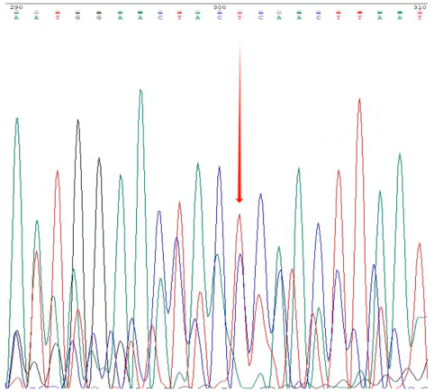
The accuracy and genotyping reliability of the selected core SNP markers were validated experimentally. Specific primers were designed for each of the 13 core SNP loci. Eight representative samples were selected for PCR amplification, followed by agarose gel electrophoresis to assess amplification efficiency. In addition, three samples representing distinct genotypes were chosen for Sanger sequencing at the Chr7:54379502 locus as an example of validation. The results (Figure 3) demonstrated that the designed primers exhibited high specificity and stability across all tested samples. The sequencing chromatograms (Table 3) showed clear and symmetrical peak patterns for all three genotypes, which were fully consistent with the genotyping results obtained from high-throughput sequencing. These results confirm the high accuracy and reliability of SNP genotyping.

2.3. Genetic Diversity Analysis

Genetic diversity indices were systematically compared among three groups: Liriodendron sino-americanum, L. tulipifera, and L. chinense. Significant differences were observed across multiple parameters (Table 4). The Liriodendron sino-americanum group exhibited the highest levels of genetic diversity, including the number of alleles (Na = 2.00), observed heterozygosity (Ho = 0.20), expected heterozygosity (He = 0.18), polymorphism information content (PIC = 0.14), Shannon’s diversity index (H′ = 0.46), and Nei’s genetic diversity index (Nei = 0.18), indicating a rich allelic composition and substantial genetic variation. L. tulipifera showed intermediate diversity levels, with relatively balanced values across all indices, suggesting a genetically stable background while retaining a moderate degree of variation. In contrast, L. chinense consistently exhibited the lowest diversity values (e.g., Na = 1.36; He = 0.13), reflecting a more conserved genetic structure. Notably, observed heterozygosity (Ho) was lower than expected heterozygosity (He) across all three groups, implying potential inbreeding or the influence of selection pressures. The elevated diversity in the hybrid population is likely due to parental gene admixture, whereas the reduced diversity in L. chinense may be attributed to its limited geographic distribution, small natural population size, long-term isolation, anthropogenic disturbances, and historical bottleneck events.

2.4. Genetic Differentiation: Clustering and Population Structure Analysis

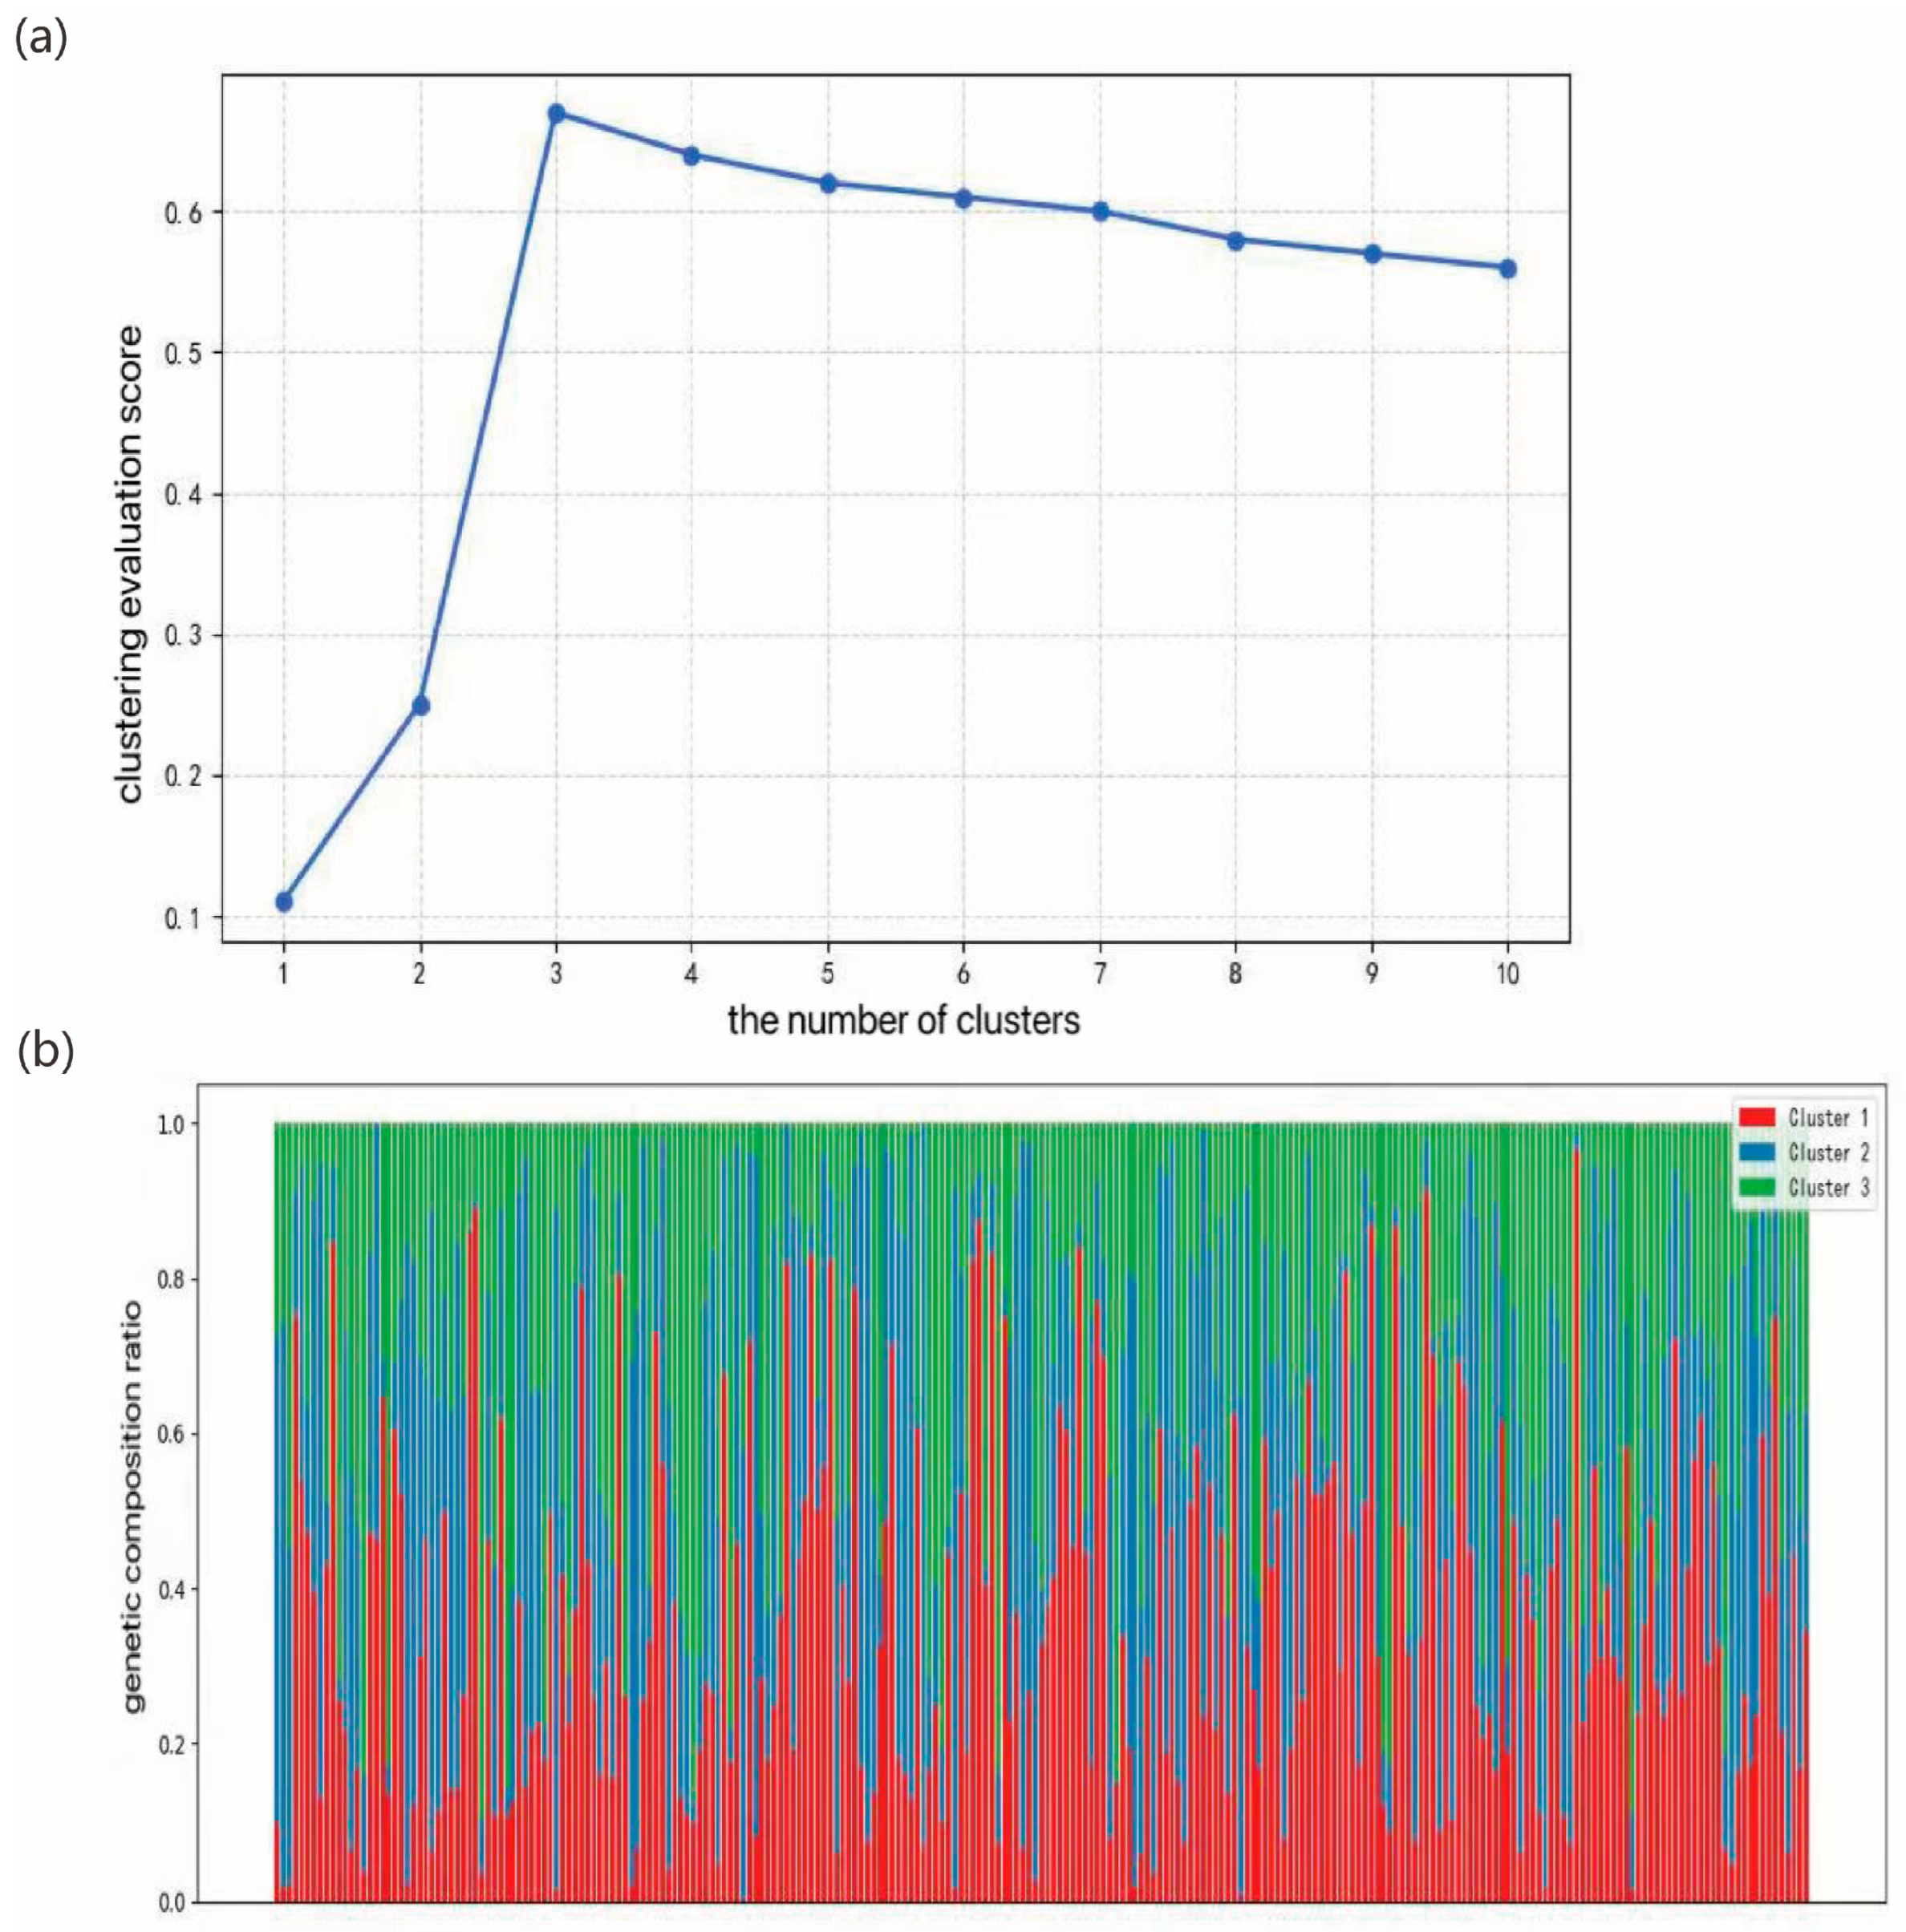
The population structure of Liriodendron was analyzed using a Bayesian clustering model. Following the method of Evanno et al. [28], the optimal number of genetic clusters (K) was determined based on cross-validation scores from 197 samples (Figure 4a). When K = 3, the cross-validation error reached its minimum and ΔK achieved its maximum, indicating that the 197 accessions could be reliably partitioned into three genetic subpopulations. The population structure bar plot for K = 3 (Figure 4b) further illustrates the proportional genetic composition of each sample within the three inferred clusters. Several accessions displayed clear assignments to a single cluster, indicating strong genetic homogeneity, whereas most individuals exhibited admixture from two or all three clusters, reflecting their complex genetic backgrounds.
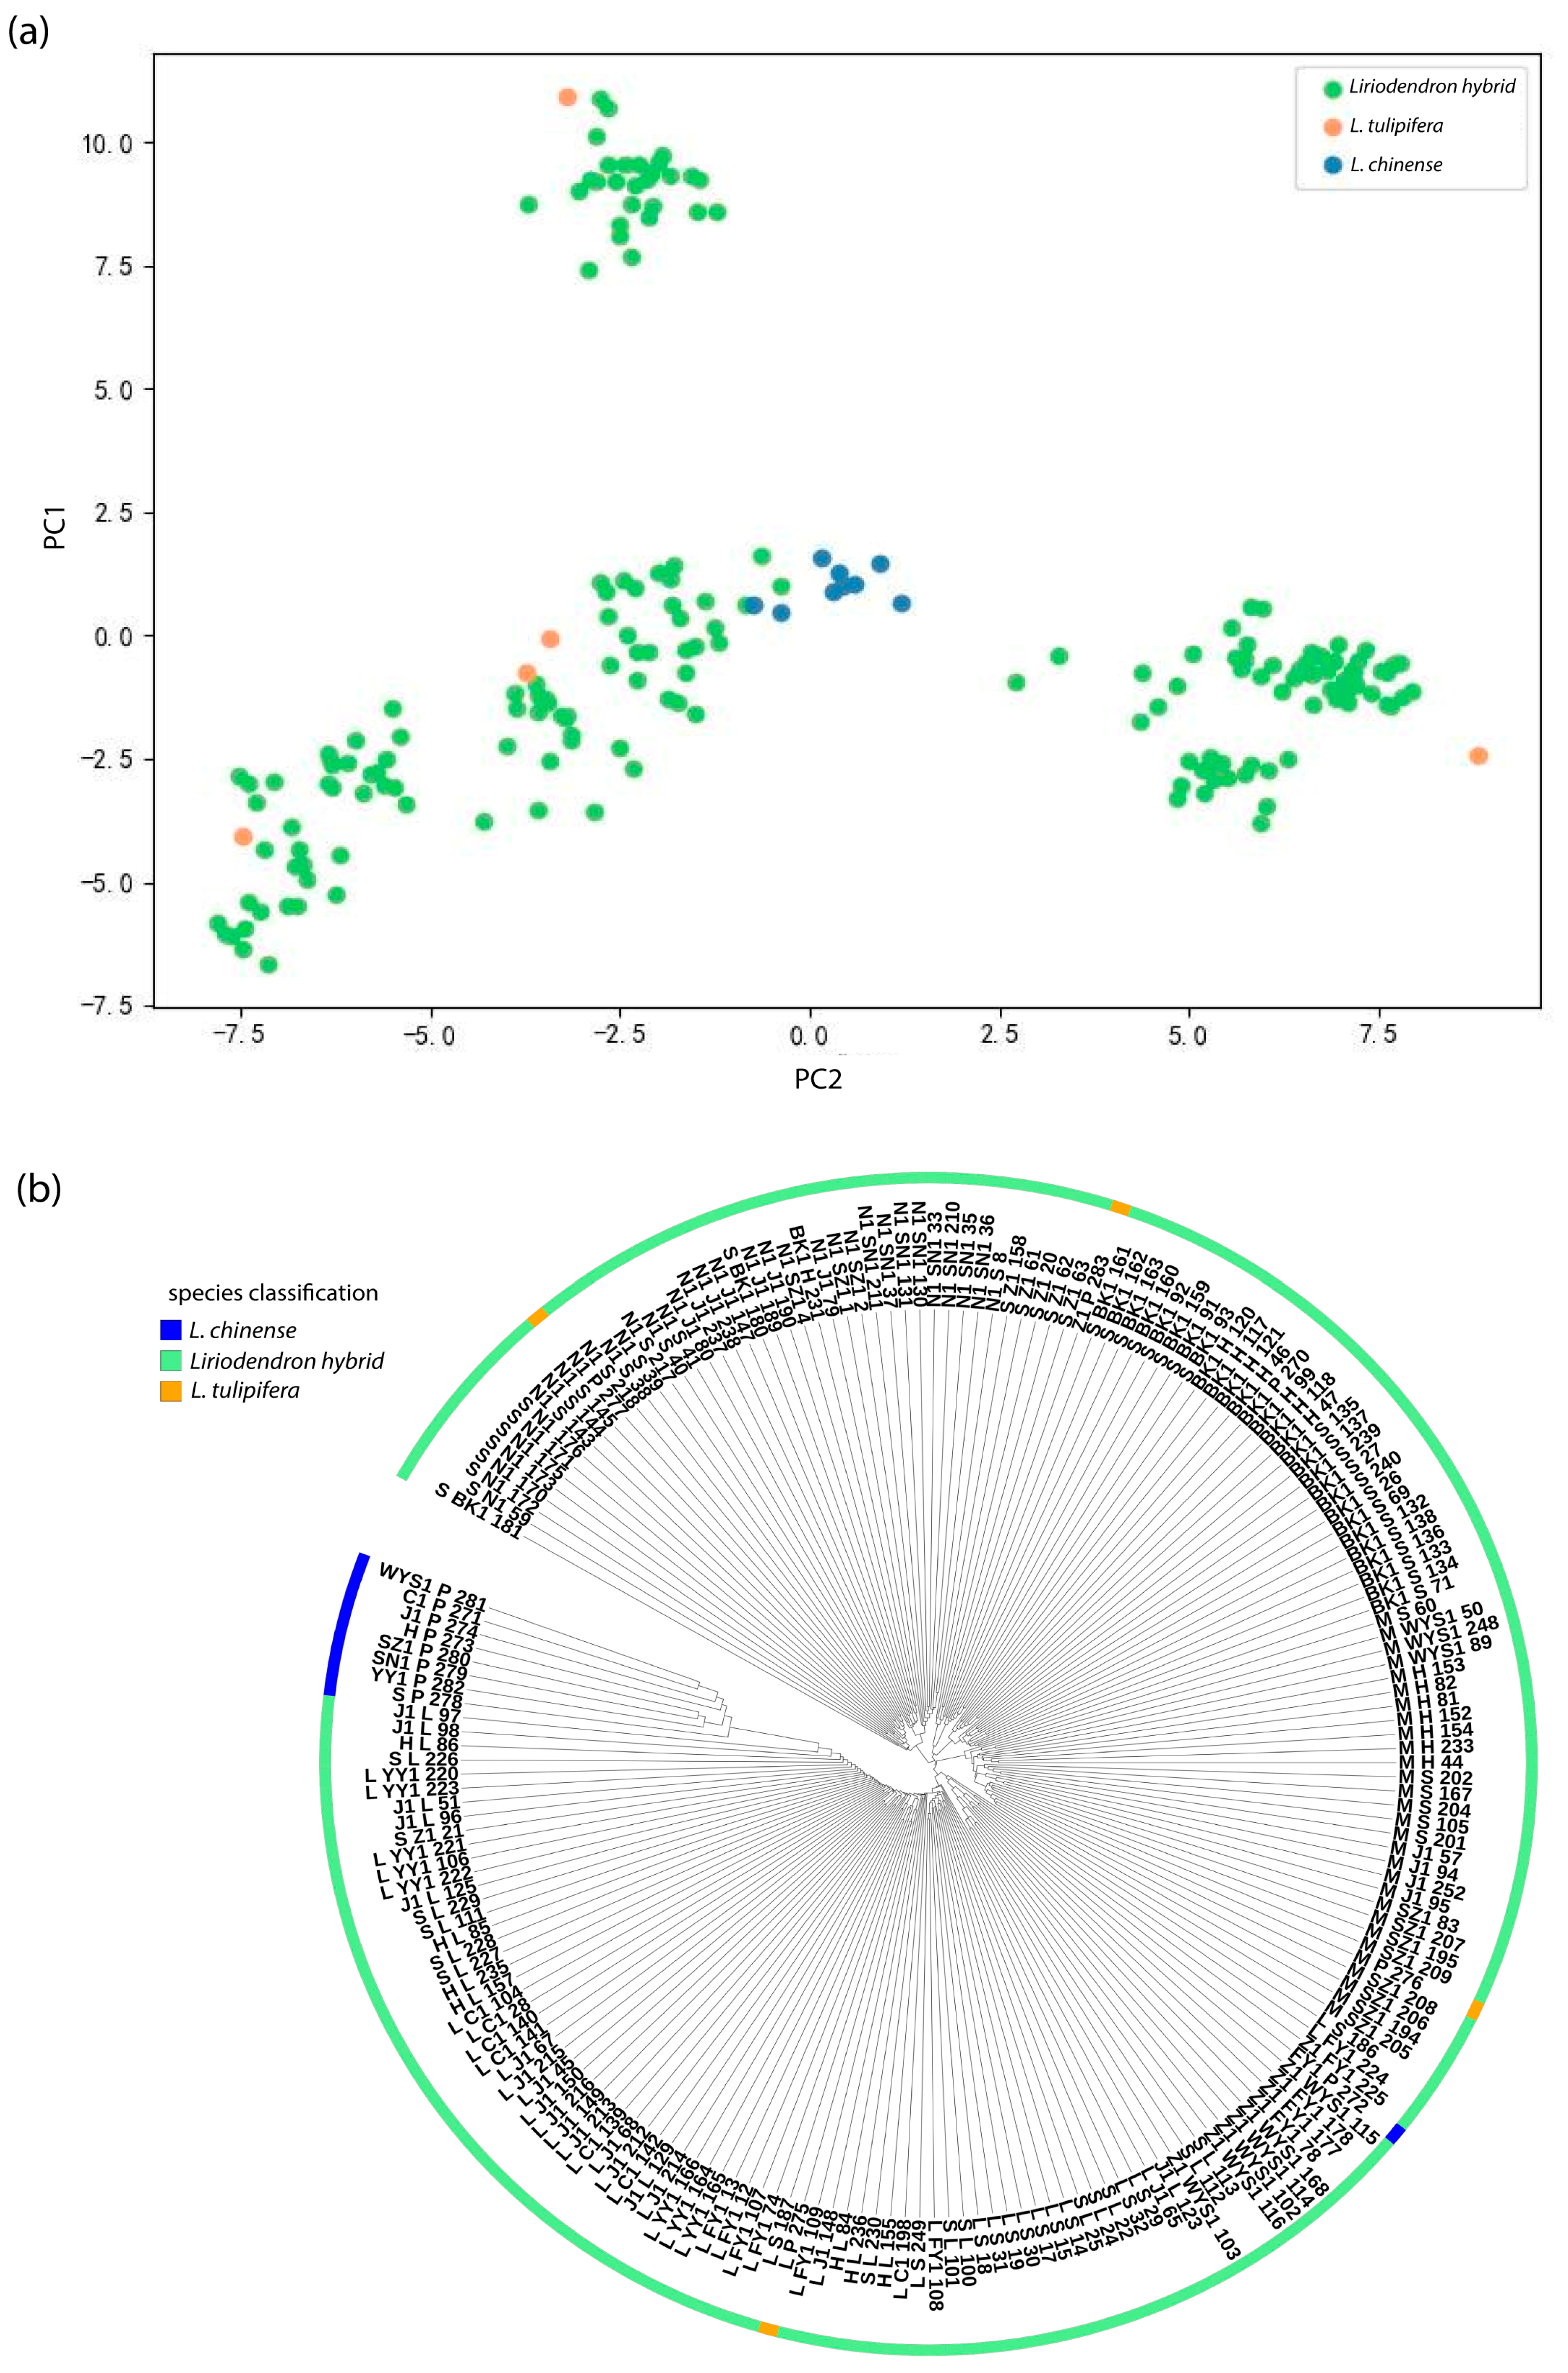
Principal component analysis (PCA) of the genotype data was conducted to characterize the population genetic structure. The first two principal components explained 5.39% (PC1) and 3.57% (PC2) of the total genetic variation, yielding a cumulative explanatory power of 8.96%. This modest variance capture by the leading components principally stems from two biological factors: (i) pervasive gene flow maintaining genetic connectivity across the population, resulting in a continuous allele frequency distribution rather than discrete clusters, and (ii) the genome-wide random distribution of variation from the 4204 predominantly neutral SNPs employed in our analysis. Notably, despite the limited proportion of total variance explained, the two-dimensional PCA projection effectively resolved major axes of genetic differentiation among samples. The analysis divided the 197 accessions into three genetic groups. In the two-dimensional PCA plot (Figure 5a), L. tulipifera and L. chinense formed distinct clusters at opposite ends of the plot, confirming strong genetic differentiation between the two species. Liriodendron sino-americanum (L. tulipifera × L. chinense) individuals were positioned intermediately, with several samples overlapping those of L. chinense, indicating the primary direction of genetic divergence. Hierarchical clustering based on Euclidean genetic distances using the UPGMA algorithm produced results consistent with both the PCA and STRUCTURE analyses. The resulting dendrogram (Figure 5b) showed three well-defined genetic groups, with the majority of samples clustering within a major branch dominated by Liriodendron sino-americanum, highlighting their prevalence in the current germplasm collection. The molecular classification of these Liriodendron germplasm accessions showed high concordance with phenotypic groupings derived from principal component and cluster analyses, demonstrating significant associations between SNP markers and phenotypic traits.

2.5. SNP-Based Association Analysis of Phenotypic Traits

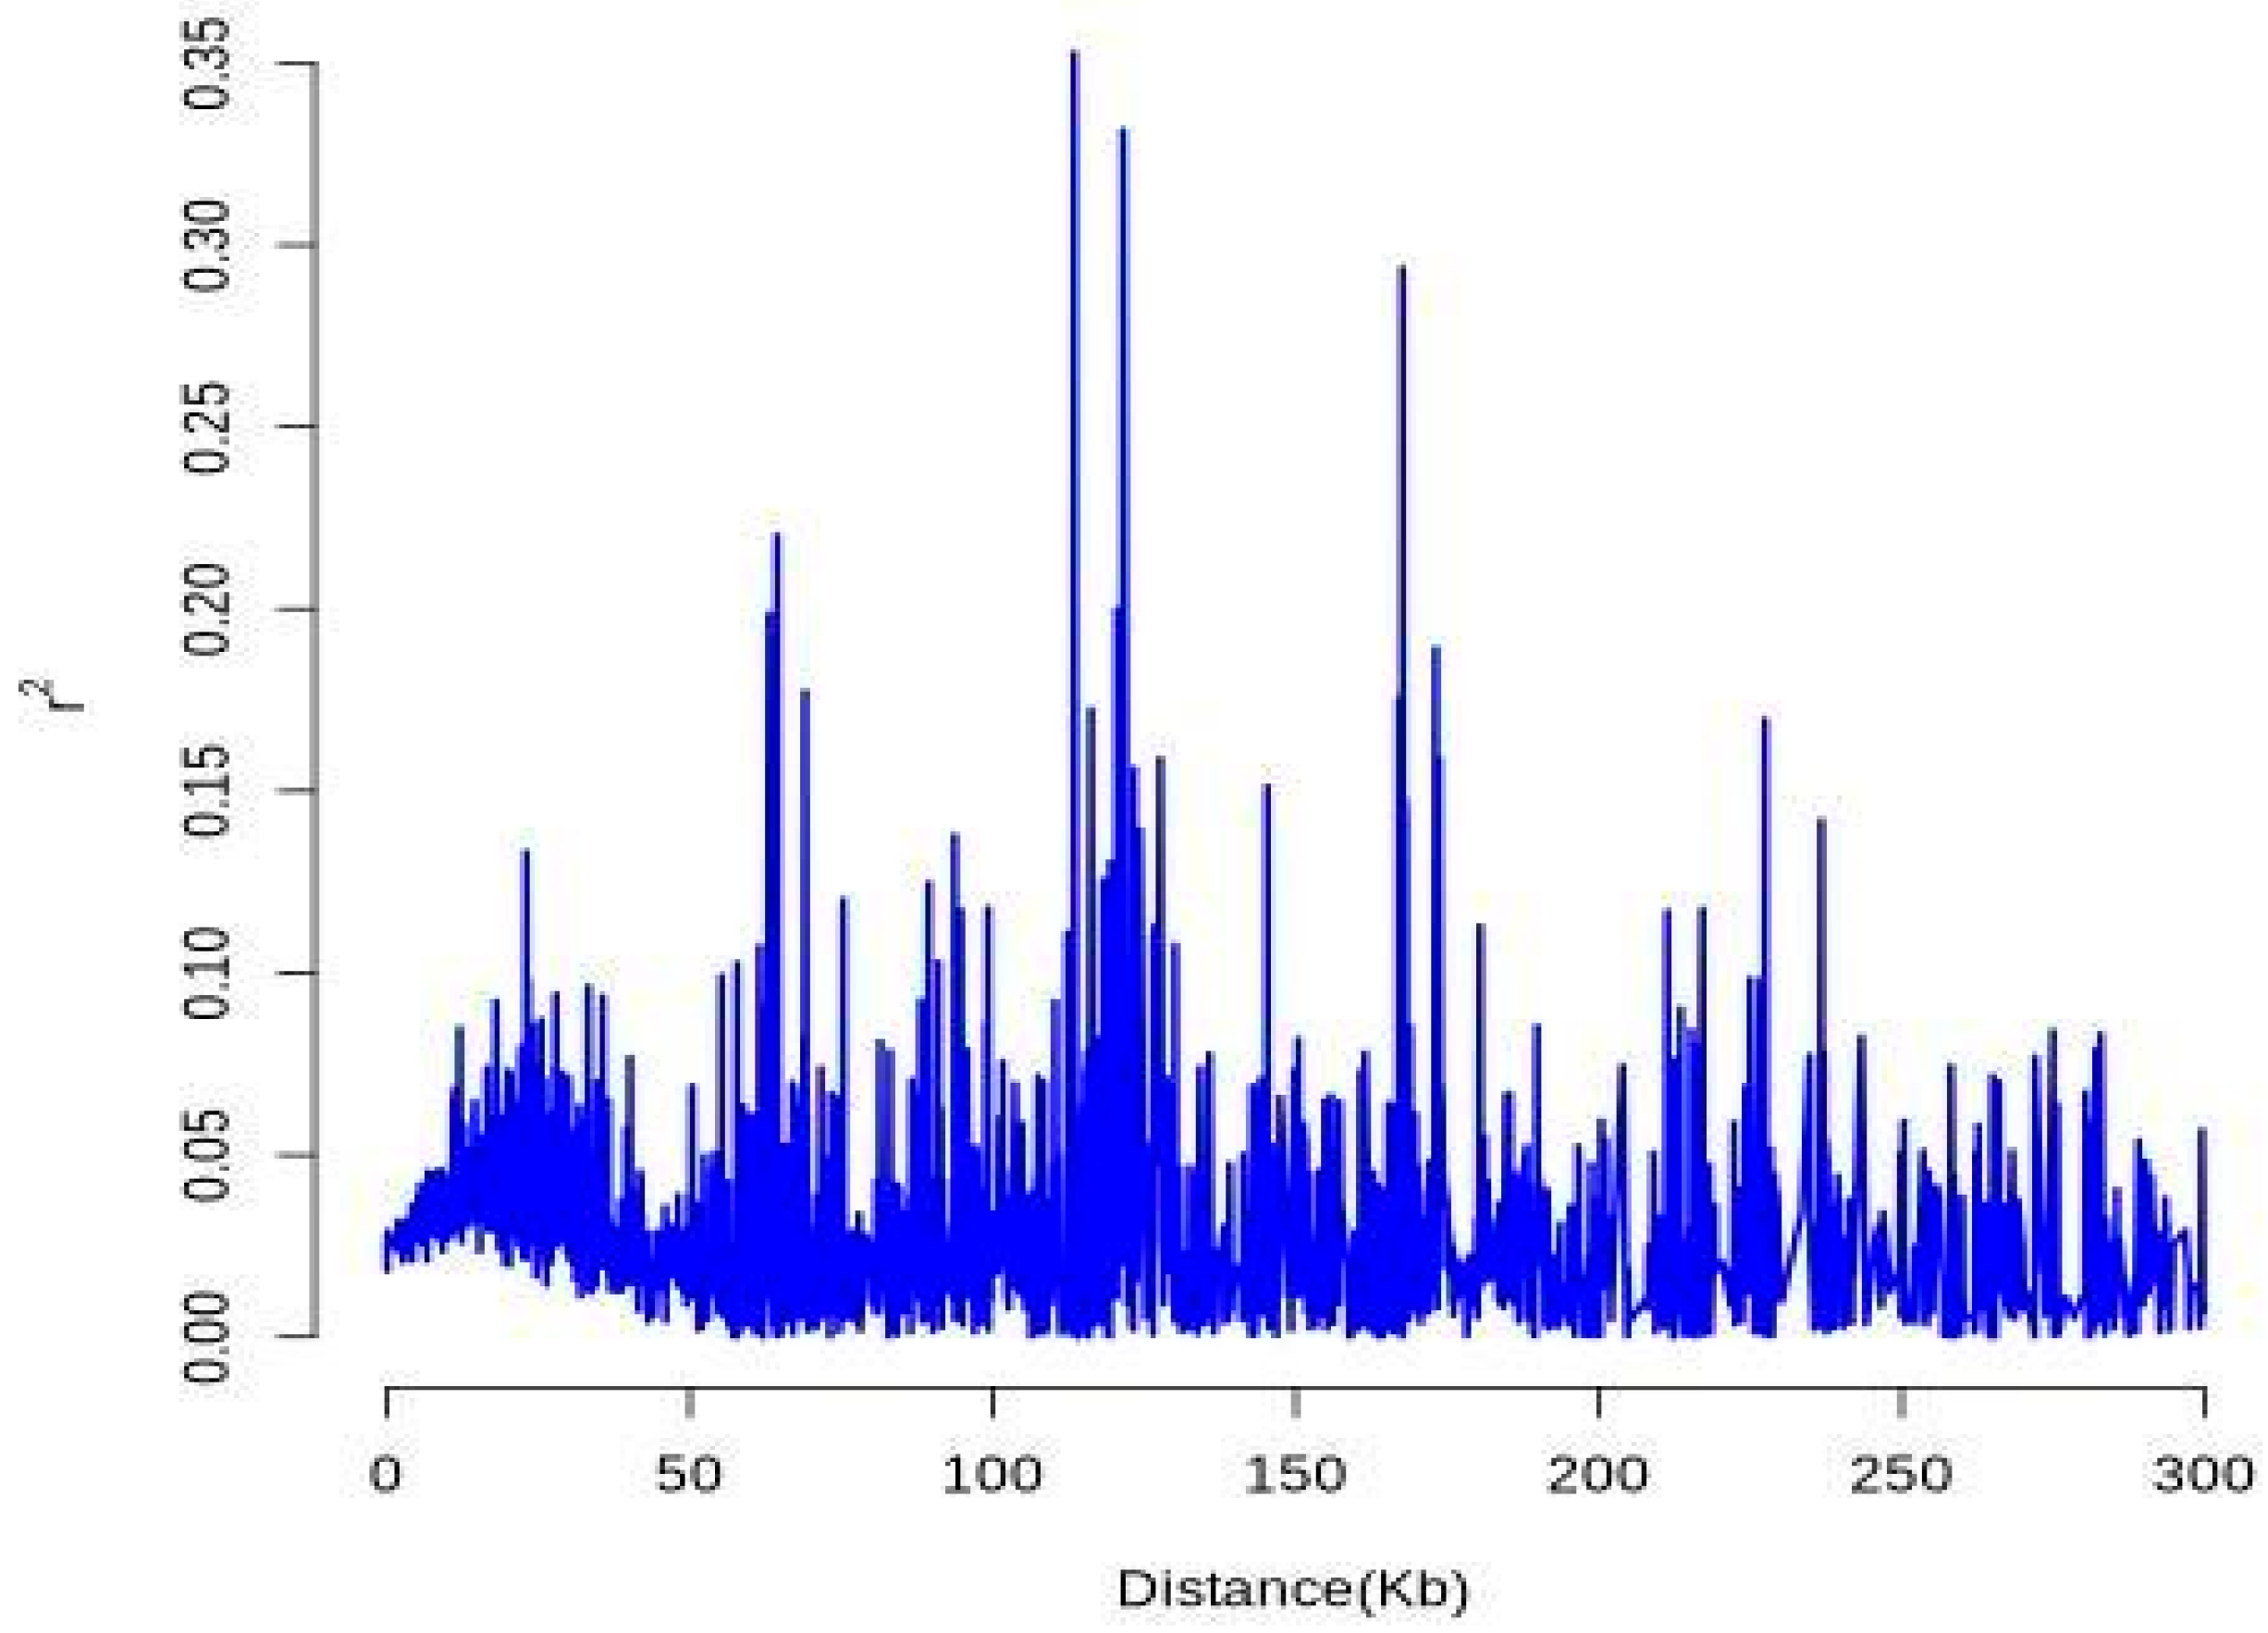
SNP-based linkage disequilibrium (LD) analysis revealed relatively high r2 values at short physical distances (0–20 kb), followed by a rapid decay as distance increased, indicating fast LD decay within the population (Figure 6). This pattern suggests high recombination frequency and considerable genetic diversity. Multiple localized r2 peaks were detected across the genome, potentially corresponding to structural variants, loci under selection, or repetitive genomic regions.
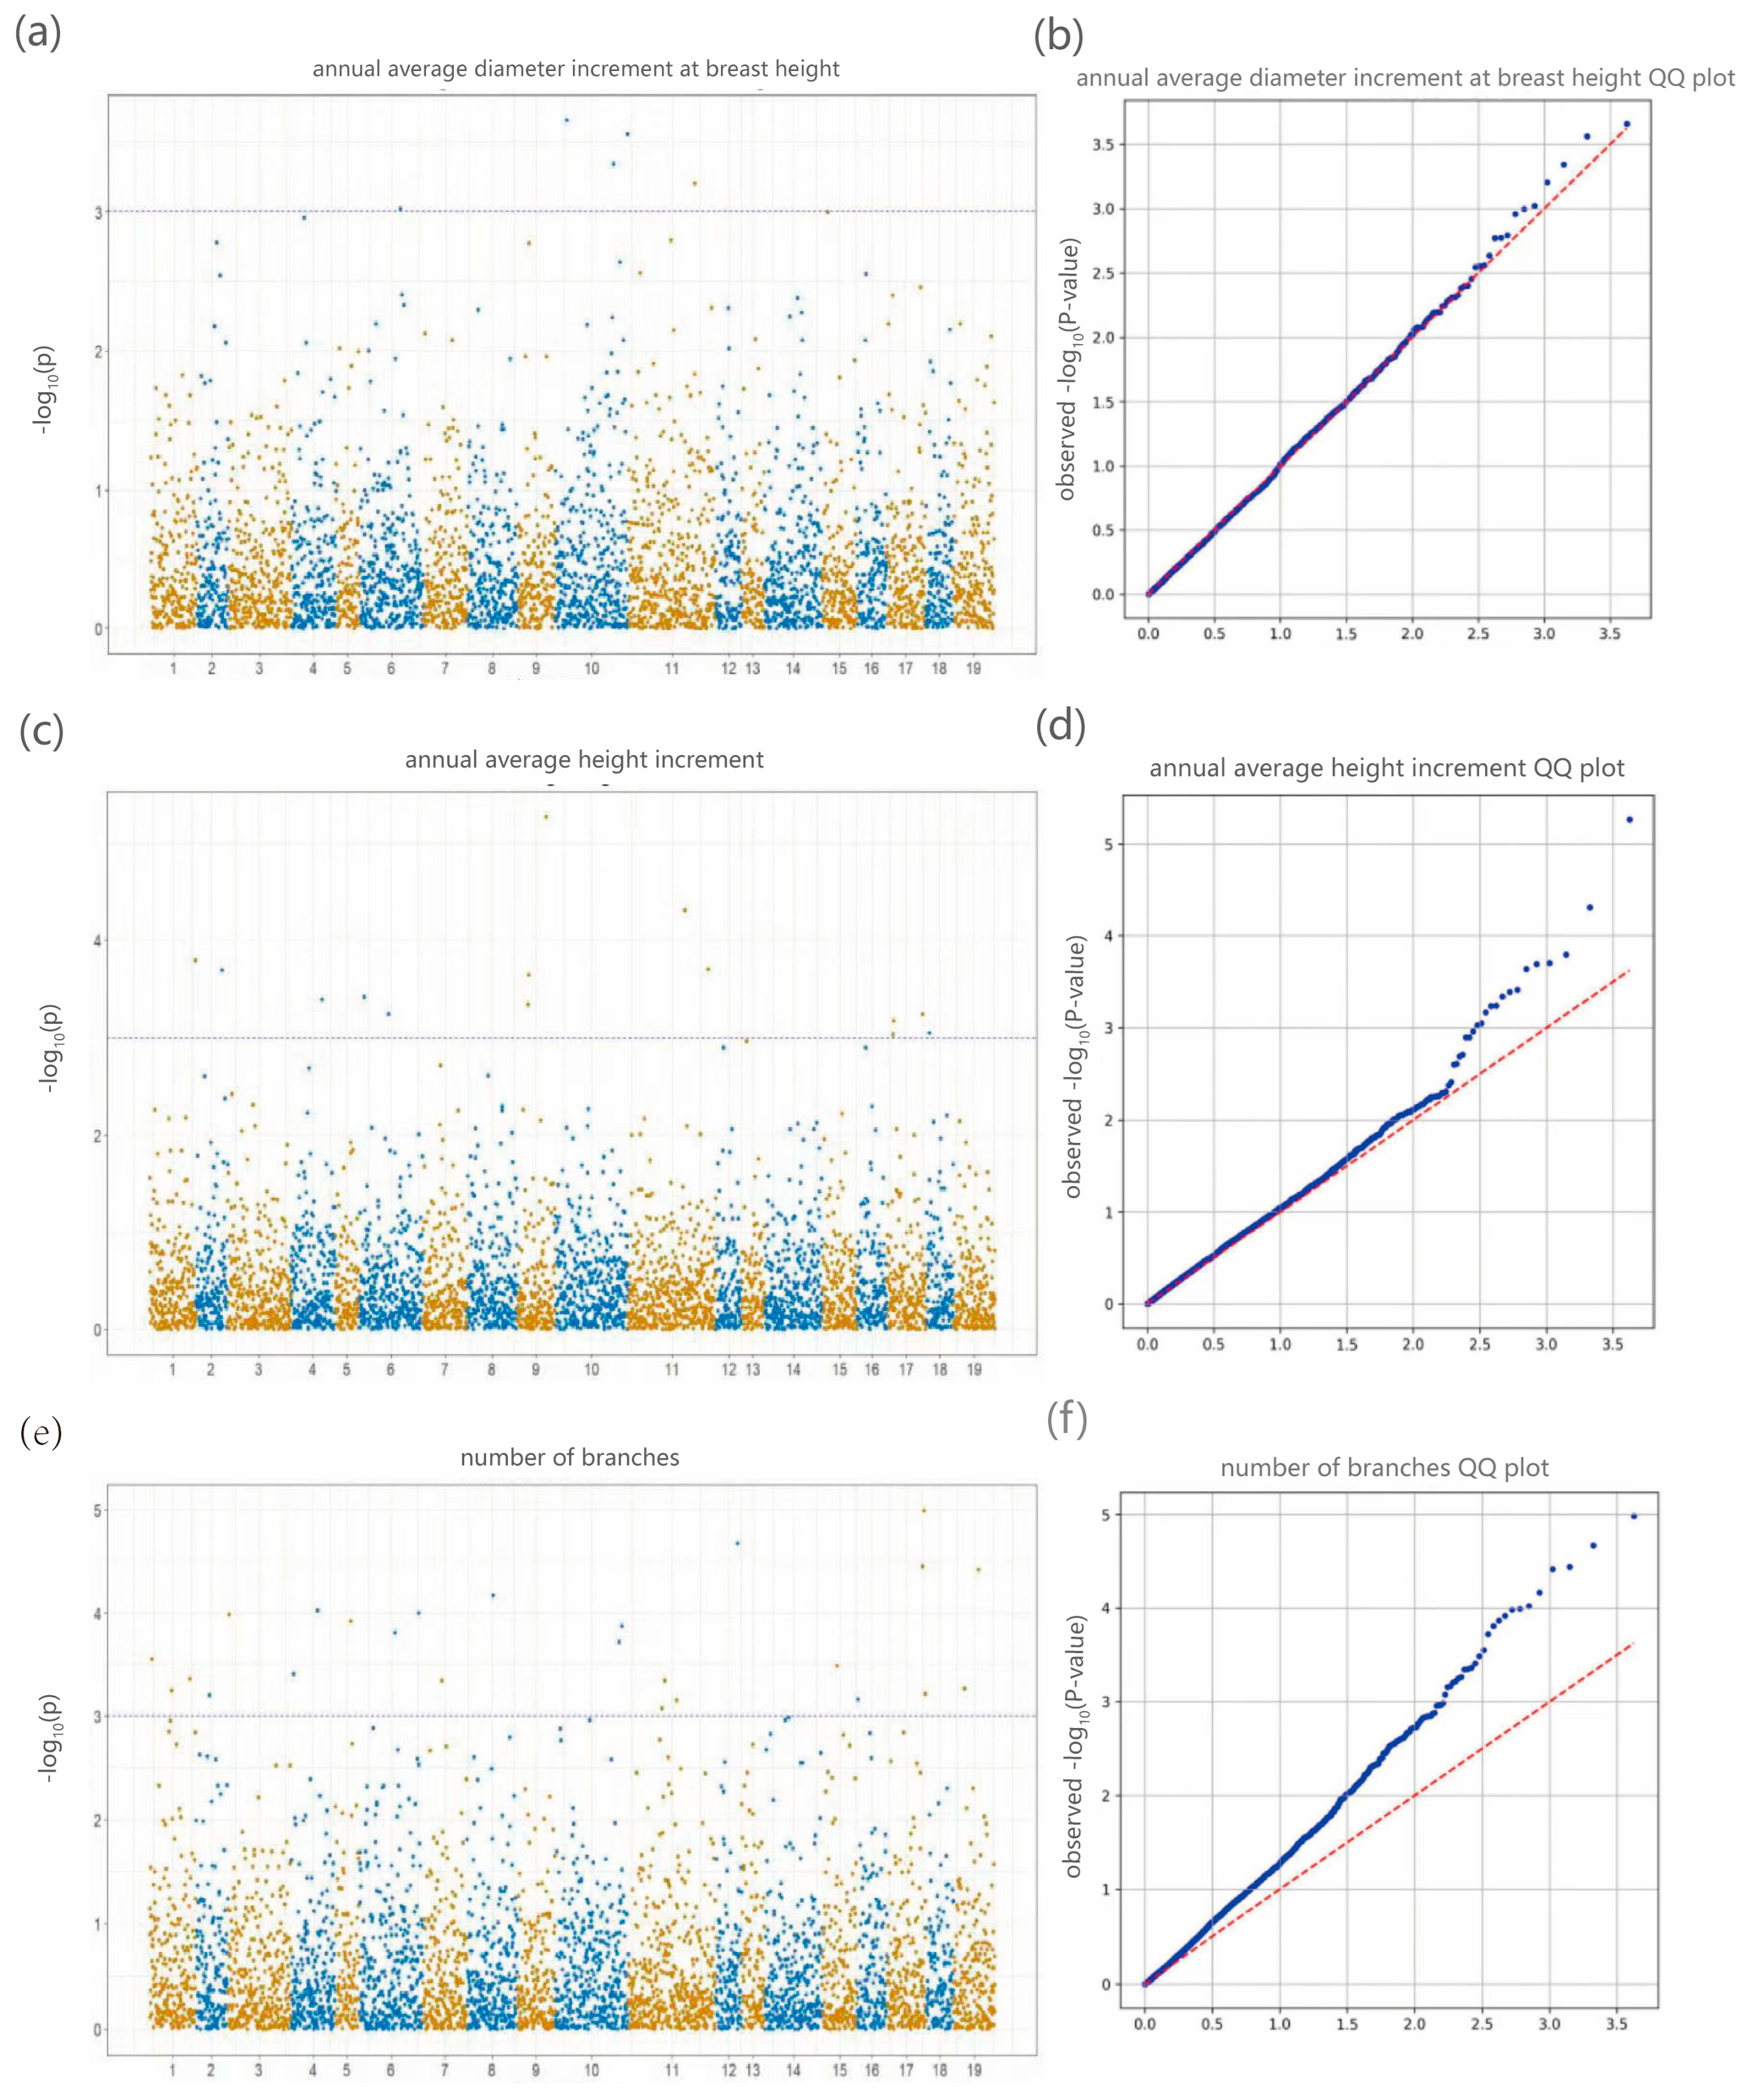
The GLM-based genome-wide association study (GWAS) of annual average diameter at breast height increment, annual height growth, and branch number revealed distinct patterns of SNP–trait associations. For branch number, multiple significant SNPs exceeded the significance threshold, with noticeable deviations from the expected distribution in the QQ plot. In contrast, the Manhattan plots for DBH and height growth displayed fewer pronounced peaks, and their corresponding QQ plots closely followed the theoretical expectation, indicating a lower number of strongly associated SNPs (Figure 7).
A total of 25 significant SNP markers (p < 0.001) were identified across 16 chromosomes (Table 5). For DBH growth, five highly significant loci were detected on chromosomes 6, 10, and 11, with the strongest association observed at locus 10_31605746 (p = 2.18 × 10⁻⁴). In addition, two adjacent loci on chromosome 10—10_68523476 and 10_68494457—also exhibited strong associations. These three loci may reside within the same linkage block, suggesting the presence of key functional genes involved in DBH regulation. For height growth, only two significant loci (p < 0.0001) were identified, with 9_55280744 (p = 5.40 × 10⁻⁶) showing the strongest association, potentially representing a major-effect locus influencing height variation. Branch number exhibited the most extensive association pattern, with 18 highly significant SNPs. Notably, loci 17_69375264 (p = 1.03 × 10⁻⁵) and 12_60323301 (p = 2.13 × 10⁻⁵) displayed the strongest correlations, and are likely involved in axillary bud differentiation or branching-related regulatory pathways. These associations were distributed across chromosomes 1–8, 10–12, and 15–19, supporting the polygenic architecture underlying variation in branch number.

2.6. Construction of DNA Fingerprints

Genotyping was conducted using the 13 selected core SNP markers, resulting in a 13 × 197 genotype matrix. For the remaining 100 accessions without resequencing data, locus-specific primers were designed to amplify the corresponding SNP regions via PCR. Sanger sequencing of qualified PCR products, followed by manual inspection of chromatograms, enabled accurate genotype calling, ultimately yielding a standardized 13-locus SNP genotype matrix. Genotype data from all 297 Liriodendron accessions were concatenated according to genomic coordinates to generate unique fingerprint codes. These codes, produced by sequentially combining genotypes at the 13 core loci, enabled precise individual-level discrimination. A comprehensive molecular fingerprinting system was established by integrating the 13 SNP markers with 34 phenotypic traits. Each sample’s QR code encapsulated its accession ID, SNP genotype profile, and phenotypic data (Table 6; Supplementary Table S1), thereby supporting efficient identification, traceability, and germplasm management.

3. Discussion

Recent advances in forest genetic improvement have underscored the need for systematic conservation and utilization of rare tree germplasm resources. This paradigm shift reflects both ecological imperatives and the demands of modern breeding programs, particularly for relict species with narrow natural distributions [29,30,31]. As a representative genus within the Magnoliaceae family, Liriodendron possesses considerable ecological, ornamental, and economic value, rendering genetic diversity assessment and germplasm identification key research priorities. Genetic diversity, a fundamental indicator of a species’ adaptive capacity, is shaped by factors such as genetic drift, natural selection, and gene flow [32]. To support the development of effective breeding strategies for Liriodendron, we first evaluated phenotypic variation among 297 accessions. Phenotypic traits, which reflect morphological-level genetic diversity, were assessed using coefficients of variation (CV), with higher values indicating greater variability in germplasm resources [33]. Analysis of key growth traits including annual mean diameter at breast height increment, annual height increment, and crown spread revealed consistently high coefficients of variation, demonstrating substantial genetic differentiation within the Liriodendron genus. This pronounced phenotypic variation not only establishes critical selection criteria for superior germplasm identification but also underscores the remarkable phenotypic plasticity of Liriodendron species in specific growth characteristics, thereby enhancing breeding potential. Notably, germplasm exhibiting greater crown dimensions shows particular suitability for landscape applications, while accessions with accelerated growth rates are ideally suited for timber plantation development [34]. Of particular significance is the exceptional variation observed in stem form and branching architecture traits, which directly determine crown structure and wood properties [35]. These findings provide valuable insights for optimizing silvicultural practices and informing strategic breeding programs for varietal improvement.
As a fundamental determinant of evolutionary resilience and adaptive capacity, genetic diversity provides an essential baseline for both germplasm conservation and breeding applications [22]. In this study, we conducted a genome-wide SNP analysis across 297 Liriodendron accessions representing three taxonomically distinct groups: L. chinense, L. tulipifera, and their interspecific hybrids. As the most abundant form of genomic variation, SNPs offer several advantages—including codominance, amplification stability, and high reproducibility—which make them particularly suitable for assessing genetic diversity [36]. In recent years, SNP-based approaches have been widely applied in plant genetics research, significantly advancing germplasm management and varietal conservation efforts [37]. From an initial pool of variants, 4204 high-quality SNPs were stringently selected, showing a non-uniform distribution across the genome with evident regional variation. These markers exhibited an average PIC of 0.159, a critical index for evaluating inter-accession polymorphism and supporting gene pool development and breeding acceleration [38]. Compared with those in other forest species, such as Picea abies (PIC ≈ 0.12) [39] and Betula platyphylla (He ≈ 0.141) [40], the polymorphism levels observed in Liriodendron were representative and suitable for germplasm evaluation. The overall observed heterozygosity (Ho = 0.203), expected heterozygosity (He = 0.154), and Shannon’s diversity index (H′ = 0.364) collectively indicated a substantial degree of genetic diversity within the sampled population. Notably, the Liriodendron sino-americanum group exhibited the highest diversity across all indices, likely resulting from the incorporation of biparental allelic variation through interspecific hybridization. This pattern is consistent with prior studies on interspecific heterosis in Liriodendron sino-americanum and may represent a broader evolutionary trend, as similar diversity-enhancing effects have been reported in other woody taxa, such as poplar hybrid systems [41].
Genetic structure reveals the distribution patterns of genetic diversity within and among populations, serving as an important indicator of a species’ adaptive potential to its environment [42]. To characterize the genetic structure of Liriodendron germplasm resources, we conducted a series of genetic variation analyses. Population structure analysis indicated that the optimal clustering occurred at K = 3, dividing the 297 accessions into three genetic groups. Both principal component analysis and hierarchical clustering produced consistent results, which aligned with our expectations. Notably, North American L. tulipifera exhibited a broader genetic distribution than L. chinense and Liriodendron sino-americanum, potentially due to higher genetic heterogeneity or more complex evolutionary lineages within its populations. Long et al. similarly reported that L. tulipifera harbors approximately 1.8 times the genetic diversity of L. chinense, [43] likely resulting from multiple contributing factors such as geographic isolation, restricted gene flow [44], and historical domestication bottlenecks [45]. In the K = 3 population structure simulation, most accessions displayed mixed ancestry components, indicating frequent gene flow among groups and leading to partial differentiation without complete population separation. This observation is consistent with findings from red-fruited Ailanthus altissima varieties [19]. Genome-wide association analysis integrating genomic and phenotypic datasets revealed 25 significantly associated SNPs corresponding to DBH, tree height, and branch number traits, with primary genomic distributions on chromosomes 10, 11, and 17. Notably, the most strongly associated SNPs for these respective traits were 10_31605746, 9_55280744, and 17_69375264. These findings not only elucidate the molecular basis of key phenotypic characteristics in Liriodendron but also provide reliable target loci for molecular marker-assisted selection. The identified SNPs facilitate early trait prediction at the seedling stage through genotyping, potentially shortening the breeding cycle and accelerating the development of superior cultivars [46]. This dual “structure-function” approach has demonstrated practical utility, as reported by Resende et al. in their landmark study on Eucalyptus, this dual structure–function approach has already proven its practical value in tree breeding [47].
Building upon our previous systematic evaluations of phenotypic traits, genetic diversity, population structure, and genome-wide association analyses of key trait-associated SNPs, we established a robust theoretical and data-driven foundation for DNA fingerprint development in Liriodendron. Although DNA fingerprinting has been widely applied in crops and woody shrubs [48,49], no such database previously existed for Liriodendron species. The selection of appropriate SNP markers is essential for developing a DNA fingerprint database. Using a stepwise additive algorithm, we identified 13 core SNP markers demonstrating high polymorphism (PIC = 0.34), balanced genotype distribution, broad genomic coverage (spanning 8 chromosomes), and excellent discriminative ability. After validation, these markers were used to establish a DNA fingerprint database for 297 Populus germplasm samples. This database enables precise germplasm identification, promotes the shift from conventional to precision breeding methods, and offers molecular tools for Populus germplasm evaluation and breeding. Moreover, these core SNP markers serve as key links between molecular assays and breeding applications, valuable tools for germplasm identification, genetic relationship studies, marker-assisted breeding, and genetic map development [50,51,52]. As the first comprehensive effort to characterize Liriodendron germplasm at both the phenotypic and molecular levels, our findings offer critical scientific support for the conservation, precise identification, and innovative utilization of these valuable genetic resources.
4. Materials and Methods

4.1. Research on Germplasm Materials and Phenotypic Traits

A total of 297 Liriodendron germplasm accessions—including L. chinense, L. tulipifera, and their hybrid Liriodendron × sinoamericanum—were collected in July 2023 from the Liriodendron Germplasm Repository located at Xiashu Forest Farm (32°10′19.67″ N, 119°11′51.14″ E), a field station affiliated with Nanjing Forestry University (detailed metadata are provided in Supplementary Table S2). Fresh leaves or buds were immediately flash-frozen in liquid nitrogen and stored at −80 °C until DNA extraction. At the same time, Standardized protocols were implemented to measure phenotypic data for 34 traits spanning five key categories: growth parameters, branching architecture, leaf morphology, floral characteristics, and phenological phases (Table 7).
This study employed single nucleotide polymorphism (SNP) markers for experimental analysis. SNP markers were selected for germplasm identification and fingerprinting development due to their three fundamental advantages: genome-wide distribution, high polymorphism rates, and exceptional molecular stability. Whole-genome resequencing data from 197 representative accessions were used as the primary dataset for SNP discovery, population analysis, and fingerprinting development. Based on the core SNP markers identified from these data, SNP-specific primers were designed and validated via Sanger sequencing in an additional 100 accessions. All analyses were conducted using the reference genome assembly “Lchi1.0.a2_maker_aug.cds.filter.HCH.fasta,” developed and maintained by our research team.

4.2. Phenotypic Trait Data Processing and Evaluation

We quantitatively scored 34 traits across 297 Liriodendron germplasm accessions (Supplementary Table S3) and recorded all data uniformly using standardized protocols (Supplementary Table S4). Quantitative traits were processed through numerical coding using Microsoft Excel 2010, while descriptive traits were categorically classified. Phenotypic frequency distributions were analyzed for each trait, with coefficients of variation (CV = [SD/Mean] × 100%) and genetic diversity indices (H’ = −Σ[Pᵢ × lnPᵢ]) [53] calculated. Subsequent multivariate analyses included Pearson correlation and principal component analysis (PCA) performed in SPSS 24.0, hierarchical clustering conducted in Origin 2021(9.8) and comprehensive evaluation through membership function analysis to generate D-values for germplasm scoring.

4.3. DNA Extraction

Genomic DNA was extracted using the Tiangen Plant Genome DNA Kit. DNA integrity was verified by 1% agarose gel electrophoresis, with concentration and purity measured by NanoDrop spectrophotometry to ensure A260/A280 ratios between 1.7 and 1.9 and concentrations >50 ng/μL.

4.4. SNP Marker Screening and Sanger Sequencing Validation

4.4.1. Quality SNPs Screening

Whole-genome resequencing (WGS) data from 197 Liriodendron specimens were initially quality-checked with FastQC, followed by alignment to the reference genome (Lchi1.0.a2_maker_aug.cds.filter.HCH.fasta) using BWA. The resulting files were converted to BAM format using SAMtools, followed by sorting and duplicate removal to obtain the final BAM files for downstream analysis.
For SNP filtering, GATK (Genome Analysis Toolkit) was used with the following criteria: SNP marker meeting any of the criteria were filtered out: QD < 2.0|MQ < 40.0|FS > 60.0|SOR > 3.0|MQRankSum < −12.5|ReadPosRankSum < −8.0. Subsequently, VCFtools v0.1.16 was applied for additional filtering: Genotype missing rate < 20%|MAF > 0.05|HWE p < 0.0001|Biallelic SNPs only. Finally, strict filtering was performed to remove: Genotype quality (GQ) < 30, SNPs with >1% missing genotypes. Sites with average depth <3× or outside the 3–100× range. This process yielded high-quality SNP marker for further analysis.

4.4.2. Core SNPs Identification

A greedy feature increment algorithm was employed to identify the minimal set of core SNP markers. Initially, the genotype field (GT) was extracted from the VCF file using the scikit-allel package, and the genotypes at each SNP locus were standardized across all samples using the codes “0/0”, “0/1”, and “1/1”, resulting in a sample × locus genotype matrix. Genotype fingerprint codes were then generated by concatenating the genotypes of each sample for a given candidate SNP combination. In each iteration, the uniqueness of the fingerprint codes was assessed, and the most informative SNP site was progressively added until all 197 samples were assigned fully unique, non-redundant fingerprint codes. This procedure strictly adhered to the principle of minimizing the combination size to determine the smallest possible core SNP set.

4.4.3. Sanger Sequencing Validation

To validate the accuracy and reproducibility of the selected core SNPs, specific primers were designed for each of the 13 core SNP markers. Eight representative samples were then subjected to PCR amplification followed by agarose gel electrophoresis analysis. The PCR amplification conditions and cycling protocol were as follows: The amplification was performed in a 20 μL reaction system containing 10 μL of 2× Rapid Taq Master Mix, 7 μL nuclease-free ddH2O, 1 μL template DNA (200 ng/μL), and 1 μL each of forward and reverse primers (300 ng/μL). The thermal cycling protocol consisted of an initial denaturation at 94 °C for 5 min, followed by 35 cycles of denaturation at 94 °C for 30 s, annealing at 58 °C for 30 s, and extension at 72 °C for 1 min, with a final extension at 72 °C for 5 min and hold at 16 °C.
For genotyping accuracy verification, randomly selected core markers and their representative genotyped samples were analyzed using Sanger sequencing.

4.5. Genetic Diversity Analysis

Genetic diversity analysis was performed using high-quality SNP data in the R environment by calculating seven polymorphism indices: allele number (Na), effective allele number (Ne), observed heterozygosity (Ho), expected heterozygosity (He), polymorphic information content (PIC), Shannon’s diversity index (H′), and Nei’s genetic diversity index (Nei). To evaluate genetic structure and population differentiation, principal component analysis (PCA), cluster analysis, linkage disequilibrium (LD) analysis, and population structure analysis were conducted. A custom Python script was used to parse VCF files and construct a numerical genotype matrix, with PCA implemented using the scikit-learn module. Euclidean genetic distances between samples were calculated using the pdist function in SciPy 1.15.0 followed by average-linkage hierarchical clustering and dendrogram visualization. For LD analysis, the top 1000 markers from the chromosome with the highest number of SNPs were selected, and pairwise LD (r2) values were calculated using the Rogers–Huff method in scikit-allel, incorporating physical distance data. Population structure was inferred for all 197 individuals using STRUCTURE 2.3, based on a Bayesian clustering approach. Trait–SNP associations were evaluated through a genome-wide association study (GWAS) using a general linear model (GLM), in which the genotype matrix was subjected to linear regression. The GLM was defined as:
Y = Xβ + ε
here Y: Phenotypic trait vector (n × 1), X: Design matrix including the intercept and SNP genotype data (n × p), β: Fixed-effect parameter vector (p × 1), representing SNP effect sizes, ε: Residual term, assumed to follow ε ~ n(0, σ2)

4.6. DNA Fingerprinting Construction

Genotype information (GT field) for the core SNP markers was extracted from the VCF files and converted into a biallelic format. For each sample, genotype strings of the core markers were concatenated in a fixed genomic order—based on chromosome number and physical position—to generate complete genotype fingerprint codes.
QR code images were generated using Python 3.11 qrcode library by encoding both the fingerprint codes and associated trait data of each Liriodendron accession. The resulting QR codes were embedded into an Excel-based fingerprint map using the openpyxl package, producing a visualized “one-code-one-image” format for all accessions.

5. Conclusions

This study systematically characterized Liriodendron germplasm resources through integrated phenotypic and molecular analyses. Phenotypic evaluation of key traits (DBH, tree height, branch number, and crown width) revealed significant variation and trait correlations within the genus, elucidating fundamental germplasm structures that inform selective breeding strategies and superior germplasm identification, thereby enhancing breeding efficiency. Molecular analyses employing high-quality SNPs clarified the genetic diversity and population structure of Liriodendron species. Further, we developed a core SNP-based fingerprinting system that uniquely identifies all accessions through QR-coded digital markers, enabling efficient germplasm management and traceability. These integrated approaches provide robust technical support for Liriodendron germplasm identification, evaluation, and conservation, and favor advancing breeding process for this genus.

Supplementary Materials

The following supporting information can be downloaded at: https://www.mdpi.com/article/10.3390/plants14172626/s1, Table S1: DNA Fingerprinting Profiles and Molecular IDs for 297 Liriodendron Accessions; Table S2: The Codes and Species attribution of 297 Liriodendron Germplasm Accessions; Table S3: Scoring Table for 34 Morphological Traits; Table S4: Data Collection Sheets for 34 Morphological Traits in 297 Liriodendron Accessions.

Author Contributions

Conceptualization, H.L.; methodology, X.L., H.Y. and Y.C.; software, X.L., and T.Z.; formal analysis, X.L., H.Y. and Y.C.; investigation, X.L., F.Z., X.C., T.Z. and H.Y.; resources, H.L.; original draft preparation, H.Y. and T.Z.; writing—review and editing, H.Y., and H.L.; supervision, H.L. All authors have read and agreed to the published version of the manuscript.

Funding

This study was supported by funds from the National Key Research and Development Program (2022YFD2200104) and the Priority Academic Program Development of Jiangsu Higher Education Institutions (PAPD).

Data Availability Statement

The research data supporting the findings of this study will be made available upon reasonable request. The necessary data is supplemented in the Supplementary file.

Acknowledgments

We thank Hainan Wu, Lichun Yang, and Jing Wang for their valuable help in the preparation of this manuscript.

Conflicts of Interest

The authors declare no conflicts of interest.

References

  1. Nezu, I.; Ishiguri, F.; Ohshima, J.; Yokota, S. Relationship between the xylem maturation process based on radial variations in wood properties and radial growth increments of stems in a fast-growing tree species, Liriodendron tulipifera. J. Wood Sci. 2022, 68, 48. [Google Scholar] [CrossRef]
  2. Yang, A.; Dick, C.W.; Yao, X.; Huang, H. Impacts of biogeographic history and marginal population genetics on species range limits: A case study of Liriodendron chinense. Sci. Rep. 2016, 6, 25632. [Google Scholar] [CrossRef]
  3. Zhou, Y.; Wei, X.; Abbas, F.; Yu, Y.; Yu, R.; Fan, Y. Genome-wide identification of simple sequence repeats and assessment of genetic diversity in Hedychium using phenotypic traits. J. Appl. Res. Med. Aromat. Plants 2021, 24, 100312. [Google Scholar] [CrossRef]
  4. Zong, Y.; Hao, Z.; Tu, Z.; Shen, Y.; Zhang, C.; Wen, S.; Yang, L.; Ma, J.; Li, H. Genome-Wide survey and identification of AP2/ERF genes involved in shoot and leaf development in Liriodendron chinense. BMC Genom. 2021, 22, 807. [Google Scholar] [CrossRef]
  5. Sheng, Y.; Hao, Z.; Peng, Y.; Liu, S.; Hu, L.; Shen, Y.; Shi, J.; Chen, J. Morphological, phenological, and transcriptional analyses provide insight into the diverse flowering traits of a mutant of the relic woody plant Liriodendron chinense. Hortic. Res. 2021, 8, 206. [Google Scholar] [CrossRef]
  6. Liu, H.; Yang, L.; Tu, Z.; Zhu, S.; Zhang, C.; Li, H. Genome-Wide identification of mIKC-Type genes related to stamen and gynoecium development in Liriodendron. Sci. Rep. 2021, 11, 6585. [Google Scholar] [CrossRef]
  7. Li, K.; Chen, L.; Feng, Y.; Li, H. High genetic diversity but limited gene flow among remnant and fragmented natural populations of Liriodendron chinense Sarg. Biochem. Syst. Ecol. 2014, 54, 230–236. [Google Scholar] [CrossRef]
  8. Chen, J.; Hao, Z.; Guang, X.; Zhao, C.; Wang, P.; Xue, L.; Zhu, Q.; Yang, L.; Sheng, Y.; Zhou, Y.; et al. Liriodendron genome sheds light on angiosperm phylogeny and species-pair differentiation. Nat. Plants 2019, 5, 328. [Google Scholar] [CrossRef]
  9. Zhong, Y.; Yang, A.; Liu, S.; Yu, F. RAD-Seq data point to a distinct split in Liriodendron (Magnoliaceae) and obvious east–west genetic divergence in L. chinense. Forests 2018, 10, 13. [Google Scholar] [CrossRef]
  10. Rahman, S.U.; Jamil, S.; Shahzad, R.; Yasmeen, E.; Sattar, S.; Lqbal, M.Z. Genetic diversity and DNA fingerprintin of potato varieties using simple sequence repeat (SSR) markers. J. Anim. Plant Sci. 2022, 32, 775–783. [Google Scholar] [CrossRef]
  11. Wang, F.; Chen, X.; Huang, Z.; Wei, L.; Wang, J.; Wen, S.; Liu, Y.; Zhou, Y. Phenotypic Characterization and Marker–Trait Association Analysis Using SCoT Markers in Chrysanthemum (Chrysanthemum morifolium Ramat.). Genes 2025, 16, 664. [Google Scholar] [CrossRef]
  12. Donkpegan, A.S.L.; Bernard, A.; Barreneche, T.; Quero-García, J.; Bonnet, H.; Fouché, M.; Le Dantec, L.; Wenden, B.; Dirlewanger, E. Genome-Wide association mapping in a sweet cherry Germplasm collection (Prunus avium L.) reveals candidate genes for fruit quality traits. Hortic. Res. 2023, 10, 191. [Google Scholar] [CrossRef] [PubMed]
  13. Zhao, R.; Huang, N.; Zhang, Z.; Luo, W.; Xiang, J.; Xu, Y.; Wang, Y. Genetic Diversity Analysis and Prediction of Potential Suitable Areas for the Rare and Endangered Wild Plant Henckelia longisepala. Plants 2024, 13, 2093. [Google Scholar] [CrossRef] [PubMed]
  14. Qin, Q.; Dong, Y.; He, J.; Chen, J.; Wu, D.; Zhang, S. Assessment of genetic diversity and construction of core germplasm in populations of Acorus tatarinowii based on SNP markers. J. Appl. Res. Med. Aromat. Plants 2025, 44, 100605. [Google Scholar] [CrossRef]
  15. Adu, G.B.; Awuku, F.J.; Garcia-Oliveira, A.L.; Amegbor, I.K.; Nelimor, C.; Nboyine, J.; Karikari, B.; Atosona, B.; Manigben, K.A.; Aboyadana, P.A. Dartseq-based SNP markers reveal high genetic diversity among early generation fall armyworm tolerant maize inbred lines. PLoS ONE 2024, 19, e0294863. [Google Scholar] [CrossRef] [PubMed]
  16. Agre, P.A.; Dassou, A.G.; Loko, L.E.Y.; Idossou, R.; Dadonougbo, E.; Gbaguidi, A.; Mondo, J.M.; Muyideen, Y.; Adebola, P.O.; Asiedu, R.; et al. Diversity of white Guinea yam (Dioscorea rotundatapoir) cultivars from Benin as revealed by agro-morphological traits and SNP markers. Plant Genet. Resour. Charact. Util. 2021, 19, 437–446. [Google Scholar] [CrossRef]
  17. Tian, H.; Wang, F.; Zhao, J.; Yi, H.; Wang, L.; Wang, R.; Yang, Y.; Song, W. Development of maizeSNP3072, a high-throughput compatible SNP array, for DNA fingerprinting identification of Chinese maize varieties. Mol. Breed. 2015, 35, 136. [Google Scholar] [CrossRef]
  18. Yan, P.; Xie, Z.; Feng, K.; Qiu, X.; Zhang, L.; Zhang, H. Genetic diversity analysis and fingerprint construction of Korean pine (Pinus koraiensis) clonal seed orchard. Front. Plant Sci. 2022, 13, 1079571. [Google Scholar] [CrossRef]
  19. Zhang, M.; Zheng, C.; Li, J.; Wang, X.; Liu, C.; Li, X.; Xu, Z.; Du, K. Genetic diversity, population structure, and DNA fingerprinting of Ailanthus altissima var. erythrocarpa based on EST-SSR markers. Sci. Rep. 2023, 13, 19315. [Google Scholar] [CrossRef]
  20. Liu, Y.; Teng, Y.; Zheng, J.; Khan, A.; Li, X.; Tian, Y.; Cui, J.; Guo, Q. Analysis of genetic diversity in tea plant population and construction of DNA fingerprint profile using SNP markers identified by SLAF-Seq. Horticulturae 2025, 11, 529. [Google Scholar] [CrossRef]
  21. Xing, X.; Hu, T.; Wang, Y.; Li, Y.; Wang, W.; Hu, H.; Wei, Q.; Yan, Y.; Gan, D.; Bao, C.; et al. Construction of SNP fingerprints and genetic diversity analysis of radish (Raphanus sativus L.). Front. Plant Sci. 2024, 15, 1329890. [Google Scholar] [CrossRef]
  22. Yang, Y.; Lyu, M.; Liu, J.; Wu, J.; Wang, Q.; Xie, T.; Li, H.; Chen, R.; Sun, D.; Yang, Y.; et al. Construction of an SNP fingerprinting database and population genetic analysis of 329 cauliflower cultivars. BMC Plant Biol. 2022, 22, 522. [Google Scholar] [CrossRef]
  23. Meng, Y.; Zhao, N.; Li, H.; Zhai, H.; He, S.; Liu, Q. SSR fingerprinting of 203 sweetpotato (Ipomoea batatas (L.) Lam.) varieties. J. Integr. Agric. 2018, 17, 86–93. [Google Scholar] [CrossRef]
  24. Carvalho, M.; Matos, M.; Carnide, V. Fingerprinting of vaccinium corymbosum cultivars using DNA of fruits. Hortic. Sci. 2014, 41, 175–184. [Google Scholar] [CrossRef]
  25. Awasthi, A.K.; Nagaraja, G.M.; Naik, G.V.; Kanginakudru, S.; Thangavelu, K.; Nagaraju, J. Genetic diversity and relationships in mulberry (genus Morus) as revealed by RAPD and ISSR marker assays. BMC Genet. 2004, 5, 1. [Google Scholar] [CrossRef]
  26. Struss, D.; Ahmad, R.; Southwick, S.M.; Boritzki, M. Analysis of sweet cherry (Prunus avium L.) cultivars using SSR and AFLP markers. J. Am. Soc. Hortic. Sci 2003, 128, 904–909. [Google Scholar] [CrossRef]
  27. Li, B.; Lin, F.; Huang, P.; Guo, W.; Zheng, Y. Development of nuclear SSR and chloroplast genome markers in diverse Liriodendron chinense germplasm based on low-coverage whole genome sequencing. Biol. Res. 2020, 53, 21. [Google Scholar] [CrossRef]
  28. Evanno, G.S.; Regnaut, S.J.; Goudet, J. Detecting the number of clusters of individuals using the software STRUCTURE: A simulation study. Mol. Ecol. 2005, 14, 2611–2620. [Google Scholar] [CrossRef] [PubMed]
  29. Wu, H.; Hao, Z.; Tu, Z.; Zong, Y.; Yang, L.; Tong, C.; Li, H. Re-annotation of the Liriodendron chinense genome identifies novel genes and improves genome annotation quality. Tree Genet. Genomes 2023, 19, 30. [Google Scholar] [CrossRef]
  30. Boerjan, W. Biotechnology and the domestication of forest trees. Curr. Opin. Biotechnol. 2005, 16, 159–166. [Google Scholar] [CrossRef]
  31. Tong, Y.; Durka, W.; Zhou, W.; Zhou, L.; Yu, D.; Dai, L. Ex situ conservation of Pinus koraiensis can preserve genetic diversity but homogenizes population structure. For. Ecol. Manag. 2020, 465, 117820. [Google Scholar] [CrossRef]
  32. Zhou, Q.; Mu, K.; Ni, Z.; Liu, X.; Li, Y.; Xu, L. Analysis of genetic diversity of ancient Ginkgo populations using SSR markers. Ind. Crop. Prod. 2020, 145, 111942. [Google Scholar] [CrossRef]
  33. Tong, Y.; Tang, Y.; Chen, H.; Zhang, T.; Zuo, J.; Wu, J.; Zhou, L.; Zhou, W.; Yu, D.; Dai, L. Phenotypic diversity of Pinus koraiensis populations in a seed orchard. Acta Ecol. Sin. 2019, 39, 6341–6348. [Google Scholar] [CrossRef]
  34. Pan, W.; Xia, X.; Xia, L.; Sun, J.; Wu, X.; Yu, L.; Li, Y. Effects of Planting Densities on Tree Growth and Wood Quality of 25-Year-Old Liriodendron chinense Plantations. J. Nanjing For. Univ. Nat. Sci. Ed. 2018, 42, 46–52, (In Chinese with English Abstract). [Google Scholar]
  35. Pyörälä, J.; Saarinen, N.; Kankare, V.; Coops, N.C.; Liang, X.; Wang, Y.; Holopainen, M.; Hyyppä, J.; Vastaranta, M. Variability of wood properties using airborne and terrestrial laser scanning. Remote Sens. Environ. 2019, 235, 111474. [Google Scholar] [CrossRef]
  36. Fu, Y. Flax domestication processes as inferred from genome-wide SNP data. Sci. Rep. 2025, 15, 8731. [Google Scholar] [CrossRef]
  37. Davey, J.W.; Hohenlohe, P.A.; Etter, P.D.; Boone, J.Q.; Catchen, J.M.; Blaxter, M.L. Genome-wide genetic marker discovery and genotyping using next-generation sequencing. Nat. Rev. Genet. 2011, 12, 499–510. [Google Scholar] [CrossRef]
  38. Avval, S.E. Assessing polymorphism information content (PIC) using SSR molecular markers on local species of Citrullus colocynthis. case study: Iran, Sistan-Balouchestan province. J. Mol. Biol. Res. 2017, 7, 42–49. [Google Scholar] [CrossRef]
  39. Maghuly, F.; Pinsker, W.; Praznik, W.; Fluch, S. Genetic diversity in managed subpopulations of Norway spruce [Picea abies (L.) Karst.]. For. Ecol. Manag. 2006, 222, 266–271. [Google Scholar] [CrossRef]
  40. Hao, W.; Wang, S.; Liu, H.; Zhou, B.; Wang, X.; Jiang, T. Development of SSR markers and genetic diversity in white birch (Betula platyphylla). PLoS ONE 2015, 10, e0129758. [Google Scholar] [CrossRef]
  41. Kainer, D.; Padovan, A.; Degenhardt, J.; Krause, S.; Mondal, P.; Foley, W.J.; Külheim, C. High marker density GWAS provides novel insights into the genomic architecture of terpene Oil yield in Eucalyptus. New Phytol. 2019, 223, 1489–1504. [Google Scholar] [CrossRef] [PubMed]
  42. Melo, A.T.D.; Coelho, A.S.G.; Pereira, M.F.; Blanco, A.J.V.; Franceschinelli, E.V. High genetic diversity and strong spatial genetic structure in Cabralea canjerana (Vell.) Mart. (Meliaceae): Implications for brazilian atlantic forest tree conservation. Nat. Conserv. 2014, 12, 152–158. [Google Scholar] [CrossRef]
  43. Long, X.; Weng, Y.; Liu, S.; Hao, Z.; Sheng, Y.; Guan, L.; Shi, J.; Chen, J. Genetic Diversity and Differentiation of Relict Plant Liriodendron Populations Based on 29 Novel EST-SSR Markers. Forests 2019, 10, 334. [Google Scholar] [CrossRef]
  44. Cao, Y.; Feng, J.; Hwarari, D.; Ahmad, B.; Wu, H.; Chen, J.; Yang, L. Alterations in population distribution of Liriodendron chinense (Hemsl.) Sarg. And Liriodendron tulipifera Linn. caused by climate change. Forests 2022, 13, 488. [Google Scholar] [CrossRef]
  45. Fetter, K.C.; Weakley, A. Reduced Gene Flow from mainland populations of Liriodendron tulipifera into the florida peninsula promotes diversification. Int. J. Plant Sci. 2019, 180, 253–269. [Google Scholar] [CrossRef]
  46. Chen, Z.; Baison, J.; Pan, J.; Karlsson, B.; Andersson, B.; Westin, J.; García-Gil, M.R.; Wu, H. Accuracy of Genomic Selection for Growth and Wood Quality Traits in Two Control-Pollinated Progeny Trials Using Exome Capture as the Genotyping Platform in Norway Spruce. BMC Genom. 2018, 19, 946. [Google Scholar] [CrossRef]
  47. Resende, M.D.V.; Resende, M.F.R.; Sansaloni, C.P.; Petroli, C.D.; Missiaggia, A.A.; Aguiar, A.M.; Abad, J.M.; Takahashi, E.K.; Rosado, A.M.; Faria, D.A.; et al. Genomic selection for growth and wood quality in Eucalyptus: Capturing the missing heritability and accelerating breeding for complex traits in forest trees. New Phytol. 2012, 194, 116–128. [Google Scholar] [CrossRef]
  48. Wang, L.; Xun, H.; Aktar, S.; Zhang, R.; Wu, L.; Ni, D.; Wei, K.; Wang, L. Development of SNP markers for original analysis and germplasm identification in Camellia sinensis. Plants 2023, 12, 924. [Google Scholar] [CrossRef]
  49. Kawamura, K.; Shimizu, M.; Kawanabe, T.; Pu, Z.; Kodama, T.; Kaji, M.; Osabe, K.; Fujimoto, R.; Okazaki, K. Assessment of DNA markers for seed contamination testing and selection of disease resistance in cabbage. Euphytica 2017, 213, 28. [Google Scholar] [CrossRef]
  50. Wang, Y.; Lv, H.; Xiang, X.; Yang, A.; Feng, Q.; Dai, P.; Li, Y.; Jiang, X.; Liu, G.; Zhang, X. Construction of a SNP fingerprinting database and population genetic analysis of Cigar. Tobacco germplasm resources in China. Front. Plant Sci. 2021, 12, 618133. [Google Scholar] [CrossRef]
  51. Potts, J.; Michael, V.N.; Meru, G.; Wu, X.; Blair, M.W. Dissecting the genetic diversity of USDA Cowpea germplasm collection using kompetitive allele specific PCR-single nucleotide polymorphism markers. Genes 2024, 15, 362. [Google Scholar] [CrossRef] [PubMed]
  52. Patil, G.; Chaudhary, J.; Vuong, T.D.; Jenkins, B.; Qiu, D.; Kadam, S.; Shannon, G.J.; Nguyen, H.T. Development of SNP genotyping assays for seed composition traits in Soybean. Int. J. Plant Genom. 2017, 2017, 6572969. [Google Scholar] [CrossRef] [PubMed]
  53. Liu, D.; Wang, X.; Li, W.; Li, J.; Tan, W.; Xing, W. Genetic diversity analysis of the phenotypic traits of 215 sugar beet germplasm resources. Sugar Tech 2022, 24, 1790–1800. [Google Scholar] [CrossRef]
Figure 1. Multivariate phenotypic analysis of Liriodendron germplasm: (a) Principal Component Analysis (PCA) showing green, orange, and purple data points corresponding to Liriodendron sino-americanum, L. tulipifera and L. chinense; (b) Hierarchical clustering with blue, green and orange clusters representing L. chinense, Liriodendron sino-americanum and L. tulipifera; (c) Trait correlation matrix (Pearson’s r) with color gradient indicating correlation strength.
Plants 14 02626 g001
Figure 2. Distribution map of SNP base substitution variant types. As shown in the figure.
Plants 14 02626 g002
Figure 3. Representative agarose gel electrophoresis image validating 13 core SNP markers across eight Liriodendron accessions as shown in the figure. Lanes 1–8 represent eight independent samples, with DNA bands of the expected size. M represents the DNA marker (indicate size range, e.g., 100–2000 bp); (AC) correspond to the first three primer pairs, with eight samples tested for each primer pair.
Plants 14 02626 g003
Figure 4. (a) Population structure clustering effect (Bayesian clustering model) score plot of 197 materials under different K values; (b) Genetic admixture proportions among 197 accessions at optimal K = 3. Color-coded clusters: Cluster 1 (red) = L. tulipifera, Cluster 2 (blue) = L. chinense, Cluster 3 (green) = Liriodendron sino-americanum.
Plants 14 02626 g004
Figure 5. (a) Principal Component Analysis (PCA) based on SNP markers; (b) UPGMA clustering based on SNP markers. Color-coded representation of different Liriodendron groups (as shown in the figure).
Plants 14 02626 g005
Figure 6. Linkage Disequilibrium (LD) decay plot.
Plants 14 02626 g006
Figure 7. Single-Trait GWAS of Growth Traits in 197 Liriodendron Samples (a,b) Manhattan plot and QQ plot for the annual average diameter at breast height increment The black dashed line indicates the significance threshold at p = 1 × 10⁻³. In QQ plot, the red and blue dashed lines represent the expected distribution and the observed distribution, respectively. (c,d) Manhattan plot and QQ plot for the annual average height increment (e,f) Manhattan plot and QQ plot for the number of branches.
Plants 14 02626 g007
Table 1. Analysis of genetic variation in 34 traits across 297 germplasm samples.
Phenotypic TraitMaximumMinimumMeanStandard Deviation (SD)Coefficient of Variation (%)Shannon’s Diversity Index (H’)
DBH annual growth2.850.401.620.4326.575.23
Height annual growth1.630.321.220.2924.254.72
Branch number48119.637.4037.683.34
Under-branch height312.340.6929.450.98
Crown shape312.410.8937.030.74
Crown width311.600.6138.460.89
Lenticel211.810.3921.820.49
Stem form512.581.2046.581.41
Bark fissuring311.930.2714.270.29
Bark color211.330.4735.410.63
Branch diameter311.650.6740.850.96
Branch density311.870.7640.851.07
Epidermis color211.970.168.220.12
Juvenile leaf color333000
Mature leaf color333000
Summer leaf color423.470.5114.590.71
Autumn leaf color411.900.6835.560.74
Leaf shape311.940.4020.730.55
Number of leaf lobes311.940.4020.730.55
Leaf lobe depth312.020.4924.390.72
Central lobe angle312.130.4822.470.69
Leaf margin111000
Leaf base shape622.030.3517.260.09
Bud burst timing312.170.7433.881.05
Flowering period311.980.6130.680.91
Leaf coloration period312.070.5928.490.88
Leaf color duration312.100.5827.590.87
Standard term312.180.6027.700.90
Leaf abscission date312.110.6028.580.91
Corolla shape322.060.2311.310.22
Inner tepal color222000
Tip recurvature211.210.4033.570.51
Floral striping111000
Color striping111000
Table 2. Core SNP Marker and primer information.
ChromosomePositionForward_PrimerReverse_PrimerPIC
chr754379502TTGCTCCCCCATAACCTGATGCTAATCTATGCCTTGGTC0.3737
chr925701542CGATCATGAATTTTCTACCCCTAGCTCCCCAAGTATATCCCA0.3702
chr1108063211ACATGATAGGAAAGCCCGACTGCAGTAAACCCAAGGCAAC0.3686
chr119625439AGACTAATTCCTTCCGGCTACGAGACTCTACTTTTCGGAT0.3666
chr13360931GTCGTCTTTCCCATTCGATATTTTACCAAGCAATGCCTC0.3655
chr275819730TACAGGAGCAAATCATCCAGCATTAGGCAGACTCAATCCA0.3647
chr272967413ATGTAATCCCGTTTACTCCCTAAGATCAGGCCAAGTGCAT0.3496
chr1571449735AAAAGCAAATTCGCGGAGTTTCGATGCTACCGTGGACA0.3496
chr729021AGCCATTTTAATGATCCACACACTAGCCTCAATAAGAATGC0.3280
chr1067277714ATGTTTGGGAGAAATCCAGTCCGCTCATGGTTTTAATCGTT0.3280
chr199446947CAATCAGGTAATAGGCTCGTAGAAGCCGTTGATAGATCCA0.3206
chr955279902ATGAATGGGCTACACCACAATACATGAAATTCAGCAACA0.2965
chr1571464364GTATATCCACCCCGTCCACCTTCCATCTAGTGCGCTTT0.2907
Table 3. Three Genotypes at One SNP Locus in Three Samples and Their Sequencing Maps.
Sample IDSNP SitesGenotypeSequencing Chromatogram
S_BK1_1637:543795020/0Plants 14 02626 i001
BK1_S_1337:543795020/1Plants 14 02626 i002
BK1_S_277:543795021/1Plants 14 02626 i003
Table 4. Genetic diversity analysis of different Liriodendron species.
ClassNaNeHoHePICH’Nei
Liriodendron sino-americanum2.001.230.200.180.140.460.18
L. tulipifera1.541.230.190.150.100.350.15
L.chinense1.361.230.210.130.080.290.13
Table 5. Significantly associated SNPs with phenotypic traits identified.
TraitSNP IDChrPospSignificance
DBH growth per year10_316057461031,605,7460.00021p < 0.001
DBH growth per year10_685234761068,523,4760.00028p < 0.001
DBH growth per year10_684944571068,494,4570.00045p < 0.001
DBH growth per year11_205359811120,535,9810.00062p < 0.001
DBH growth per year6_25999454625,999,4540.00095p < 0.001
DBH growth per year9_55280744955,280,7440.000005p < 0.0001
DBH growth per year11_201338061120,133,8060.00005p < 0.0001
Number of branches17_693752641769,375,2640.00001p < 0.0001
Number of branches12_603233011260,323,3010.00002p < 0.0001
Number of branches17_693697731769,369,7730.00004p < 0.0001
Number of branches19_326593571932,659,3570.00004p < 0.0001
Number of branches8_38736461838,736,4610.00007p < 0.0001
Number of branches4_64433608464,433,6080.0001p < 0.001
Number of branches6_70857940670,857,9400.0001p < 0.001
Number of branches3_738822137,388,2210.0001p < 0.001
Number of branches5_32339010532,339,0100.00012p < 0.001
Number of branches10_685101371068,510,1370.00014p < 0.001
Number of branches6_22671960622,671,9600.00016p < 0.001
Number of branches10_685028601068,502,8600.00019p < 0.001
Number of branches1_730695917,306,9590.00028p < 0.001
Number of branches15_621974881562,197,4880.00033p < 0.001
Number of branches4_13788354413,788,3540.00039p < 0.001
Number of branches1_96218257196,218,2570.00043p < 0.001
Number of branches7_26406718726,406,7180.00045p < 0.001
Number of branches11_187616721118,761,6720.00045p < 0.001
Table 6. Examples of DNA fingerprinting and molecular ID codes for part of Liriodendron germplasm.
Sample IDSNP Fingerprint CodeQR CodeSample IDSNP Fingerprint CodeQR Code
BK1_H_1171/10/10/1.0/0.0/11/1.0/0.0/00/10/0...Plants 14 02626 i004S_BK1_1610/10/10/00/10/01/10/11/10/00/0...Plants 14 02626 i005
BK1_H_1180/0.1/10/1.0/0.1/11/10/10/00/10/0...Plants 14 02626 i006S_BK1_1621/11/10/00/10/0.0/0.0/00/10/10/1...Plants 14 02626 i007
BK1_H_1201/10/10/1.0/0.1/10/10/10/00/00/0...Plants 14 02626 i008S_BK1_1631/10/10/00/10/00/10/00/10/10/0...Plants 14 02626 i009
Table 7. Investigated Phenotypic Traits in Liriodendron spp.
ClassificationPhenotypic Trait
1Growth TraitsDBH annual growth
2Height annual growth
3Branch number
4Under-branch height
5Crown shape
6Crown width
7Stem form
8Lenticel
9Bark fissuring
10Bark color
11Branch TraitsBranch density
12Branch diameter
13Epidermis color
14Leaf TraitsJuvenile leaf color
15Mature leaf color
16Summer leaf color
17Autumn leaf color
18Leaf shape
19Number of leaf lobes
20Leaf lobe depth
21Central lobe angle
22Leaf margin
23Leaf base shape
24Flower TraitsCorolla shape
25Inner tepal color
26Tip recurvature
27Floral striping
28Color striping
29PhenologyBud burst timing
30Flowering period
31Leaf coloration period
32Leaf color duration
33Standard term
34Leaf abscission date
Disclaimer/Publisher’s Note: The statements, opinions and data contained in all publications are solely those of the individual author(s) and contributor(s) and not of MDPI and/or the editor(s). MDPI and/or the editor(s) disclaim responsibility for any injury to people or property resulting from any ideas, methods, instructions or products referred to in the content.