2.1. Cutting Test
The results of the cutting test are shown in
Table 1. A detailed description of the treatments applied, in terms of enzyme concentration, type of washing, and drying (T1–T9), as well as the characteristics of the controls (Control 1 and Control 2), is shown in the Experimental Design section. In the case of Nacional cocoa, significant differences were found in the variables Good fermentation, Medium fermentation, and Low fermentation. No significant differences were found for the remaining variables. The percentage of Good fermentation (GF) ranged from 78 to 88%, with Control 2 having the highest percentage of beans with good fermentation and T3 treatment having the lowest percentage (enzyme dose 0.10 mL·kg
−1 of cocoa, complete washing, rest in pre-drying for 48 h, and drying on a splint). With regard to Medium fermentation (MF), the interval ranged between 5 and 15%; from 0 to 10% for Low fermentation (LF) and Over fermentation (OF) presented low rates, no higher than 3%, with T1, T2, and T6 being the treatments that did not show Over fermentation (with enzyme dose 0.10 or 0.20 mL·kg
−1 of cocoa). The highest percentage of Slaty (S) beans was 3% in treatments T1 and T3 (enzyme dose 0.10 mL·kg
−1 of cocoa), and 0% for T2 and T4 (enzyme dose 0.10 or 0.20 mL·kg
−1 of cocoa, incomplete or without washing, rest in pre-drying for 24 h). Treatments T2, T3, T5, T8 (different enzyme doses and postharvest conditions), and Control 1 (mechanical mucilagination) showed the presence of mold (M) ranging from 1 to 2% of the beans, while treatments T3 and T8 showed insect damage (ID).
In CCN-51 cocoa, significant differences were found only in the variable Medium fermentation, with two levels of significance; the rest of the variables did not show significant differences. GF ranged from 77 to 90%, with treatments T7 (enzyme dose 0.30 mL·kg−1 of cocoa, without washing, rest in pre-drying for 48 h, and drying on a marquee) and Control 2 (producer local control) having the highest percentage of beans with this level of fermentation, while treatment T1 had the lowest percentage. For MF, the values ranged between 3 and 12%, and for Low fermentation, between 2 and 5%. With regard to OF, the maximum value was 1% for treatments T1, T4, T6, T7, and Control 2, while the other treatments did not show this type of fermentation. The highest percentage of beans with a slaty appearance was 4% in T1, with treatments T3, T5, T6, and T8 not showing this defect. The presence of mold was observed in almost all treatments, ranging from 1% to 5% of the beans, with treatments T4, T7, and Control 2 not showing any mold, while treatments T4 and T6 showed damage caused by insects.
All samples for both Nacional and CCN-51 cocoa showed values that meet the limits set by the Ecuadorian standard INEN 176:2021 [
21] for GF, MF, and S beans. The standard requires a minimum of 75% completely fermented beans, a maximum of 15% medium fermented beans, and a maximum of 9% slaty beans. With regard to beans with mold, it was found that treatments T1, T4, T6, T7, T9, and Control 2 for Nacional cocoa genotype, as well as treatments T4, T7, and Control 2 for CCN-51, complied with the requirements of the standard, which states that the presence of mold should not exceed 1%. Regarding mold damage, the results of the Nacional cocoa were better than those of CCN-51, since the number of Nacional samples with ID was lower, and when values exceeded the limit of 1%, the maximum percentage of beans with mold was 2%. For CCN-51, the majority of the samples showed M, with percentages higher than in Nacional cacao, reaching a maximum of 5% for T3. In this study, when the PTE enzyme was used for fermentation, the incidence of mold in Nacional cocoa was generally lower than that obtained previously [
22].
2.2. Chemical Analysis
2.2.1. pH and Acidity
The pH values obtained are displayed in
Figure 1. Significant differences were identified among the various treatments applied to the Nacional cocoa genotype, with six levels of statistical significance. Treatment T6 exhibited the pH value closest to neutrality (6.72), followed by T2 and T3. Conversely, the T4 treatment exhibited the lowest pH value (5.63), a result that differed significantly from the other samples.
Comparison with the study by Morales et al. (2024) [
9] on fine aroma cocoa from the parish of Valle Hermoso reveals that the pH values obtained in that study ranged from 4.72 to 6.08, indicating a higher acidity compared to the results obtained in the present study [
9].
The analysis of these results indicates that the pH of Nacional cocoa varies with the treatments applied, influenced by factors such as the dose of PTE, mucilage washing, and drying conditions. A lower pH, as observed in T4, suggests higher acid production during fermentation, which could be associated with higher activity of fermentative microorganisms in the absence of washing and a shorter resting time during pre-drying. Conversely, treatments exhibiting higher pH, such as T6 and T2, might be associated with diminished organic acid accumulation, potentially attributable to a synergetic effect of washing and drying under regulated conditions.
In the CCN-51 cocoa genotype, variations in pH were also observed among the various treatments, with four levels of statistical significance. Treatment T3 exhibited the pH value closest to neutrality (6.85), followed by T1 and Control 1. Conversely, Control 2 exhibited the lowest pH value (6.00), a result that differed significantly from the other samples.
The CCN-51 cocoa beans exhibited higher pH values compared to the Nacional in all treatments. This finding suggests a reduced level of acidification during processing, which may be attributable to variations in chemical composition and microbial activity during fermentation, resulting in diminished production of acidic compounds or augmented buffering capacity within the bean pulp.
These findings have implications for the quality of fermented cocoa, as a higher pH in CCN-51 may contribute to a less acidic and milder sensory profile compared to Nacional cocoa. Furthermore, the disparity between Control 1 and Control 2 underscores the pivotal influence of processing methodology on the ultimate pH of the beans, thereby emphasizing the significance of parameters such as washing, pre-drying, resting time, and drying technique.
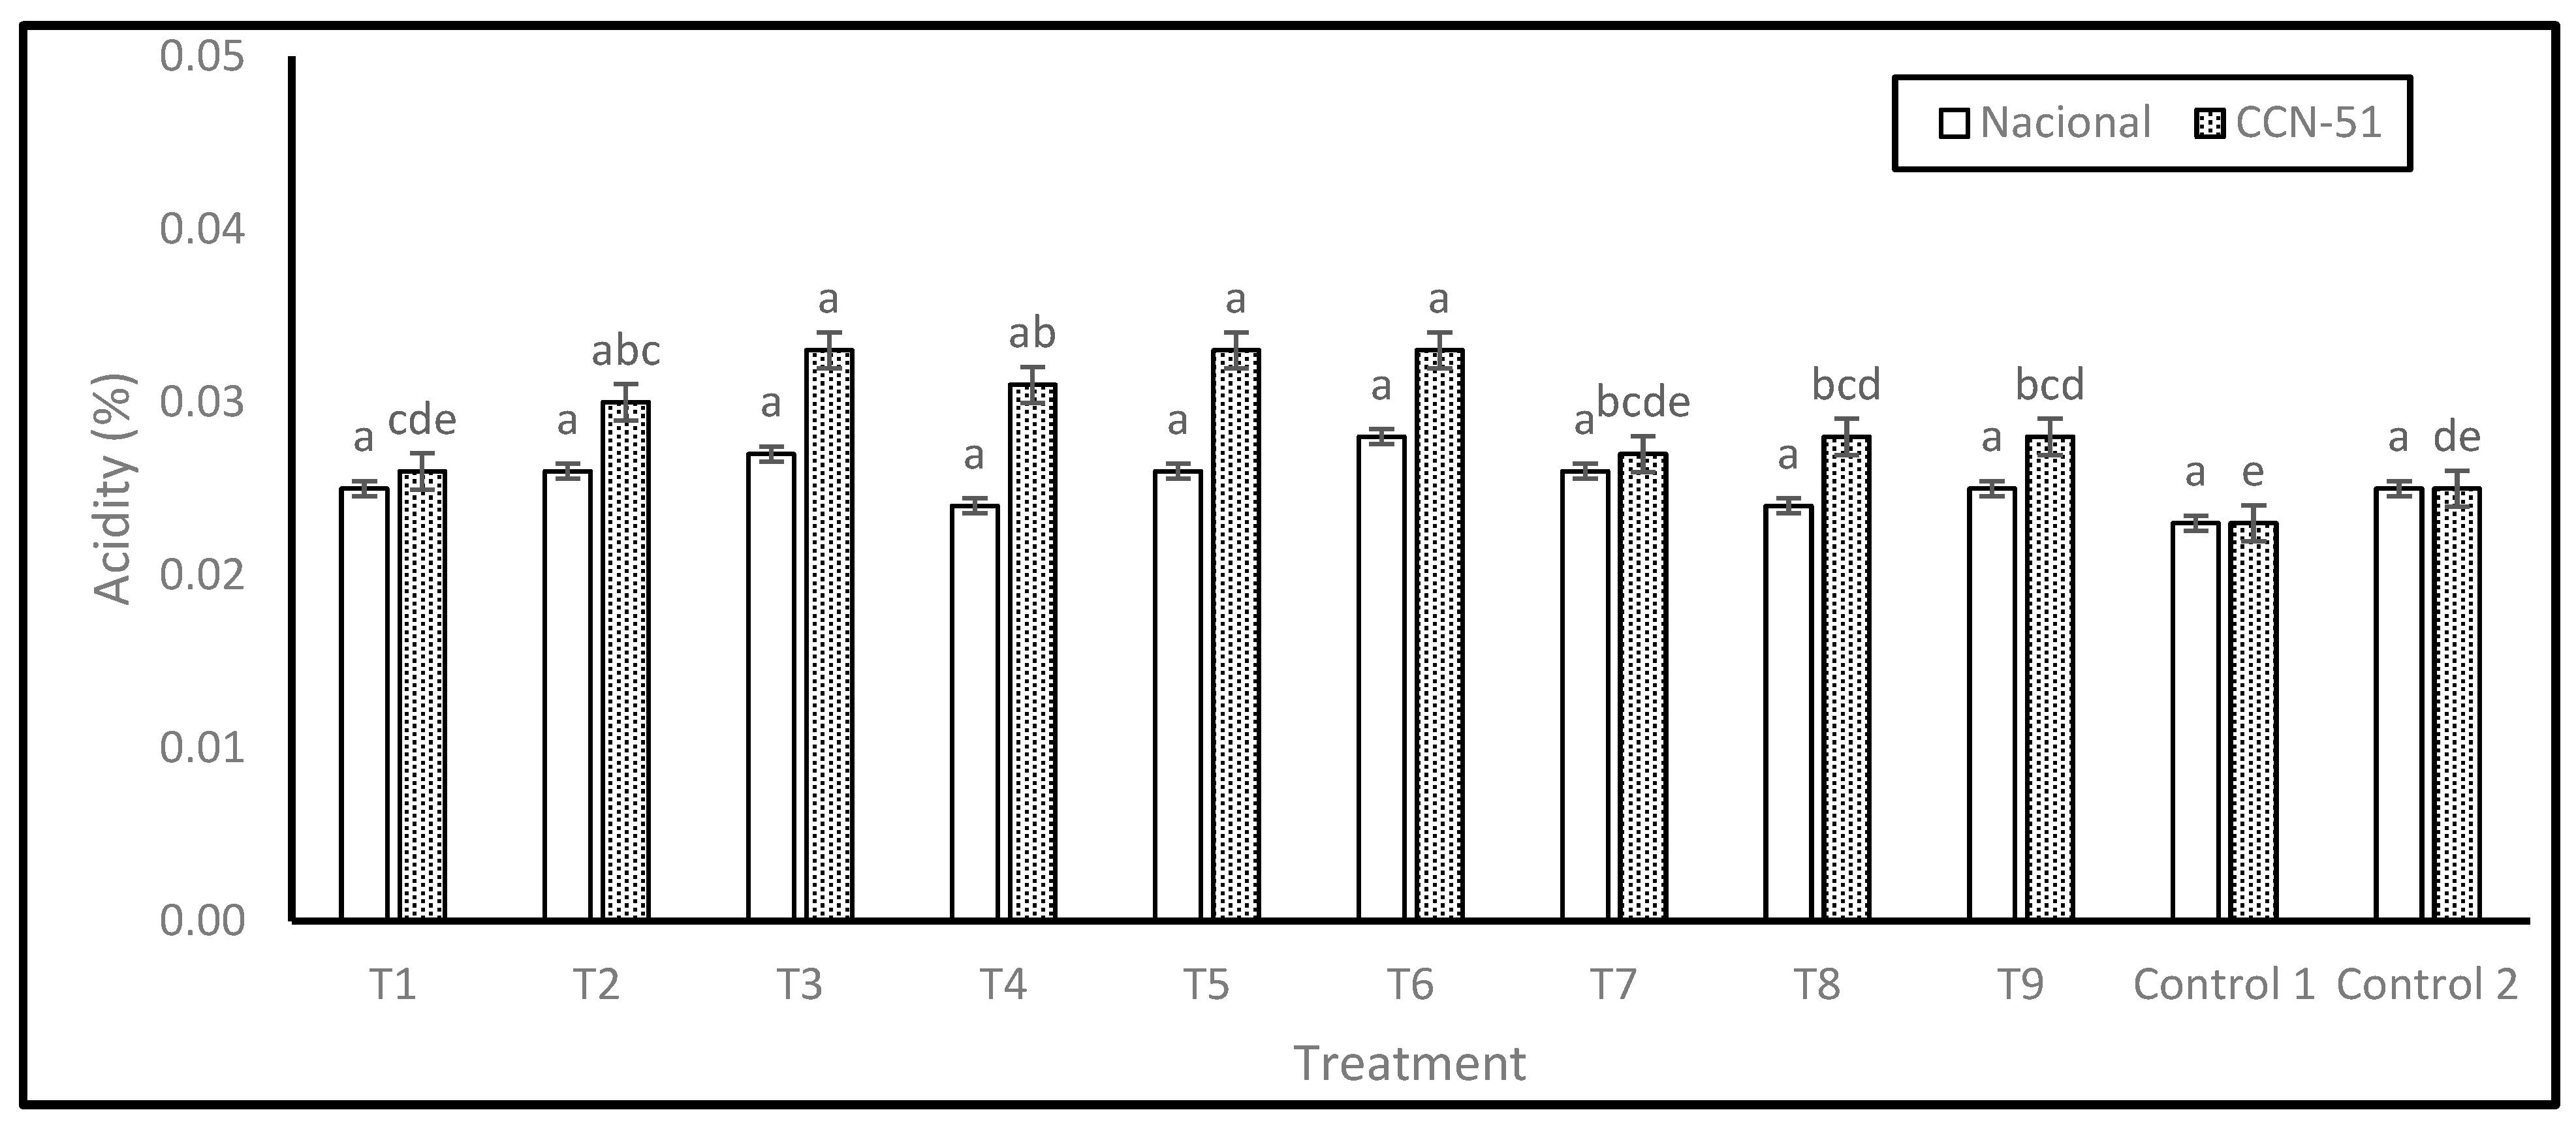
The acidity results, expressed as a percentage of acetic acid, are shown in
Figure 2. For the Nacional genotype, no significant differences were found between the treatments; however, treatment T6 showed the highest acidity percentage (0.03), followed by T3 (0.03), and the lowest acidity value was observed in Control 1 (0.02).
The absence of significant differences suggests that, despite the differences in treatments, the percentage of acidity in the Nacional variety remains relatively stable. This homogeneous response indicates that Nacional variety exhibits a reduced propensity for organic acid accumulation during fermentation, irrespective of factors such as PTE dosage, degree of washing, pre-drying time, or type of drying.
In the case of the CCN-51 genotype, significant differences were identified, with five levels of significance. Treatments T3, T5, and T6 exhibited the highest percentages of acidity (0.03). The treatment regimen encompassed a combination of complete or incomplete washing, pre-drying, resting periods, and drying on various surfaces, as shown in the Experimental Design section. Conversely, treatment T1 (0.03) exhibited the lowest acidity percentage.
2.2.2. Cadmium Concentration
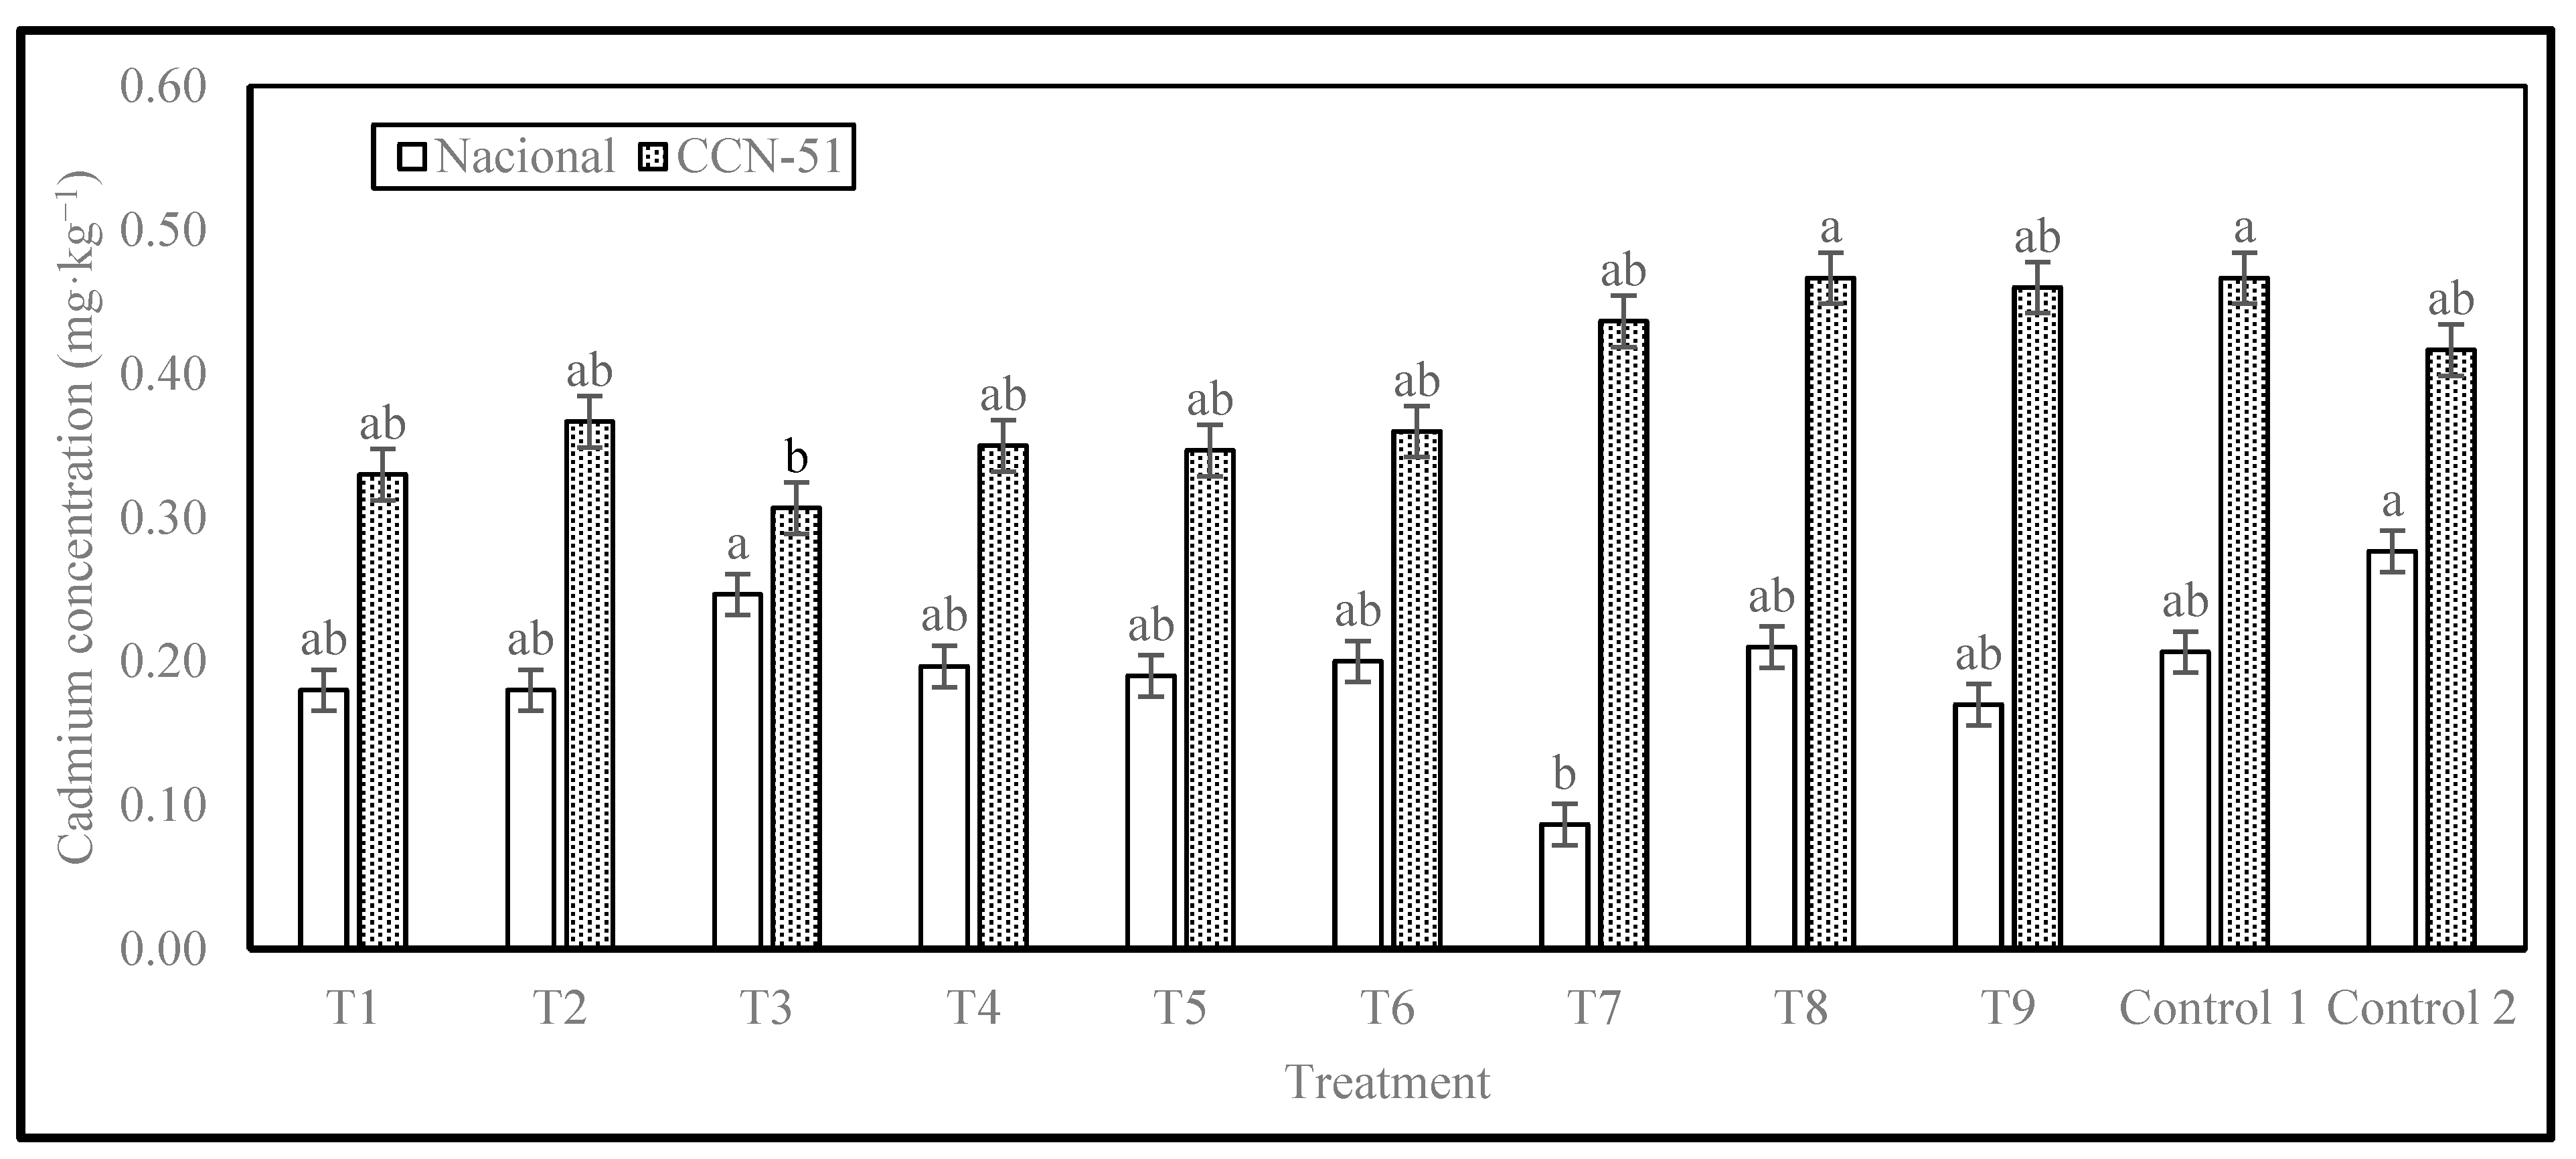
The results of Cd concentration are presented in
Figure 3. The Nacional cocoa genotype showed significant differences, with 2 levels of significance. The highest Cd concentration of 0.28 mg·kg
−1 was observed in Control 2, which consisted of cocoa beans from local producers without enzyme. The lowest concentration was in T7, with an enzyme dose of 0.30 mL·kg
−1 of cocoa in slime, without washing, with a resting period of 48 h before pre-drying and drying in tents, with a cadmium content of 0.09 mg·kg
−1, representing a 69% reduction compared to the highest value observed (Control 2).
The CCN-51 genotype also showed significant differences, with 2 levels of significance. T3 treatment had the lowest value, 0.31 mg·kg−1, corresponding to the treatment with an enzyme dose of 0.10 mL·kg−1 of cocoa in slime, with complete washing, rest in pre-drying for 48 h, and drying on a splint. This result also indicates a reduction of 26.37% in relation to Control 2 (Local producer control, without enzyme). The highest value for CCN-51 was 0.47 mg·kg−1 of Cd, obtained for Control 1 (mechanical removal of mucilage before fermentation and drying) and T8 samples (enzyme dose 0.30 mL·kg−1 of cocoa in slime, with incomplete washing, without rest in pre-drying, drying on a splint), which represents an increase of 12% in relation to Control 2 (0.42 mg·kg−1).
The cadmium concentrations in cocoa beans obtained in this study are lower than those previously obtained by Morales-Rodríguez et al. (2022) in the province of Esmeraldas, which found Cd concentrations ranging from 0.53 to 2.48 mg·kg
−1 for the Nacional genotype and from 0.40 to 2.72 mg·kg
−1 for the CCN-51 genotype [
17]. Similarly, the results in this research are lower than those reported by Lanza et al. (2016) for cocoa from Venezuela, where Cd concentrations ranging from 0.95 to 2.09 mg·kg
−1 were recorded [
23,
24,
25]. Furthermore, it was shown that none of the treatments exceeded the permitted limits for chocolate products set by the European Union (0.8 mg·kg
−1), which was used as a basis by some cocoa bean buyers [
15]. This can be attributed to a number of factors, both abiotic and biotic, that have a direct impact on soil, plantation, and fruit quality.
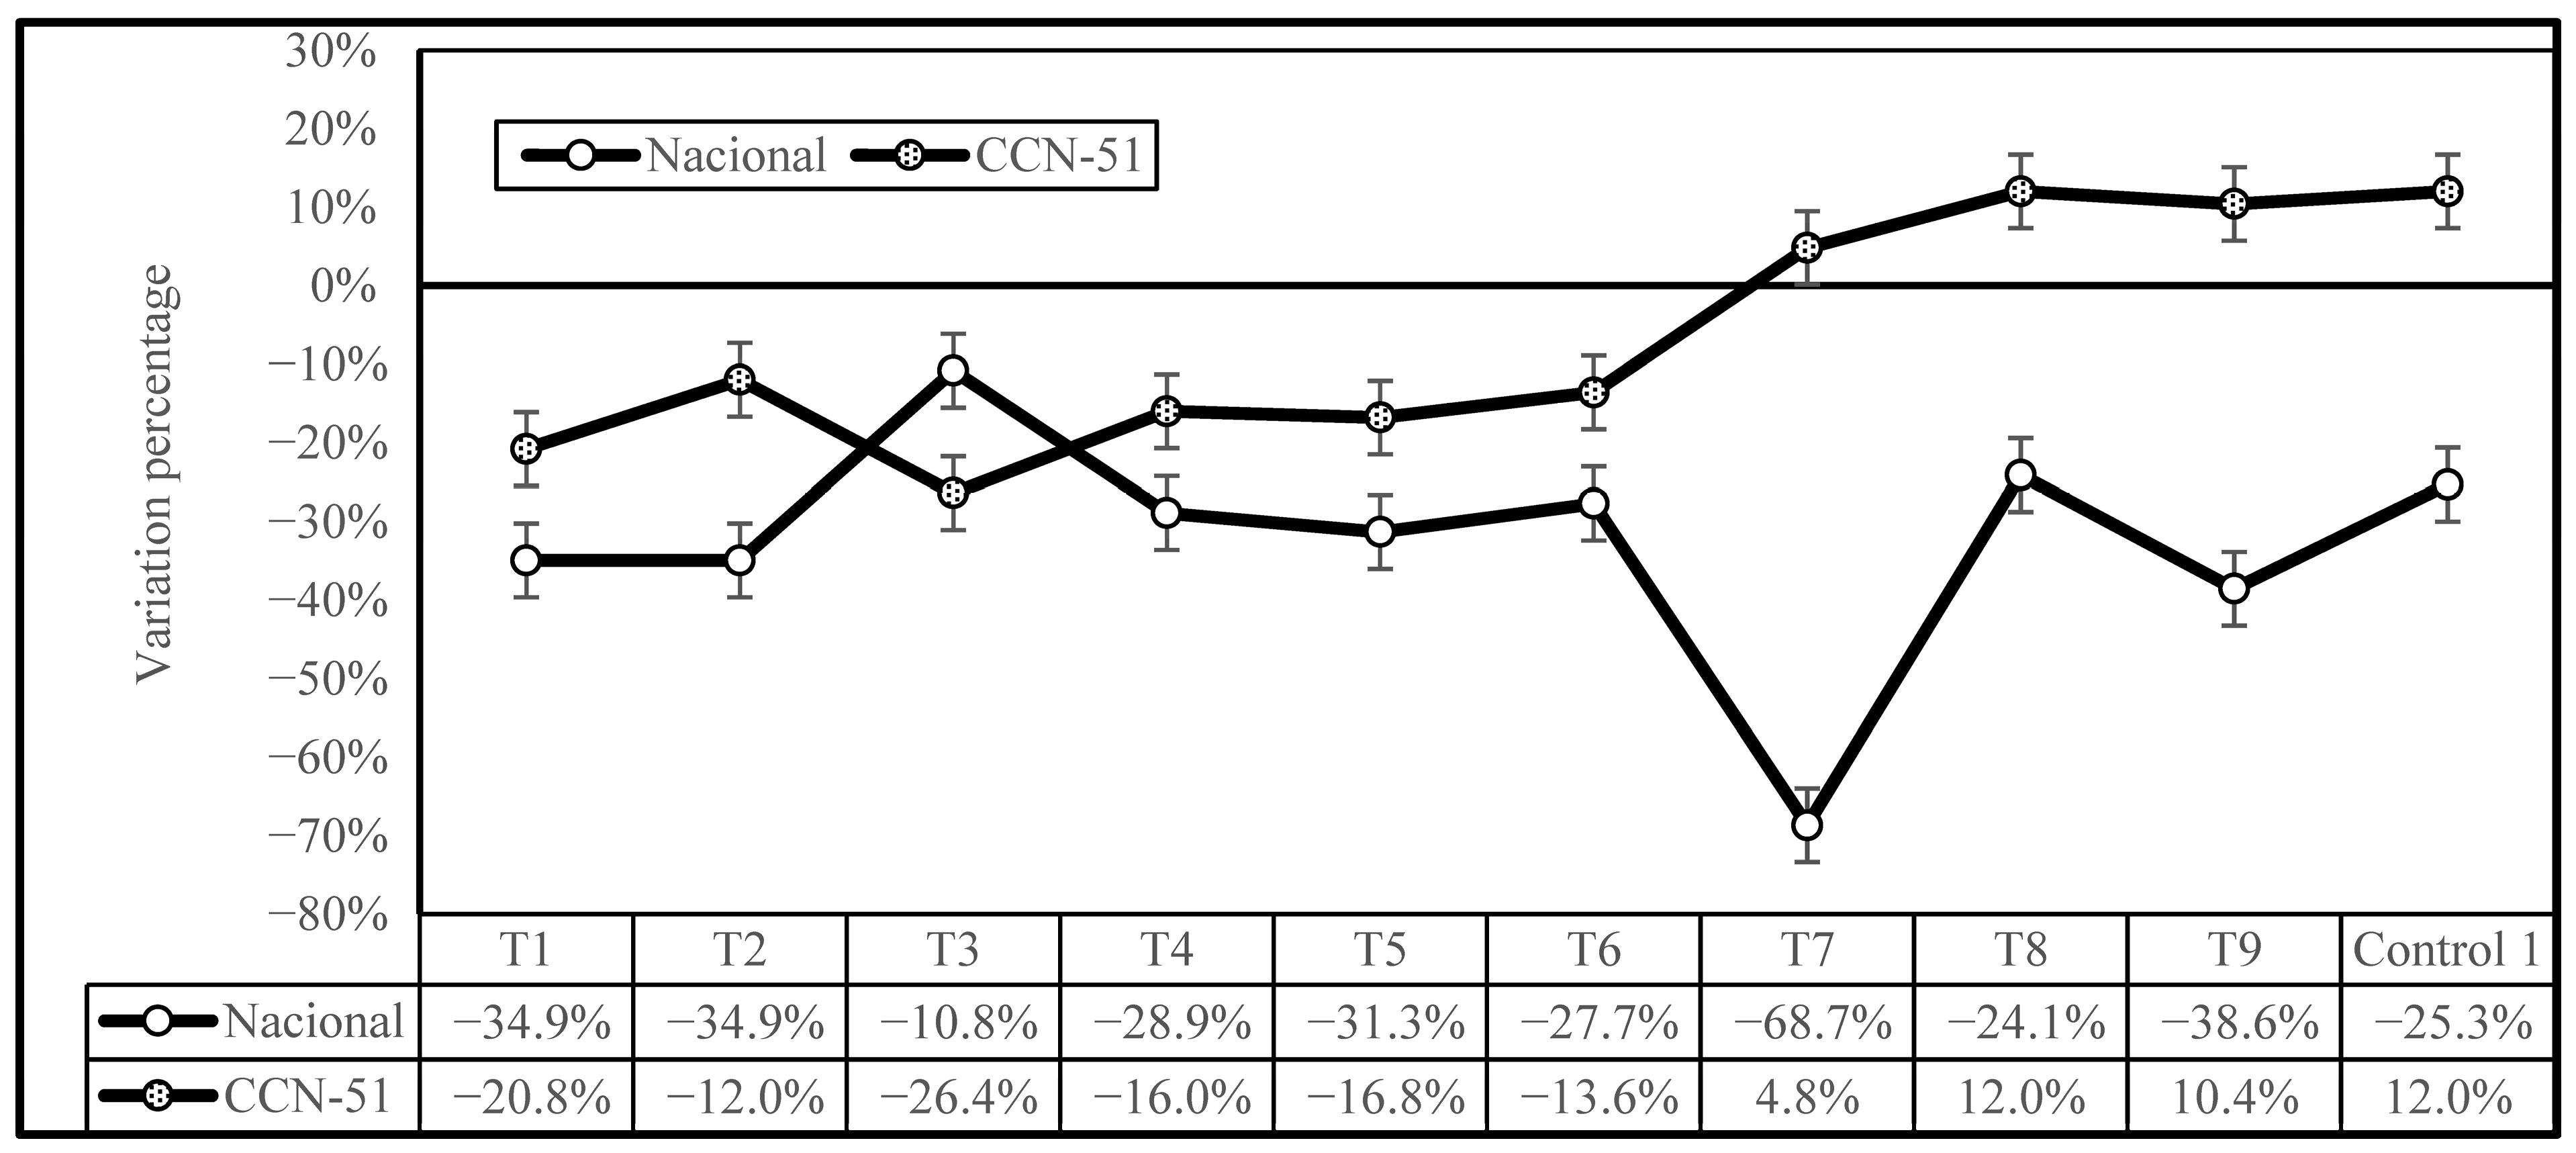
Figure 4 illustrates the variations in the percentage of Cd reduction due to the different treatments under investigation in comparison to Control 2, showing the effectiveness of the treatments for both genotypes. The most noteworthy outcome is that the treatments were more effective at reducing Cd concentration in the Nacional cocoa genotype than the CCN-51 genotype, with the exception of T3. The T7 treatment was demonstrated to have the highest efficacy for the Nacional genotype samples, followed by T9, T1, and T2, with a mean reduction of 6.6% for the CCN-51 genotype and 32.5% for the Nacional genotype. The effect was different for CCN-51, with samples T7, T8, T9, and Control 1 having an increase in Cd levels, ranging from 4.8% (T7) to 12.0% (T8) compared to Control 2. Therefore, it can be concluded that a higher enzyme concentration is not effective in reducing cadmium levels in CCN-51cocoa beans.
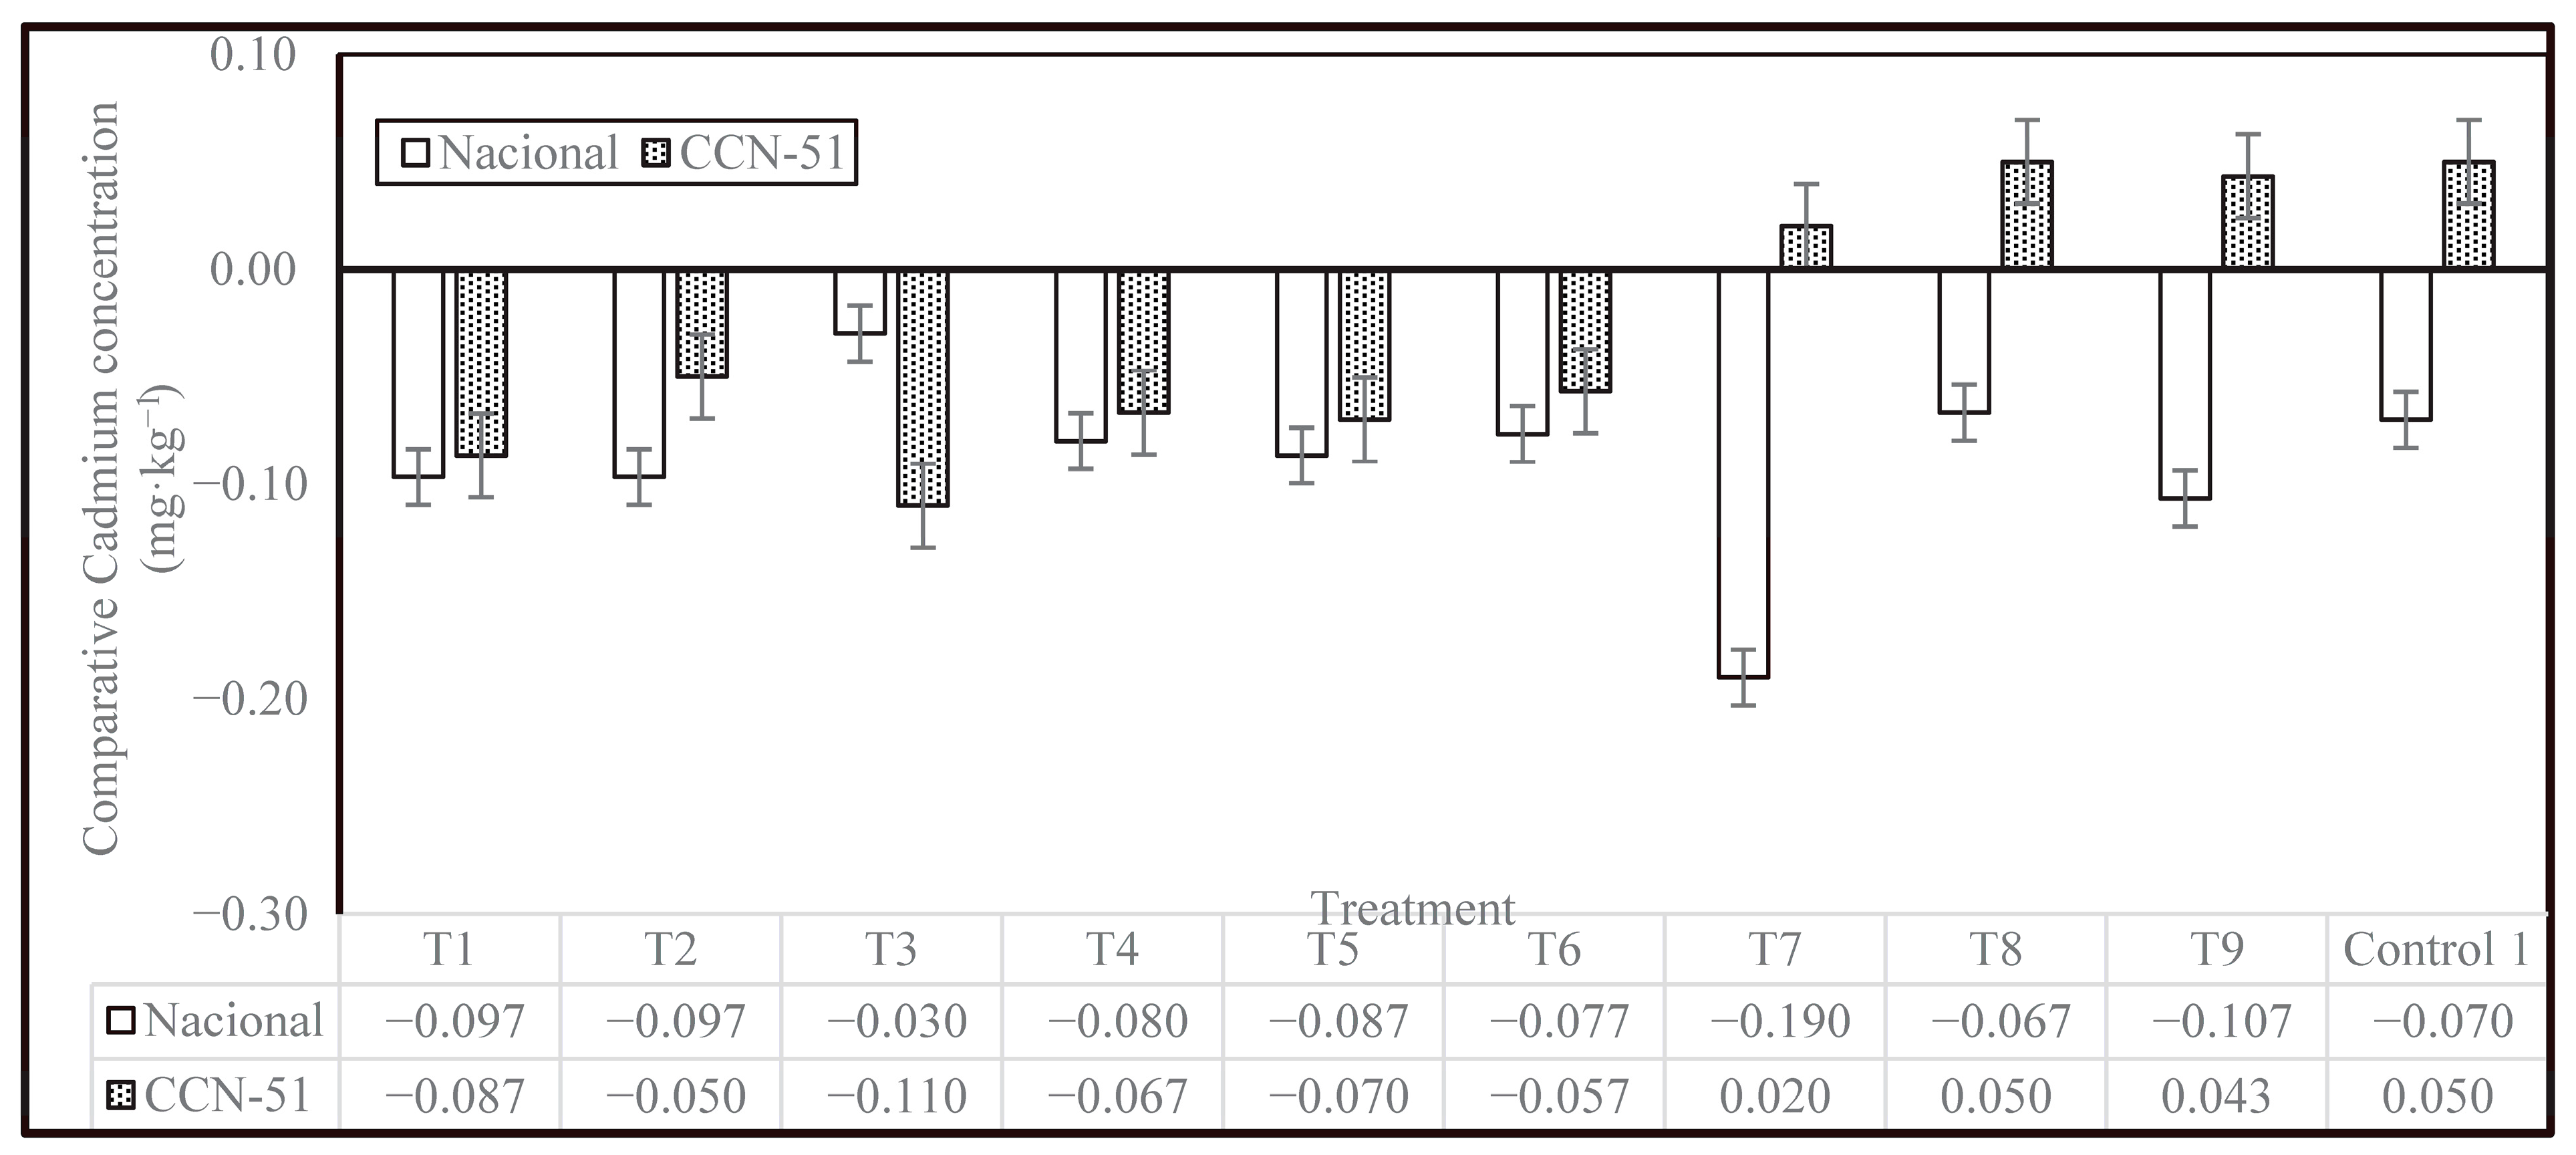
Figure 5 shows a comparison of cadmium concentrations in the two cocoa genotypes, Nacional and CCN-51, across different treatments with respect to Control 2. It is observed that, in general, there is a reduction in cadmium levels compared to Control 2, as evidenced by the negative values in most of the treatments; however, the magnitude of the reduction varies depending on the treatment applied and the type of cocoa. The PTE enzyme showed an ability to reduce Cd concentration in cocoa beans, especially at concentrations of 0.1 and 0.2 mL·kg
−1. The Nacional genotype showed greater reductions in cadmium content than the CCN-51 genotype, with the decrease being more pronounced for the T7 treatment. In contrast, CCN-51 showed a different behavior pattern. In treatments T7, T8, T9, and Control 1, the values were positive, indicating an increase in cadmium concentration with respect to Control 2.
The findings of this study, in conjunction with the results of other research, demonstrate that postharvest practices that are effective in reducing cadmium levels in Nacional may not be equally effective for CCN-51, and there is a possibility that they may even be counterproductive.
2.3. Sensory Quality Assessment
The results of the sensory test are presented in
Table 2. Significant differences were found in the flavor variables Astringent, Bitter, Cocoa, Floral, and Nutty, as well as the light/dark brown visual appearance of the cocoa beans of the Nacional genotype. For astringency, T8 and Control 2 had high values (8.67 and 7.67, respectively), while the remaining treatments had a value of 0. For bitterness, T5 had the highest value (10), followed by T2 and T6 (8.67) and T3, T4, and T9 (7.67). Control 2 and T8 had the lowest bitterness value (0), as they were the samples with the highest astringency. For Cocoa flavor, T5 (9.33) and T3 (8.67) had the highest values, while four treatments (T2, T7, T8, and Control 1) had a value of 0. Fruity, Floral, and Nutty flavors were absent in almost all treatments except T2 (Floral) and T8, T7, and Control 1 (Nutty). In addition, none of the treatments had an acidic flavor, which is considered undesirable in cocoa. In terms of appearance, the light color predominated in Control 1 and T6, while the dark color predominated in the remaining treatments, with T1 and T9 having the highest value (9.33).
For cocoa beans of the CCN-51 genotype, significant differences were found in the variables analyzed, with the exception of acidity. For Astringent flavor, only Control 2 showed a significantly high value (5.67), while each of the remaining treatments had a value of 0. For the Bitter variable, significantly higher values were obtained for T2 (9.00) and T3 (8.67), while Control 2 had a score of 0. None of the treatments had an acidic flavor, similar to the Nacional beans. In terms of Cocoa flavor, treatments T3 and T4 had the highest value (9.00), while Control 2, T7, and T8 had a value of 0. In terms of Fruity, Floral, and Nutty flavors, Control 2 had a significant value for Fruity flavor (6.17), unlike Nacional beans, where none of the treatments showed fruity flavors. T5 had a high Floral flavor value (8.00), while T7 and T8 treatments had a significant Nutty flavor (6.33 and 5.33). Regarding visual appearance, T4 and T1 had the highest values for light color, while T3 (9.67) had the highest value for dark color. Control 2 had low values for both visual assessment parameters.
The development of aromas and flavors depends both on fermentation and other factors, such as roasting, which enhances the sensory characteristics of the cocoa. The taste of Nacional cocoa is very specific and distinct from other cocoa genotypes; it is described as floral and strong, with hints of astringency or a leguminous character. For cocoa to be classified as first quality, it must develop its characteristic aroma and flavor. These qualities only develop when the beans, properly fermented and dried, are properly roasted [
26].
2.4. Pearson’s Correlation
The bivariate correlations between the variables analyzed in this research were studied for Nacional cocoa (
Table 3). A moderate positive correlation was observed between pH and Medium Fermentation (0.497), indicating that higher pH levels tend to be associated with medium fermentation levels. Conversely, the Mold Presence exhibited a significant negative correlation with pH (−0.346), suggesting that a lower pH could favor mold growth, possibly due to inadequate fermentation conditions or higher humidity.
The findings demonstrated a moderate correlation between Acidity and Over-Fermentation (0.420), indicating that excessive fermentation may result in acid accumulation in the beans. This phenomenon can be attributed to excessive degradation of sugars and other fermentable compounds, resulting in the generation of undesirable secondary acids. A noteworthy observation was the positive correlation between Acidity and the variables Slate (0.375) and Insect Damage (0.498). This finding suggests that cocoa beans with higher acidity levels may be more susceptible to structural defects, potentially resulting from improper fermentation or drying conditions. In terms of color, the more acidic beans tended to be less light brown (−0.345), suggesting a possible relationship between acidity and bean darkening during the fermentation and drying processes. The strong correlation between Acidity and cadmium concentration (0.523) is noteworthy. This finding suggests that more acidic environments may favor the absorption or accumulation of cadmium in beans, which is a significant risk factor in cocoa production, given that cadmium is a heavy metal regulated in many international markets. This phenomenon can be attributed to the influence of Cd on the metabolic processes of microorganisms during fermentation, resulting in increased acid production [
27].
The correlation between Good Fermentation and Over Fermentation was strongly positive and significant (0.605), suggesting that the search for optimal fermentation may lead to a risk of over-fermenting grains. There was also a positive correlation between cadmium content and Good Fermentation (0.357), indicating that certain fermentation processes favor the accumulation of this heavy metal in cocoa beans. This is a matter of concern, given that cadmium is a regulated contaminant in the cocoa industry.
An important finding was the strong correlation between Low Fermentation and Insect Damage (0.639), suggesting that grains with insufficient fermentation are more susceptible to insect damage. This may be due to a softer internal structure or less development of antimicrobial compounds during fermentation.
A significant correlation was found between Over Fermentation and Slate grains (0.386), which indicates that excess fermentation may be associated with the appearance of physical defects, such as slate, which affects grain structure. In addition, a strong positive correlation was found with cadmium content (0.574), suggesting that grains may accumulate more cadmium during the overfermentation process. This finding reinforces concerns about the health risks associated with overfermentation, especially with regard to food safety.
Mold Presence had a significant negative correlation with the Dark Brown attribute (−0.493), which suggests that the presence of mold negatively affects cocoa coloration, making it less visually appealing.
A strong correlation was found between Slate beans and Insect Damage (0.581), confirming that beans with structural defects such as slate are more susceptible to insect attack, probably due to their lower physical strength or reduced moisture retention, which may make them more vulnerable.
Bivariate correlations between the variables were obtained for cocoa beans of genotype CCN-51 (
Table 4). The pH level was correlated with some fermentation variables and cocoa color, including a positive association with Medium Fermentation (0.444) and a negative association with Good Fermentation (−0.406). This finding suggests that higher pH levels may be indicative of less optimal fermentation conditions. In addition, pH has a strong influence on cocoa color, with a negative correlation with Light Brown color (−0.493) and a positive correlation with Dark Brown color (0.739), which may be due to oxidation reactions.
Acidity exhibited a positive correlation with Medium Fermentation (0.443), indicating its continued perceptibility at intermediate fermentation levels. Furthermore, a positive association was observed between Acidity and Light Brown (0.819) and Dark Brown (0.536) color notes. Additionally, a negative correlation was identified between Acidity and cadmium content (−0.487), suggesting that more acidic beans may contain lower concentrations of this heavy metal.
A strong negative correlation was observed between Good Fermentation and Medium (−0.651) and Low (−0.486) Fermentation, indicating that as optimal fermentation is achieved, the proportion of beans with insufficient fermentation decreases significantly. In addition, a negative correlation was observed between Good Fermentation and Mold Presence (−0.402), suggesting that adequate fermentation helps to reduce the proliferation of fungi in the grains. A particularly notable finding was the strong positive correlation between Good Fermentation and Light Brown color (0.766), while the relationship with Dark Brown color was negative (−0.480). This finding indicates that grains undergoing effective fermentation tend to exhibit a lighter coloration, likely attributable to the degradation of polyphenols and the reduction of compounds responsible for the browning process.
There was also a strong negative correlation between Medium Fermentation and Light Brown color (−0.759), whereas the correlation with Dark Brown color was positive (0.574); this suggests that grains with medium fermentation tend to have a darker shade, possibly due to the retention of phenolic compounds and partial oxidation.
A significant negative correlation between Low Fermentation and Light Brown color (−0.542) suggests that lower fermentation levels lead to a reduced presence of light brown tones in the beans. This aligns with the understanding that well-fermented beans exhibit more pronounced brown hues, while under-fermented beans retain a more purplish or unprocessed appearance.
A strong positive correlation was found between Over Fermentation and Insect Damage (0.601), indicating that over-fermented beans are more likely to be damaged by pests, possibly due to their greater structural deterioration. A negative correlation was observed between Over Fermentation and Dark Brown color (−0.374), indicating that over-fermentation may reduce the intensity of the dark shade characteristic of well-fermented cocoa.
Mold Presence showed a strong negative correlation with Light Brown color (−0.686), indicating that beans with mold tend to lose clarity in hue; in contrast, a positive correlation was found with Dark Brown color (0.403), suggesting that affected beans may have a darker shade, possibly due to degradation of their internal structure. The analysis revealed a significant positive correlation between Insect Damage and Light Brown color (0.542), suggesting that beans affected by insects tended to have a lighter appearance.
Finally, there was a significant positive correlation between Light Brown color and Cadmium level (0.501). This suggests that an increase in cadmium levels in cocoa is associated with a greater presence of light brown tones. This relationship may indicate that cadmium affects the color of cocoa during the drying or fermentation processes, thereby influencing its visual appearance.
2.5. Principal Component Analysis
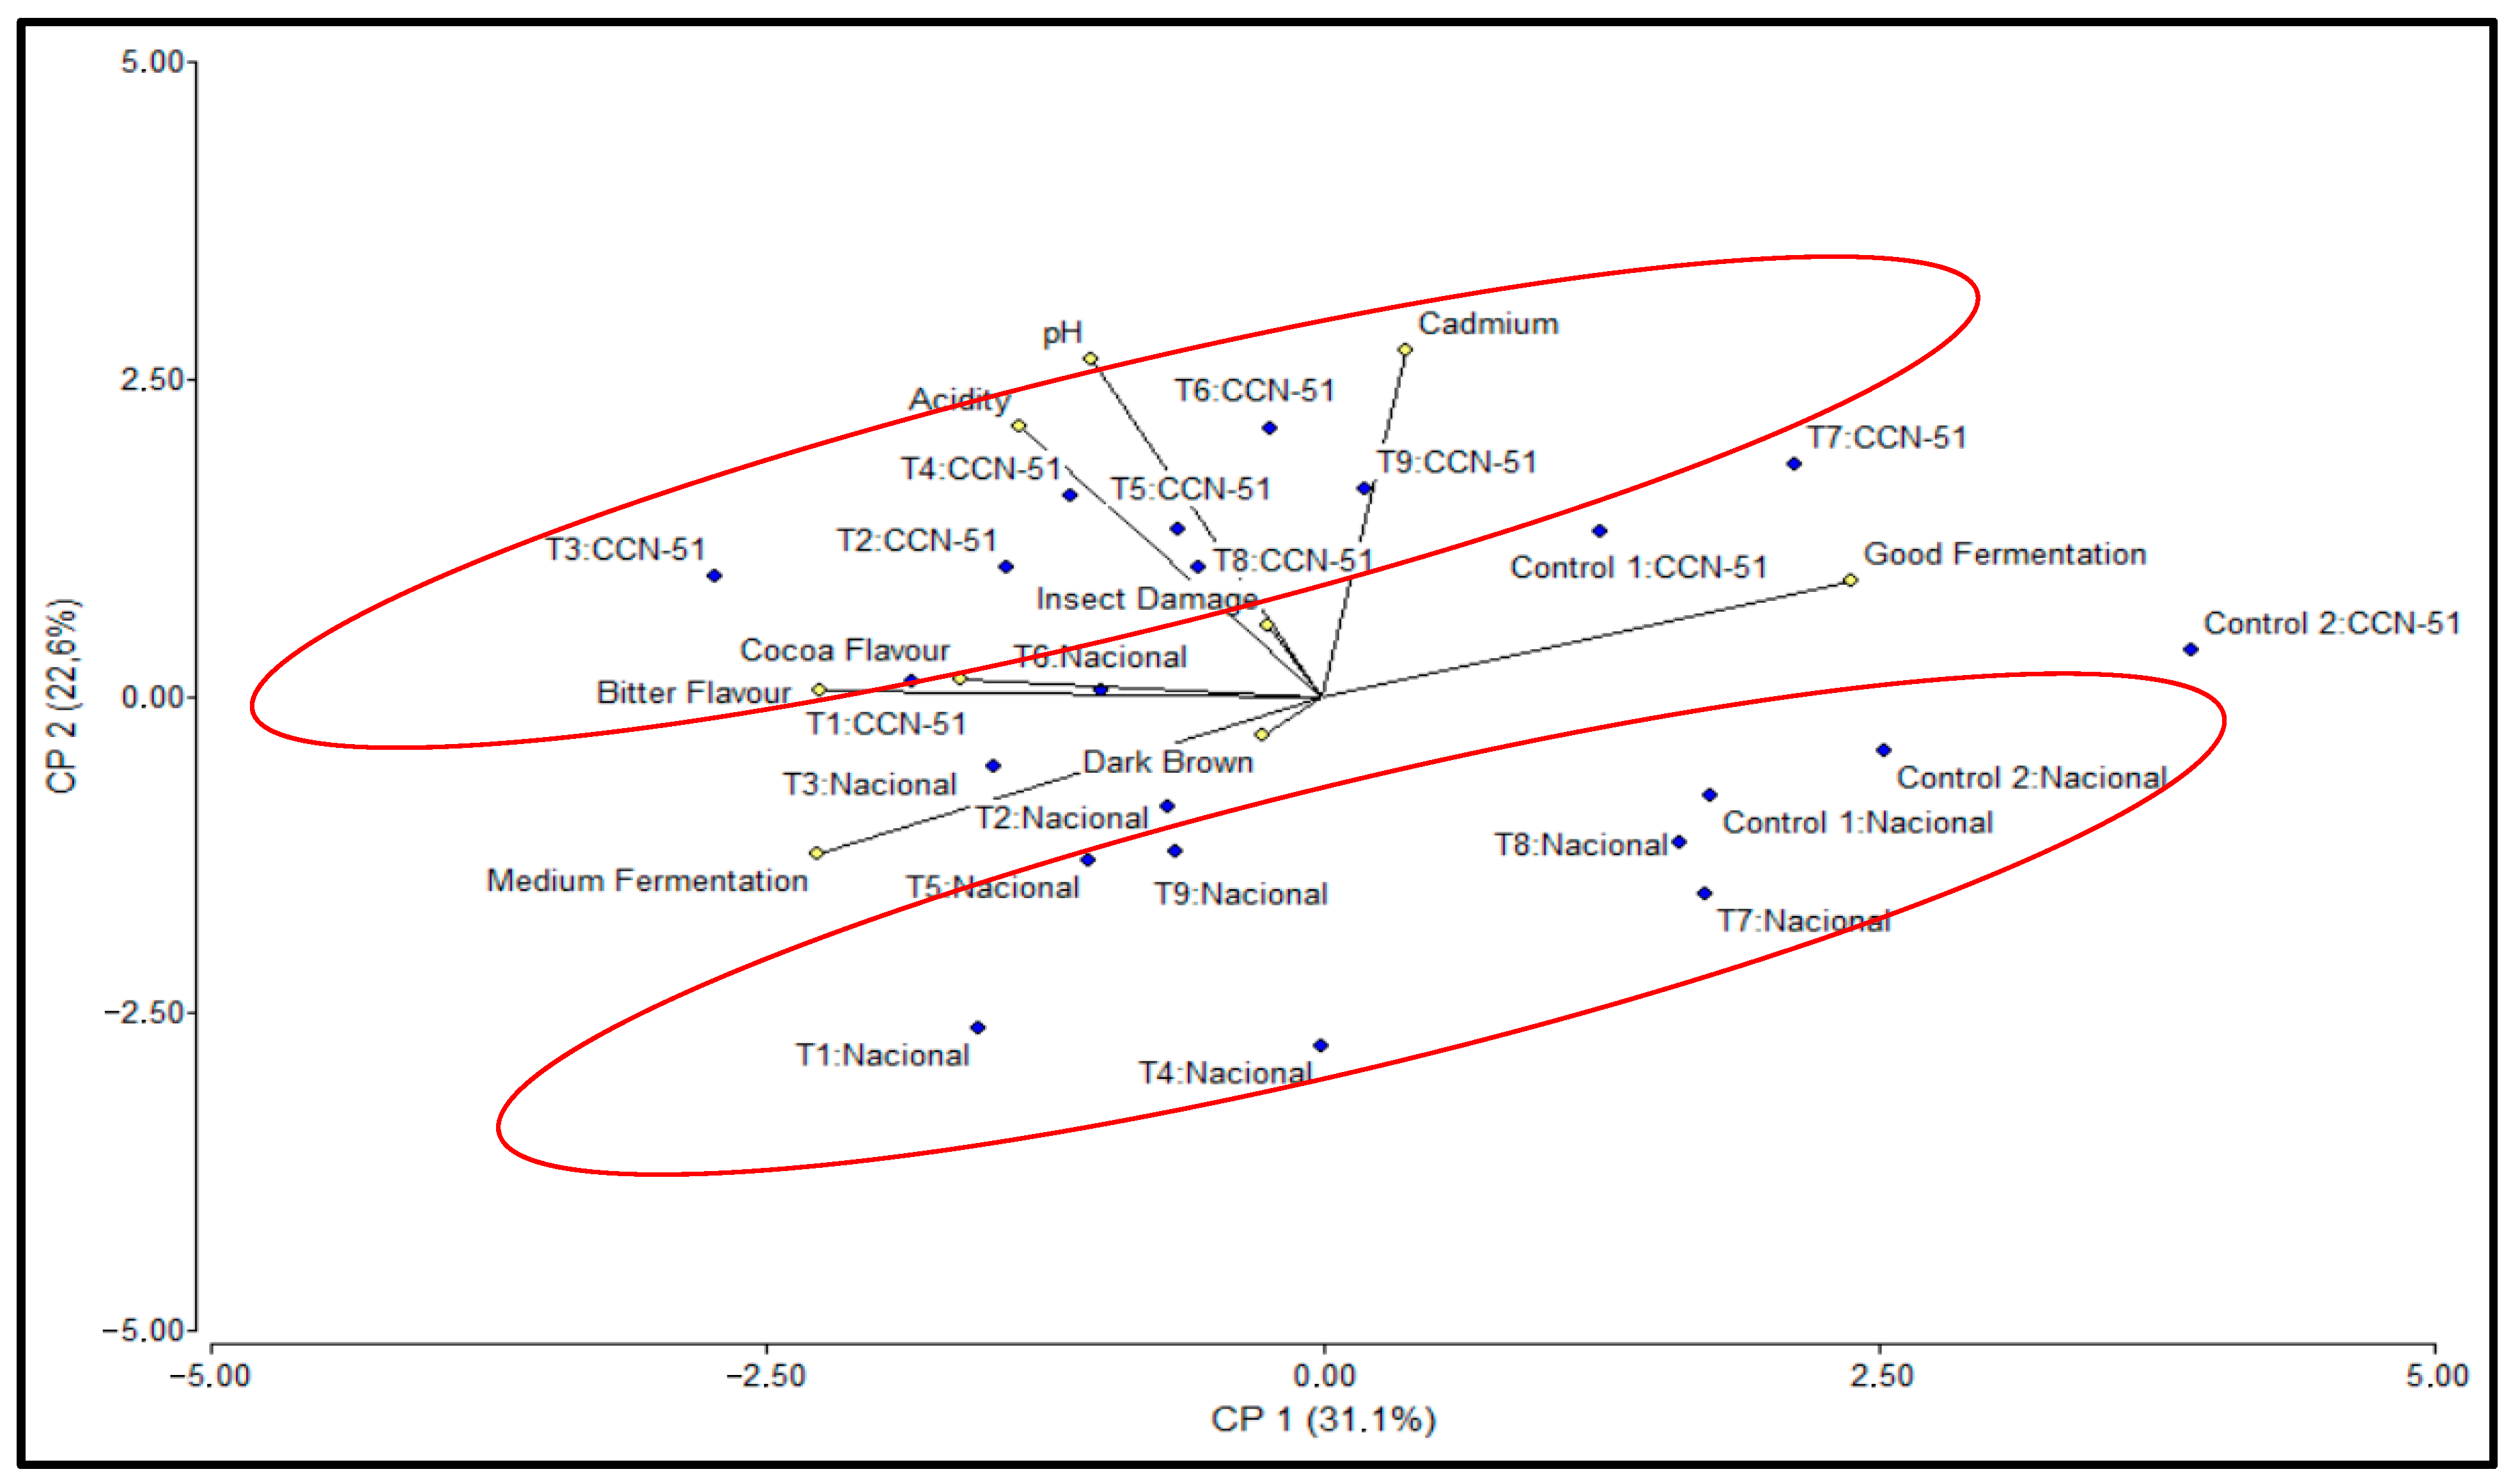
To explain the correlations in the results and provide a better understanding of the question, principal component analysis (PCA) was performed, taking into account the two genotypes, Nacional and CCN-51, and considering the variables pH, Acidity, Good Fermentation, Medium Fermentation, Insect Damage, Bitter and Cocoa flavors, Dark Brown, and Cadmium (
Table 5).
The PCA revealed that the first two principal components explained 53.70% of the total variability: Principal Component 1 (PC1) explained 31.10% of the variability, while Principal Component 2 (PC2) explained 22.60% of the variability. PC1 stands out for the expression of the variables Good Fermentation (0.51), which has the highest absolute loading in PC1, followed by Medium Fermentation (−0.49) and Bitter (−0.48), with negative loadings. On the other hand, in PC2, the most important variables were Cadmium (0.58), pH (0.57), and Acidity (0.46), which had the highest absolute loadings.
PC1 has, in its positive component, the variable Good fermentation, and in the negative component, Medium fermentation and Bitter flavor, thus defining a quality axis for the fermentation process. The samples with the highest positive values were Control 1, Control 2, T7, and T8 for the Nacional genotype, and Control 1, Control 2, and T7 for the CCN-51 genotype. On the negative side of the PC1 axis are T3 for CCN-51 and T1 for Nacional with the lowest values.
The CCN-51 samples had positive PC2 values (higher than 0), with higher positions than those of the Nacional genotype in the plane defined by PC1 and PC2, as they have higher Cd contents than the corresponding Nacional cocoa treatments (
Figure 6).

