Article

The Effect of Far-Red Light on the Growth of Tobacco Leaves

1
College Agronomy, Hunan Agricultural University, Changsha 410128, China
2
Chemical Materials for Agricultural Cross Disciplinary Joint Laboratory, Hunan Agricultural University, Changsha 410128, China
3
Hunan Provincial Engineering Technology Research Center for Optical Agriculture, Changsha 410128, China
*
Author to whom correspondence should be addressed.
These authors contributed equally to this work.
Plants 2025, 14(16), 2520; https://doi.org/10.3390/plants14162520
Submission received: 5 July 2025 / Revised: 4 August 2025 / Accepted: 11 August 2025 / Published: 13 August 2025
(This article belongs to the Section Plant Response to Abiotic Stress and Climate Change)

Abstract

To investigate how far-red (FR) light affects tobacco leaf growth, we established different light conditions, namely, CK: white (WL), T1: red (R), T2: red–white (R+WL) combination, T3: white–far-red (WL+FR) combination, and T4: white–red–far-red (WL+R+FR) combination; conducted supplemental light experiments on tobacco; and evaluated the growth of tobacco leaves by determining the biomass, size of the leaves, etc. In addition, the auxin (IAA) content and expression of leaf growth-related genes were examined to further reveal the mechanism of the FR regulation of tobacco leaf growth. The results show a maximum reduction in leaf area size of more than 90% and in fresh dry mass of more than 85%, while the chlorophyll content increased by more than 28%. in tobacco leaves exposed to FR compared with those exposed to white light. Meanwhile, levels of auxin IAA were increased by 113% (T3) and 17% (T4) under far-red light treatment. The anatomical structure of the tobacco leaves showed that FR reduced the number of epidermal cells in the leaves but increased the cell size. Subsequent findings revealed that FR’s impact on leaf growth was mediated through the PHYB–PIF7–IAA signaling pathway, wherein it regulated cell division and growth-related genes. This substantiates that FR diminishes the tobacco leaf area by impeding cell division rather than inhibiting cell growth. In this study, we explored the effects of far-red (FR) light on tobacco leaf growth changes and constructed a model of the related signaling pathways. Our results reveal a novel mechanism by which far-red light regulates the growth of tobacco leaves, elucidating how far-red light affects their growth and response to shading conditions. This finding not only provides a scientific basis for the optimization of high-density tobacco planting but also helps to improve photosynthetic efficiency and yield, providing strong support for the sustainable development of tobacco farming.

1. Introduction

Tobacco (Nicotiana attenuata) is an economic crop primarily harvested for its leaves. The growth and development of tobacco leaves directly affect the yield and quality of the tobacco. In the process of cultivation, improving plant resistance and planting density is a key step in improving tobacco yield. Intensively planted tobacco populations experience reduced air circulation and light transmission, resulting in shade avoidance syndrome (SAS) in the form of reduced leaf area, longer petioles, reduced tolerance, increased amounts of phytovolatiles, and reduced resistance to decline, which, in turn, affects the tobacco yield and quality [1,2,3,4]. The conditions that elicit a shading response are primarily caused by two signaling factors: an increased proportion of FR, and decreased light intensity [5,6]. Leaves serve as the largest site of life activity in a plant body in terms of the proportion of the area exposed to air. The effect of an increase in the proportion of FR on the leaf morphology and structure is strongly correlated with the plant’s ability to photosynthesize [7,8].
Extensive research has shown that increasing FR increases the net photosynthetic rate of plant leaves while decreasing the leaf thickness [7,9,10,11,12]. Studies have shown that with additional FR, rice can achieve greater biomass and tillers because the inclusion of FR enhances the light-absorbing capacity of photosystem I, while shorter wavelengths of light are taken up in photosystem II (e.g., blue light). This is also known as the Emerson effect [8,13,14]. In environments with a low red-to-far-red light ratio (R/FR), plants have the ability to decrease the amount of palisade cell tissue and, consequently, their overall leaf thickness. This can be achieved by reducing the size of chloroplasts and the number of cells within the leaf [15,16,17]. The introduction of far-red light boosts the leaf length and reduces the leaf width in Arabidopsis thaliana and Glycine max, resulting in plant leaves with an elongated shape compared with the control [18,19]. It was found that shade reduced the number of leaves, total leaf area, and individual leaf area in Arabidopsis and that the total leaf area also depended on the amount of time that the leaf received shade cues during its development. At later stages of development, shade only regulates cell expansion, whereas at earlier stages of development, the inhibitory effect of phytochromes suppresses cell division [20]. Some researchers have posited that, under conditions of low photosynthetically active radiation, cell expansion becomes a more critical factor in leaf growth than cell division. In contrast, other studies indicate that it is the quantity of cells rather than their size that leads to decreased leaf size in plants exposed to low R/FR levels compared with high R/FR levels [7]. It is not known whether the leaf area is ultimately determined by cell division or cell expansion. Recent advances in molecular research have identified many genes that participate in leaf growth and development. These findings offer a rationale for studying the effects of shade on leaf growth.
Recent advances in molecular research have identified many genes that play a role in leaf growth and development. For example, OsARF2 (auxin response factor 2), an uORF-free inhibitory ARF, may synergize with other ARFs to regulate leaf development by balancing auxin signaling [21]. EBP1 (ErbB3-binding protein 1), an auxin-regulated ribonucleoprotein, orchestrates cell proliferation and expansion by integrating ribosomal biosynthesis with cell cycle progression in a dose-dependent manner, ultimately determining the plant organ size [22]. ANT (AINTEGUMENTA) genes are regulated by outer bead pericycle cell proliferation and auxin synthesis, which directly affect the development and size of plant organs and other organs [23]. The CYCD3 (CYCLIN D3) gene, which encodes a D-type cyclin involved in the plant cell cycle, is pivotal in the development of shoot lateral organs. It orchestrates cell proliferation, impacts cell number determination, and modulates endoreduplication and cell size. By integrating these critical developmental processes, CYCD3 profoundly shapes organ growth patterns. In the context of leaf development, CYCD3 operates downstream of ARGOS (Auxin-Regulated Gene involved in Organ Size) and ANT and is positioned downstream of AMP1 and cytokinins within the shoot apical meristem (SAM). This strategic placement underscores the gene family’s essential role in harmonizing cell proliferation with overall development, particularly in the context of hormonal signaling pathways [24]. These findings provide a theoretical basis for the study of the effects of shade on leaf growth. PHYB (photosensitive pigment B) is a red and far-red light receptor that regulates plant growth and development by sensing light changes. In shaded environments, a lower R/FR ratio results in a shift to an inactive state of PHYB. As the number of inactive forms of PHYB increases, its overall activity decreases, which, in turn, suppresses the activity of PIFs (phytochrome-interacting factors). As a result, PIFs act as transcription factors that promote growth-associated gene expressions and facilitate plant growth [25,26]. Studies have shown that AtAN3 (ANGUSTIFOLIA3) is a key factor in promoting leaf cell proliferation through photosensitizing pigments and that AtPIF7 (Phytochrome-interacting factor 7) is a potent inhibitor. FR releases AtPIF7 by inactivating AtPHYB, and AtPIF7 interacts with AtAN3, which ultimately reduces leaf size. Exposure to FR in Arabidopsis activates AtPIF7, which then displaces and substitutes AtAN3 at the targeted promoter site, leading to the inhibition of AtAN3 activity. This interaction results in opposing regulatory effects on a collection of genes, indicating a cis-acting promoter component shared between AtAN3 and AtPIF7. Thus, variation in the outside light environment could be dynamically managed to manipulate the cellular expression of growth-related genes and to adjust plant leaf growth [27]. Upon exposure to far-red light, the PHYB photoreceptor undergoes a conformational change, leading to the activation of transcription factor PIF7. PIF7 plays a crucial role in regulating the expression of genes involved in cell elongation and photosynthesis. Specifically, PIF7 promotes the synthesis and transport of the plant hormone auxin (IAA), which is essential for cell elongation and overall plant growth [28]. It was found that shade could induce the activation of a range of genes related to cell proliferation and expansion in soybean and that this induction was influenced by the leaf developmental stage. Moreover, shade exposure leads to a substantial increase in the levels of auxin and gibberellins, along with a significant decrease in cytokinin content in young, mid-aged, and old leaves, indicating the potential crucial roles of auxin, gibberellin, and cytokinin in this regulatory process [29]. Moreover, it has also been shown that under shade conditions, NtZTL (ZEITLUPE is one of the core circadian rhythm regulatory genes in Nicotiana attenuate) in tobacco directly interacts with NtPHYB to govern the transcript levels of NtPHYB, NtPIF3a, NtPIF7, and NtPIF8. However, the precise mechanism through which NtZTL modulates NtPIF remains unclear. NtZTL affects the expressions of leaf stunting and the shade marker gene ATHB2, which may be related to the regulation of auxin and NaPHYB1-related signaling [30].
In this study, we investigated the effects of FR on tobacco leaf growth by combining physiological, anatomical, and molecular analyses. We hypothesized that FR decreases leaf area by impeding cell proliferation through the PHYB–PIF7–IAA pathway rather than inhibiting cell expansion. Our findings aimed to elucidate the regulatory network underlying shade adaptation in tobacco, providing a theoretical foundation for improving yield in dense planting systems.

2. Materials and Methods

2.1. Plant Material and Treatment

The experimental site was located in the plant growth room of the Optical Agricultural Engineering Research Center, Hunan Agricultural University, Hunan Province, China (27.55° N, 113.92° E), with a temperature of 24 ± 2 °C and humidity of 80 ± 10%. Tobacco seedlings were grown on culture racks with dimensions of L (200 cm) × W (60 cm) × H (220 cm), which were uniformly divided into four layers according to height. The culture racks were fitted with LED lights, which were adjusted in height according to the tobacco seedling growth to maintain uniform and consistent illumination. In addition, each culture rack was equipped with a black shade cloth to isolate the interference of external light.
The Xiangyan No.7 and Yunyan87 varieties were selected for this study (provided by Changsha Tobacco Company); both varieties are widely grown in southern China. The seeds were sown in seedling trays that were 50 cm long, 30 cm wide, and 5 cm high (in which the substrate consisted of vermiculite, peat, and straw fermentation material). These were placed under full-spectrum white light for germination. The LED light quality used is shown in Figure 1 as CK (WL). The light lamp was provided by Changsha Spot Lighting Co. (Changsha, China). When the seedlings reached the seedling emergence stage (approximately 10 days after sowing), they were transplanted into plastic pots containing the same substrate, with a top area of 10 × 10 cm, a bottom area of 5 × 5 cm, and a height of 8 cm, and then subjected to different LED light treatments, which were CK (WL), T1 (R), T2 (WL+R), T3 (WL+FR), and T4 (WL+R+FR); the LED spectra used are shown in Figure 1. Each variety was planted in 12 pots per treatment; the light intensity was maintained at 105 ± 20 μmol m−2s−1, and the light duration was 16 h/day. The R/FR ratio was obtained by calculating the integral areas in the 570–690 nm (red light) and 690–760 nm (far-red light) ranges. The R/FR ratio for each treatment was 12, 24, 8, 0.5, and 1, respectively (Table S1). All spectra and light intensities were measured using a SPIC-200 spectral color illuminometer (Yuanfang Optoelectronics, Hangzhou, China). When plants reached the rooting stage (45 days), five plants from each treatment of each variety were randomly selected, tested, and analyzed. Note: Although we selected 5 plants per treatment group, we generally only used 3 plants for the experiment, with the remaining 2 serving as backup material in case of insufficient experimental material or damage to the experimental material.

2.2. Determination of Leaf Morphological Parameters and Biomass

We selected 3 uniformly growing tobacco plants from each variety within each treatment group. Subsequently, the third, fourth, and fifth leaves of each treated tobacco plant were picked for accurate measurements of the leaf area, length, and width. Digital images of the leaf blades were captured using a Leaf Analyzer (Wanshen Inspection Technology Co., Ltd., Guizhou, China), and these parameters were quantified using the Wanshen LA-S Leaf Area Analysis System (Wanshen Inspection Technology Co., Ltd., Guizhou, China). Following a 45-day growth period, the fresh leaf mass from five plants of each tobacco variety was initially assessed using an electronic balance (Ohaus AX224Z, Shanghai, China). These samples were then heated for 30 min at 105 °C and dried at 80 °C until the tobacco reached a constant mass. Subsequently, the mass of the dried leaves, i.e., the dry mass, was measured using the same electronic balance (Ohaus AX224Z, Shanghai, China) as described above.

2.3. Anatomy of the Leaf Blade

To observe leaf epidermal structure, we first randomly selected 3 uniformly growing tobacco plants from each variety within each treatment group. We then washed the fourth leaf of each plant and dried it with absorbent paper. Colorless nail polish was then applied evenly on both sides of the leaf blade. Once the colorless nail polish dried, a film formed on the surface of the leaf blade. This film was gently removed with tweezers and cut into a piece measuring approximately 1 × 1 cm, which was imprinted with the structure of the stomata in the epidermis. The film was placed on a slide with a drop of distilled water, and a coverslip was slowly placed along the side of the water drop to prevent air bubbles from forming, creating a temporary stomatal slide. This slide was then observed using a light microscope.
Stomatal conductance was measured using the LI-6800 portable photosynthesis measurement system (LI-COR, Lincoln, NE, USA). During the measurement process, the leaf chamber of the photosynthesis meter was fixed in the middle of the tobacco leaf to ensure that the leaf was flat and well-sealed with the leaf chamber. The photosynthesis meter automatically calculates stomatal conductance using a formula based on Fick’s diffusion law, which derives stomatal conductance from the vapor pressure difference between the inside and outside of the leaf and gas flow rate. The experiment was conducted under natural light conditions, with measurements taken between 9:00 a.m. and 11:00 a.m. to avoid the effects of light saturation and light inhibition on the results. Three tobacco plants were selected for each treatment group, with 3 functional leaves measured per plant, for a total of 9 replicates.
Three tobacco plants were selected for each treatment group. Leaf slice measurements were performed on the fourth leaf of each tobacco seedling. Using a razor blade, a 1.5 × 1.5 cm section was extracted from the mesophyll near the main vein. The slices were then quickly fixed and preserved in a standard fixative solution, which consisted of 5 mL of formaldehyde (37–40%), 5 mL of glacial acetic acid, 90 mL of 50% alcohol, and 5 mL of glycerol per 100 mL of fixative. Initially, the material was dehydrated through a series of ethanol solutions with increasing concentrations—70%, 80%, 90%, 95%, and 100%—for 20 min each using a JJ-12J dehydrator (Wuhan Junjie Electronic Co., Ltd., Wuhan, China). After dehydration with 100% ethanol (fresh) for 20 min, a paraffin mold (metallic) was slightly heated on an alcohol lamp using tweezers. It was then placed on a flat tabletop, and a wax cup filled with pure paraffin wax removed from the incubator. The pure paraffin wax was poured into the wax cup. Forceps were heated slightly on the alcohol lamp, and the material was clipped, placed cut side down into the wax mold, and arranged neatly. The molten wax was then gently poured into the embedding box. The embedded samples were sliced using a paraffin slicer (Shinki BK-2258, BIOBASE, Jinan, China) to prepare paraffin sections for observation under an optical microscope. The process began with a series of solutions using turpentine and alcohol, which included sequential treatments with 50%, 70%, 95%, and 100% alcohol; a mixture of 50% pure alcohol and 50% turpentine; a solution of 1/3 alcohol and 2/3 pure turpentine; and finally, two stages of turpentine (1) and (2). The sections were immersed for 10 s in each solution before pure alcohol was used, and then for 1, 2, 3, and 5 min in the subsequent stages. The tissue sections were dewaxed and rehydrated following this procedure. Toluidine blue staining was applied to enhance the visibility of the sections. They were then immersed in graded alcohols of 50%, 70%, and 80% for 3 to 8 s each. Finally, the sections were clarified with xylene for 5 min and sealed with a neutral adhesive. This meticulous process ensured that the paraffin sections were of high quality and suitable for viewing under a light microscope (ML31, Mingmei, Guangzhou, China). The data obtained from these observations were quantified using ImageJ1.53 (National Institutes of Health, Bethesda, MD, USA).

2.4. Photosynthetic Characterization

Chlorophyll fluorescence parameters: 3 tobacco plants were selected for each treatment group. Measurements were performed with a FluorPen handheld chlorophyll fluorometer (FluorPen110, Dianjiang, Shanghai, China). This involved fully acclimatizing the leaves to light prior to the measurement, followed by a 10 min darkness treatment. Each tobacco plant was measured three times, using the 3rd, 4th, and 5th leaves, respectively [31]. The OJIP test was performed first. The fluorescence induction curves from the O (initial fluorescence), J, I, and P (maximum fluorescence) stages were recorded. The dark treatment was repeated to measure the variable fluorescence (Fv), photochemical burst coefficient (QP), and maximum photosynthetic efficiency (R) of PSII, and each measurement was repeated three times and averaged.
  Fv = FM F 0 ;
qP   = FM Fs /   Fv ;
R = Fv / FM .
  • FM —maximum fluorescence intensity;
  • Fs —steady-state fluorescence intensity;
  • F 0 —initial fluorescence intensity.
Photosynthetic parameters: First, 3 uniformly growing tobacco plants of each variety were randomly selected from each treatment group. Then, the third tobacco leaf of each plant was chopped (removing the thick veins) and 0.100 g of fresh leaves were weighed. The weighed fresh leaves were added to a 10 mL centrifuge tube, followed by 10 mL of an acetone–ethanol mixture (80% acetone and 95% ethanol by volume, 1:1), and extracted in the dark for 8 h. The supernatant was then centrifuged at 12,000 rpm for 1 min to determine the absorbance values. The absorption of the supernatant was determined using an enzyme marker (Infinite® 200 PRO, Tecan, Singapore) at room temperature at 645 nm and 633 nm using the corresponding reagent (acetone–ethanol mixture) as a reference. The formulas for calculating the chlorophyll content are listed below [32]:
  Chl   a   mg / g   =   12.72   OD 663 2.59 OD 645   V / 1000 W
Chl   b mg / g = 22.88   OD 645 4.67 OD 663   V / 1000   W
Chlorophyll   content   mg / g =   Chl   a + Chl   b
  • Chl   a chlorophyll a;
  • Chl   b chlorophyll b;
  • V—volume of extract (mL);
  • W—mass (g);
The conversion factor is 1000.

2.5. Extraction of the Total RNA and Analysis Using Real-Time qPCR

Real-time quantitative reverse transcription polymerase chain reaction (RT-qPCR) was conducted using information on the tobacco homologous genes and primers supplied with the Supplementary Materials (Table S2). qPCR was performed using 3 uniformly growing tobacco plants of each variety that were randomly selected from each treatment group. Then, the 5th leaf of each plant was measured. The total RNA was isolated and purified using the same method as Zhou et al. [33]. Next, a nanophotometer manufactured by IMPLEN, Inc. was utilized to measure the concentration of the RNA samples. The cDNA was synthesized using reverse transcription from the total RNA template according to the guidelines for the use of All-in-One RT SuperMix provided by Vazyme. A 10 µL reaction system was used to determine the relative expression of specific genes in the tobacco using the RT-qPCR technique. The data were analyzed according to the user guide of the BIORAD CFX96 Touch real-time quantitative PCR instrument. When the fluorescence intensity of a reaction exceeded a set threshold, the 2−ΔΔCt method (where Ct represents the number of threshold cycles) was used to calculate the relative expression of the sample [34]. The CK treatment was used as a control sample, i.e., the sample in relation to which a change in the expression of the tested genes was detected. Three independent measurements were performed for each sample in the experiment to ensure the accuracy of the results. NtActin was utilized as an internal reference gene. Using this method, we monitored the expression of the following genes: ARF2 (auxin response factor 2), EBP1 (ErbB3-binding protein 1), ANT (AINTEGUMENTA), CYCD3 (CYCLIN D3), PHYB (photosensitive pigment B), and PIF7 (Phytochrome-interacting factor 7).

2.6. Hormone Analysis

First, three uniformly growing tobacco plants of each variety were randomly selected from each treatment group. Subsequently, 0.2 g of leaf tissue was cut from the fifth leaf of each plant and placed in a volumetric flask containing 10 times the volume of acetonitrile. The sample was incubated with acetonitrile at 4 °C overnight. Afterwards, the sample was centrifuged at 12,000 rpm for 5 min to collect the centrifuged supernatant. Next, 5× the acetonitrile volume was added to the collected supernatant for precipitation, and finally, the supernatant was collected again. The two supernatants were mixed. Then, 50 mg of C18 packing was added to the supernatant, followed by 30 s of vigorous shaking. The supernatant was then centrifuged at 10,000 rpm for 5 min, removed, and blown dry using nitrogen. Afterwards, the dried sample was redissolved with 200 µL of methanol and filtered through a 0.22 µm organic phase filter membrane. Finally, the filtered samples were stored at −20 °C for subsequent assays. The phytohormone standard sample, IAA, was purchased from Sigma-Aldrich. IAA was dissolved in 2 mL of methanol solution containing 0.1% formic acid to prepare a standard solution with a final concentration of 500 µg/mL and then kept at −20 °C as a storage solution. The 2 μL storage solution (500 μg/mL) was diluted to 990 μL of methanol. We obtained a final concentration of 1 μg/mL as the primary solution. Different primary solution volumes were aspirated into test tubes (1.5 mL tubes). The volume in the test tube was adjusted to 1 mL final concentrations of 0.1 ng/μL, 0.2 ng/μL, 1 ng/μL, 5.0 ng/μL, 20.0 ng/μL, 50.0 ng/μL, and 200.0 ng/μL using an appropriate amount of methanol. For the organic phase, 900 mL of chromatographically pure methanol and 1 mL of formic acid were added sequentially to a volumetric flask. Methanol was added to the volumetric flask until the volume reached 1 L, after which the bottle was inverted for thorough mixing. For the inorganic phase preparation, 900 mL of deionized water was first added to the volumetric flask, followed by 1 mL of formic acid. The volume in the volumetric flask was adjusted to 1 L with deionized water and mixed by inversion. The analysis of plant hormones was accomplished using HPLC-MS/MS techniques performed on a 1290 HPLC system (supplied by Agilent, Santa Clara, CA, USA) and a SCIEX-6500 Qtrap mass spectrometer (supplied by AB Sciex, Foster City, CA, USA). During the HPLC analysis, a reversed-phase pore–shell 120 SB-C18 column, manufactured by Agilent in Palo Alto, CA, was used.

2.7. Statistical Analysis

Experimental data were used to generate images using Origin 2022 (Microcal Software Inc., Northampton, MA, USA). Subsequently, an analysis of variance (ANOVA) using SPSS 26 was conducted, followed by Duncan’s multiple range test for ANOVA (p < 0.05). Following the statistical analyses, the results were recorded using WPS Office.

3. Results

3.1. Changes in Leaf Morphology of Tobacco Seedlings Under Different Light Conditions

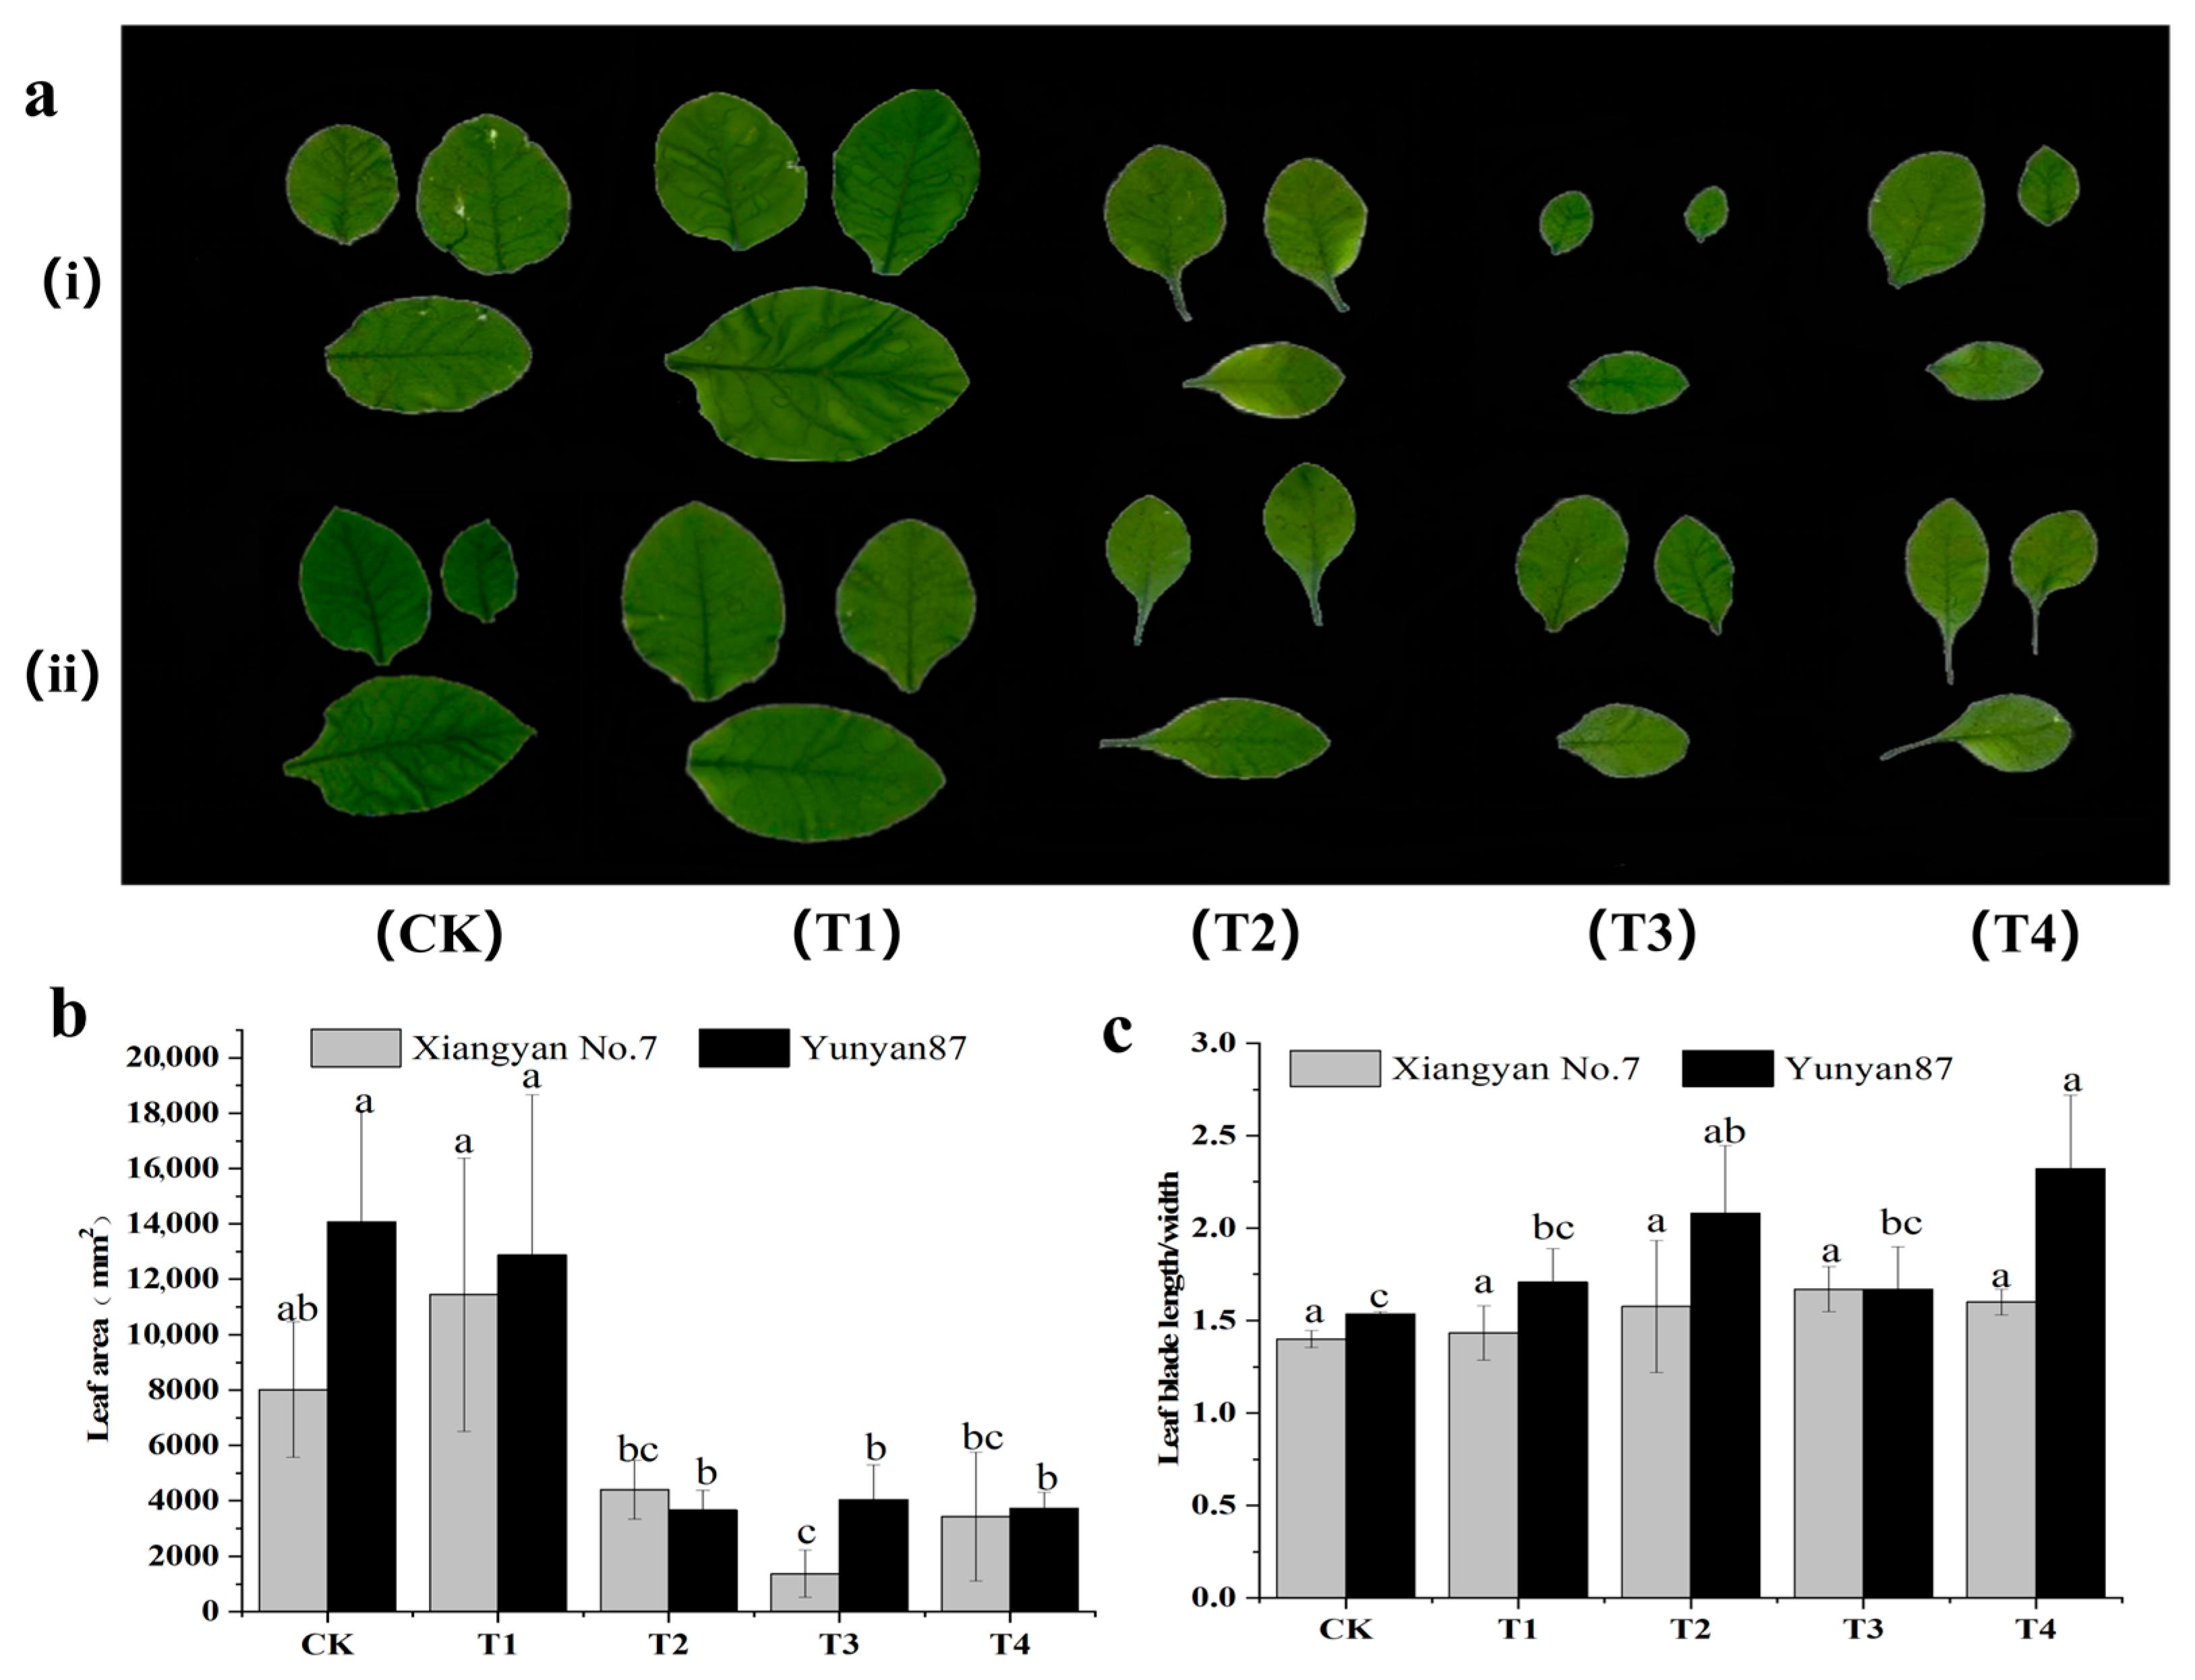
Tobacco growth and development directly affect tobacco yield. To study the differences in tobacco growth and development under different spectra, we compared the leaf areas of the control and experimental groups. The results show that the Xiangyan No.7 tobacco leaf area increased by 42.7% (T1) but decreased by 35.3% (T2) under the red light treatment. It was reduced by 90.7% (T3) and 73.4% (T4) under the far-red light treatments. The Yunyun87 tobacco showed 5.4% (T1) and 60% (T2) reductions in leaf area under the red light treatment, and reductions of 71.3% (T3) and 73.4% (T4) under the far-red light treatment (Figure 2a,b). The leaf LW ratio of Yunyan87 tobacco seedlings was significantly higher under T2 and T4 treatments (Figure 2c). Through the above experimental results, we found that tobacco plants grew more slowly under far-red (FR) light and developed narrower, longer leaves.

3.2. Changes in Tobacco Seedling Biomass Under Different Light Conditions

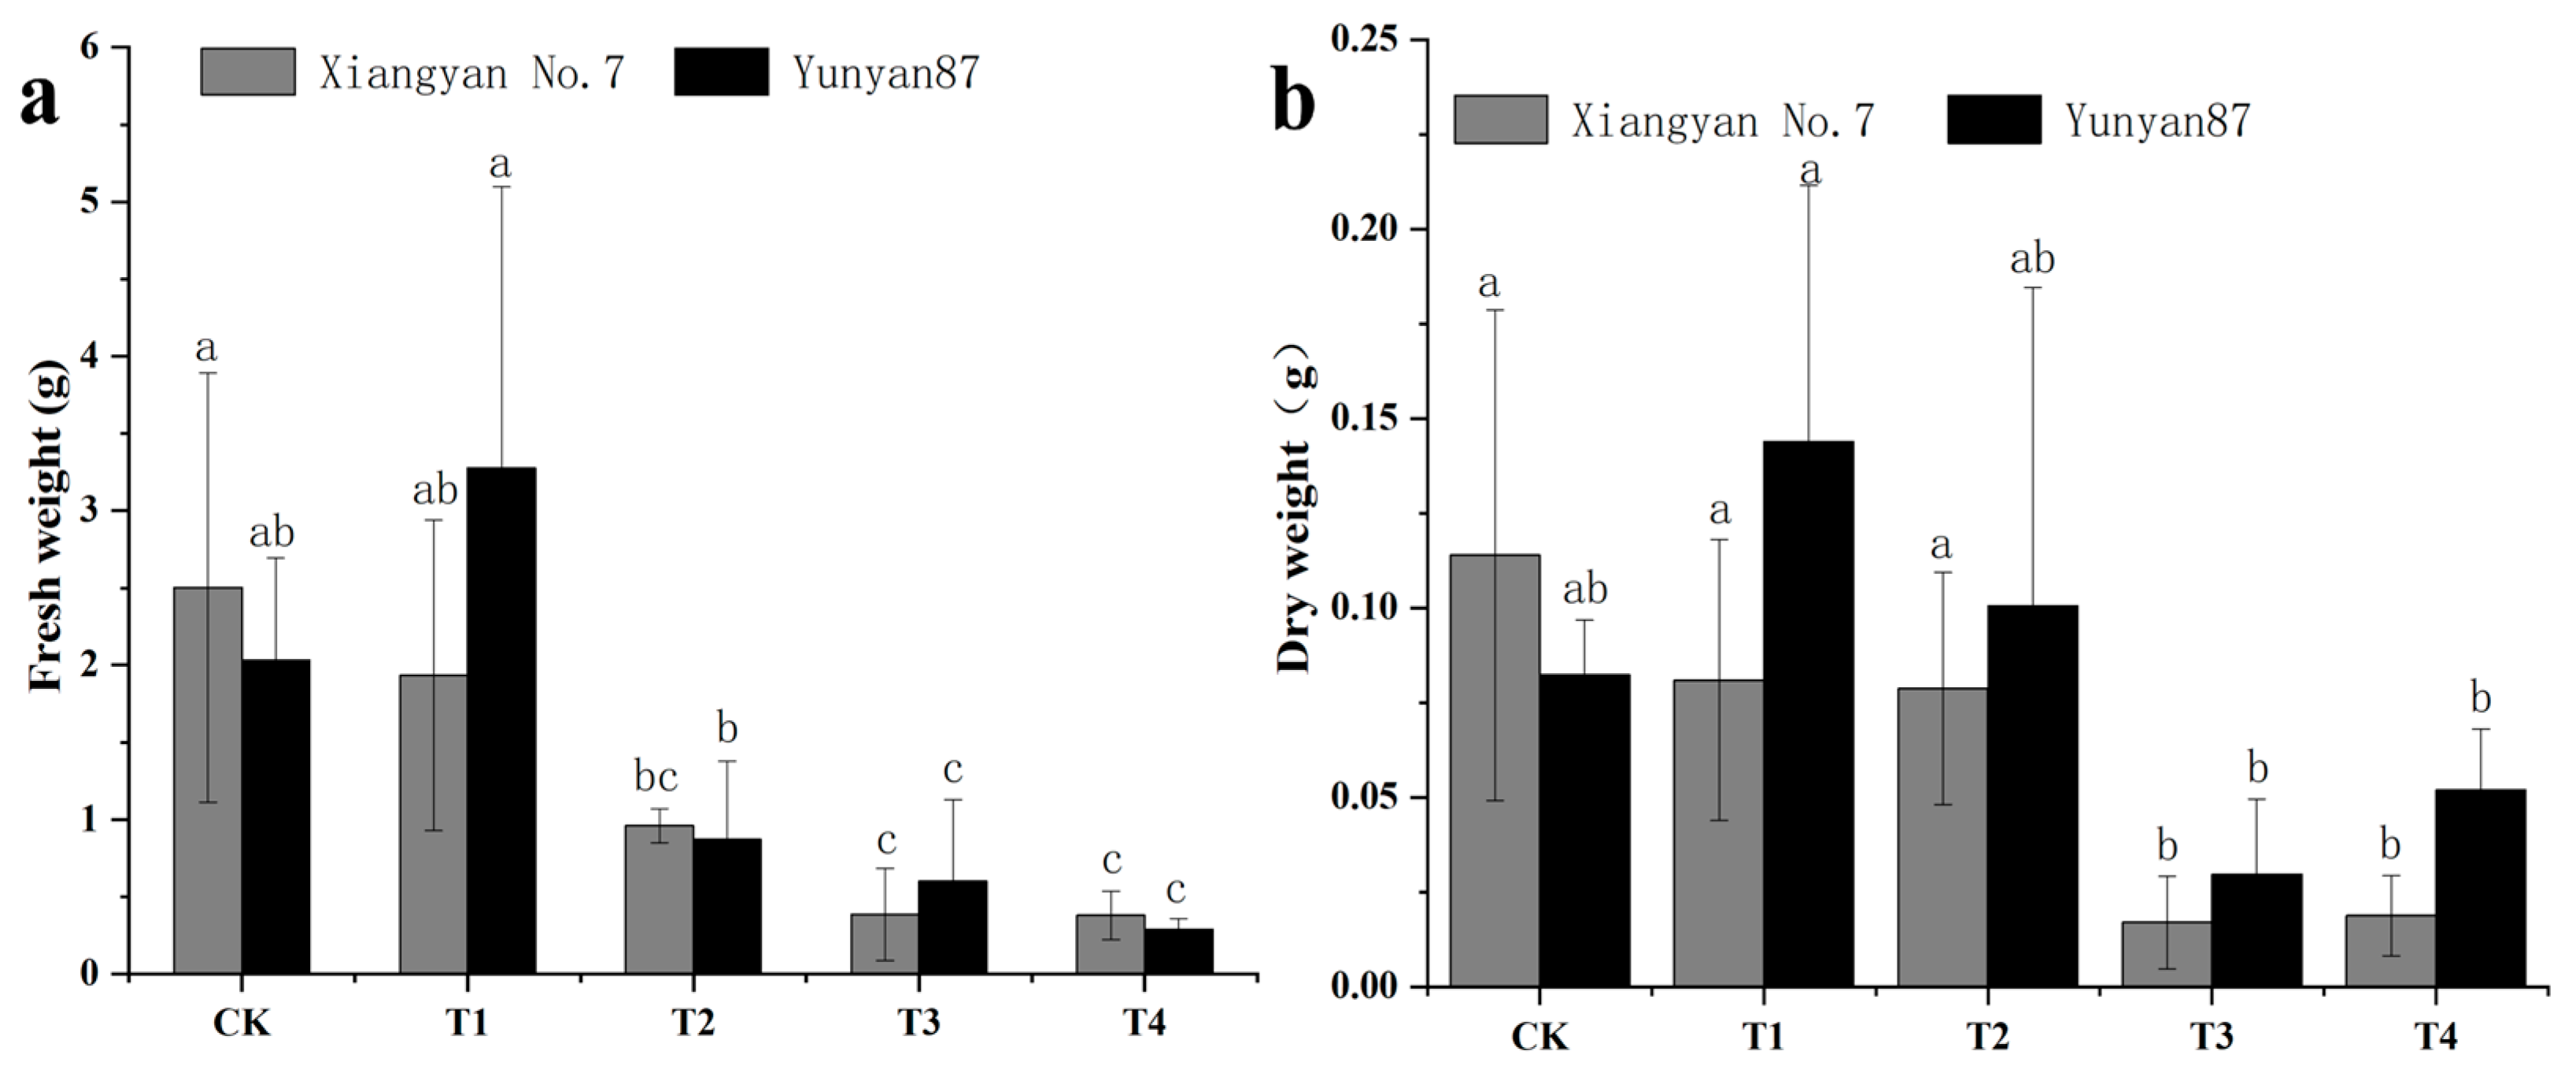
Biomass is a crucial indicator for assessing the growth status of plants. To investigate how various light qualities impact tobacco seedling biomass, we measured the dry mass of aboveground parts of tobacco. The results showed reductions in the fresh tobacco mass by up to 85.7% and in the dry mass by up to 85.2% under far-red light treatment. Specifically, compared with CK, the reduction in fresh seedling mass of Xiangyan No.7 was significant under T2, T3, and T4. The fresh weight of Yunyan 87 decreased significantly under both T3 and T4 conditions (Figure 3a). For Yunyan 87, no statistically significant differences in dry matter weight were observed between CK and the other treatments, whereas for Xiangyan 7, a significant reduction occurred under T3 and T4 (Figure 3b). The fresh and dry mass of the tobacco seedlings under the four treatments showed that the FR treatments had relatively decreased the fresh and dry mass.

3.3. Changes in Tobacco Seedling Photosynthetic Characteristics Under Different Light Conditions

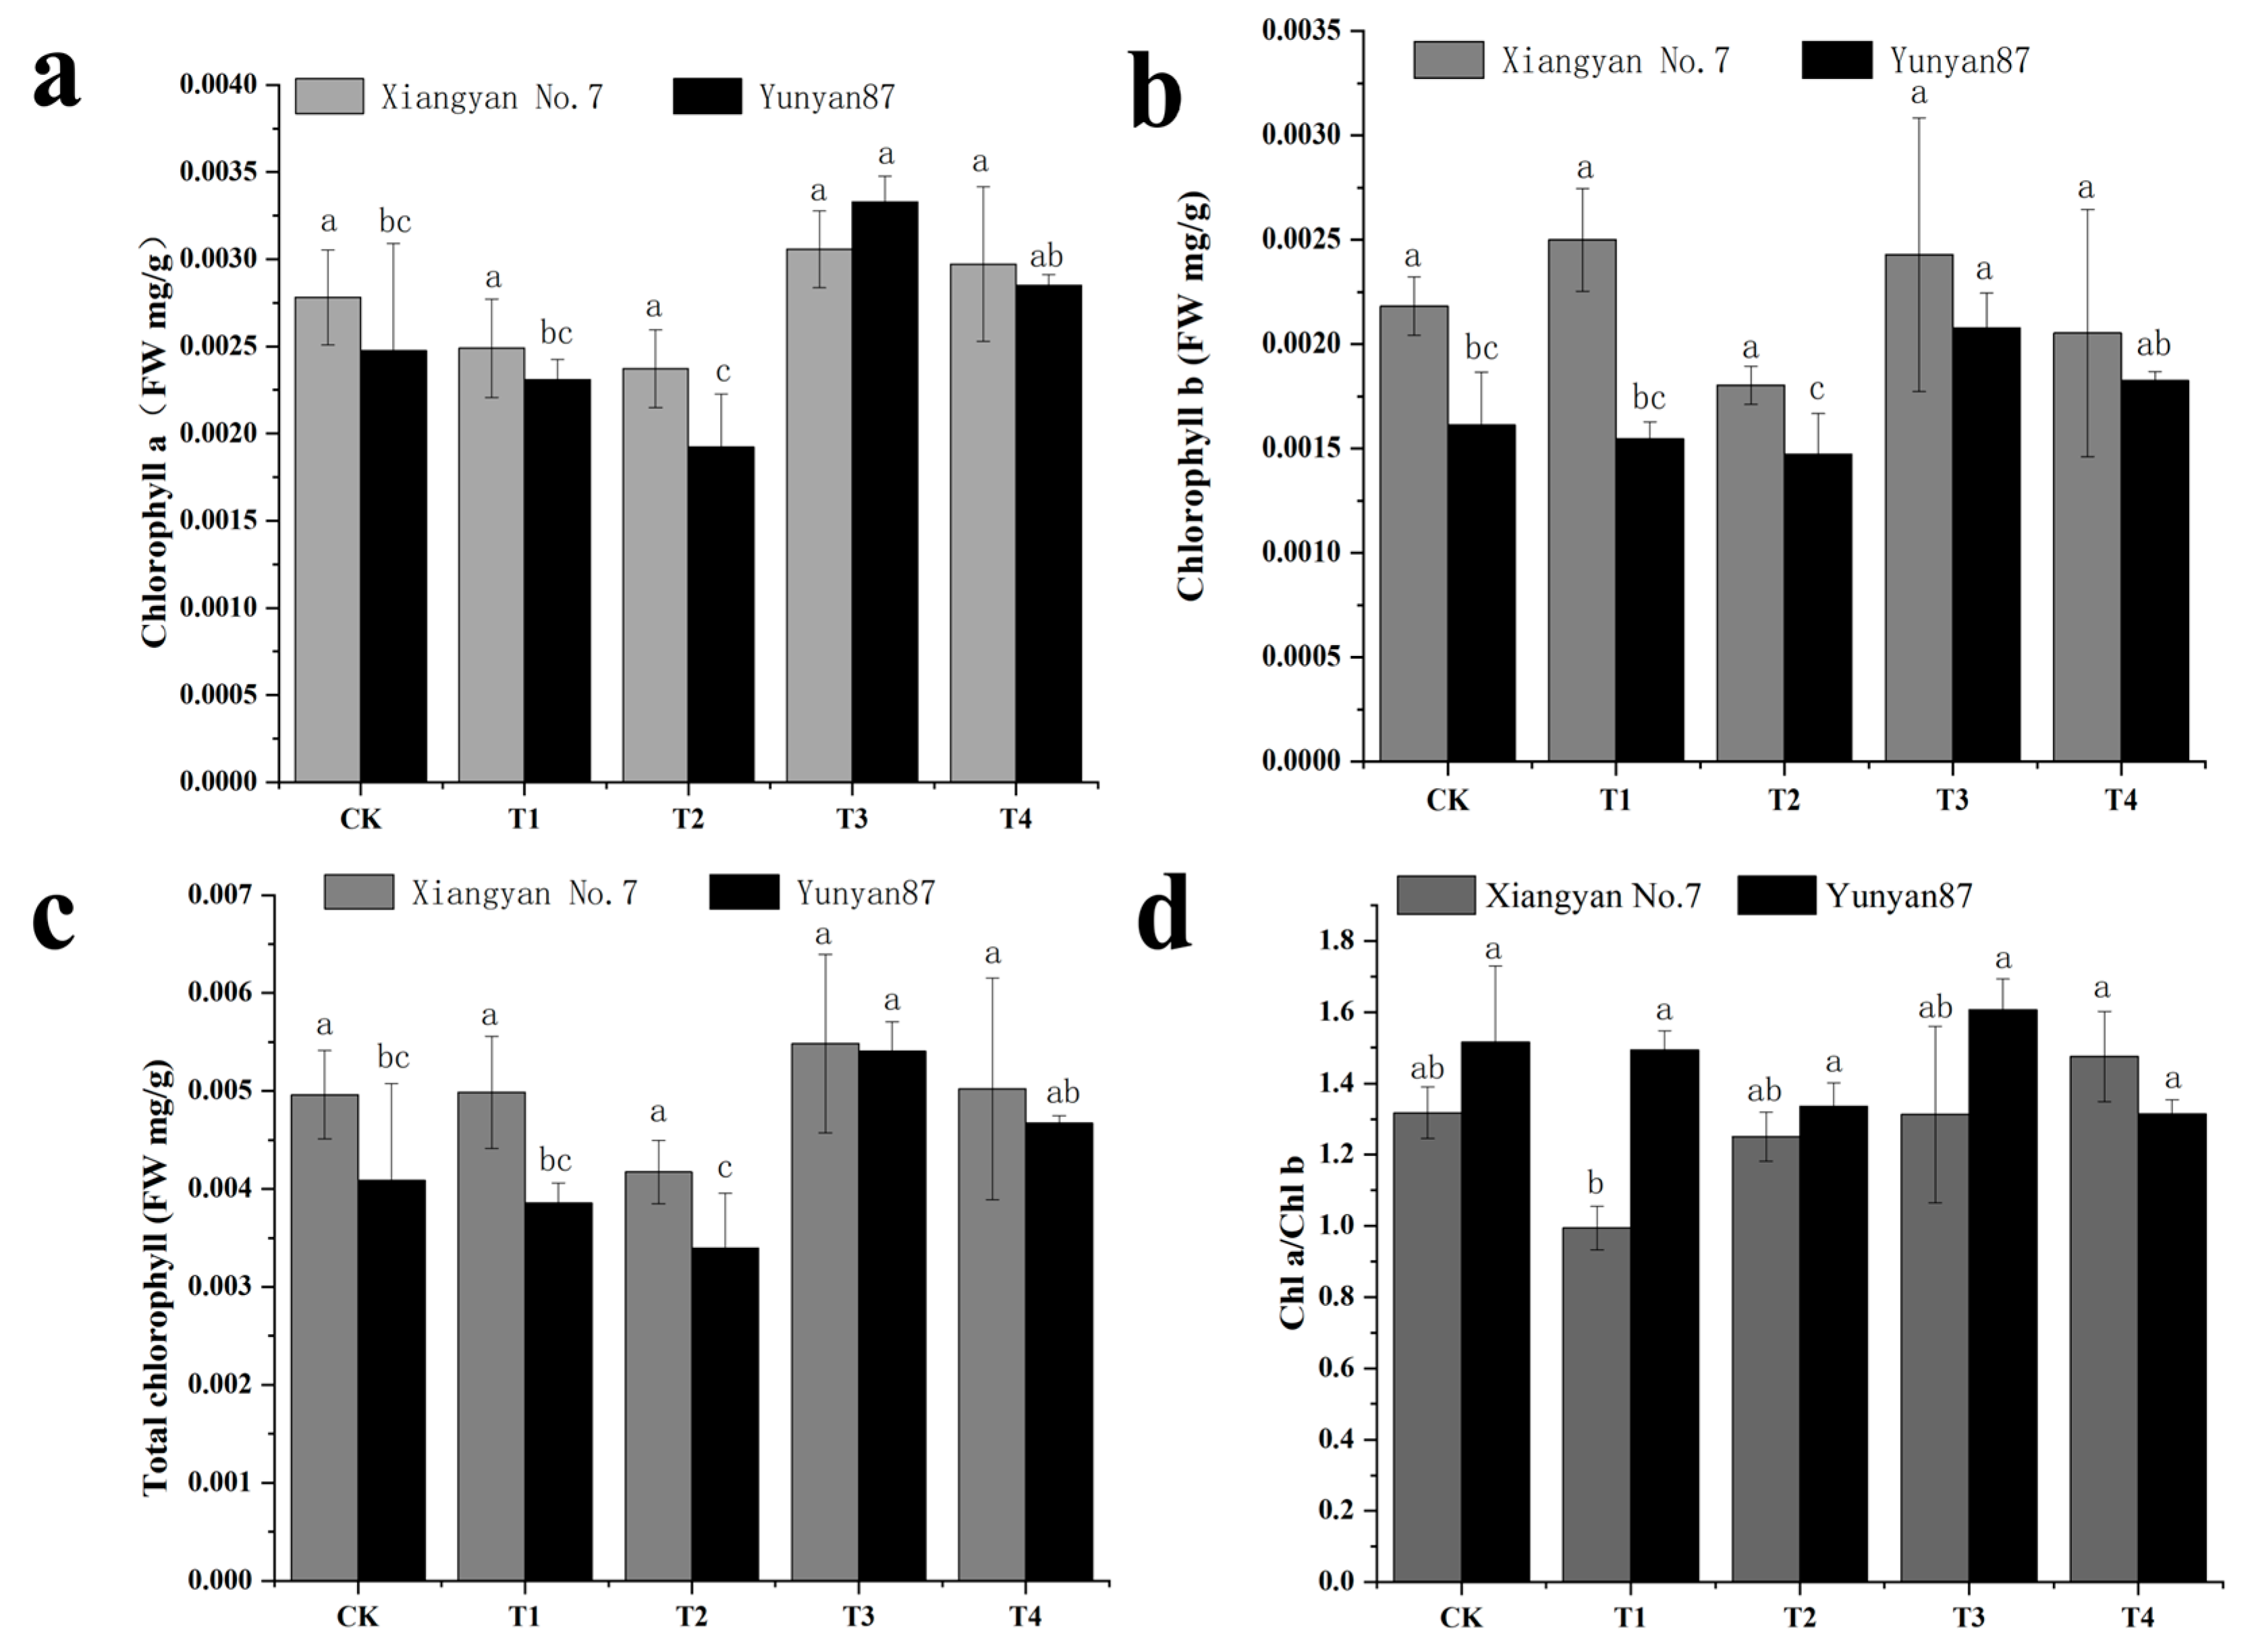
The results of the study on the effects of different light conditions on the growth of Xiangyan No.7 and Yunyan 87 showed that, under far-red light treatment, chlorophyll a (a) in tobacco leaves increased by 27.7%, chlorophyll b (b) increased by 29.2%, and total chlorophyll increased by 28.7%. Specifically, Yunyan 87 showed a significant increase under the T3 treatment (Figure 4a). Compared with CK, there were no significant differences in chlorophyll b content among the different light conditions for Xiangyan No.7 (Figure 4b), while Yunyan 87 showed a significant increase under T3 treatment (Figure 4b). Compared with CK, there were no significant changes in total chlorophyll content among the four treatment conditions for Xiangyan No.7 (Figure 4c); Yunyan 87 showed a significant increase under T3 treatment (Figure 4c). Compared with CK, the chlorophyll a/b ratio of Yunyan 87 and Xiangyan No.7 showed no significant changes under any treatment (Figure 4d). In summary, far-red light can increase chlorophyll content in tobacco leaves.
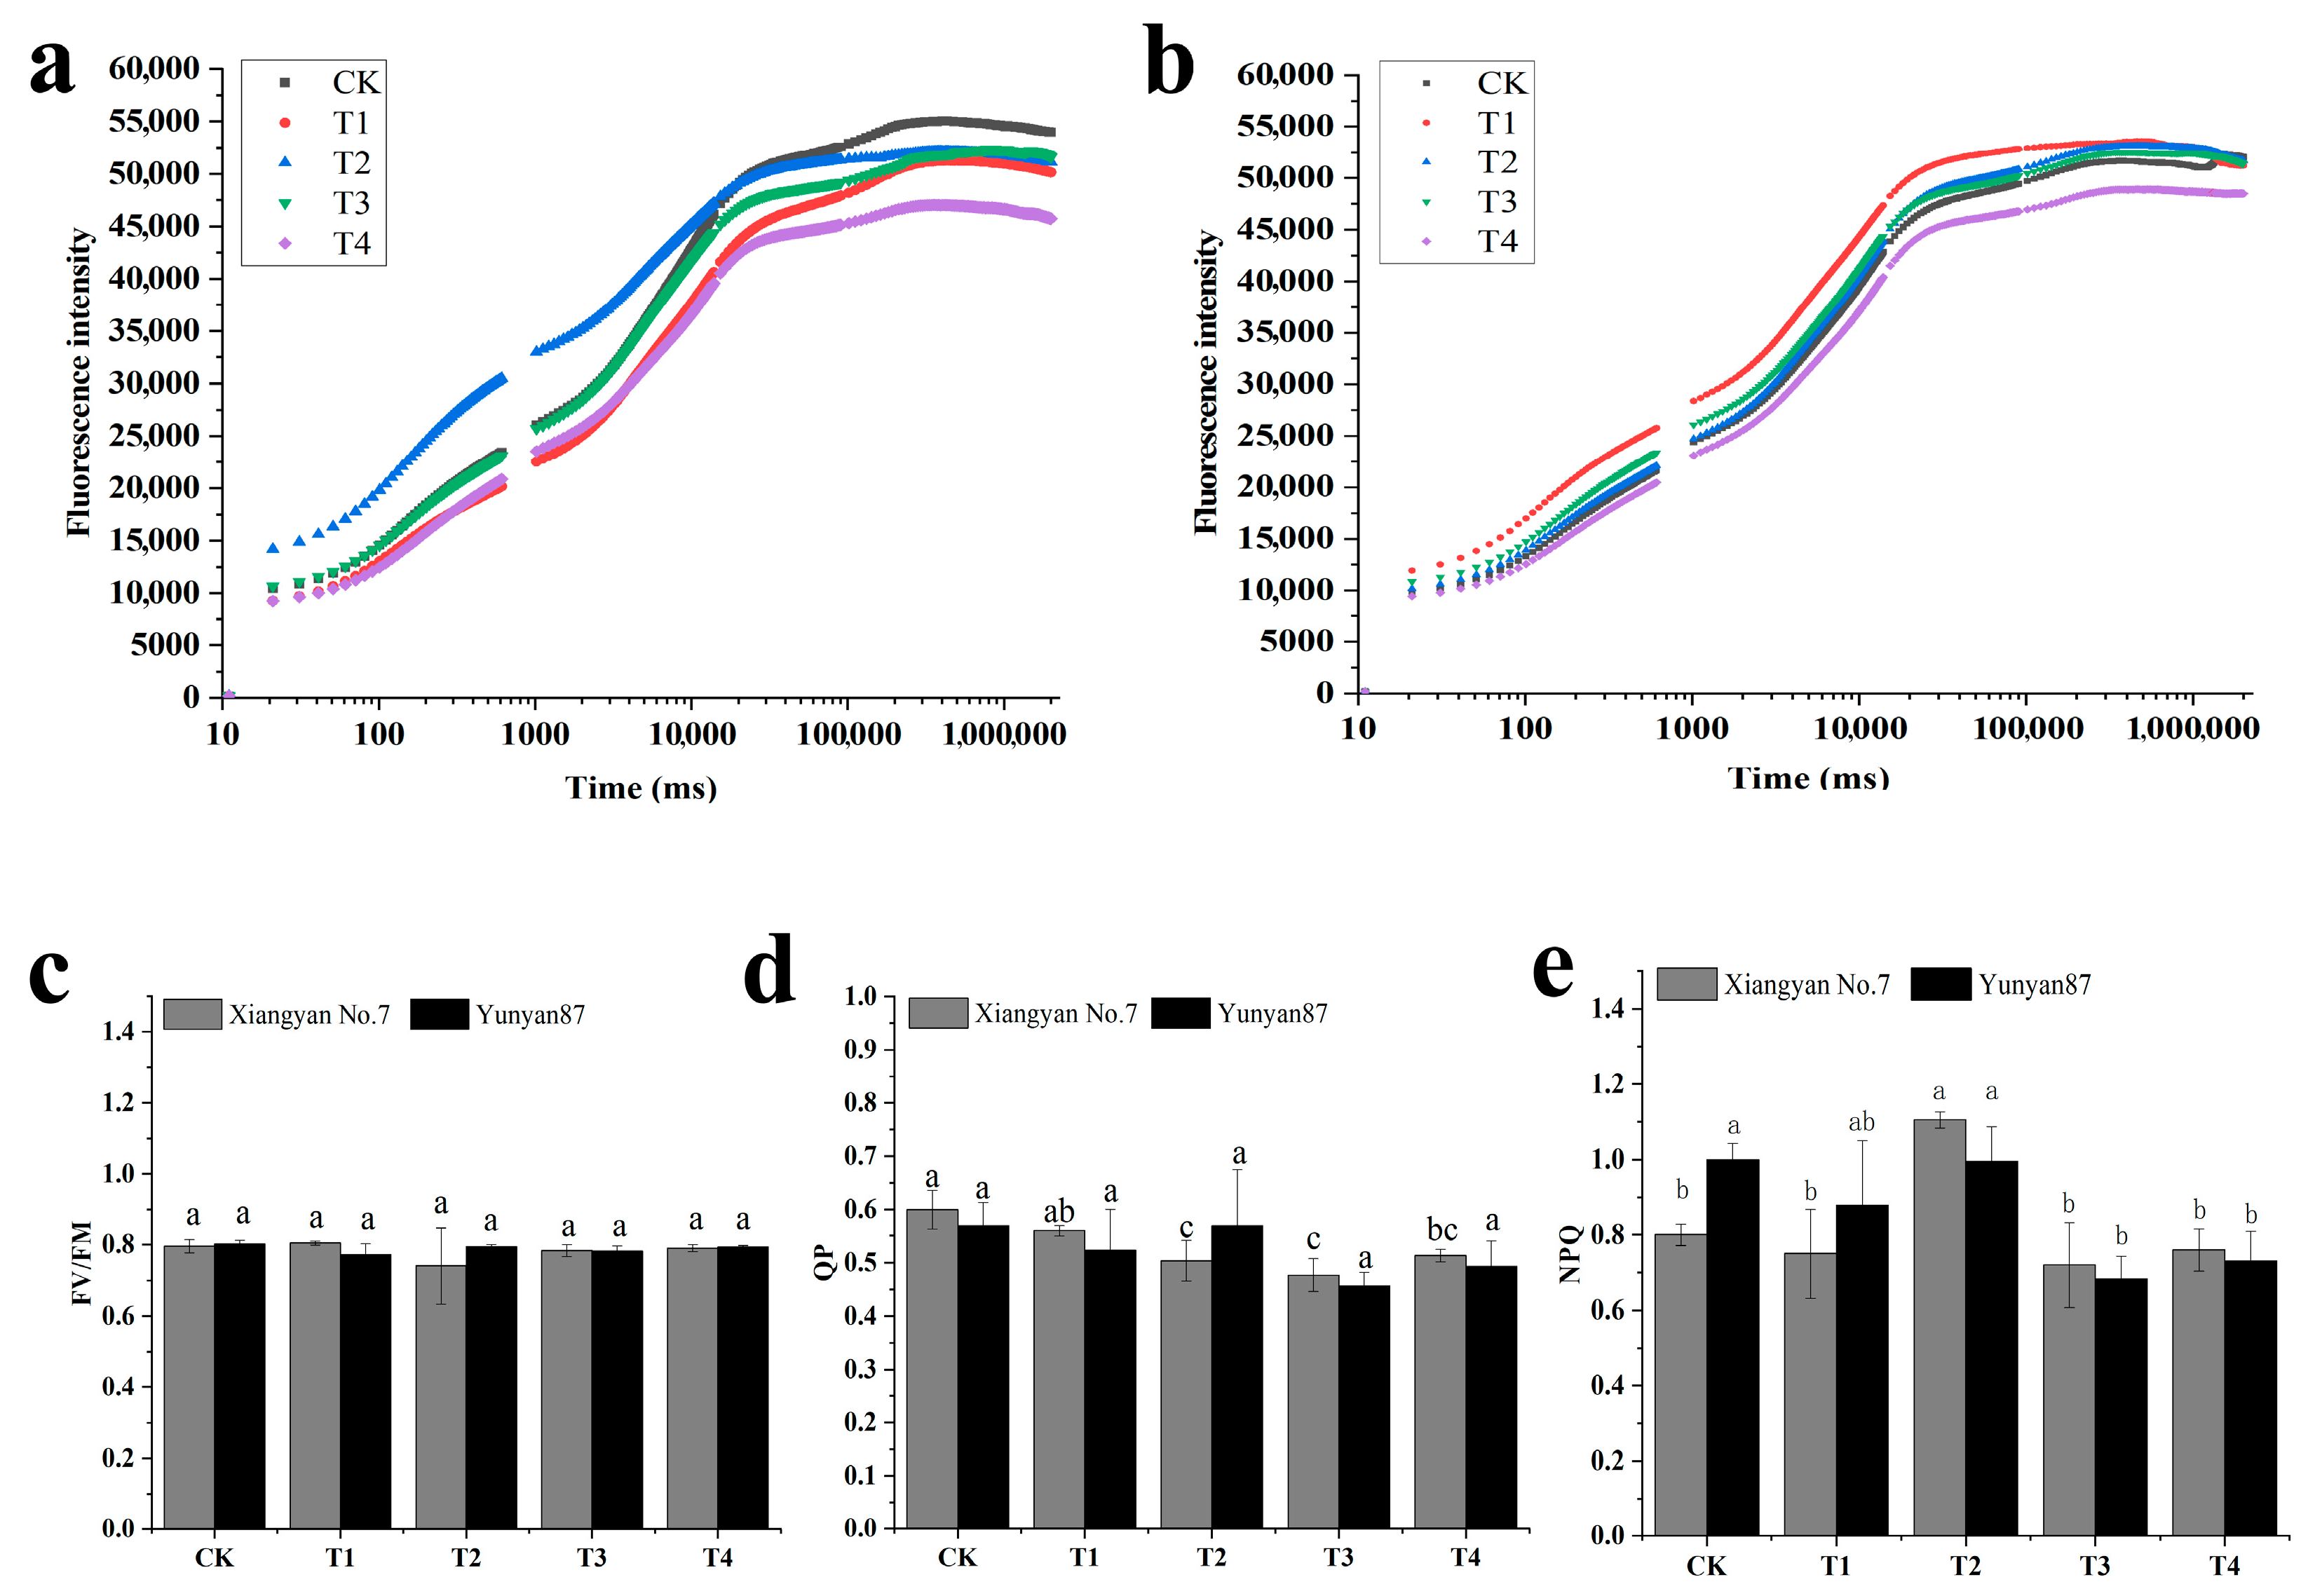
“OJIP” refers to the fast chlorophyll fluorescence induction curve, which starts from point “O”, the lowest or starting point of fluorescence. Points “J” and “I” mark the transition of the curve from the starting point to the highest point “P”, and the fluorescence intensity at point “P” reflects the maximum fluorescence of PSII under light-saturated conditions. The peak height of the “OJIP” curve is an indicator for evaluating the light energy capture efficiency in plants, and the higher the value, the stronger the plant’s ability to utilize light energy. The OJIP curves changed significantly after different spectral irradiation treatments, but the effects of different light quality treatments on the two species’ OJIP curves were not consistent. Compared with CK, the OJIP peaks of the Xiangyan No.7 seedling leaves were higher than those under T1, T2, and T3, whereas the peaks of leaves under T1, T2, and T3 were comparable. The T4 leaves had the lowest peaks. In Yunyan 87, the peaks of the tobacco seedling leaves were comparable under T1, T2, and T3, while the lowest peaks were observed under T4 (Figure 5a,b). Fv/Fm is the maximum photosynthetic efficiency of PSII, which reflects the maximum light energy conversion efficiency of PSII. For the two varieties, Fv/Fm was not significantly changed under the five different spectral irradiations (Figure 5c). Compared with CK, the QP of Xiangyan No.7 significantly decreased under T2, T3, and T4 (Figure 5d). NPQ represents the non-photochemical quenching coefficient, which indicates the plant’s ability to protect itself from photodamage. In Xiangyan No.7, it increased significantly under T2. For Yunyan87, NPQ decreased significantly under T3 and T4 (Figure 5e). The higher the NPQ, the more light energy is converted into heat, which is unfavorable for photosynthesis. Fv/Fm reflects the potential of the photosynthetic system, where a high Fv/Fm value may indicate a higher potential of the photosynthetic system. The QP is a measure of the efficiency of the photosynthetic system II (PSII), which reflects the efficiency of the light energy absorbed by the chlorophyll molecules and used for photosynthesis, where a lower QP may indicate higher photosynthetic capacity. In addition, we found that the Plabs (photosynthetic performance index) of both tobacco cultivars decreased significantly under T2 treatment but increased markedly under T3 and T4 treatments. This indicates that far-red light can optimize photosynthetic efficiency, enhance light-harvesting capacity and electron transport efficiency, and promote carbon assimilation (Figures S1 and S2). The QPs of T2, T3, and T4 of Xiangyan No.7 were significantly lower than that of CK, and the NPQs of the two kinds of tobacco plants were lower under T3 and T4. Therefore, the two tobacco plant species had the best photosynthetic characteristics under T3 and T4.

3.4. Anatomical Analysis of Tobacco Seedlings Under Different Light Conditions

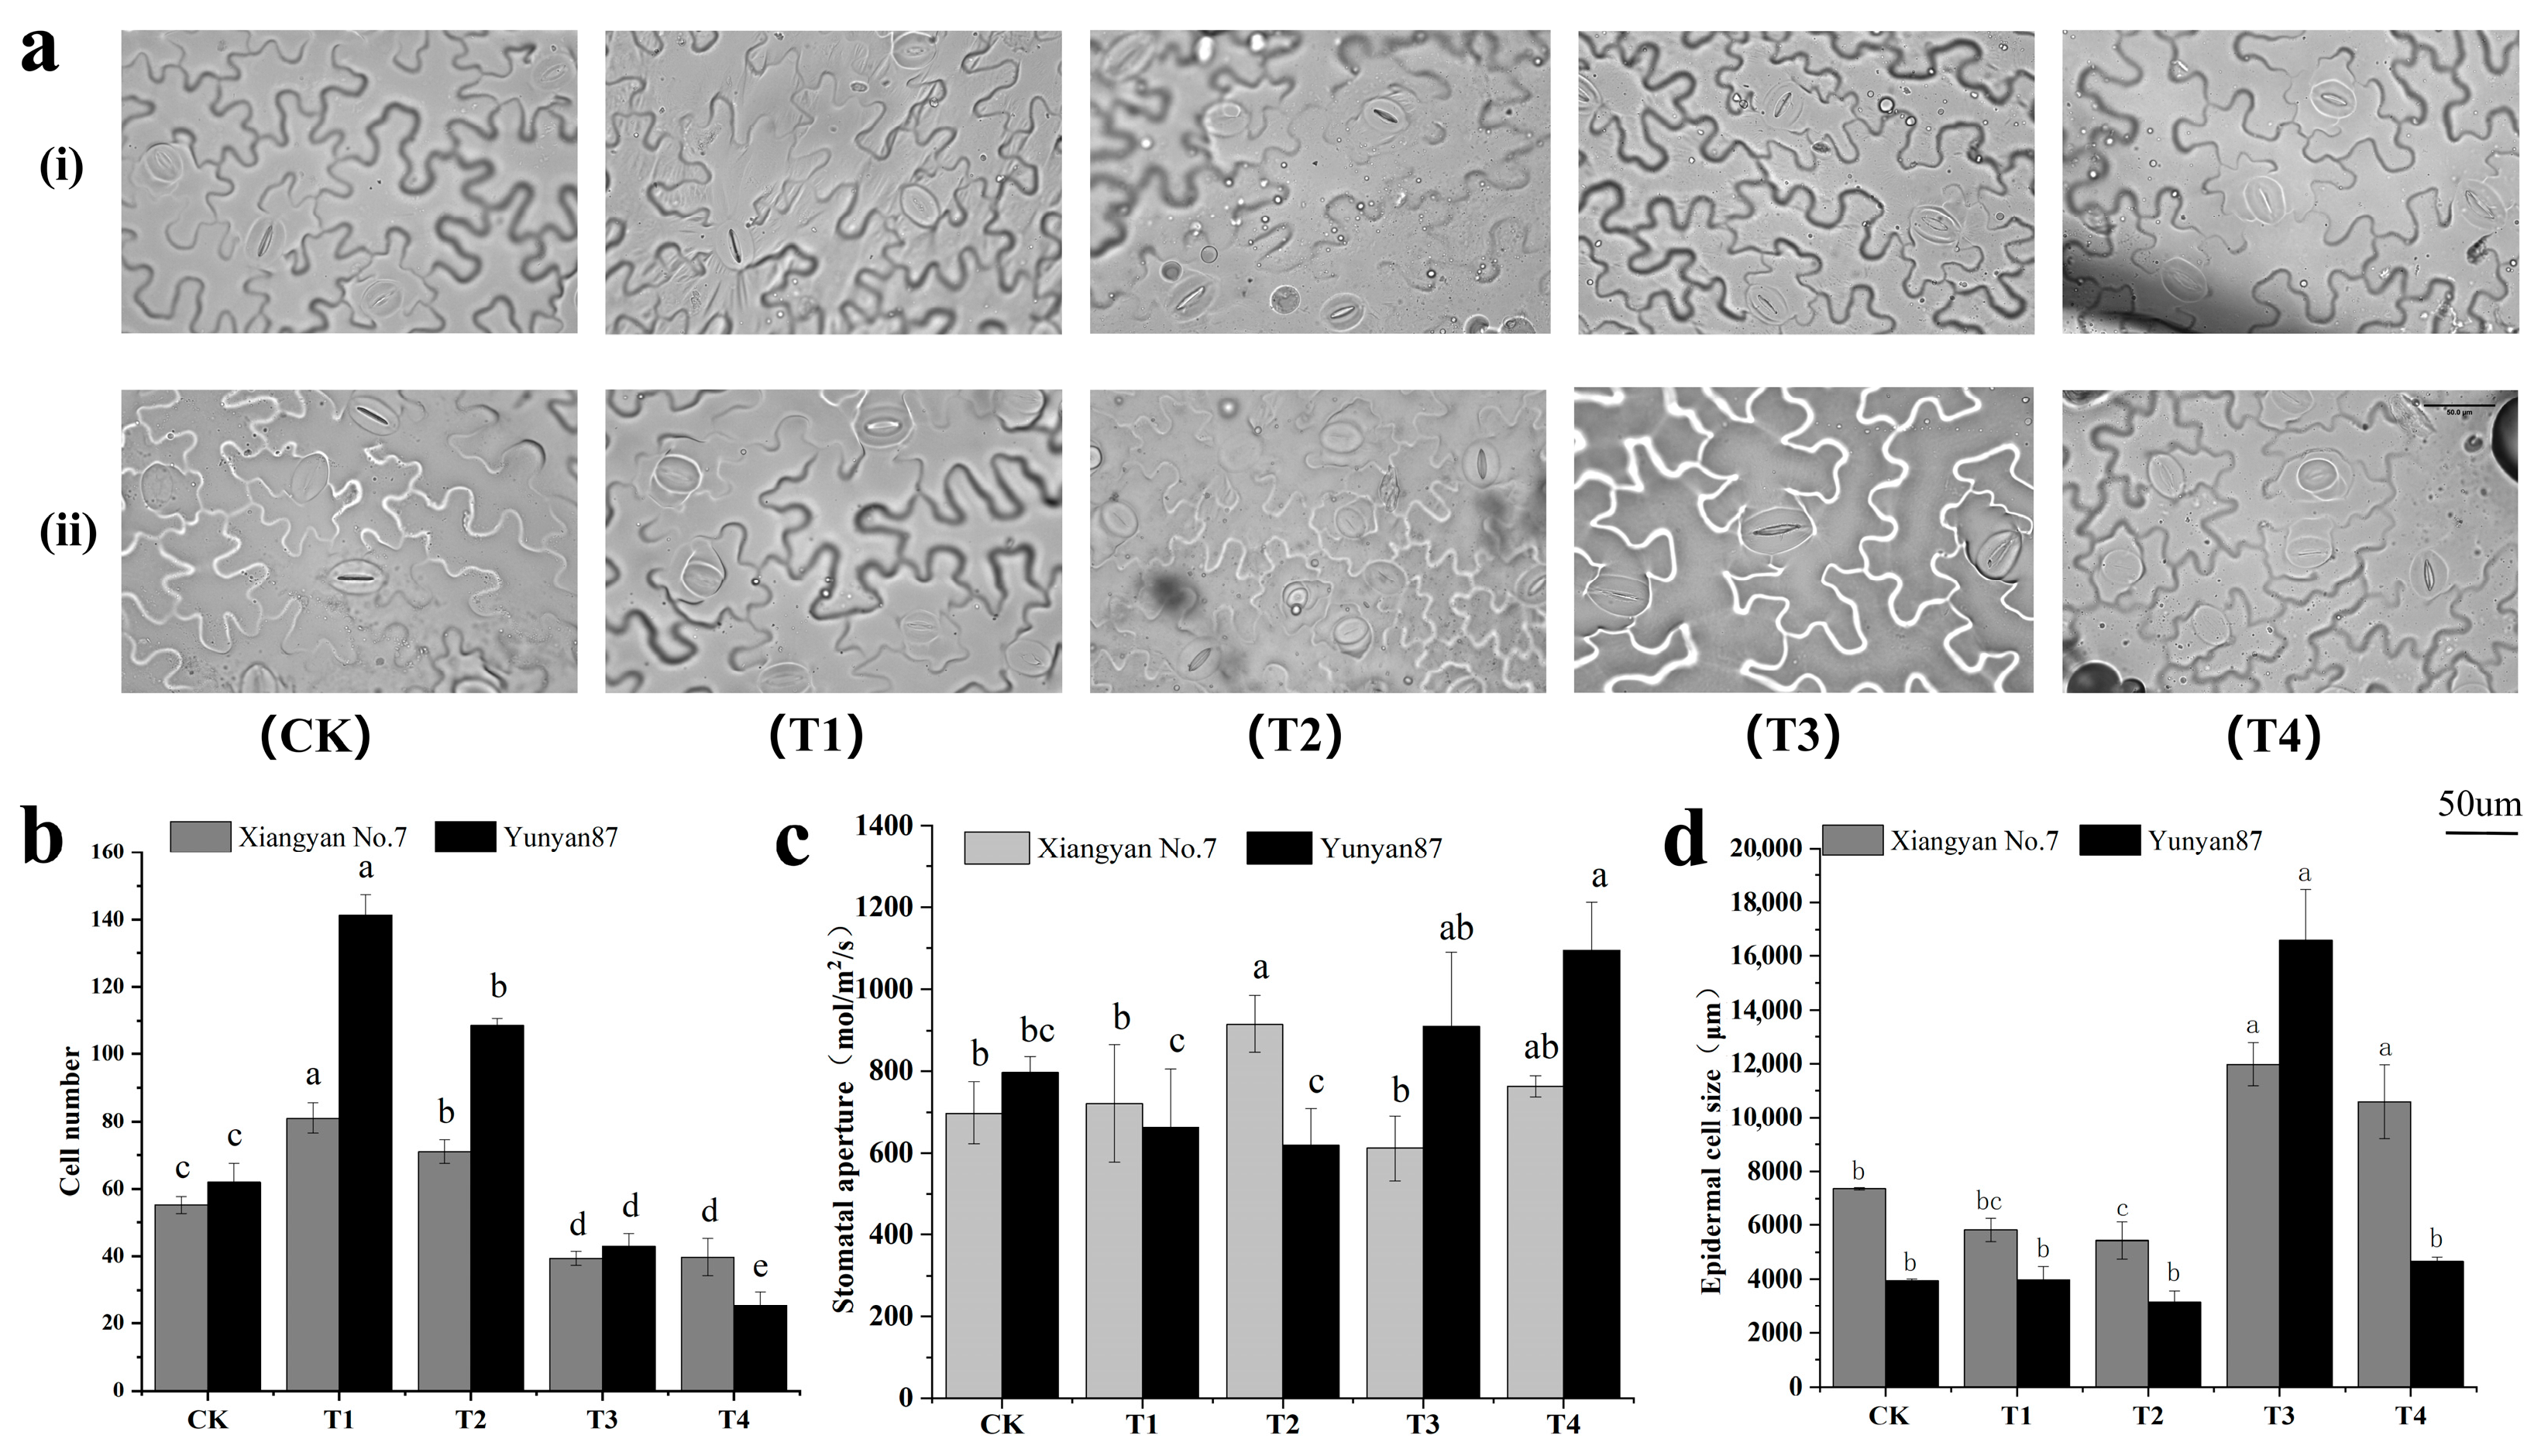
The numbers of epidermal cells in the Xiangyan No.7 and Yunyan87 seedlings increased significantly under the T1 and T2 treatments, while decreasing significantly under the T3 and T4 treatments (Figure 6b). The stomatal conductances of the Xiangyan No.7 seedlings increased significantly under T2 (Figure 6c). The stomatal conductance of the Yunyan87 seedlings increased significantly under T4 (Figure 6c). The epidermal cell size of the Xiangyan No.7 seedlings was significantly reduced under T2, and significantly increased under T3 and T4. the epidermal cell size increased significantly under T3 in the seedlings of Yunyan87 (Figure 6d).
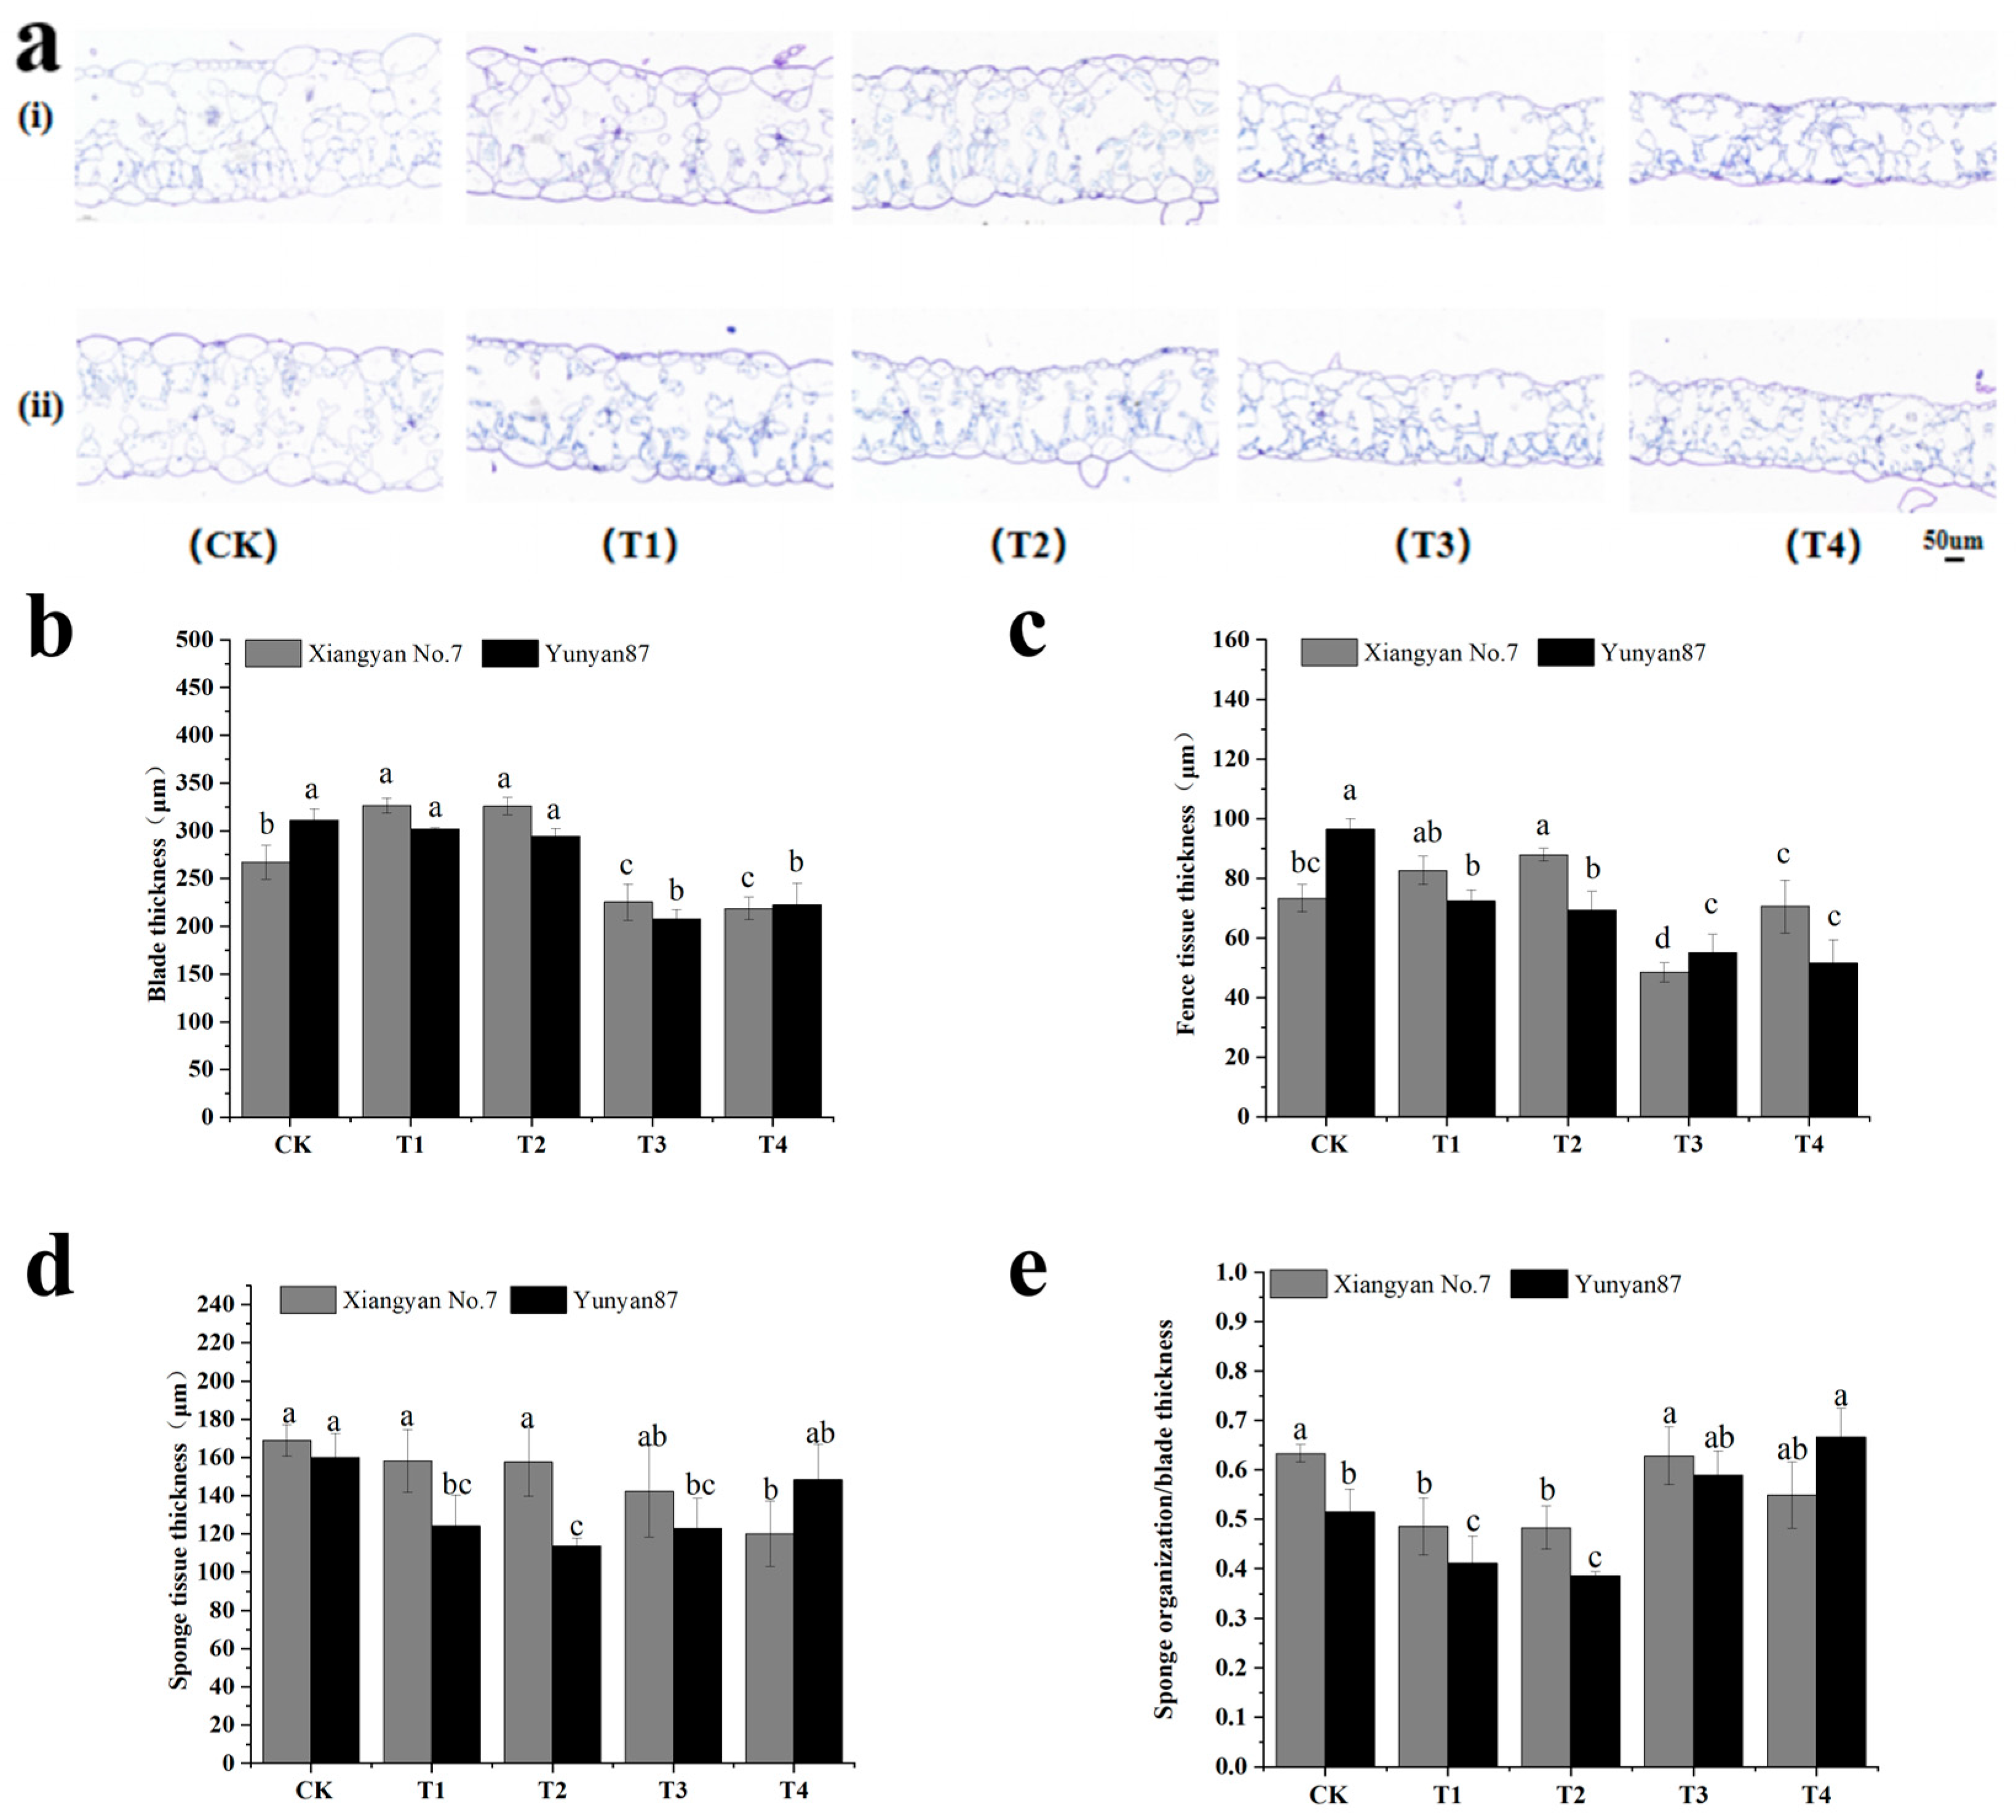
The chloroplasts in leaves differentiate into fenestrated and spongy tissues to reduce the difference in light exposure between the front and back of the leaf. As shown in Figure 7, the response of the mesophyll tissue to the light environment of different tobacco varieties was not completely consistent: the leaf thickness of the Xiangyan No.7 seedlings increased markedly under T1 and T2 and decreased significantly under T3 and T4. The leaf thickness of the Yunyan87 tobacco seedlings decreased significantly under T3 and T4. The results show that red light could encourage tobacco leaf thickening, while FR reduced the tobacco leaf thickness (Figure 7b). The fenestrated tissue thickness of Xiangyan No.7 increased significantly under T2, while it decreased significantly under T3. For Yunyan87, the fenestrated tissue thickness was significantly reduced in all four treatments, with a more pronounced reduction in T3. These findings indicate that red light enhanced the spongy tissue development in the tobacco leaves, while FR reduced the spongy tissue development (Figure 7c). The thickness of spongy tissue in the Xiangyan No.7 tobacco seedlings decreased significantly under T4. The palisade cell tissues of the Yunyan 87 tobacco seedlings were significantly reduced under T1, T2, and T3. The growth of spongy tissue in the tobacco leaves was inhibited by different light treatments relative to CK, with the inhibitory effect of FR (T3, T4) being more pronounced (Figure 7d).
The spongy tissue/leaf blade thickness responded to the degree of looseness in the organizational structure of the plant’s chloroplastic tissues. The performance of the spongy tissue thickness/leaf thickness in different light environments was not identical between Xiangyan No.7 and Yunyan87. Under T1 and T2, leaf tissue laxity of the Xiangyan No.7 seedlings was significantly reduced. The structural relaxation of the leaf flesh organization of the Yunyan87 seedlings was obviously reduced under T1 and T2, while obviously increased under T4. Therefore, we hypothesized that the organizational structural looseness degrees of tobacco leaf flesh tissue decreased in the red light spectrum and increased in the FR spectrum (Figure 7e).

3.5. Gene Expression Analysis Related to Cell Proliferation and Expansion

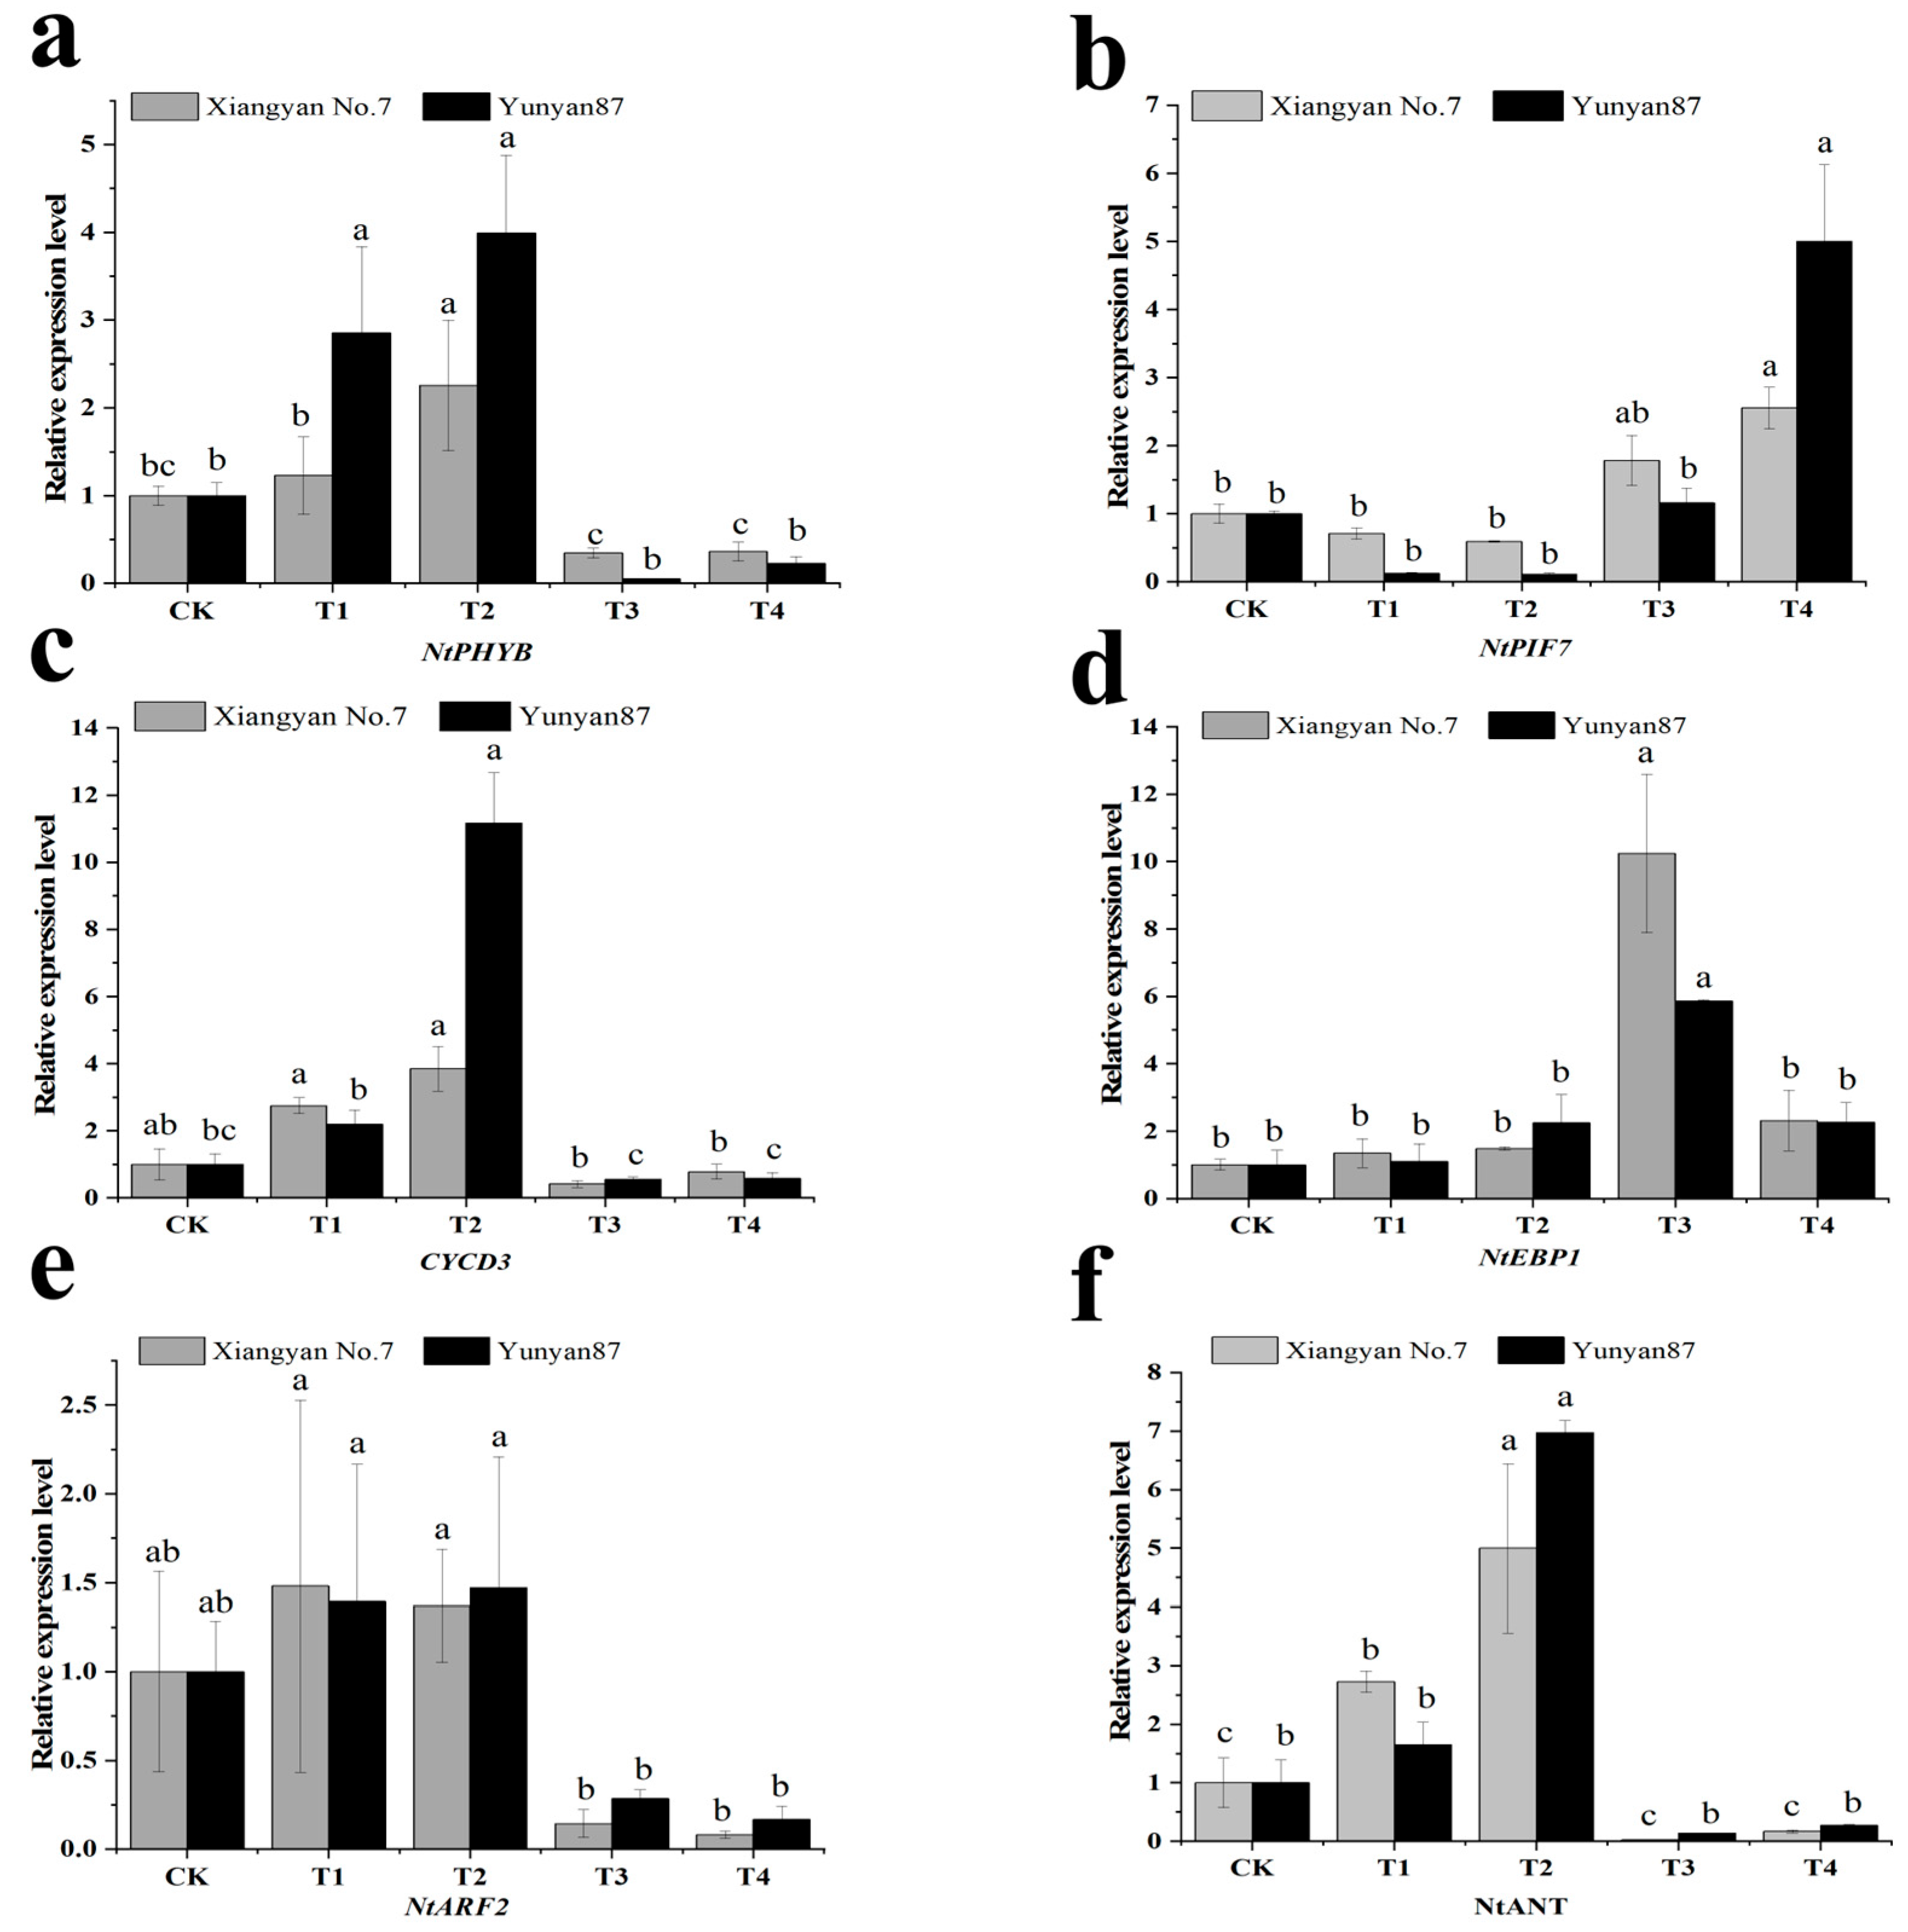
To investigate the impact of FR on the tobacco cell growth mechanisms, we performed an expression analysis of relevant genes, including the red/FR receptor NtPHYB and its downstream transcription factor NtPIF7, as well as genes related to cell expansion, namely, NtARF2, NtEBP1, NtCYCD3, and NtANT. The results showed that the expression of NtPHYB, NtCYCD3, NtARF2, and NtANT in tobacco seedlings was upregulated under T1 and T2 conditions, but downregulated under T3 and T4 conditions. However, not all treatments showed statistically significant differences. Specifically, under T1 treatment, the NtANT gene in the Xiangyan No.7 variety showed a significant increase, while the other three genes showed no significant differences. In the Yunyan87 variety, the NtPHYB gene showed a significant increase, while the other three genes showed no significant differences. Under T2 treatment, the NtPHYB and NtANT genes in the Xiangyan No.7 variety showed significant increases, while the other two genes showed no significant differences. And the NtPHYB, NtCYCD3, and NtANT genes of the Yunyan87 variety showed a significant increase, while the NtARF2 gene showed no significant difference. In the T3 treatment group, the expression levels of all four genes in both Xiangyan 7 and Yunyan 87 showed no statistically significant differences from those of CK. Under T4 treatment, there was no significant difference in the expression levels of four genes in the Xiangyan No.7 variety. Under T4 treatment, there were no significant differences in the expression levels of four genes in the Yunyan87 variety (Figure 8a,c,e,f). The NtPHYB gene expression in Xiangyan No.7 increased 2.32-fold under T2 compared with CK, and the NtPHYB gene expression in Yunyan87 increased 2.85-fold under T1 and 3.99-fold under T2 compared with CK. The NtCYCD3 gene expression of Yunyan87 increased 10.99-fold under T2 compared with CK. The NtANT gene expression of Xiangyan No.7 increased 2.71-fold under T1 and 5-fold under T2 compared with CK. The NtANT gene expression in Yunyan87 increased 6.97-fold under T2 compared with CK (Figure 8f). The results showed that the expression of NtPIF7 in tobacco seedlings was downregulated under T1 and T2 conditions and upregulated under T3 and T4 conditions, but not all treatments showed statistically significant differences. Specifically, there were no obvious differences in the expression of the NtPIF7 gene between the two varieties under T1, T2, and T3 treatments, while the expression of the NtPIF7 gene in both varieties significantly increased under T4 treatment (Figure 8b). The NtEBP1 gene expression of Xiangyan No.7 increased 10.24-fold under T3 compared with CK. The NtEBP1 gene expression of Yunyan87 increased 5.26-fold under T3 compared with CK. The expression of the NtEBP1 gene was upregulated in both tobacco seedlings under T3 treatment conditions (Figure 8d).

3.6. IAA Changes in Tobacco Seedlings Under Different Light Conditions

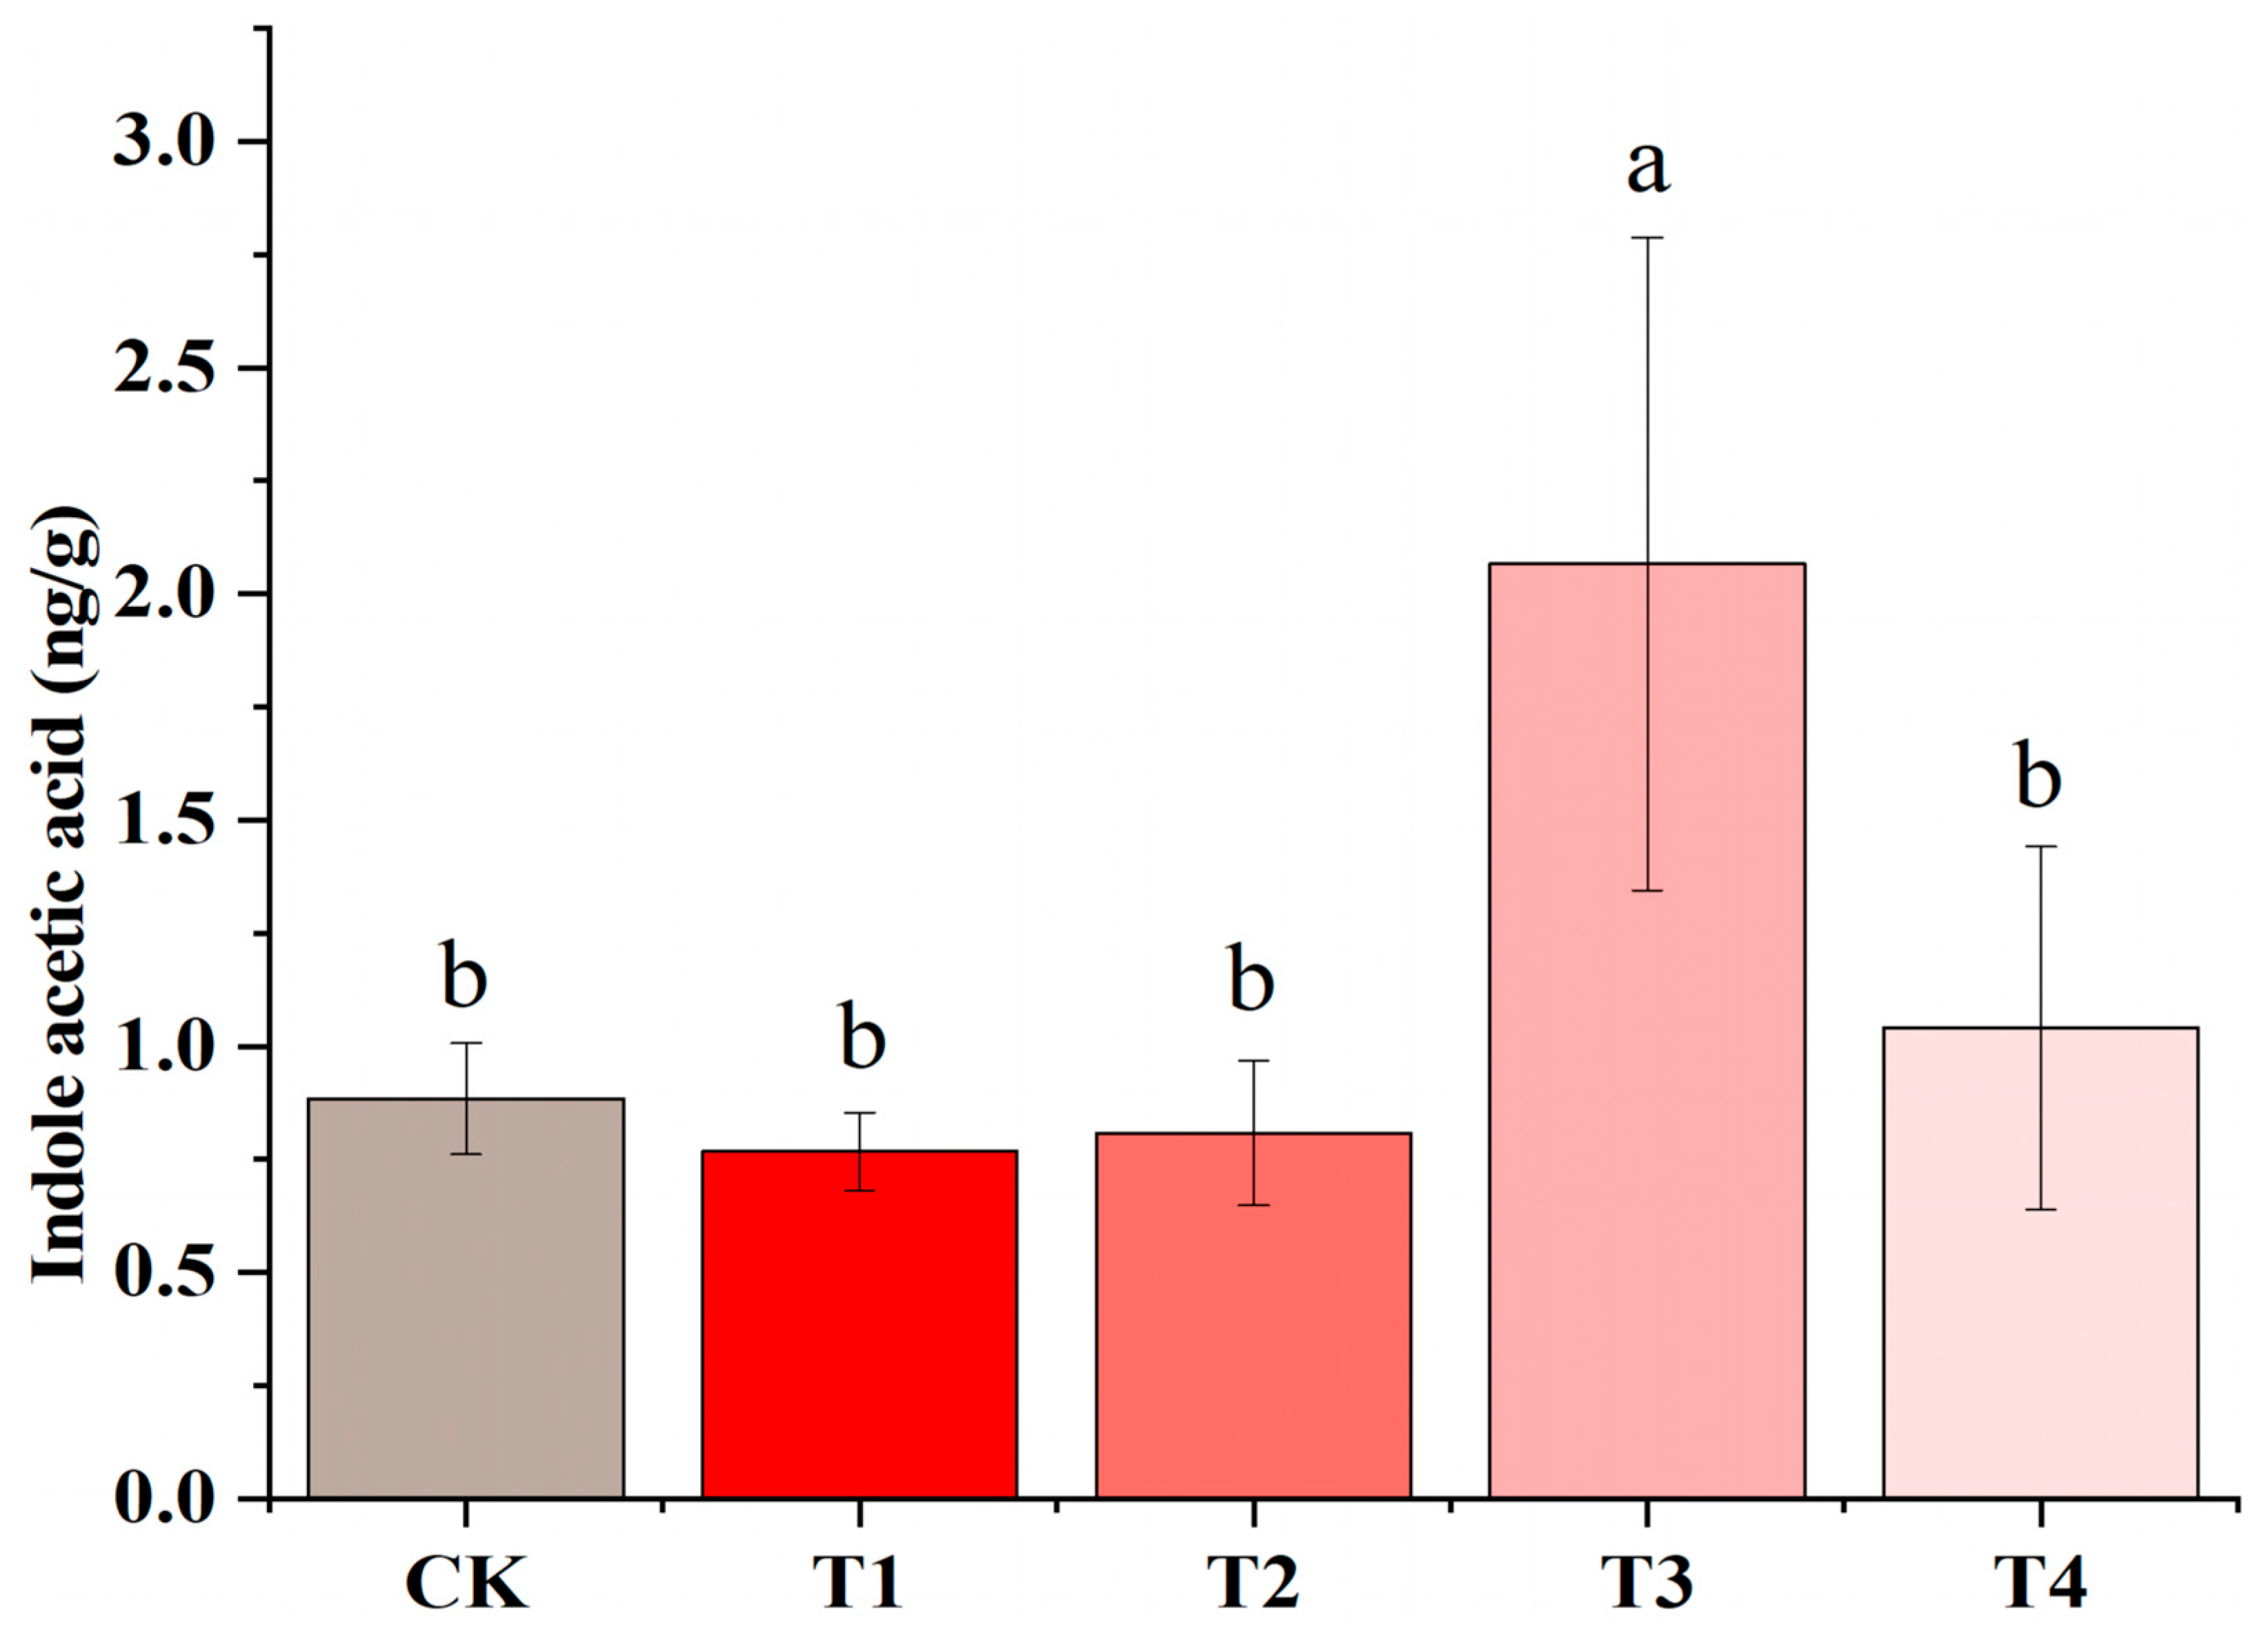
The IAA content was measured in the fourth leaf from the bottom of the tobacco seedlings. The results indicate that the tobacco IAA increased up to 133.6% under the far-red light treatment. Specifically, compared with CK, the auxin IAA content was significantly higher under T3 than under CK (Figure 9), indicating a potential promotion of auxin IAA synthesis by FR. However, the FR-rich T4 could not induce a significant increase in auxin, perhaps because of the difference in the ratio of red light to FR, which may have affected the distribution and activity of auxin and, consequently, the direction of plant growth and morphogenesis.

4. Discussion

Studies have shown that the shading response is mainly caused by a combination of reduced light intensity and increased levels of FR. Currently, research on the effects of FR on plants focuses on its effects on plant morphology and growth. However, a thorough investigation into how FR specifically affects the growth of tobacco leaves has not been undertaken. To elucidate the mechanism of FR on tobacco leaf growth, this study selected different tobacco varieties and set up different far-red light environments to clarify the physiological mechanism of far-red light on tobacco leaf growth, elucidate the mode of FR on tobacco leaf growth, and identify the key signaling pathways. This provided a basis for explaining the mechanism of the shade response and improving the tobacco planting density.

4.1. Leaf Area of Tobacco Seedlings Under Far-Red Light Was Reduced, and Thus, Inhibited Leaf Growth

In poorly lit vegetative environments with high FR, plants utilize the shade response as a crucial survival strategy to adapt and flourish. This response involves a notable decrease in leaf size, which is achieved by actively restraining the cell proliferation and/or expansion. Leaf size decrease is a distinctive feature in the shade response, enabling plants to effectively acclimate to their light-deprived surroundings and support their growth and development. Two different cellular strategies demonstrate that the shade response limits the leaf size [29]. The shade-induced restriction of cell division during early vegetative growth and the restriction of cell expansion during late vegetative growth are mainly due to the regulation of a number of major signaling channels by plant photoreceptors [20]. Far-red light had a significant effect on the size and morphological characteristics of tobacco plant leaves compared with white light and other light treatments. Our study showed that exposure to far-red light (T3 and T4) also resulted in smaller but thinner leaves, as the plants prioritized vertical growth over expanding their leaf surface area. This affected the overall photosynthetic efficiency of the plant, as smaller leaves are essential for capturing light and carrying out photosynthesis. This effect is part of the shade avoidance syndrome, where a plant reduces its leaf area to allow it to effectively adapt to light-poor environments and support its growth and development. Although the tobacco leaves in the T1 treatment group became larger, the leaves of tobacco grown under T2, where white light was also present, were significantly reduced. This was due to the lower R/FR ratio under T2 (R/FR = 8) and the highest R/FR ratio under T1 (R/FR = 24). The far-red light ratio under T2 had exceeded a threshold, which put it in the same “shade” environment. Similarly, although far-red light (T3 and T4) mostly resulted in a reduced leaf area, there were differences between T3 and T4. This was also caused by the higher R/FR ratio under T4 (R/FR = 1) compared with T3 (R/FR = 0.5). The T3 group was exposed to more far-red light, and its leaf area was also less. An additional point should be noted: the red-light peak of our experimental light source was observed at ≈625 nm, slightly below the canonical 660 nm value reported for PhyB in the literature. This deviation is not an experimental error but is attributable to measurement conditions. Figure 1 presents absorption spectra recorded from intact leaves with a portable spectrometer; leaf thickness, background chlorophyll absorption, and light scattering collectively induce a systematic blue-shift of ~10–15 nm, a phenomenon well documented in spectra of living tissues [35]. Importantly, the 640 nm red light still lies fully within PhyB’s effective absorption band (630–670 nm); hence, this shift has no substantive impact on our conclusions.
In the far-red light treatments (T3 and T4), we found a significant reduction in the fresh dry mass of leaves compared with the plants that underwent other light quality treatments, probably due to a shift in the allocation of resources to the stem and the height of the plant. We also found differences in the leaf development in two different tobacco varieties. For example, the leaf size of Xiangyan No.7 was increased under T1, while the leaf size of Yunyan87 was decreased under T1 (Figure 2b). This may have been due to the difference in the light requirement between the two tobaccos. Xiangyan No.7 has a strong shade tolerance as well as a wider range of adaptation to light intensity, and can grow better even under weaker light conditions. In contrast, Yunyan87 is less shade-tolerant and could not grow normally under weaker light conditions. In addition, we found that the difference in fresh dry mass was greater in Xiangyan No.7 than in Yunyan87 under T2, which indicates that the moisture content of Xiangyan No.7 was higher under this light quality treatment. This may have been because T2 (WL+R) had different effects on the water uptake and retention capacity of different tobacco varieties, and the same phenomenon was observed under T4 (WL+R+FR), probably for the same reason.

4.2. Significant Changes in Photosynthetic Characteristics of Tobacco Seedlings Under Far-Red Light

Decreased R/FR ratios resulted in reduced chlorophyll levels in maize leaves across various sampling periods under different N application conditions [36]. The changes in chlorophyll concentration are significant because chlorophyll is critical for absorbing, transmitting, and converting light energy. In addition, chlorophyll levels and components have a major impact on the light capacity of leaves, which is directly affected by their photosynthetic capacity. It was found that tomato plants irradiated with lower R/FR spectral irradiation showed a decrease in leaf area and chlorophyll levels, whereas their leaf thickness and fruit biomass increased. In addition, this type of spectral irradiation accelerated the flowering and fruiting of the tomato [37]. However, it was observed in soybean that shading or low-light conditions increased the accumulation of cyst-like granules and photosynthetic pigment content, and led to a decrease in the net photosynthesis rate [38]. The contents of photosynthetically active pigments in chrysanthemum leaves show a similar phenomenon [39]. Our study found that exposing tobacco leaves to far-red light (T3 and T4) significantly increased the chlorophyll a, chlorophyll b, and total chlorophyll contents, whereas the chlorophyll a, chlorophyll b, and total chlorophyll contents were reduced under red light (T1 and T2). This response to red versus far-red light is mainly driven by the following physiological mechanisms: (1) Plants perceive the ratio of red-to-far-red light through photosensitive pigments. Under the canopy or in the shade, red light is heavily absorbed by the leaves above, while far-red light penetrates more efficiently, resulting in a lower ratio of red-to-far-red light. Photopigments detect this change in light quality and shift from the active Pfr form to the inactive Pr form. This conformational change can promote the gene expression of chlorophyll synthase, thereby increasing chlorophyll synthesis. (2) Far-red light exposure also leads to the upregulation of genes essential for chlorophyll synthesis. This process is mediated through a photosensitive pigment system that affects transcription factors that promote or repress these genes. Increased chlorophyll content not only improves the plant’s photosynthetic capacity but also serves as a stress tolerance adaptation. These physiological responses are integrated into broader adaptive strategies of plants to optimize survival and growth under different light conditions. Chlorophylls a and b are two key photosynthetic pigments. Chlorophyll a acts as the primary photosynthetic pigment and is responsible for capturing light energy and transferring it to P680 in photosystem II (PSII) and P700 in photosystem I (PSI) to produce high-energy electrons [40]. Chlorophyll b, on the other hand, acts as a secondary pigment, which assists in the transfer of captured light energy to chlorophyll a to enhance the efficiency of photosynthesis [41,42]. The ratio of chlorophyll a to chlorophyll b influences chloroplast photosynthesis, with elevated FR levels commonly reducing this ratio in most plant species [38,43,44,45]. Reducing the Chl a/Chl b ratio increases the reducing capacity of 2,6-dichlorophenol indophenol, thus improving the photophosphorylation activity of chloroplasts [46]. Chlorophyll fluorescence results from changes in the energy levels of the chromophore moiety. Chlorophyll fluorescence is a key indicator of photosynthesis, reflecting the absorption, transfer, and loss of solar energy by plants [47,48]. An increased NPQ is an important photoprotective mechanism for plants under adverse conditions. Through the action of the lutein cycle and PsbS proteins, plants can dissipate excess light energy in the form of heat, thereby protecting photosystem II (PSII) from photodamage. Although an increased NPQ helps protect photosystems, this protective mechanism comes at the expense of photosynthetic efficiency. Under adverse conditions, plants dissipate excess light energy by increasing the NPQ, leading to a decrease in photochemical efficiency (PSII) and electron transfer rate (ETR), which ultimately reduces the photosynthetic efficiency [49]. This could be the reason why the NPQ of tobacco leaves was significantly reduced by the addition of far-red light under the unfavorable conditions of low light intensity (105 μmol m−2s−1).

4.3. Anatomical Analysis of Tobacco Seedlings Under Far-Red Light and Validation of Related Pathways

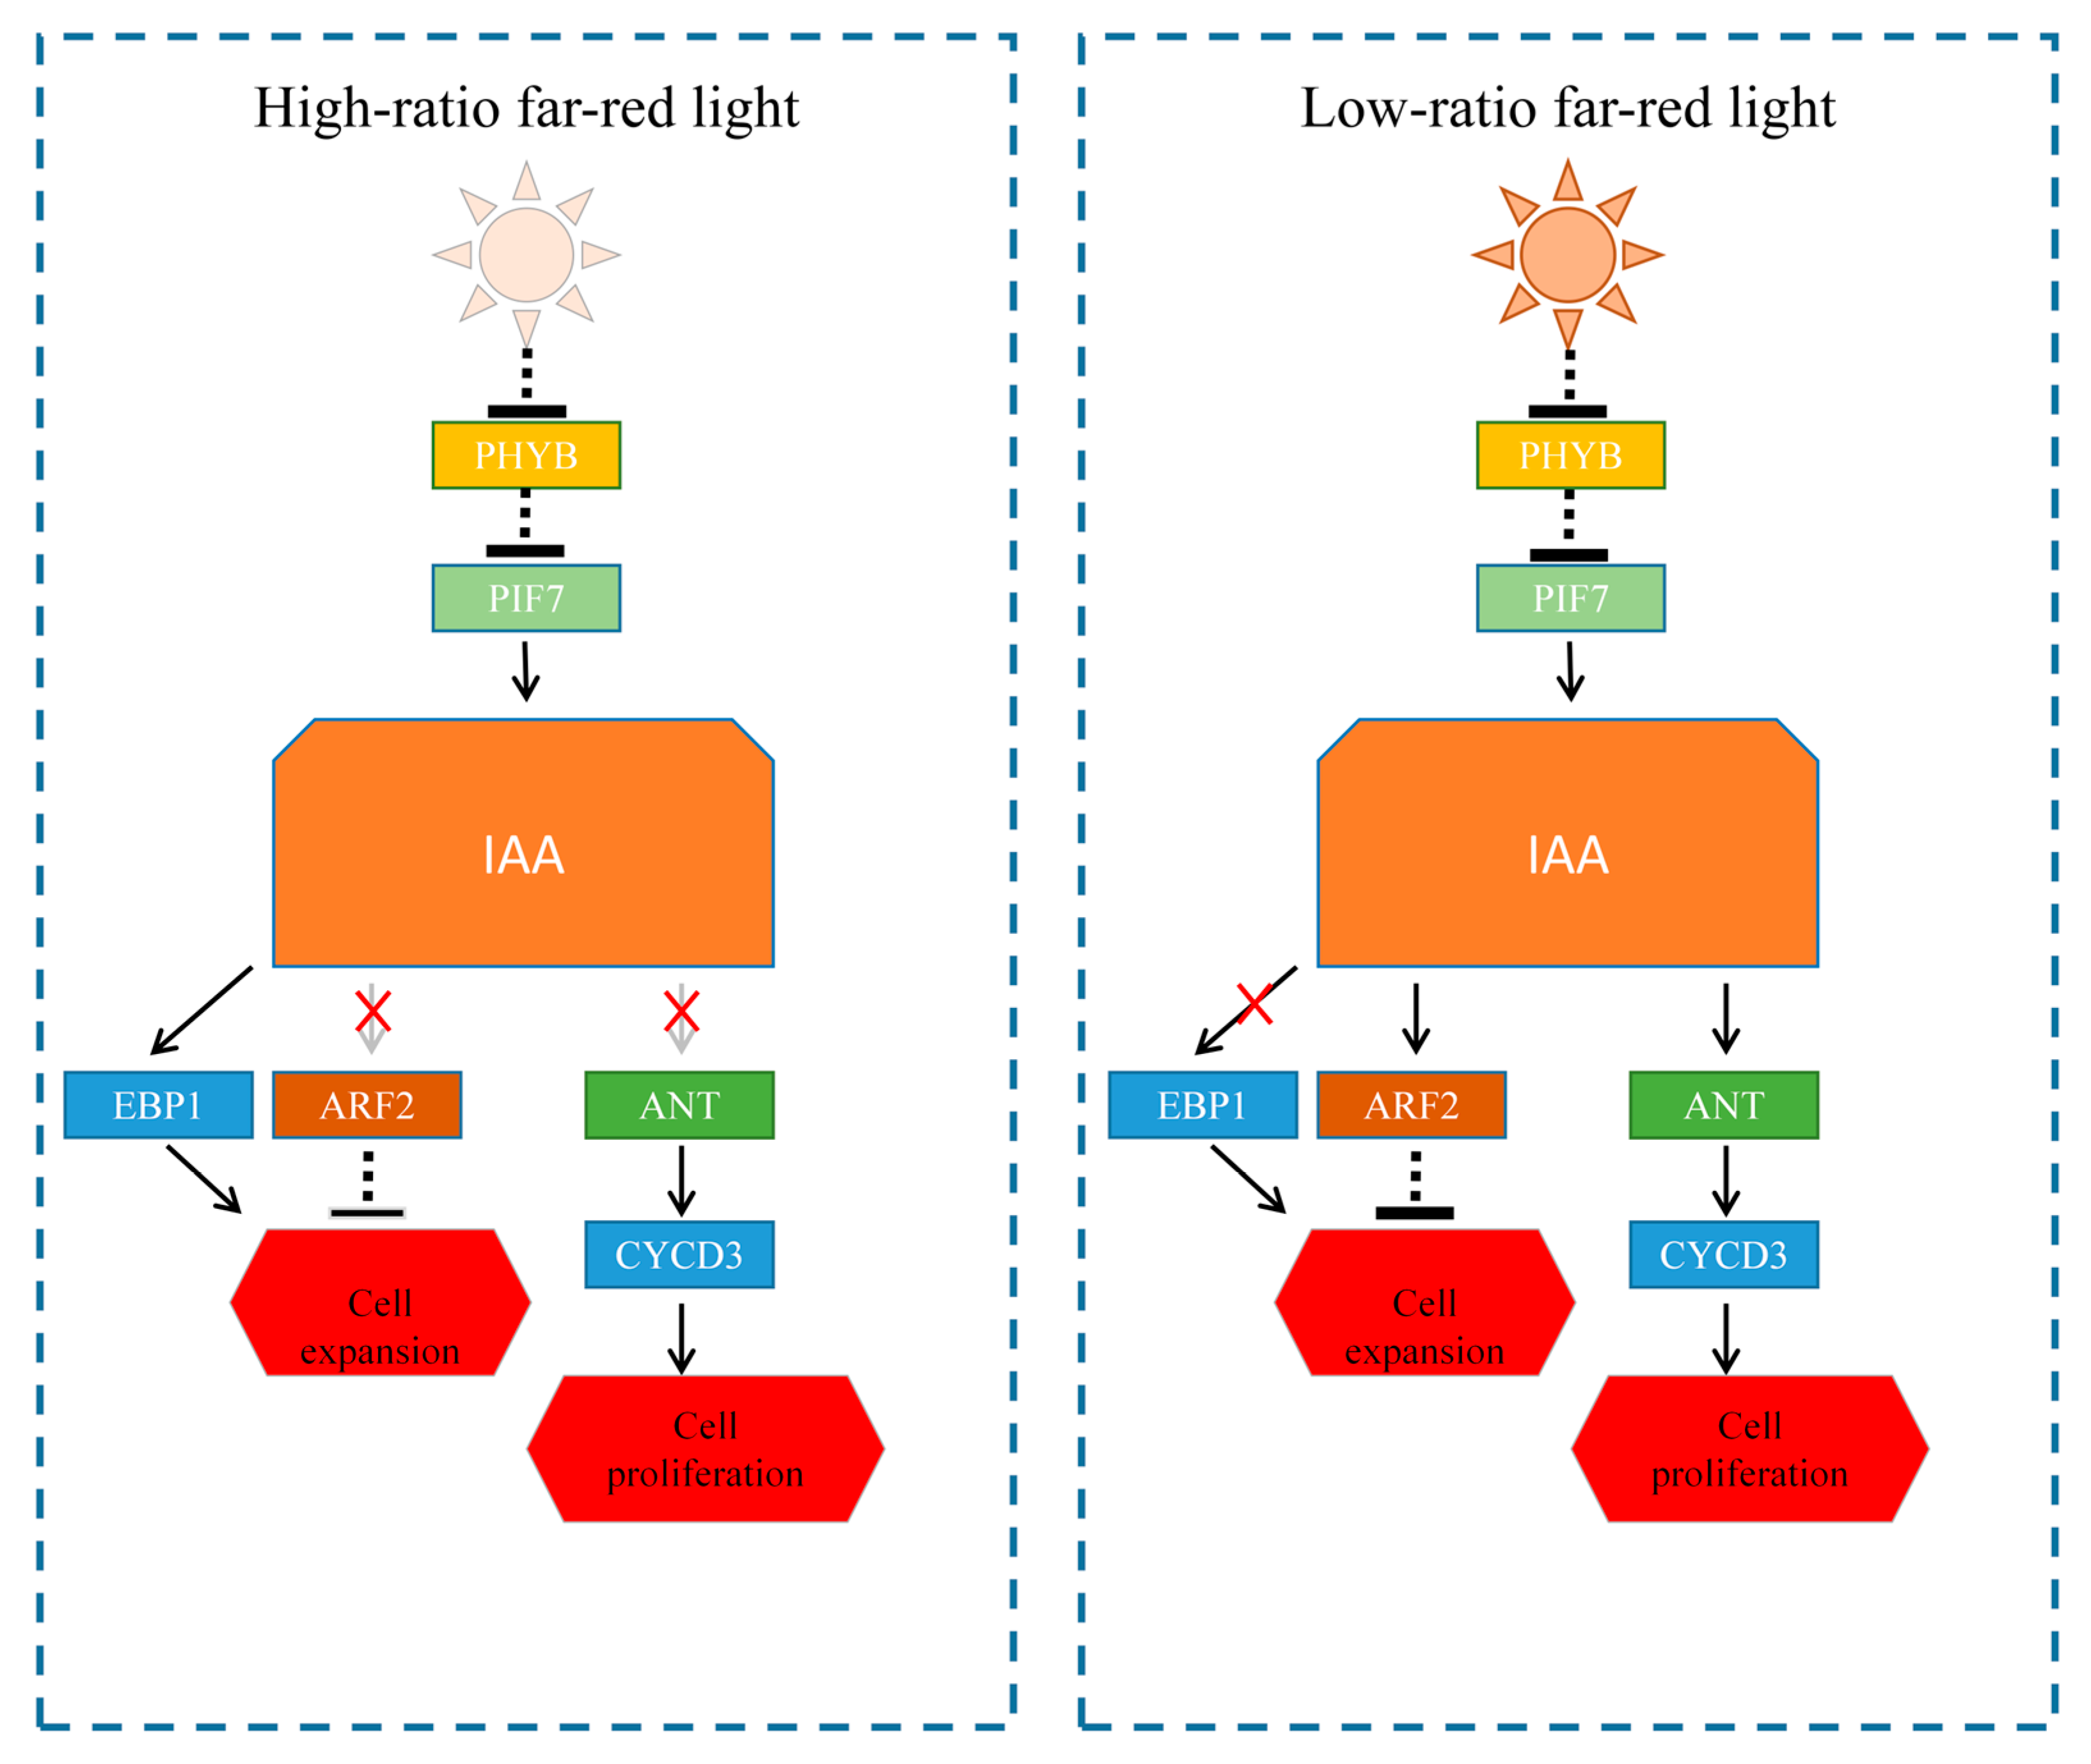
The leaves are the major location for photosynthesis in higher plants. Inside the leaf, the chloroplastic tissue regulates the light transport of photosynthesis. Plant leaves can change the structure of the chloroplastic tissue to adapt to different environments [50]. Many studies have shown that increasing FR increases the net photosynthetic rate but decreases the leaf thickness [7,11,19]. The possible reason for this may be that, under low-R/FR conditions, the cell size and cell number of the mesophyll tissue are reduced, thus lowering the leaf blade thickness [16,51]. In our study, we found that the spongy and fenestrated tissue thicknesses of tobacco leaves were significantly reduced under FR. However, the epidermal cell size of the tobacco leaves under FR was significantly increased, which seems to be different from the above studies. Therefore, to explain this phenomenon, we verified the genes and pathways involved in the cell proliferation and growth of tobacco leaves. Under shading conditions, a low R/FR ratio causes the photosensitive pigment PHYB to shift to an inactive state. As the amount of the inactive form of PHYB increases, its activity decreases, which decreases the repressive effect on the PIFs transcription factors. PIFs are activated and can promote the expression of growth-related genes, which enhances plant growth. It has been shown that PIF4 and PIF7 are major proteins that regulate thermomorphogenesis and the shade response, respectively [28,52]. At the same time, the addition of FR leads to the progressive inactivation of Arabidopsis PHYB, which increases the growth-promoting effect of the PIF7 transcription factor [53,54]. PIF7 regulates tobacco leaf growth through the typical pif–auxin (IAA) pathway. The IAA content in tobacco leaves was increased under FR (Figure 9). Auxin is one of the key hormones for plant growth and development and has an important effect on leaf growth and development. Auxin plays a central role in the morphogenesis of plant leaves. It regulates the unfolding of leaf primordia and affects the degree of leaf flattening, which, in turn, affects the efficiency of photosynthesis [55]. Auxin affects leaf cell division, elongation, and differentiation through its signaling pathways. For example, members of the ARF family regulate the expression of Auxin-responsive genes in leaves [55,56]. Auxin inhibits the expression of the ARF2 gene, which encodes an auxin-responsive transcription factor that regulates the organ size by inhibiting cell expansion [57]. The Auxin-induced expression of ARF2 in tobacco leaves under FR decreased, which, in turn, promoted cell expansion. The ANT gene was induced by Auxin and is involved in regulating organ size by modulating the cell number [58,59], but the activity of ANT was decreased under FR. Furthermore, its downstream response gene CYCD3 was also inhibited by FR. Auxin signaling could regulate organ size by modulating the stabilization of EBP1 associated with the expansion of cells [22]. EBP1 in tobacco leaves under FR was induced by Auxin, which, in turn, promoted cell expansion (Figure 10). In conclusion, low R/FR ratios converted PHYB to an inactive form, and PHYB inactivation reduced the repression of the transcription factor PIF7, which facilitated auxin synthesis through the typical pif–auxin (IAA) pathway. However, a low R/FR limited the proliferation of chloroplasts in the tobacco leaves by inhibiting the interaction of auxin on ANT and its downstream gene CYCD3, which, in turn, suppressed the leaf area and biomass. However, a low R/FR enhanced the expansion of epidermal cells in the tobacco leaves by promoting EBP1 and inhibiting ARF2, which may have been responsible for the changes in leaf shape. Our study demonstrated that far-red light restricted the growth of tobacco seedling leaves by inhibiting the cell number, but not the cell size, of the tobacco leaves. Meanwhile, the pathways by which far-red light affected tobacco leaf growth were predicted. This provides a theoretical basis for the effect of FR on tobacco leaf growth and the shading response.

5. Conclusions

Our study demonstrated for the first time that FR reduces the leaf size and alters the leaf shape by inhibiting cell proliferation rather than cell expansion in tobacco leaves. We verified that FR affects the relevant genes (NtPHYB, NtPIF7, NtCYCD3, NtEBP1, NtARF2, and NtANT) in tobacco growth signaling and preliminarily demonstrated that FR induced tobacco growth through the NtPHYB–NtPIF7–IAA signaling pathway. This finding provides a new perspective to elucidate how far-red light affects plant leaf growth and its response to shade conditions. Meanwhile, we propose the signaling pathway by which FR leads to changes in leaf growth, and we propose a model for the effect of FR on the growth and shade responsiveness of tobacco leaves. Understanding these light quality effects is critical for managing light environments in agriculture, especially in controlled environments, such as greenhouses, where the spectrum can be manipulated to influence crop growth and productivity.

Supplementary Materials

The following supporting information can be downloaded at https://www.mdpi.com/article/10.3390/plants14162520/s1, Figure S1: Changes in tobacco Plabs under different light treatments; Figure S2: Arachnograms of chlorophyll fluorescence parameters; Table S1: Tobacco seedling planting environment setting parameters; Table S2: Information and primers for tobacco homologues involved in leaf development and growth.

Author Contributions

Conceptualization, Z.Z. (Zhi Zhou) and Z.Z. (Zouguo Zeng); data curation, L.L.; formal analysis, S.G.; investigation, J.L., Z.Z. (Zouguo Zeng) and X.T.; methodology, S.G.; resources, Z.Z. (Zhi Zhou); validation, J.L.; writing—original draft, L.L., S.G., C.L. and X.T.; writing—review and editing, Z.Z. (Zhi Zhou). All authors have read and agreed to the published version of the manuscript.

Funding

This work was supported by the Natural Science Foundation of Hunan Province, China (grants 2023JJ40307 and 2024JJ3019), the Earmarked fund for China Agriculture Research System (CARS-01-27), Study and Demonstration of Tobacco Field Waste Resource Utilization in Hengyang Area (HYYC2023KJ31), Study and Application of Nitrogen-Controlled Release for Tobacco Based on Porous Adsorption and Novel Coating (CS2022KJ01), and the Hunan Optical Agriculture Engineering Technology Research Center (2018TP2003).

Data Availability Statement

All data supporting the findings of this study are available within the paper and its Supplementary Information.

Conflicts of Interest

The authors declare that they have no known competing financial interests or personal relationships that could have appeared to influence the work reported in this paper.

Abbreviations

SASBlindfold syndrome.
OJIP curveFast chlorophyll fluorescence induction curve.
FV/FMMaximum fluorescence ratio.
NPQNon-photochemical quenching of chlorophyll fluorescence.
QPQuantum yield of chlorophyll fluorescence.
PSIIOptical system II.

References

  1. He, L.; Xu, M.; Wang, W.; Liu, C.; Yu, L.; Liu, W.; Yang, W. The Interaction between Strigolactone and Auxin Results in the Negative Effect of Shading on Soybean Branching Development. Agronomy 2023, 13, 2383. [Google Scholar] [CrossRef]
  2. Islam, N.S. Maize ZmWRKY28: A target to regulate shade avoidance response under high planting density. J. Exp. Bot. 2023, 74, 2937–2939. [Google Scholar] [CrossRef]
  3. Pierik, R.; BallarÉ, C.L.; Dicke, M. Ecology of plant volatiles: Taking a plant community perspective. Plant Cell Environ. 2014, 37, 1845–1853. [Google Scholar] [CrossRef]
  4. Pierik, R.; de Wit, M. Shade avoidance: Phytochrome signalling and other aboveground neighbour detection cues. J. Exp. Bot. 2014, 65, 2815–2824. [Google Scholar] [CrossRef] [PubMed]
  5. Gómez-Ocampo, G.; Cascales, J.; Medina-Fraga, A.L.; Ploschuk, E.L.; Mantese, A.I.; Crocco, C.D.; Matsusaka, D.; Sánchez, D.H.; Botto, J.F. Transcriptomic and physiological shade avoidance responses in potato (Solanum tuberosum) plants. Physiol. Plant. 2023, 175, e13991. [Google Scholar] [CrossRef] [PubMed]
  6. Lyu, X.; Mu, R.; Liu, B. Shade avoidance syndrome in soybean and ideotype toward shade tolerance. Mol. Breed. 2023, 43, 31. [Google Scholar] [CrossRef]
  7. Park, Y.; Runkle, E.S. Far-red radiation promotes growth of seedlings by increasing leaf expansion and whole-plant net assimilation. Environ. Exp. Bot. 2017, 136, 41–49. [Google Scholar] [CrossRef]
  8. Zhen, S.; van Iersel, M.; Bugbee, B. Why Far-Red Photons Should Be Included in the Definition of Photosynthetic Photons and the Measurement of Horticultural Fixture Efficacy. Front. Plant Sci. 2021, 12, 693445. [Google Scholar] [CrossRef]
  9. Elias, E.; Oliver, T.J.; Croce, R. Oxygenic Photosynthesis in Far-Red Light: Strategies and Mechanisms. Annu. Rev. Phys. Chem. 2024, 75, 231–256. [Google Scholar] [CrossRef]
  10. Kong, J.; Zhao, Y.; Fan, P.; Wang, Y.; Xu, X.; Wang, L.; Li, S.; Duan, W.; Liang, Z.; Dai, Z. Far-red light modulates grapevine growth by increasing leaf photosynthesis efficiency and triggering organ-specific transcriptome remodelling. BMC Plant Biol. 2024, 24, 189. [Google Scholar] [CrossRef] [PubMed]
  11. Zhen, S.; van Iersel, M.W. Far-red light is needed for efficient photochemistry and photosynthesis. J. Plant Physiol. 2017, 209, 115–122. [Google Scholar] [CrossRef] [PubMed]
  12. Zou, J.; Zhang, Y.; Zhang, Y.; Bian, Z.; Fanourakis, D.; Yang, Q.; Li, T. Morphological and physiological properties of indoor cultivated lettuce in response to additional far-red light. Sci. Hortic. 2019, 257, 108725. [Google Scholar] [CrossRef]
  13. Zhen, S.; Haidekker, M.; van Iersel, M.W. Far-red light enhances photochemical efficiency in a wavelength-dependent manner. Physiol. Plant. 2018, 167, 21–33. [Google Scholar] [CrossRef]
  14. Huber, M.; de Boer, H.J.; Romanowski, A.; van Veen, H.; Buti, S.; Kahlon, P.S.; van der Meijden, J.; Koch, J.; Pierik, R. Far-red light enrichment affects gene expression and architecture as well as growth and photosynthesis in rice. Plant Cell Environ. 2024, 47, 2936–2953. [Google Scholar] [CrossRef]
  15. Lee, D.W.; Oberbauer, S.F.; Johnson, P.; Krishnapilay, B.; Mansor, M.; Mohamad, H.; Yap, S.K. Effects of irradiance and spectral quality on leaf structure and function in seedlings of two Southeast Asian Hopea (Dipterocarpaceae) species. Am. J. Bot. 2000, 87, 447–455. [Google Scholar] [CrossRef]
  16. Schuerger, A.C.; Brown, C.S.; Stryjewski, E.C. Anatomical features of pepper plants (Capsicum annuum L.) grown under red light-emitting diodes supplemented with blue or far-red light. Ann. Bot. 1997, 79, 273–282. [Google Scholar] [CrossRef]
  17. Sims, D.A.; Pearcy, R.W. Response of leaf anatomy and photosynthetic capacity in Alocasia macrorrhiza (Araceae) to a transfer from low to high light. Am. J. Bot. 1992, 79, 449–455. [Google Scholar] [CrossRef]
  18. Han, R.; Ma, L.; Lv, Y.; Qi, L.; Peng, J.; Li, H.; Zhou, Y.; Song, P.; Duan, J.; Li, J.; et al. SALT OVERLY SENSITIVE2 stabilizes phytochrome-interacting factors PIF4 and PIF5 to promote Arabidopsis shade avoidance. Plant Cell 2023, 35, 2972–2996. [Google Scholar] [CrossRef]
  19. Zhang, Y.-t.; Zhang, Y.-q.; Yang, Q.-c.; Li, T. Overhead supplemental far-red light stimulates tomato growth under intra-canopy lighting with LEDs. J. Integr. Agric. 2019, 18, 62–69. [Google Scholar] [CrossRef]
  20. Romanowski, A.; Furniss, J.J.; Hussain, E.; Halliday, K.J. Phytochrome regulates cellular response plasticity and the basic molecular machinery of leaf development. Plant Physiol. 2021, 186, 1220–1239. [Google Scholar] [CrossRef] [PubMed]
  21. Uzair, M.; Long, H.; Zafar, S.A.; Patil, S.B.; Chun, Y.; Li, L.; Fang, J.; Zhao, J.; Peng, L.; Yuan, S.; et al. Narrow Leaf21, encoding ribosomal protein RPS3A, controls leaf development in rice. Plant Physiol. 2021, 186, 497–518. [Google Scholar] [CrossRef]
  22. Horváth, B.M.; Magyar, Z.; Zhang, Y.; Hamburger, A.W.; Bakó, L.; Visser, R.G.F.; Bachem, C.W.B.; Bögre, L. EBP1 regulates organ size through cell growth and proliferation in plants. EMBO J. 2006, 25, 4909–4920. [Google Scholar] [CrossRef]
  23. Li, Y.J.; Yu, Y.; Liu, X.; Zhang, X.S.; Su, Y.H. The Arabidopsis MATERNAL EFFECT EMBRYO ARREST45 protein modulates maternal auxin biosynthesis and controls seed size by inducing AINTEGUMENTA. Plant Cell 2021, 33, 1907–1926. [Google Scholar] [CrossRef]
  24. Dewitte, W.; Scofield, S.; Alcasabas, A.A.; Maughan, S.C.; Menges, M.; Braun, N.; Collins, C.; Nieuwland, J.; Prinsen, E.; Sundaresan, V.; et al. Arabidopsis CYCD3 D-type cyclins link cell proliferation and endocycles and are rate-limiting for cytokinin responses. Proc. Natl. Acad. Sci. USA 2007, 104, 14537–14542. [Google Scholar] [CrossRef]
  25. Sharma, A.; Samtani, H.; Sahu, K.; Sharma, A.K.; Khurana, J.P.; Khurana, P. Functions of Phytochrome-Interacting Factors (PIFs) in the regulation of plant growth and development: A comprehensive review. Int. J. Biol. Macromol. 2023, 244, 125234. [Google Scholar] [CrossRef]
  26. Kim, C.; Kwon, Y.; Jeong, J.; Kang, M.; Lee, G.S.; Moon, J.H.; Lee, H.-J.; Park, Y.-I.; Choi, G. Phytochrome B photobodies are comprised of phytochrome B and its primary and secondary interacting proteins. Nat. Commun. 2023, 14, 1708. [Google Scholar] [CrossRef]
  27. Hussain, E.; Romanowski, A.; Halliday, K.J. PIF7 controls leaf cell proliferation through an AN3 substitution repression mechanism. Proc. Natl. Acad. Sci. USA 2022, 119, e2115682119. [Google Scholar] [CrossRef]
  28. Burko, Y.; Willige, B.C.; Seluzicki, A.; Novák, O.; Ljung, K.; Chory, J. PIF7 is a master regulator of thermomorphogenesis in shade. Nat. Commun. 2022, 13, 4942. [Google Scholar] [CrossRef]
  29. Wu, Y.; Gong, W.; Yang, W. Shade Inhibits Leaf Size by Controlling Cell Proliferation and Enlargement in Soybean. Sci. Rep. 2017, 7, 9259. [Google Scholar] [CrossRef]
  30. Zou, Y.; Li, R.; Baldwin, I.T. ZEITLUPE is required for shade avoidance in the wild tobacco Nicotiana attenuata. J. Integr. Plant Biol. 2020, 62, 1341–1351. [Google Scholar] [CrossRef]
  31. Guo, H.; Dong, Q.; Li, S.; Cha, X.; Sun, L.; Duan, H.; Li, S.; Jin, Y.; Zhang, M. Effects of exogenous calcium on growth, chlorophyll fluorescence characteristics and antioxidant system of Fraxinus malacophylla seedlings. Plant Physiol. Biochem. 2023, 201, 107860. [Google Scholar] [CrossRef]
  32. Li, J.; Zhou, X.; Zhou, J.; Shang, R.; Wang, Y.; Jing, P. Comparative Study on Several Determination Methods of Chlorophyll Content in Plants. IOP Conf. Ser. Mater. Sci. Eng. 2020, 730, 012066. [Google Scholar] [CrossRef]
  33. Zhou, Z.; Feng, S.; Gai, S.; Gao, P.; Xu, C.; Xia, M.; Tang, W.; Lu, X. Affordable phosphor-converted LEDs with specific light quality facilitate the tobacco seedling growth with low energy consumption in Industrial Seedling Raising. J. Photochem. Photobiol. B Biol. 2022, 235, 112564. [Google Scholar] [CrossRef]
  34. Livak, K.J.; Schmittgen, T.D. Analysis of Relative Gene Expression Data Using Real-Time Quantitative PCR and the 2−ΔΔCT Method. Methods 2001, 25, 402–408. [Google Scholar] [CrossRef]
  35. Stone, W.L.; Dratz, E.A. Visual photoreceptors. Photochem. Photobiol. 1977, 26, 79–85. [Google Scholar] [CrossRef] [PubMed]
  36. Wei, B.; Song, Z.; Wang, S.; Sang, S.; Li, F.; Wang, Z.; Yang, J. Effects of period of nitrogen application and R/FR ratio on growth physiological traits and yield of maize. Chin. Agric. Sci. Bull. 2018, 34, 10–18. [Google Scholar]
  37. Kim, H.-J.; Lin, M.-Y.; Mitchell, C.A. Light spectral and thermal properties govern biomass allocation in tomato through morphological and physiological changes. Environ. Exp. Bot. 2019, 157, 228–240. [Google Scholar] [CrossRef]
  38. Yang, F.; Feng, L.; Liu, Q.; Wu, X.; Fan, Y.; Raza, M.A.; Cheng, Y.; Chen, J.; Wang, X.; Yong, T.; et al. Effect of interactions between light intensity and red-to- far-red ratio on the photosynthesis of soybean leaves under shade condition. Environ. Exp. Bot. 2018, 150, 79–87. [Google Scholar] [CrossRef]
  39. Wang, Z.; Liu, W.; He, S.; He, D.; Shang, W.; Song, Y. Effects of different light quality ratios of LED red/blue light on growth and antioxidant enzyme activities of Photinia fraseri plantlets in vitro. J. Northwest A F Univ. Nat. Sci. Ed. 2018, 46, 49–56. [Google Scholar]
  40. Garab, G.; Magyar, M.; Sipka, G.; Lambrev, P.H.; Dietz, K.-J. New foundations for the physical mechanism of variable chlorophyll a fluorescence. Quantum efficiency versus the light-adapted state of photosystem II. J. Exp. Bot. 2023, 74, 5458–5471. [Google Scholar] [CrossRef]
  41. Ebrahimi, P.; Shokramraji, Z.; Tavakkoli, S.; Mihaylova, D.; Lante, A. Chlorophylls as Natural Bioactive Compounds Existing in Food By-Products: A Critical Review. Plants 2023, 12, 1533. [Google Scholar] [CrossRef] [PubMed]
  42. Zhang, Y.; Huang, J.; Wang, F.; Blackburn, G.A.; Zhang, H.K.; Wang, X.; Wei, C.; Zhang, K.; Wei, C. An extended PROSPECT: Advance in the leaf optical properties model separating total chlorophylls into chlorophyll a and b. Sci. Rep. 2017, 7, 6429. [Google Scholar] [CrossRef]
  43. Kalaitzoglou, P.; van Ieperen, W.; Harbinson, J.; van der Meer, M.; Martinakos, S.; Weerheim, K.; Nicole, C.C.S.; Marcelis, L.F.M. Effects of Continuous or End-of-Day Far-Red Light on Tomato Plant Growth, Morphology, Light Absorption, and Fruit Production. Front. Plant Sci. 2019, 10, 322. [Google Scholar] [CrossRef]
  44. Wientjes, E.; Philippi, J.; Borst, J.W.; van Amerongen, H. Imaging the Photosystem I/Photosystem II chlorophyll ratio inside the leaf. Biochim. Biophys. Acta BBA Bioenerg. 2017, 1858, 259–265. [Google Scholar] [CrossRef]
  45. Zhang, Y.; Liao, B.; Li, F.; Eneji, A.E.; Du, M.; Tian, X. Correction: Growth, leaf anatomy, and photosynthesis of cotton (Gossypium hirsutum L.) seedlings in response to four light-emitting diodes and high pressure sodium lamp. J. Cotton Res. 2024, 7, 8. [Google Scholar] [CrossRef]
  46. Ritter, M.; Oetama, V.S.P.; Schulze, D.; Muetzlaff, K.; Meents, A.K.; Seidel, R.A.; Görls, H.; Westerhausen, M.; Boland, W.; Pohnert, G. Pyrrolic and Dipyrrolic Chlorophyll Degradation Products in Plants and Herbivores. Chemistry 2020, 26, 6205–6213. [Google Scholar] [CrossRef]
  47. Keller, B.; Vass, I.; Matsubara, S.; Paul, K.; Jedmowski, C.; Pieruschka, R.; Nedbal, L.; Rascher, U.; Muller, O. Maximum fluorescence and electron transport kinetics determined by light-induced fluorescence transients (LIFT) for photosynthesis phenotyping. Photosynth. Res. 2018, 140, 221–233. [Google Scholar] [CrossRef]
  48. Magney, T.S.; Bowling, D.R.; Logan, B.A.; Grossmann, K.; Stutz, J.; Blanken, P.D.; Burns, S.P.; Cheng, R.; Garcia, M.A.; Köhler, P.; et al. Mechanistic evidence for tracking the seasonality of photosynthesis with solar-induced fluorescence. Proc. Natl. Acad. Sci. USA 2019, 116, 11640–11645. [Google Scholar] [CrossRef] [PubMed]
  49. Ruan, M.; Zhu, X.; Weng, Y. NPQ regulation mechanism and optimization of light harvesting complex in higher plants. Chin. Bull. Life Sci. 2024, 36, 1149–1159. [Google Scholar] [CrossRef]
  50. Liu, W.; Zheng, L.; Qi, D. Variation in leaf traits at different altitudes reflects the adaptive strategy of plants to environmental changes. Ecol. Evol. 2020, 10, 8166–8175. [Google Scholar] [CrossRef] [PubMed]
  51. Saini, K.; Dwivedi, A.; Ranjan, A. High temperature restricts cell division and leaf size by coordination of PIF4 and TCP4 transcription factors. Plant Physiol. 2022, 190, 2380–2397. [Google Scholar] [CrossRef]
  52. Wang, P.; Abid, M.A.; Qanmber, G.; Askari, M.; Zhou, L.; Song, Y.; Liang, C.; Meng, Z.; Malik, W.; Wei, Y.; et al. Photomorphogenesis in plants: The central role of phytochrome interacting factors (PIFs). Environ. Exp. Bot. 2022, 194, 104704. [Google Scholar] [CrossRef]
  53. Leivar, P.; Monte, E.; Al-Sady, B.; Carle, C.; Storer, A.; Alonso, J.M.; Ecker, J.R.; Quail, P.H. The Arabidopsis phytochrome-interacting factor PIF7, together with PIF3 and PIF4, regulates responses to prolonged red light by modulating phyB levels. Plant Cell 2008, 20, 337–352. [Google Scholar] [CrossRef] [PubMed]
  54. Xie, Y.; Liu, W.; Liang, W.; Ling, X.; Ma, J.; Yang, C.; Li, L. Phytochrome B inhibits the activity of phytochrome-interacting factor 7 involving phase separation. Cell Rep. 2023, 42, 113562. [Google Scholar] [CrossRef]
  55. Guan, C.; Wu, B.; Yu, T.; Wang, Q.; Krogan, N.T.; Liu, X.; Jiao, Y. Spatial Auxin Signaling Controls Leaf Flattening in Arabidopsis. Curr. Biol. 2017, 27, 2940–2950.e4. [Google Scholar] [CrossRef] [PubMed]
  56. Zhao, Z.; Wang, C.; Yu, X.; Tian, Y.; Wang, W.; Zhang, Y.; Bai, W.; Yang, N.; Zhang, T.; Zheng, H.; et al. Auxin regulates source-sink carbohydrate partitioning and reproductive organ development in rice. Dev. Biol. 2022, 119, e2121671119. [Google Scholar] [CrossRef] [PubMed]
  57. Schruff, M.C.; Spielman, M.; Tiwari, S.; Adams, S.; Fenby, N.; Scott, R.J. The AUXIN RESPONSE FACTOR 2 gene of Arabidopsis links auxin signalling, cell division, and the size of seeds and other organs. Development 2006, 133, 251–261. [Google Scholar] [CrossRef]
  58. Krizek, B.A.; Blakley, I.C.; Ho, Y.Y.; Freese, N.; Loraine, A.E. The Arabidopsis transcription factor AINTEGUMENTA orchestrates patterning genes and auxin signaling in the establishment of floral growth and form. Plant J. 2020, 103, 752–768. [Google Scholar] [CrossRef]
  59. Krizek, B.A. Ectopic expression of AINTEGUMENTA in Arabidopsis plants results in increased growth of floral organs. Dev. Genet. 1999, 25, 224–236. [Google Scholar] [CrossRef]
Figure 1. Spectrogram of the LED: WL, R, WL+R, WL+FR, and WL+R+FR. Measurements were obtained using the SPIC-200 spectral chromaticity illuminance meter.
Plants 14 02520 g001
Figure 2. Differences in the leaf morphologies of two tobacco species under different light conditions. (a) Photographs of the 3rd, 4th, and 5th leaf blades of representative (i) Xiangyan No.7 and (ii) Yunyan87 seedlings grown under different treatments. (b) The effect of varying light conditions on the leaf area of Xiangyan No.7 and Yunyan87 tobaccos. (c) The leaf blade aspect ratios of the Xiangyan No.7 and Yunyan87 tobaccos under different light conditions, where different letters indicate that there was significant variation between the treatments (p < 0.05).
Plants 14 02520 g002
Figure 3. Analysis results of differences in fresh (a) and dry masses (b) of tobacco seedlings under different light conditions. Different letters indicate that there was a significant variation between the treatments (p < 0.05).
Plants 14 02520 g003
Figure 4. (a) Chlorophyll a content; (b) chlorophyll b content; (c) difference in total chlorophyll content; and (d) the ratio of chlorophyll a to chlorophyll b of Xiangyan No.7 and Yunyan87 under different spectral irradiations; different letters denote significant differences between the treatments (p < 0.05).
Plants 14 02520 g004
Figure 5. (a) OJIP curve of Xiangyan No.7 under different light quality conditions; (b) OJIP curve of Yunyan87 under different light quality conditions; (c) FV/FM; (d) NPQ; (e) QP. Different letters indicate that the treatments were significantly different from each other (p < 0.05).
Plants 14 02520 g005
Figure 6. Differences in the tobacco leaf surface cells and stomata under different spectral irradiations. (a) Photographs of epidermal cells of tobacco seedlings of Xiangyan No.7 (i) and Yunyan87 (ii) under different spectral treatments; (b) the cell number of epidermal cells in tobacco leaves exposed to various spectral treatments; (c) the stomatal conductance of leaf peridermal cells under different light spectrum processing; (d) the size of tobacco leaf epidermal cells under various spectral treatments. Different letters indicate that there was a significant variation between the treatments (p < 0.05).
Plants 14 02520 g006
Figure 7. (a) Leaf cross-section images of Xiangyan No.7 (i) and Yunyan87 (ii) seedlings under different spectra. (b) Leaf thickness of tobacco seedlings under different light conditions. (c) Barred tissue thickness. (d) Spongy tissue thickness. (e) Quantitative analysis results of the spongy tissue thickness/leaf thickness. Different letters indicate significant differences (p < 0.05) between the treatments.
Plants 14 02520 g007
Figure 8. Expression levels of six cell proliferation/enlargement genes under different light treatments. The expression levels were normalized with respect to the internal reference gene NtActin and are shown relative to the unity value of CK. (a) NtPHYB, (b) NtPIF7, (c) NtCYCD3, (d) NtEBP1, (e) NtARF2, and (f) NtANT. Different letters on the error bars indicate a significant difference between the treatments (p < 0.05).
Plants 14 02520 g008
Figure 9. Effects of different light treatments on auxin (IAA) in Yunyan87 leaves. Different letters indicate that there was a significant variation between the treatments (p < 0.05).
Plants 14 02520 g009
Figure 10. Predicted mechanisms of cell proliferation and expansion with different FR ratios. ↓ is positive regulation, Plants 14 02520 i001 is negative regulation.
Plants 14 02520 g010
Disclaimer/Publisher’s Note: The statements, opinions and data contained in all publications are solely those of the individual author(s) and contributor(s) and not of MDPI and/or the editor(s). MDPI and/or the editor(s) disclaim responsibility for any injury to people or property resulting from any ideas, methods, instructions or products referred to in the content.