Article

Screening of qPCR Reference Genes in Quinoa Under Cold, Heat, and Drought Gradient Stress

Department of Biology, Xinzhou Normal University, Xinzhou 034000, China
*
Author to whom correspondence should be addressed.
Plants 2025, 14(15), 2434; https://doi.org/10.3390/plants14152434
Submission received: 9 July 2025 / Revised: 2 August 2025 / Accepted: 3 August 2025 / Published: 6 August 2025
(This article belongs to the Section Plant Response to Abiotic Stress and Climate Change)

Abstract

Quinoa (Chenopodium quinoa), a stress-tolerant pseudocereal ideal for studying abiotic stress responses, was used to systematically identify optimal reference genes for qPCR normalization under gradient stresses: low temperatures (LT group: −2 °C to −10 °C), heat (HT group: 39° C to 45 °C), and drought (DR group: 7 to 13 days). Through multi-algorithm evaluation (GeNorm, NormFinder, BestKeeper, the ΔCt method, and RefFinder) of eleven candidates, condition-specific optimal genes were established as ACT16 (Actin), SAL92 (IT4 phosphatase-associated protein), SSU32 (Ssu72-like family protein), and TSB05 (Tryptophan synthase beta-subunit 2) for the LT group; ACT16 and NRP13 (Asparagine-rich protein) for the HT group; and ACT16, SKP27 (S-phase kinase), and NRP13 for the DR group, with ACT16, NRP13, WLIM96 (LIM domain-containing protein), SSU32, SKP27, SAL92, and UBC22 (ubiquitin-conjugating enzyme E2) demonstrating cross-stress stability (global group). DHDPS96 (dihydrodipicolinate synthase) and EF03 (translation elongation factor) showed minimal stability. Validation using stress-responsive markers—COR72 (LT), HSP44 (HT), COR413-PM (LT), and DREB12 (DR)—confirmed reliability; COR72 and COR413-PM exhibited oscillatory cold response patterns, HSP44 peaked at 43 °C before declining, and DREB12 showed progressive drought-induced upregulation. Crucially, normalization with unstable genes (DHDPS96 and EF03) distorted expression profiles. This work provides validated reference standards for quinoa transcriptomics under abiotic stresses.

1. Introduction

Low temperatures, heat, and drought are major abiotic stresses that adversely affect crop growth and productivity by disrupting physiological, biochemical, and molecular processes, ultimately leading to reduced yield and quality [1,2]. Quinoa (Chenopodium quinoa Willd) exhibits notable tolerance to various abiotic stresses, conferring a degree of adaptability to extreme environments [3]. Despite this tolerance, low temperature, heat, and drought can still impose complex constraints on quinoa’s growth, physiology, and yield. Furthermore, quinoa is valued for its high protein content and balanced nutritional profile, including beneficial lipids, and for supplying sufficient amounts of all essential amino acids, including lysine, which is often limited in plant proteins [4]. Molecular investigations into quinoa have multiplied following the assembly and annotation of its reference genome [5,6,7]. The combination of quinoa’s nutritional excellence and relative resilience under challenging climatic and soil conditions highlights its significant potential for expanded production worldwide [4]. Understanding the molecular mechanisms underlying quinoa’s stress responses is crucial for harnessing this potential. However, stable reference genes must be identified and validated to conduct reliable gene expression studies under abiotic stress conditions. To date, no such validation of reference genes has been reported for gradient abiotic stress expression studies in C. quinoa.
The development of next-generation sequencing (NGS) technology has made it simpler and faster to analyze mRNA distribution and expression levels in the biosynthetic pathways of this plant [8]. In addition, another analysis method, quantitative real-time PCR (qPCR), is widely used in gene expression research due to its high sensitivity, quantitative accuracy, throughput capability, and low cost when using specific reference genes [9,10,11]. However, quantitative results can be influenced by many factors, such as genomic DNA contamination, RNA quality, primer specificity, and amplification efficiency [12]. To guarantee accurate results and minimize errors, using one or more stable and appropriate reference genes is essential. Ideally, reference gene expression should remain constant or vary minimally across tissues under different experimental treatments. However, it has been shown that the utility of reference genes must be validated for specific experimental conditions [13] and that normalization against a non-validated reference gene can compromise quantitative results [14]. Screening for adequate reference genes can be performed using statistical algorithms developed for this purpose. Scientists have developed several methods for systematic verification of reference genes, such as NormFinder [15], BestKeeper [16], geNorm [17], the ΔCt method [18], and RefFinder (http://blooge.cn/RefFinder/, accessed on 9 June 2025). [19,20], which integrate information on the expression of candidate reference genes and measure their relative stability. geNorm calculates an average expression stability value, defined as the average pairwise variation of a particular gene compared with all other potential reference genes. NormFinder identifies stably expressed genes based on a mathematical model that estimates both intra- and inter-group variation within the sample set. BestKeeper calculates the standard deviation (SD) and coefficient of variance (CV) as measures of stability. Reference genes suitable for different experimental conditions have been identified using these algorithms for a variety of crops, such as lettuce [21], pea [22], barley [23], okra [24], peach [13], Dendrobium huoshanense [25], maize [26], rice [27], Ananas comosus var. [28], garlic [29], and centipedegrass [30].
Based on transcriptome sequencing results and reported reference genes from other species, we selected eleven candidate reference genes belonging to two categories, including (1) seven genes with a low coefficient of variation (CV) screened from transcriptome data, namely IT4 phosphatase-associated protein (SAL), asparagine-rich protein (NRP), dihydrodipicolinate synthase 2 (DHDPS), LIM domain-containing protein (WLIM), S-phase kinase-associated protein (SKP), tryptophan synthase beta-subunit 2 (TSB), and Ssu72-like family protein (SSU), and (2) four traditional housekeeping genes involved in basic cellular processes and often reported to have stable expression, namely β-actin (ACT), ubiquitin-conjugating enzyme (UBC), and translation elongation factor (EF). The expression stability of these candidates in quinoa seedling leaves subjected to low temperature, heat, and drought treatments was assessed using the statistical algorithms geNorm, NormFinder, and BestKeeper and the ΔCt method. The online tool RefFinder was then employed to generate a comprehensive stability ranking. Finally, the selected reference genes’ reliability was validated through expression profiling analysis of target genes. This study aimed to identify suitable reference genes for molecular studies of abiotic stress responses in quinoa.

2. Results

2.1. Primer Specificity and Amplification Efficiency of Candidate Reference Genes

Based on the coefficient of variation derived from our laboratory’s existing RNA-seq data on quinoa leaves, we initially selected 11 candidate reference genes exhibiting stable expression (Table 1). Additionally, COR72, HSP44, COR413-PM, and DREB12 were chosen as target genes for validating the reference genes based on transcriptome differential gene expression analysis.
Primer specificity was confirmed using agarose gel electrophoresis and melting curve analysis. The electrophoresis results demonstrated a single distinct band for the PCR product of each of the 15 genes. The melting curve analysis revealed a single specific peak for each primer pair (Figure 1). These results indicate that the primers for all 15 genes exhibited good specificity, meeting the requirements for subsequent gene expression analysis.
Amplification efficiency analysis was performed using templates prepared by pooling cDNA from quinoa leaves subjected to low-temperature (LT), heat (HT), and drought (DR) stress treatments, as well as from control (CK) samples. This pooled cDNA was serially diluted in 10-fold increments (100 to 10−4). Analysis showed that the amplification efficiencies for the 15 primer pairs ranged from 94.93% (DHDPS96) to 108.03% (SKP27), with correlation coefficients (R2) all exceeding 0.98 (Table 1), fulfilling standard qPCR requirements. These data demonstrate that the selected reference gene primer system is stable and reliable and thus suitable for quantitative analysis.

2.2. Expression Levels of Candidate Reference Genes

The cycle threshold (Ct) value directly reflects the gene expression levels, with lower Ct values indicating higher expression. Four conditions were used, defined as follows:
The global group: control (CK), low-temperature (LT), heat (HT), and drought (DR) samples; the LT group: control (CK) and low-temperature (LT) samples; the HT group: control (CK) and heat (HT) samples; and the DR group: control (CK) and drought (DR) samples.
Specifically, UBC22 consistently showed the highest expression (lowest mean Ct) in the global, low-temperature (LT), and drought (DR) groups, while UBC19 exhibited the lowest expression (highest mean Ct) in these groups. Under heat (HT) stress, ACT16 demonstrated the highest expression level, whereas SSU32 displayed minimal expression.
The raw Ct values of the 15 genes are shown in Table S1 and plotted on a boxplot (Figure 2). Notably, some genes showed consistent expression across conditions, while others exhibited marked variability, underscoring the importance of validating reference gene stability within specific experimental contexts. A boxplot analysis revealed substantial variation in expression stability among candidate genes under LT, HT, and DR stresses, as evidenced by differential interquartile ranges. Comprehensive stability ranking identified NRP13 as the most stable reference gene globally and under HT/DR conditions, while UBC22 showed superior stability in the LT group. The complete stability hierarchies were as follows: global group (Figure 2a): NRP13 > ACT16 > UBC22 > WLIM96 > SSU32 > SKP27 > TSB05 > EF03 > UBC19 > SAL92 > DHDPS96; LT group (Figure 2b): UBC22 > NRP13 > ACT16 > SAL92 > WLIM96 > SKP27 > TSB05 > SSU32 > EF03 > DHDPS96 > UBC19; HT group (Figure 2c): NRP13 > ACT16 > WLIM96 > UBC22 > TSB05 > SKP27 > SSU32 > UBC19 > EF03 > SAL92 > DHDPS96; DR group (Figure 2d): NRP13 > TSB05 > SSU32 > WLIM96 > ACT16 > SAL92 > SKP27 > UBC22 > DHDPS96 > UBC19 > EF03.

2.3. Analysis of the Expression Stability of Candidate Reference Genes

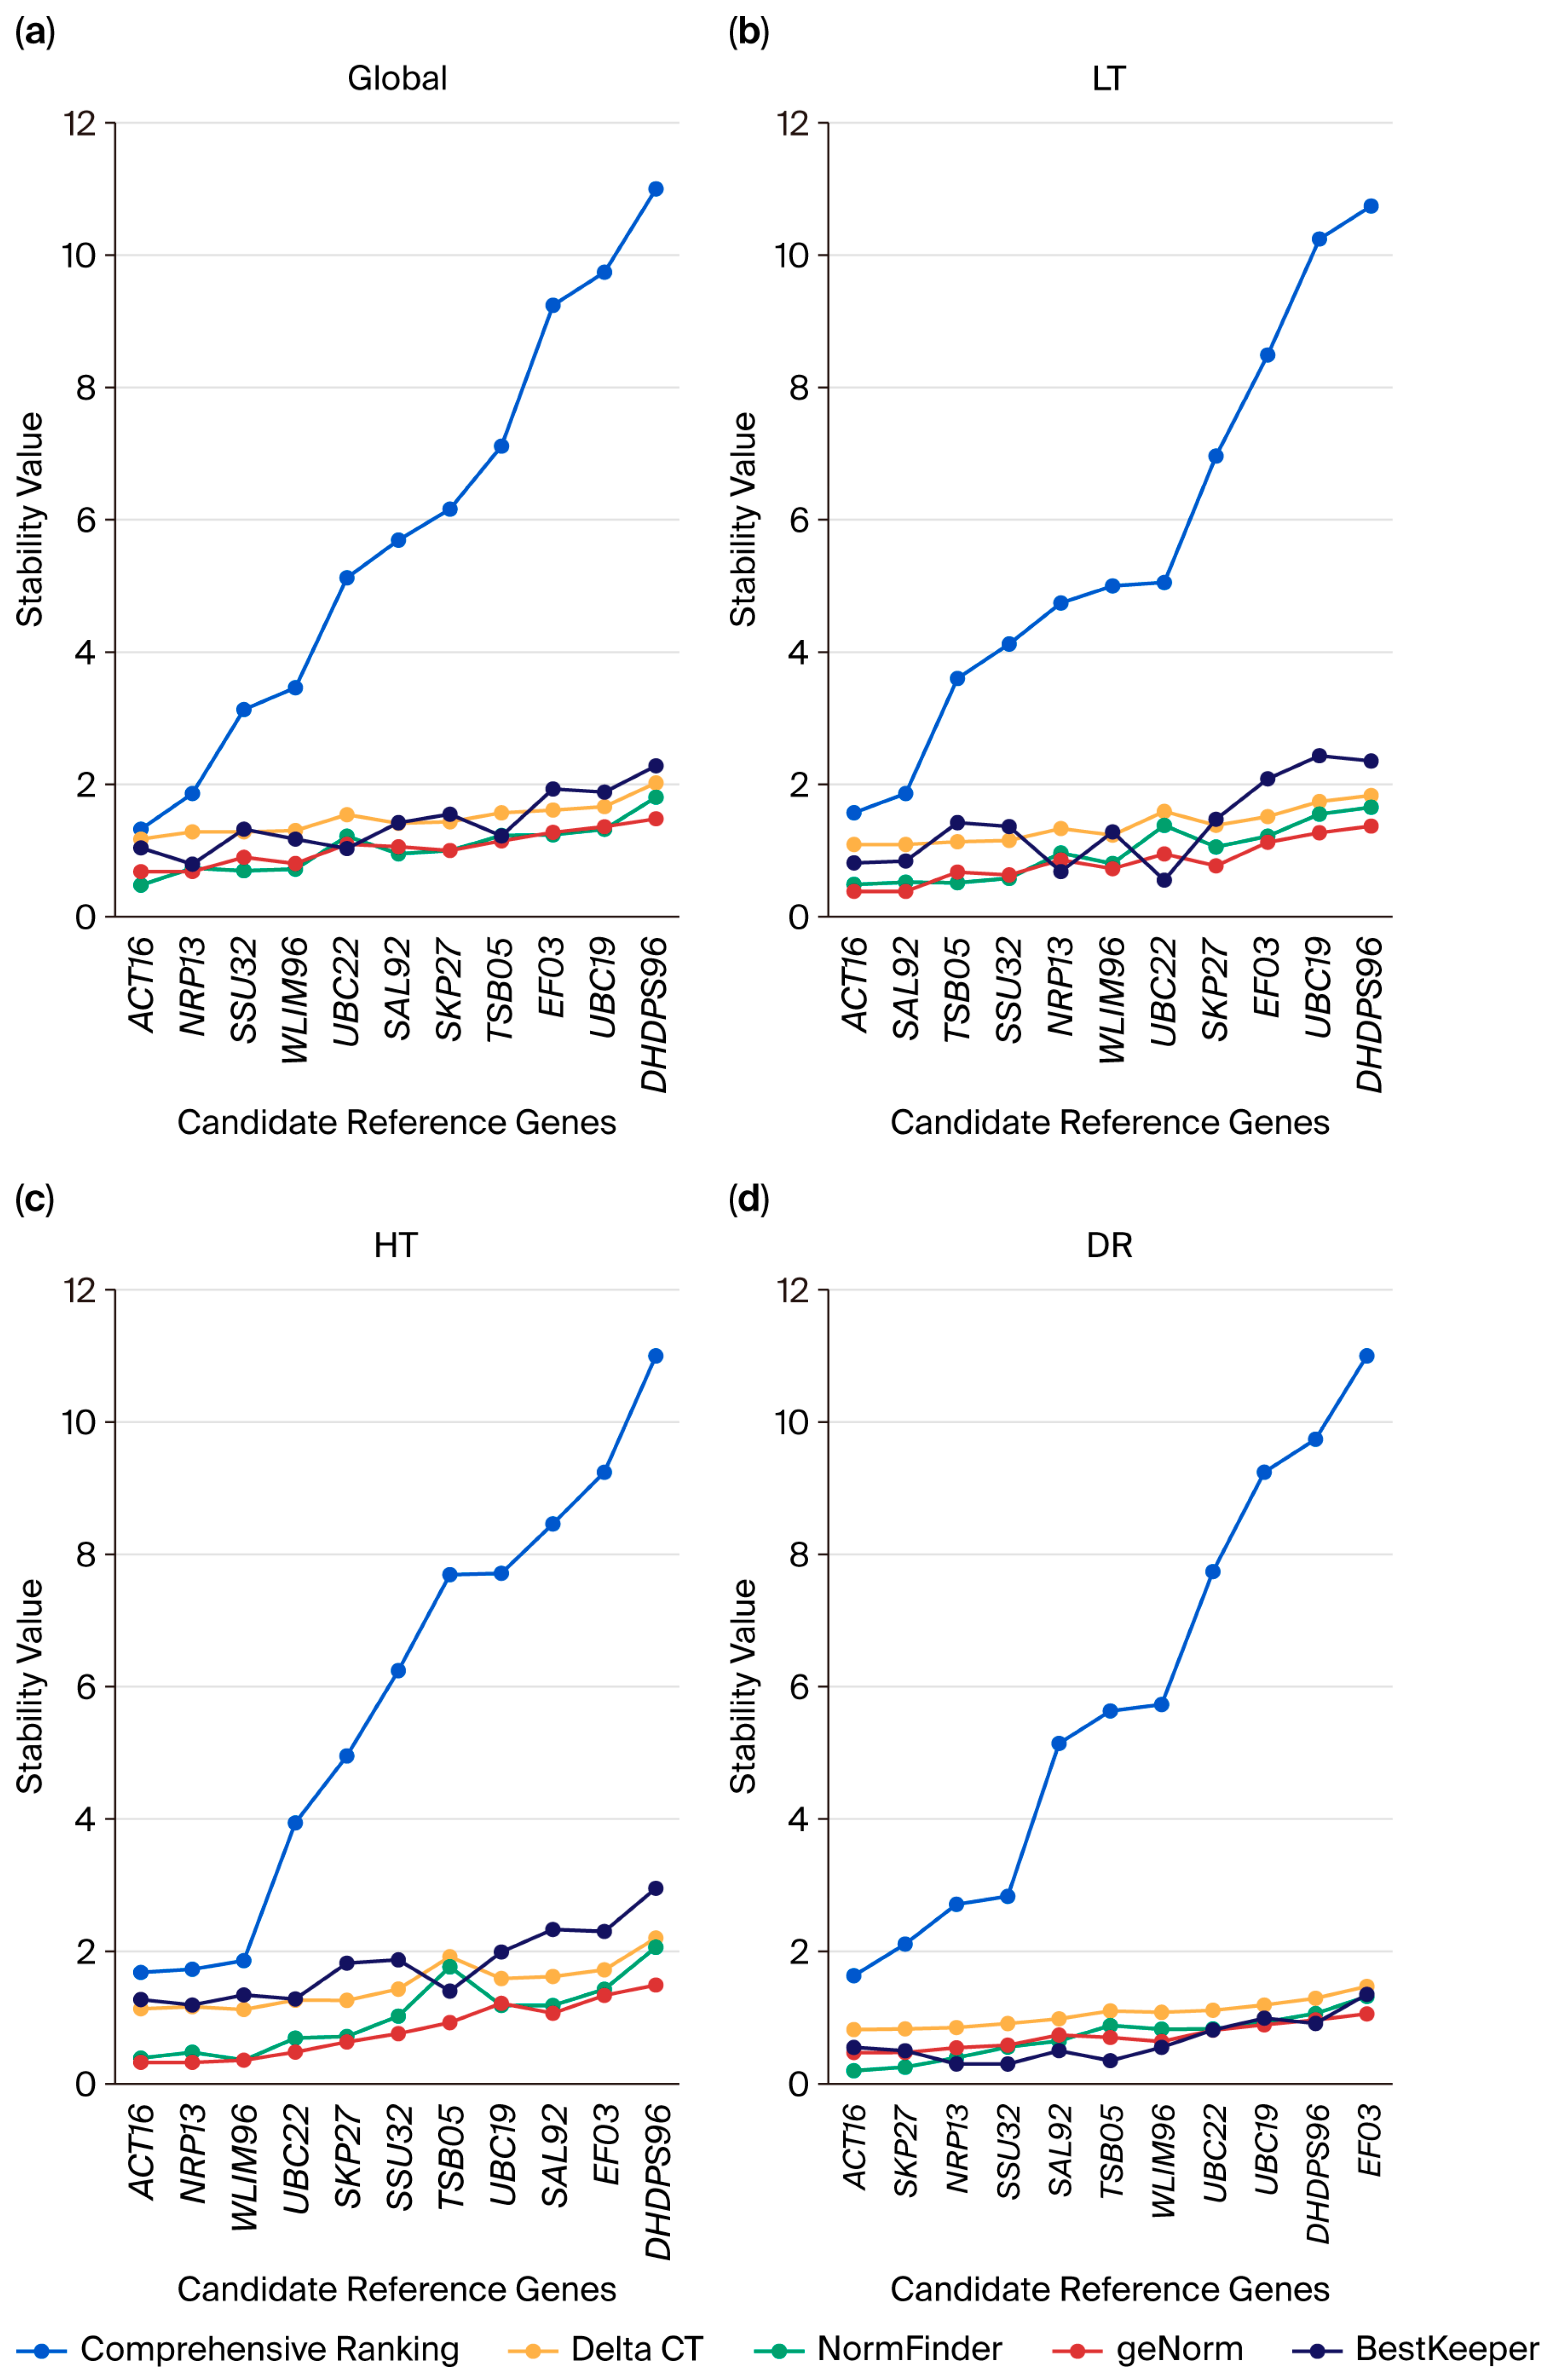
To reliably assess the expression stability of the 11 candidate reference genes, we utilized RefFinder, a comprehensive online tool that combines the four most popular algorithms for reference gene evaluation: geNorm, NormFinder, BestKeeper, and the comparative ∆Ct method. This methodology allowed us to produce individual rankings from each algorithm and an integrated overall ranking based on the geometric mean of the ranks obtained from each method (Figure 3, Tables S2–S5).
Stability rankings were independently generated for each treatment condition (LT, HT, and DR) alongside a unified global ranking across all conditions (Figure 3a). The findings indicate variability in the stability of the assessed genes based on the treatment, ranging from most stable to least stable. For the LT group (Figure 3b), the optimal genes of the candidate reference genes were ACT16 and SAL92, while for the HT group (Figure 3c), the best genes were ACT16 and NRP13, and the least stable gene for the LT and HT groups was DHDPS96. Moreover, the optimal genes for DR treatment were ACT16 and SKP27, while the least stable gene was EF03 (Figure 3d). It is important to note that some genes displayed consistent expression across treatments. For instance, ACT16 ranked among the most stable genes in the LT, HT, and DR groups.
A comprehensive analysis integrating data from all methods was also included. The global analysis proposed the following ranking from most to least stable: ACT16, NRP13, SSU32, WLIM96, UBC22, SAL92, SKP27, TSB05, EF03, UBC19, and DHDPS96. Based on these findings, ACT16 was the most suitable internal control for normalizing gene expression data across all evaluated abiotic stresses.

2.4. Analysis of Candidate Reference Gene Expression Stability Using GeNorm

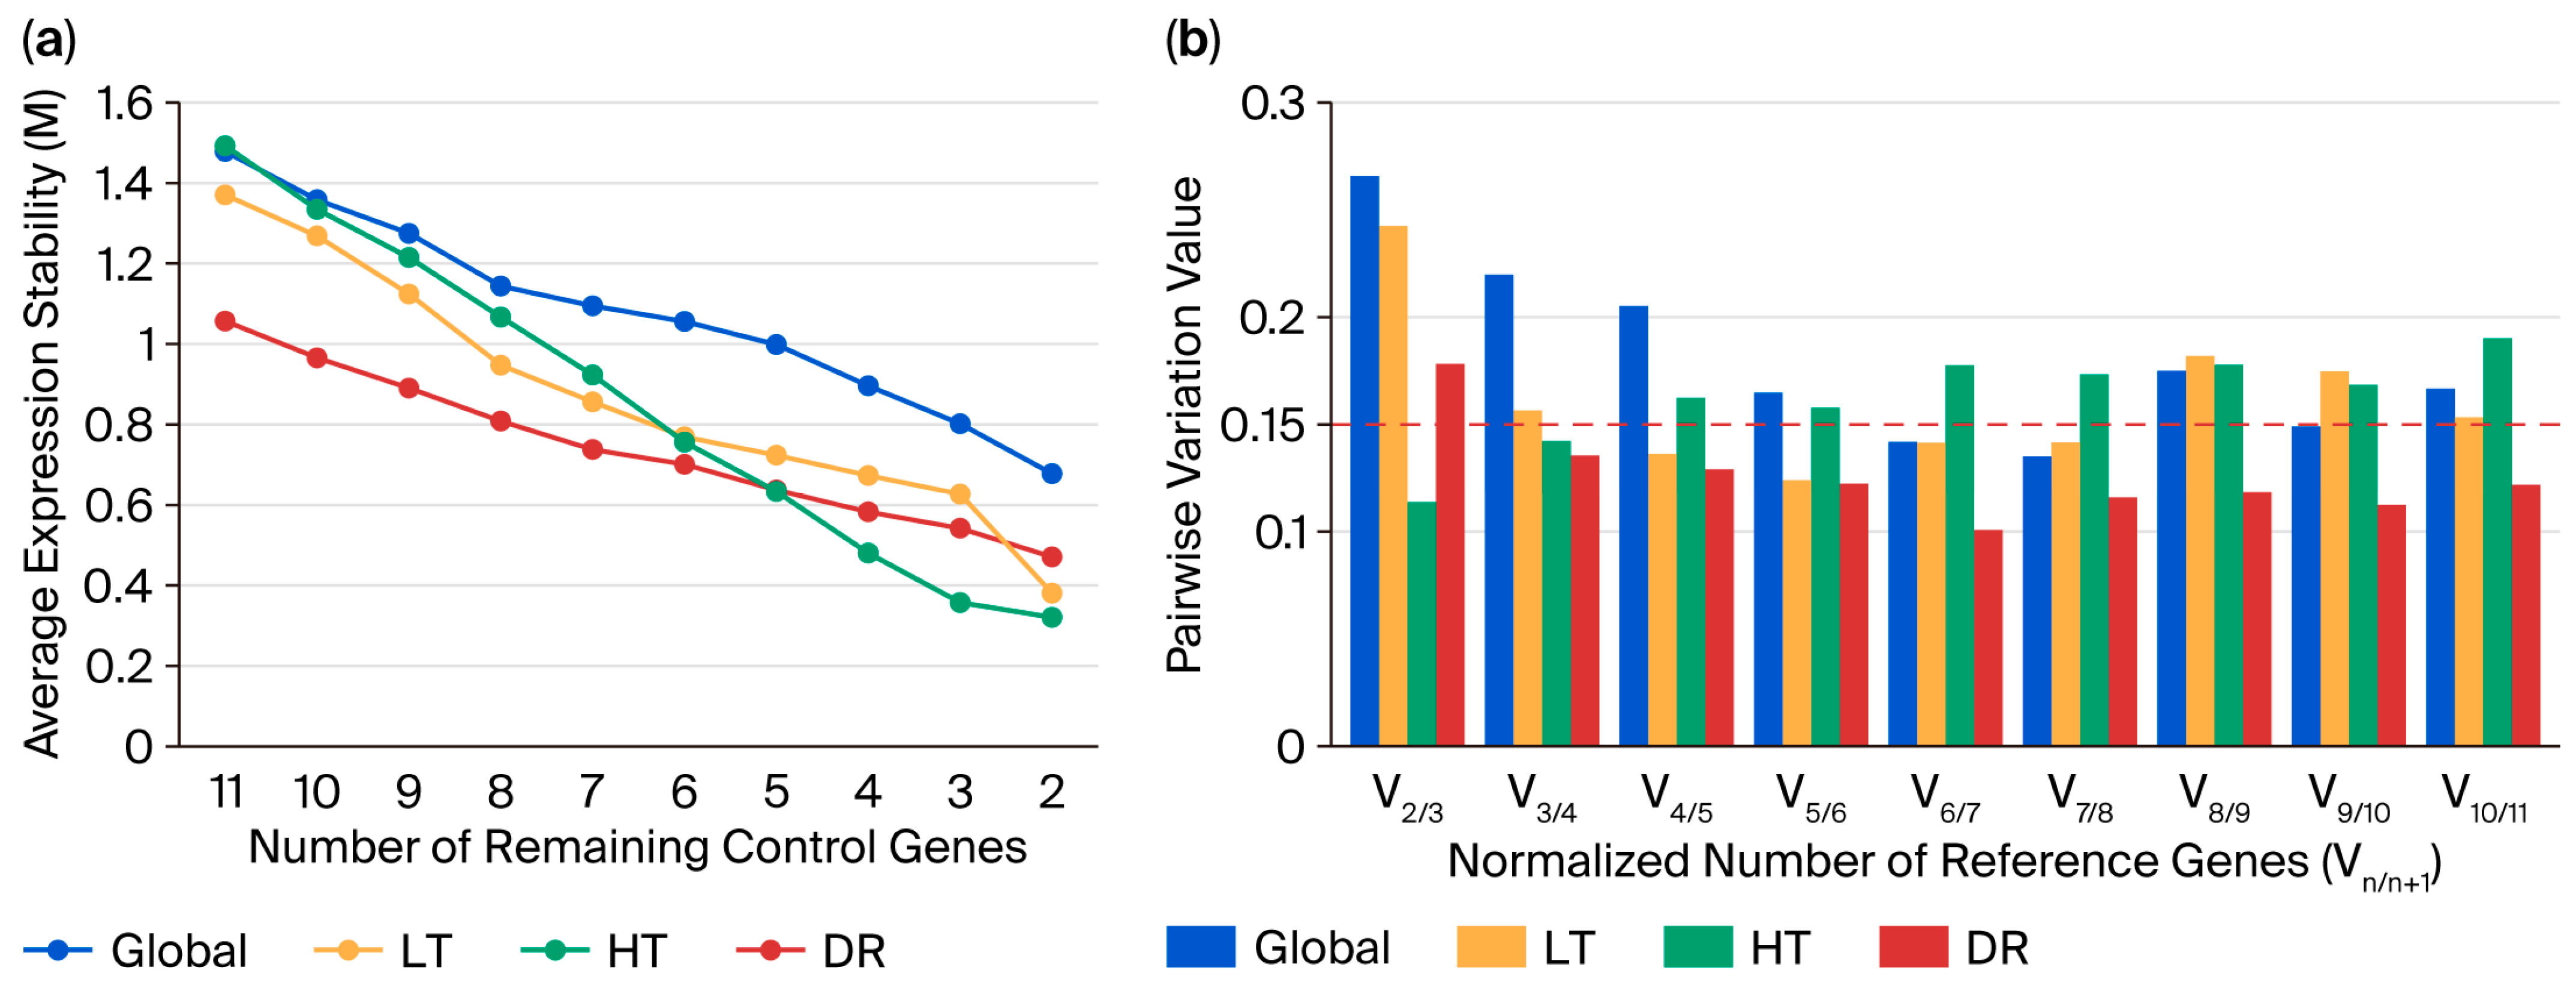
GeNorm evaluates the expression stability of genes by calculating their stability measure (M-value). Lower M-values indicate greater stability. The average M-value progressively decreased as less stable candidate genes were sequentially excluded from the analysis (Figure 4a). The pairwise combination of genes with the lowest M-value (i.e., the most stable reference genes) was identified as follows: global group: ACT16 and NRP13; LT group: ACT16 and SAL92; HT group: ACT16 and NRP13; and DR group: ACT16 and SKP27 (Tables S2–S5).
To determine the optimal number of genes needed for reliable normalization, we used the geNorm tool. It employs pairwise variation analysis to calculate the Vn/n+1 value, which compares the stability of using n genes versus n + 1 genes. A cutoff value of 0.15 is suggested: if Vn/n+1 < 0.15, no additional genes are necessary; however, if Vn/n+1 ≥ 0.15, more genes should be included for normalization. The results show that the V2/3 value for HT group was 0.113, the V3/4 value for the DR group was 0.135; the V4/5 value for the LT group was 0.136; and the V7/8 value for the global group was 0.135 (Figure 4b). This suggests that two reference genes were sufficient for robust normalization under the HT group and three reference genes were sufficient for robust normalization under the DR group. Four reference genes were sufficient for the LT group, and seven reference genes were sufficient for the global group. Therefore, it is recommended to use the corresponding number of genes under different stresses to improve the reliability of gene expression analysis.

2.5. Validation of Candidate Reference Genes

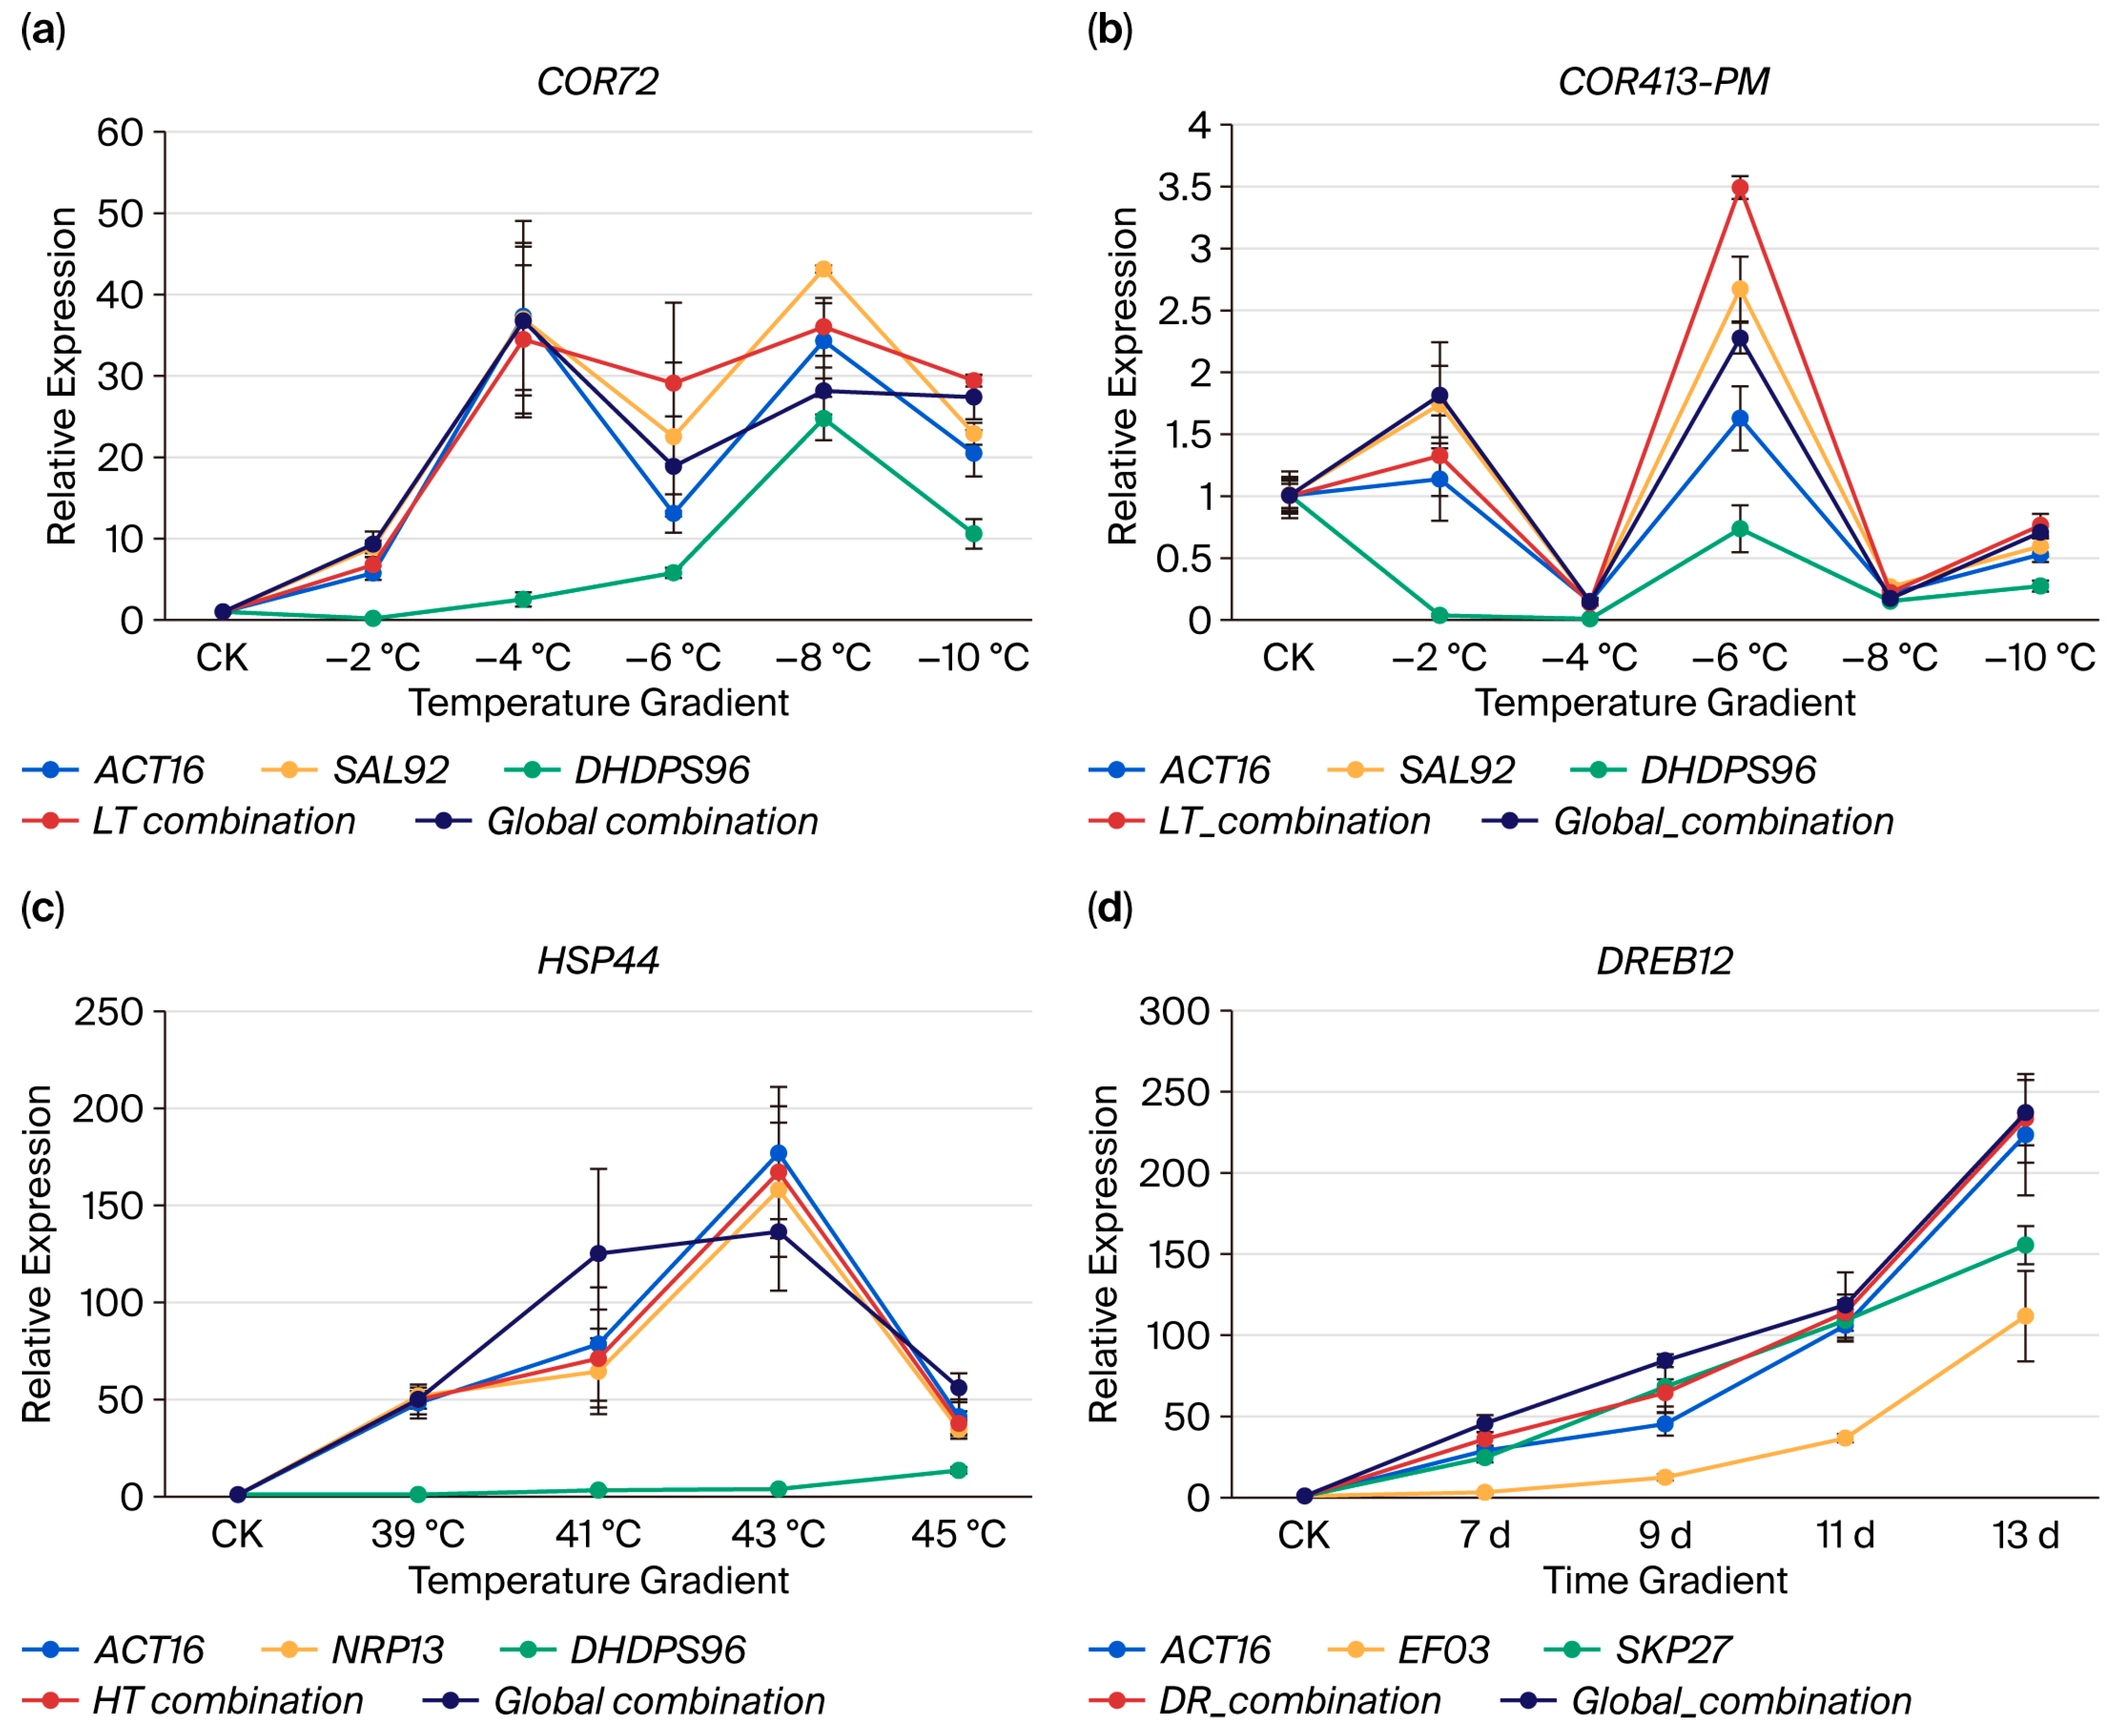
To validate the condition-specific optimal reference genes, we analyzed the expression patterns of target genes COR72, HSP44, COR413-PM, and DREB12 using distinct normalization strategies. For low-temperature (LT) stress validation, single-reference normalizations employed the most stable genes (ACT16 and SAL92) and least stable gene (DHDPS96), while multi-gene normalizations used the LT combination (ACT16, SAL92, SSU32, and TSB05) and global combination (ACT16, NRP13, WLIM96, SSU32, SKP27, SAL92, and UBC22). Both cold-responsive genes exhibited significant induction under gradient LT stress but with distinct oscillatory patterns: COR72 showed a biphasic “increase–decrease–increase–decrease” response with peaks at −4 °C and −8 °C (Figure 5a, Table S6), whereas COR413-PM displayed an “increase–decrease–increase–decrease–increase” trend, peaking at −2 °C and −6 °C (Figure 5b, Table S6). Notably, the COR72 expression profiles normalized to the LT and global combinations demonstrated higher congruence than single-gene normalizations.
For heat (HT) validation, normalizations included the optimal pair (ACT16 and NRP13), least stable gene (DHDPS96), HT combination (ACT16 and NRP13), and global combination. HSP44 expression progressively increased from 39 °C to 43 °C, followed by attenuation at 45 °C (Figure 5c, Table S6). Crucially, normalization with ACT16, NRP13, or their combination yielded concordant expression trajectories, confirming the reliability of HT-specific reference genes.
Drought stress validation employed the optimal pair (ACT16 and SKP27), least stable gene (EF03), DR combination (ACT16, SKP27, and NRP13), and global combination. DREB12 exhibited progressive upregulation with prolonged drought. Consistent expression patterns emerged across normalizations using ACT16, SKP27, the DR combination, and the global combination (Figure 5d, Table S6). Strikingly, normalization with the least stable genes (DHDPS96 for the LT/HT groups; EF03 for the DR group) substantially distorted target gene expression profiles across all stress regimes.

3. Discussion

Abiotic stresses, including cold, heat, salinity, and drought, constrain plant growth and yield. Plants have evolved multifaceted mechanisms to mitigate stress-induced damage, involving intricate transcriptional reprogramming and post-translational regulation [31]. In gene expression studies, normalization using stably expressed reference genes (internal controls) is critically important—particularly for stress-tolerant species. Chenopodiaceae plants are renowned for their tolerance to drought, salinity, and cold. It has been reported that systematic screening of reference genes in the Chenopodiaceae annual herb Salsola ferganica under abiotic stress has laid a foundation for gene expression studies under such conditions [32]. Likewise, gene expression research on quinoa under cold, heat, and drought stress requires identifying reference genes with maximum stability under these specific conditions to ensure experimental accuracy [33]. Given that reference gene stability varies across tissue types and experimental treatments, condition-specific validation remains imperative.
While qPCR offers high sensitivity and specificity for gene expression analysis, its reliability crucially depends on appropriate reference genes for data normalization. Current studies on quinoa reference genes remain limited, with reports only covering salt stress [34], diurnal rhythms [35], and downy mildew infection [36]. Despite quinoa’s renowned stress tolerance [37], varietal differences in stress responses exist. For instance, metabolomic dynamics under cold stress differ significantly between cultivars Dian Quinoa 2324 and Dian Quinoa 281 [38]. This genetic diversity necessitates selecting reference genes demonstrating cross-cultivar stability. Conventional single-intensity stress treatments may yield false positive results due to uncontrolled compensatory mechanisms. To circumvent this limitation, we implemented gradient stress exposures spanning physiologically relevant thresholds. This approach more accurately captures the dynamic stability profiles of reference genes and reveals authentic biological functions of target genes. To date, no systematic investigation has identified reference genes for quinoa subjected to gradient cold, heat, or drought treatments—a knowledge gap addressed by this study.
Quantitative real-time PCR (qRT-PCR) yielded Ct values for candidate reference genes. Optimal reference genes should exhibit expression levels comparable to target genes, with Ct values typically ranging from 15 to 30 cycles. Our analysis confirmed that all 11 candidate reference genes met this criterion (Ct = 15–30), enabling subsequent stability assessment. Divergent stability rankings emerged across analytical methods (geNorm, NormFinder, the ΔCt method, and BestKeeper), attributable to distinct statistical methodologies. Such discrepancies are well-documented: Zhuang et al. [39] reported algorithm-dependent optimal gene selection in Oxytropis ochrocephala Bunge studies, while Fan et al. [40] observed inconsistent rankings across three programs when analyzing bamboo tissues. These observations underscore the limitation of single-algorithm approaches, which may yield biased stability assessments [41]. Consequently, we employed a multi-algorithm framework integrating geNorm, NormFinder, the ΔCt method, and BestKeeper.
Divergent stability rankings emerged across analytical software (geNorm, NormFinder, BestKeeper, and the ΔCt method) due to fundamentally distinct computational algorithms. This methodological variability is well-established: while BestKeeper identified UBC22 and WLIM96 as the most stable genes across all samples, geNorm and NormFinder consistently prioritized ACT16 and NRP13 for the same condition. Such algorithm-dependent discrepancies highlight the absence of consensus regarding optimal stability assessment methods. To resolve this issue, we employed the online tool RefFinder. It integrates the currently available major computational programs (geNorm, Normfinder, BestKeeper, and the comparative ΔCt method) to compare and rank the tested candidate reference genes. Based on the rankings from each program, it assigns an appropriate weight to an individual gene and calculated the geometric mean of their weights for the overall final ranking [19].
Cold-induced proteins (COR) exhibit crucial expression dynamics under low-temperature stress in plants, particularly well-characterized in the model species Arabidopsis thaliana. Heterologous expression studies demonstrate that transferring COR genes enhances cold tolerance: COR413PM2 from Phlox subulata improved freezing resistance in transgenic Arabidopsis [42], while overexpression of CpCOR413-PM1 from wintersweet (Chimonanthus praecox) increased cold hardiness [43]. Consistent with these findings, both COR72 and COR413PM in quinoa displayed pronounced cold-responsive expression patterns in our study. And the response of COR413PM to low temperatures is weaker than COR72 (Figure 5a, b, Table S6). Compared to the control samples (CK), COR72 exhibited upregulation, initiating at −2 °C and peaking at −8 °C, and maintained stable expression from −4 °C to −10 °C. In contrast, COR413-PM showed selective induction with significant upregulation only at −2 °C and −6 °C while demonstrating downregulation at other temperature points. This divergence suggests distinct regulatory mechanisms for these cold-responsive genes. For heat stress validation, we selected heat shock proteins (HSPs)—evolutionarily conserved molecular chaperones that maintain proteostasis under thermal stress. HSPs prevent protein aggregation and assist in the refolding/degradation of misfolded proteins [44]. Under gradient heat stress, quinoa HSPs exhibited significant upregulation, peaking at 43 °C, beyond which expression declined (Figure 5c, Table S6). This attenuation likely reflects thermal denaturation or degradation of HSPs themselves under extreme temperatures. Drought-responsive mechanisms involve dehydration-responsive element-binding (DREB) transcription factors that orchestrate downstream gene networks to enhance osmotic stress tolerance [45]. Our data confirmed progressive DREB12 upregulation with intensifying drought severity, consistent with its role in activating physiological adaptations [46]. Crucially, expression profiling of stress marker genes—COR72 (LT), HSP44 (HT), COR413PM (LT), and DREB12 (DR)—using condition-specific reference gene combinations validated the reliability of our normalization strategy across all stress regimes.
Crucially, normalization with multiple reference genes significantly reduces experimental error inherent to single-gene standardization [47,48]. Our pairwise variation (Vn/n+1) analysis determined that four reference genes were required for reliable normalization under LT stress. This multi-gene approach stabilized COR72 expression across −4 °C to −10 °C, eliminating statistically significant differences within this temperature range (p > 0.05) that persisted when normalized to single genes or global combinations. Notably, COR413-PM consistently exhibited significant upregulation at −6 °C regardless of the normalization strategy, though LT combination normalization amplified its fold change magnitude, demonstrating superior sensitivity. Under HT stress, global combination normalization distorted HSP44 expression trajectories compared to single-gene or HT-specific normalization, with significant divergence at 41 °C (p < 0.05), confirming the appropriateness of condition-specific references. For drought stress, all normalization methods yielded comparable results, except for minor significance variations with ACT16 alone at 7d (Table S6).
While Vn/n+1 analysis provides a robust framework for determining optimal gene numbers, discrepancies emerged between GeNorm and RefFinder stability rankings. Under the global treatment (Figure 4), V6/7 and V7/8 both fell below the 0.15 threshold (0.142 and 0.135, respectively), yet GeNorm and RefFinder reversed the rankings of the sixth and seventh genes. Consequently, we included seven reference genes in the global combination to reconcile algorithmic conflicts. This harmonization effect—evident in the expression patterns of COR72, HSP44, COR413-PM, and DREB12—demonstrates how multi-gene normalization yields weighted intermediate profiles that mitigate individual reference gene biases and enhance analytical accuracy.

4. Materials and Methods

4.1. Plant Materials

JL3 (Chenopodium quinoa) plants were cultivated in a growth chamber at 24 °C under a 12 h light/12 h dark photoperiod. At six weeks of age, the plants were subjected to low-temperature, heat, and drought treatments (experimental groups and specific treatment methods are detailed in Table 2). Each treatment group (including each stress gradient and the control) consisted of three biological replicates (i.e., three individual pots of plants). After flash freezing in liquid nitrogen, the samples were stored at −80 °C.

4.2. RNA Extraction and cDNA Synthesis

The total RNA was extracted from the samples. RNA concentration and purity were measured using a QuickDropTM Micro-volume UV-Vis Spectrophotometer (Molecular Devices, San Jose, CA, USA). RNA samples meeting the criteria of OD260/OD280 ratios between 1.8 and 2.2 and OD260/OD230 ratios > 1.8 were deemed suitable for subsequent procedures. First-strand cDNA was synthesized using the Might-yScriptTM Plus First Strand cDNA Synthesis Kit (Sangon Biotech, Shanghai, China) and stored at −20 °C.

4.3. Candidate Gene Selection and Primer Design

Eleven candidate reference genes were selected. Additionally, four target genes—cold-induced protein (COR72), heat shock protein (HSP44), cold-induced protein (COR413-PM), and dehydration-responsive element-binding protein (DREB12)—were chosen to validate reference gene stability (Table 3). Primers were designed using Primer Premier 5.0 software. All primers were synthesized by Sangon Biotech Co., Ltd. (Shanghai, China)

4.4. Primer Specificity Verification and qPCR Analysis

cDNA synthesized from normally cultivated quinoa leaves served as the template to verify the specificity of the primers listed in Table 3 via conventional PCR amplification. The PCR reaction mixture (20 μL total volume) contained 1 μL each of forward and reverse primers (10 μmol/L), 2 μL of cDNA (1 μg), 6 μL of ddH2O, and 10 μL of 2 × Taq DNA Polymerase Premix. The PCR cycling conditions were as follows: initial denaturation at 95 °C for 5 min, followed by 40 cycles of denaturation at 95 °C for 15 s and annealing/extension at 60 °C for 30 s, with a final hold at 4 °C. PCR products were analyzed using 1% agarose gel electrophoresis to confirm the amplicon size and assess the presence of non-specific amplification bands.
cDNA synthesized from quinoa leaves subjected to low-temperature, heat, and drought treatments served as the template for quantitative real-time PCR (qPCR) analysis using a CFX96 Real-Time PCR Detection System (Bio-Rad, Hercules, CA, USA). The qPCR reaction mixture (20 μL total volume) contained 10 μL of 2 × SYBR Green Premix, 0.8 μL each of forward and reverse primers (10 μmol/L), 2 μL of cDNA (1 μg), and 6.4 μL of ddH2O. The qPCR cycling conditions were as follows: initial denaturation at 95 °C for 3 min, followed by 40 cycles of denaturation at 95 °C for 5 s and annealing/extension at 60 °C for 30 s. A melt curve analysis was subsequently performed by heating the amplification products from 65 °C to 95 °C.

4.5. Primer Amplification Efficiency Analysis

The amplification efficiency of the primers was analyzed using qPCR with a serially diluted mixed cDNA template. Specifically, cDNA synthesized from quinoa leaves subjected to low-temperature, heat, and drought treatments was pooled and serially diluted from 100 (undiluted) to 10−4. Using this mixture as the template, qPCR amplification was performed for each of the 11 candidate reference genes following the protocol described in Section 4.4.
The linear relationship between the log-transformed cDNA template concentration and the Ct value was analyzed using Microsoft Excel software (Version 2408, Build 16.0.17928.20100, Access on June 9, 2025). The linear correlation coefficient (R2) and slope (S) of the standard curve were determined. The amplification efficiency (E) was calculated using the following formula:
E (%) = (10(−1/S) − 1) × 100%

4.6. RT-qPCR Data Analysis of Reference Gene Stability

Gene expression stability was evaluated as follows: First, the mean Ct value was calculated from three biological replicates to analyze the expression levels of the 11 candidate reference genes. Subsequently, the expression stability of these genes was assessed using four statistical algorithms: GeNorm, NormFinder, BestKeeper, and the ΔCt method. Finally, the results from these multiple algorithms were integrated using the online tool RefFinder (http://blooge.cn/RefFinder/, accessed on 9 June 2025) to generate a comprehensive stability ranking.
The optimal reference genes were screened in two distinct groups across all samples. For the global group, screening was performed based on all treatments detailed in Table 1 (CK, LT, HT, and DR). Within specific stress treatments, screening was performed for optimal reference genes specifically under LT, HT, and DR conditions.

4.7. Normalization of Stress-Response Gene Expression in Chenopodium quinoa by RT-qPCR Analysis

To validate the selected reference genes, the relative expression levels of the target genes COR72, HSP44, COR413-PM, and DREB12 were calculated using the 2−ΔΔCt method. This analysis was performed using the following distinct reference gene combinations: the two most stable reference genes overall; the least stable reference gene; the most stable reference gene combination identified across all samples (global); and the most stable reference gene combination identified specifically for each individual stress treatment (LT, HT, or DR).

4.8. Data Processing and Accessibility

All experimental results are three independent replicates (Three biological replicates and three technical replicates). The data were analyzed using the IBM SPSS Statistics software (version 21.0), statistical significance was assessed using one-way ANOVA followed by LSD test. Different letters denote significance levels: p < 0.05. RNAseq reads were deposited at NCBI under the Experiment codes: SRR5572144, SRR5572145, SRR5572148, SRR5572157, SRR5572158, SRR5572160, SRR5572163-SRR5572174, SRR34789946-SRR34789951, SRR34789956, SRR34789967, and SRR34789968.

5. Conclusions

This study systematically evaluated 11 candidate reference genes in quinoa under abiotic stresses using a multi-algorithm framework (GeNorm, NormFinder, BestKeeper, the ΔCt method, and RefFinder). Condition-specific optimal reference gene pairs were determined as follows: ACT16, SAL92, SSU32, and TSB05 for low-temperature (LT) stress; ACT16 and NRP13 for heat (HT) stress; and ACT16, SKP27, and NRP13 for drought (DR) stress. ACT16, NRP13, WLIM96, SSU32, SKP27, SAL92, and UBC22 demonstrated cross-stress stability across all conditions. Validation through expression profiling of stress-responsive target genes (COR72, HSP44, COR413-PM, and DREB12) confirmed the reliability of these reference genes, whereas normalization with the least stable genes (DHDPS96 and EF03) abolished stress-responsive patterns. This study establishes validated reference standards for quinoa gene expression studies, providing critical molecular tools for deciphering abiotic stress adaptation mechanisms.

Supplementary Materials

The following supporting information can be downloaded at https://www.mdpi.com/article/10.3390/plants14152434/s1, Table S1. Quantification threshold (Ct) values for ten candidate reference genes; Table S2. Expression stability of candidate reference genes assayed in global group; Table S3. Expression stability of candidate reference genes assayed in LT group; Table S4. Expression stability of candidate reference genes assayed in DR group; Table S5. Expression stability of candidate reference genes assayed in HT group; Table S6. Relative expression level and significance analysis of target genes under different reference genes.

Author Contributions

Conceptualization, Q.L. and F.G.; methodology, X.W. and S.D.; software, J.F. and Y.L.; validation, X.W., S.D. and B.Z.; formal analysis, Y.Z.; writing—original draft preparation, Q.L.; writing—review and editing, F.G.; funding acquisition, Q.L. All authors have read and agreed to the published version of the manuscript.

Funding

This research was funded by the Fundamental Research Program of Shanxi Province, grant number 20210302124502.

Data Availability Statement

The sequence of the genes used in the RT-qPCR experiments can be made available upon request.

Conflicts of Interest

The authors declare no conflicts of interest.

References

  1. Saharan, B.S.; Brar, B.; Duhan, J.S.; Kumar, R.; Marwaha, S.; Rajput, V.D.; Minkina, T. Molecular and physiological mechanisms to mitigate abiotic stress conditions in plants. Life 2022, 12, 1634. [Google Scholar] [CrossRef]
  2. Ghadirnezhad, S.S.R.; Rahimi, R.; Zand-Silakhoor, A.; Fathi, A.; Fazeli, A.; Radicetti, E.; Mancinelli, R. Enhancing seed germination under abiotic stress: Exploring the potential of nano-fertilization. J. Soil Sci. Plant Nutr. 2024, 24, 5319–5341. [Google Scholar] [CrossRef]
  3. Alvar-Beltrán, J.; Verdi, L.; Marta, A.D.; Dao, A.; Vivoli, R.; Sanou, J.; Orlandini, S. The effect of heat stress on quinoa (cv. Titicaca) under controlled climatic conditions. J. Agric. Sci. 2020, 158, 255–261. [Google Scholar] [CrossRef]
  4. Abugoch, L.E.; Romero, N.; Tapia, C.A.; Silva, J.; Rivera, M. Study of some physicochemical and functional properties of quinoa (Chenopodium quinoa Willd) protein isolates. J. Agric. Food Chem. 2008, 56, 4745–4750. [Google Scholar] [CrossRef] [PubMed]
  5. Jarvis, D.E.; Ho, Y.S.; Lightfoot, D.J.; Schmöckel, S.M.; Li, B.; Borm, T.J.A.; Ohyanagi, H.; Mineta, K.; Michell, C.T.; Saber, N.; et al. The genome of Chenopodium quinoa. Nature 2017, 542, 307–312. [Google Scholar] [CrossRef]
  6. Yin, L.; Zhang, X.; Gao, A.; Cao, M.; Yang, D.; An, K.; Guo, S.; Yin, H. Genome-wide identification and expression analysis of 1-Aminocyclopropane-1-Carboxylate Synthase (ACS) gene family in Chenopodium quinoa. Plants 2023, 12, 4021. [Google Scholar] [CrossRef]
  7. Li, T.; Zhang, M.; Li, M.; Wang, X.; Xing, S. Molecular characterization and expression analysis of YABBY genes in Chenopodium quinoa. Genes 2023, 14, 2103. [Google Scholar] [CrossRef]
  8. De Magalhães, J.P.; Finch, C.E.; Janssens, G. Next-generation sequencing in aging research: Emerging applications, problems, pitfalls and possible solutions. Ageing Res. Rev. 2010, 9, 315–323. [Google Scholar] [CrossRef]
  9. Wong, M.L.; Medrano, J.F. Real-time PCR for mRNA quantitation. Biotechniques 2005, 39, 75–85. [Google Scholar] [CrossRef]
  10. Nolan, T.; Hands, R.E.; Bustin, S.A. Quantification of mRNA using real-time RT-PCR. Nat. Protoc. 2006, 1, 1559–1582. [Google Scholar] [CrossRef]
  11. Wen, L.; Tan, B.; Guo, W. Estimating transgene copy number in precocious trifoliate orange by TaqMan real-time PCR. Plant Cell Tissue Organ Cult. 2012, 109, 363–371. [Google Scholar] [CrossRef]
  12. Dheda, K.; Huggett, J.F.; Chang, J.S.; Kim, L.U.; Bustin, S.A.; Johnson, M.A.; Rook, G.A.; Zumla, A. The implications of using an inappropriate reference gene for real-time reverse transcription PCR data normalization. Anal. Biochem. 2005, 344, 141–143. [Google Scholar] [CrossRef]
  13. Klumb, E.K.; Rickes, L.N.; Braga, E.J.B.; Bianchi, V.J. Evaluation of stability and validation of reference genes for real time PCR expression studies in leaves and roots of Prunus spp. rootstocks under flooding. Sci. Hortic. 2019, 247, 310–319. [Google Scholar] [CrossRef]
  14. Bustin, S.; Nolan, T. Talking the talk, but not walking the walk: RT-qPCR as a paradigm for the lack of reproducibility in molecular research. Eur. J. Clin. Investig. 2017, 47, 756–774. [Google Scholar] [CrossRef]
  15. Andersen, C.L.; Jensen, J.L.; Ørntoft, T.F. Normalization of real-time quantitative reverse transcription-PCR data: Amodel-based variance estimation approach to identify genes suited for normalization, applied to bladder and colon cancer data sets. Cancer Res. 2004, 64, 5245–5250. [Google Scholar] [CrossRef]
  16. Pfaffl, M.W.; Tichopad, A.; Prgomet, C.; Neuvians, T.P. Determina tion of stable housekeeping genes, differentially regulat ed target genes and sample integrity: BestKeeper--Excel-based tool using pairwise correlations. Biotechnol. Lett. 2004, 26, 509–515. [Google Scholar] [CrossRef]
  17. Vandesompele, J.; De Preter, K.; Pattyn, F.; Poppe, B.; Roy, N.V.; De Paepe, A.; Speleman, F. Accurate normalization of real-time quantitative RT-PCR data by geometric averaging of multiple internal control genes. Genome Biol. 2002, 3, research0034. [Google Scholar] [CrossRef]
  18. Silver, N.; Best, S.; Jiang, J.; Thein, S.L. Selection of housekeeping genes for gene expression studies in human reticulo cytes using real-time PCR. BMC Mol. Biol. 2006, 7, 33. [Google Scholar] [CrossRef] [PubMed]
  19. Xie, F.; Wang, J.; Zhang, B. RefFinder: A web-based tool for comprehensively analyzing and identifying reference genes. Funct. Integr. Genomics 2023, 23, 125. [Google Scholar] [CrossRef] [PubMed]
  20. Xie, F.; Xiao, P.; Chen, D.; Xu, L.; Zhang, B. miRDeepFinder: A miRNA analysis tool for deep sequencing of plant small RNAs. Plant Mol. Biol. 2012, 80, 75–84. [Google Scholar] [CrossRef] [PubMed]
  21. Sgamma, T.; Pape, J.; Massiah, A.; Jackson, S. Selection of reference genes for diurnal and developmental time-course real-time PCR expression analyses in lettuce. Plant Methods 2016, 12, 21. [Google Scholar] [CrossRef] [PubMed]
  22. Knopkiewicz, M.; Wojtaszek, P. Validation of reference genes for gene expression analysis using quantitative polymerase chain reaction in pea lines (Pisum sativum) with different lodging susceptibility. Ann. Appl. Biol. 2019, 174, 86–91. [Google Scholar] [CrossRef]
  23. Zhang, L.; Zhang, Q.; Jiang, Y.; Li, Y.; Zhang, H.; Li, R. Reference genes identification for normalization of qPCR under multiple stresses in Hordeum brevisubulatum. Plant Methods 2018, 14, 110. [Google Scholar] [CrossRef]
  24. Zhang, J.; Feng, Y.; Yang, M.; Xiao, Y.; Liu, Y.; Yuan, Y.; Li, Z.; Zhang, Y.; Zhuo, M.; Zhang, J.; et al. Systematic screening and validation of reliable reference genes for qRT-PCR analysis in Okra (Abelmoschus esculentus L.). Sci. Rep. 2022, 12, 12913. [Google Scholar] [CrossRef]
  25. Chen, H.; Hu, B.; Zhao, L.; Shi, D.; She, Z.; Huang, X.; Priyadarshani, S.V.G.N.; Niu, X.; Qin, Y. Differential expression analysis of reference genes in pineapple (Ananas comosus L.) during reproductive development and response to abiotic stress, hormonal stimuli. Trop. Plant Biol. 2019, 12, 67–77. [Google Scholar] [CrossRef]
  26. Lin, Y.; Zhang, C.; Lan, H.; Gao, S.; Liu, H.; Liu, J.; Cao, M.; Pan, G.; Rong, T.; Zhang, S. Validation of potential reference genes for qPCR in maize across abiotic stresses, hormone treatments, and tissue types. PLoS ONE 2014, 9, e95445. [Google Scholar] [CrossRef] [PubMed]
  27. Kim, B.-R.; Nam, H.-Y.; Kim, S.-U.; Kim, S.-I.; Chang, Y.-J. Normalization of reverse transcription quantitativePCR with housekeeping genes in rice. Biotechnol. Lett. 2003, 25, 1869–1872. [Google Scholar] [CrossRef] [PubMed]
  28. Mao, M.; Xue, Y.; He, Y.; Zhou, X.; Hu, H.; Liu, J.; Feng, L.; Yang, W.; Luo, J.; Zhang, H.; et al. Validation of reference genes for quantitative real-time PCR normalization in Ananas comosus var. bracteatus during chimeric leaf development and response to hormone stimuli. Front. Genet. 2021, 12, 716137. [Google Scholar] [CrossRef]
  29. Wang, Q.; Guo, C.; Yang, S.; Zhong, Q.; Tian, J. Screening and verification of reference genes for analysis of gene expression in garlic (Allium sativum L.) under cold and drought stress. Plants 2023, 12, 763. [Google Scholar] [CrossRef]
  30. Wang, X.; Shu, X.; Su, X.; Xiong, Y.; Xiong, Y.; Chen, M.; Tong, Q.; Ma, X.; Zhang, J.; Zhao, J. Selection of suitable reference genes for RT-qPCR gene expression analysis in centipedegrass under different abiotic stress. Genes 2023, 14, 1874. [Google Scholar] [CrossRef]
  31. Zhu, J. Abiotic stress signaling and responses in plants. Cell 2016, 167, 313–324. [Google Scholar] [CrossRef] [PubMed]
  32. Wang, S.; Zhang, S. Selection of the reference gene for expression normalization in Salsola ferganica under abiotic stress. Genes 2022, 13, 571. [Google Scholar] [CrossRef] [PubMed]
  33. Zhu, X.; Wang, B.; Wang, X.; Wei, X. Screening of stable internal reference gene of quinoa under hormone treatment and abiotic stress. Physiol. Mol. Biol. Plants 2021, 27, 2459–2470. [Google Scholar] [CrossRef]
  34. Contreras, E.; Martín-Fernández, L.; Manaa, A.; Vicente-Carbajosa, J.; Iglesias-Fernández, R. Identification of reference genes for precise expression analysis during germination in Chenopodium quinoa seeds under salt stress. Int. J. Mol. Sci. 2023, 24, 15878. [Google Scholar] [CrossRef]
  35. Maldonado-Taipe, N.; Patirange, D.S.R.; Schmockel, S.M.; Jung, C.; Emrani, N. Validation of suitable genes for normalization of diurnal gene expression studies in Chenopodium quinoa. PLoS ONE 2021, 16, e0233821. [Google Scholar] [CrossRef]
  36. Xie, Y.; Xue, J.; Jiang, X.; Yin, H.; Zhao, X.; Li, X. Screening of reference genes in Chenopodium quinoa under Peronospora variabilis stress and verification of their stability. J. Fujian Agric. For. Univ. 2024, 53, 191–198. [Google Scholar]
  37. Zhu, X.; Wang, B.; Liu, W.; Wei, X.; Wang, X.; Du, X.; Liu, H. Genome-wide analysis of AP2/ERF gene and functional analysis of CqERF24 gene in drought stress in quinoa. Int. J. Biol. Macromol. 2023, 253, 127582. [Google Scholar] [CrossRef]
  38. Xie, H.; Wang, Q.; Zhang, P.; Zhang, X.; Huang, T.; Guo, Y.; Liu, J.; Li, L.; Li, H.; Qin, P. Transcriptomic and metabolomic analysis of the response of quinoa seedlings to low temperatures. Biomolecules 2022, 12, 977. [Google Scholar] [CrossRef]
  39. Zhuang, H.; Fu, Y.; He, W.; Wang, L.; Wei, Y. Selection of appropriate reference genes for quantitative real-time PCR in Oxytropis ochrocephala Bunge using transcriptome datasets under abiotic stress treatments. Front. Plant Sci. 2015, 6, 475. [Google Scholar] [CrossRef]
  40. Fan, C.; Ma, J.; Guo, Q.; Li, X.; Wang, H.; Lu, M. Selection of reference genes for quantitative real-time PCR in bamboo (Phyllostachys edulis). PLoS ONE 2013, 8, e56573. [Google Scholar] [CrossRef] [PubMed]
  41. Yang, H.; Liu, J.; Huang, S.; Guo, T.; Deng, L.; Hua, W. Selection and evaluation of novel reference genes for quantitative reverse transcription PCR (qRT-PCR) based on genome and transcriptome data in Brassica napus L. Gene 2014, 538, 113–122. [Google Scholar] [CrossRef]
  42. Zhou, A.; Liu, E.; Li, H.; Li, Y.; Feng, S.; Gong, S.; Wang, J. PsCor413pm2, a plasma membrane-localized, cold-regulated protein from Phlox subulata, confers low temperature tolerance in Arabidopsis. Int. J. Mol. Sci. 2018, 19, 2579. [Google Scholar] [CrossRef]
  43. Deng, Y.; Lin, Y.; Wei, G.; Hu, X.; Zheng, Y.; Ma, J. Overexpression of the CpCOR413PM1 gene from wintersweet (Chimonanthus praecox) enhances cold and drought tolerance in Arabidopsis. Horticulturae 2024, 10, 599. [Google Scholar] [CrossRef]
  44. Chaudhary, R.; Baranwal, V.K.; Kumar, R.; Sircar, D.; Chauhan, H. Genome-wide identification and expression analysis of Hsp70, Hsp90, and Hsp100 heat shock protein genes in barley under stress conditions and reproductive development. Funct. Integr. Genom. 2019, 19, 1007–1022. [Google Scholar] [CrossRef] [PubMed]
  45. Li, C.; Yue, J.; Wu, X.; Xu, C.; Yu, J. An ABA-responsive DRE-binding protein gene from Setaria italica, SiARDP, the target gene of SiAREB, plays a critical role under drought stress. J. Exp. Bot. 2014, 65, 5415–5427. [Google Scholar] [CrossRef]
  46. Zhou, M.; Ma, J.; Pang, J.; Zhang, Z.; Tang, Y.; Wu, Y. Regulation of plant stress response by dehydration responsive element binding (DREB) transcription factors. Afr. J. Biotechnol. 2010, 9, 9255–9269. [Google Scholar]
  47. Xu, L.; Xu, H.; Cao, Y.; Yang, P.; Feng, Y.; Tang, Y.; Yuan, S.; Ming, J. Validation of reference genes for quantitative real-time PCR during bicolor tepal development in Asiatic hybrid lilies (Lilium spp.). Front. Plant Sci. 2017, 8, 669. [Google Scholar] [CrossRef]
  48. Wang, X.; Wu, Z.; Bao, W.; Hu, H.; Chen, M.; Chai, T.; Wang, H. Identification and evalution of reference genes for quantitative real-time PCR analysis in Polygonum cuspidatum based on transcriptome data. BMC Plant Biol. 2019, 19, 498. [Google Scholar] [CrossRef]
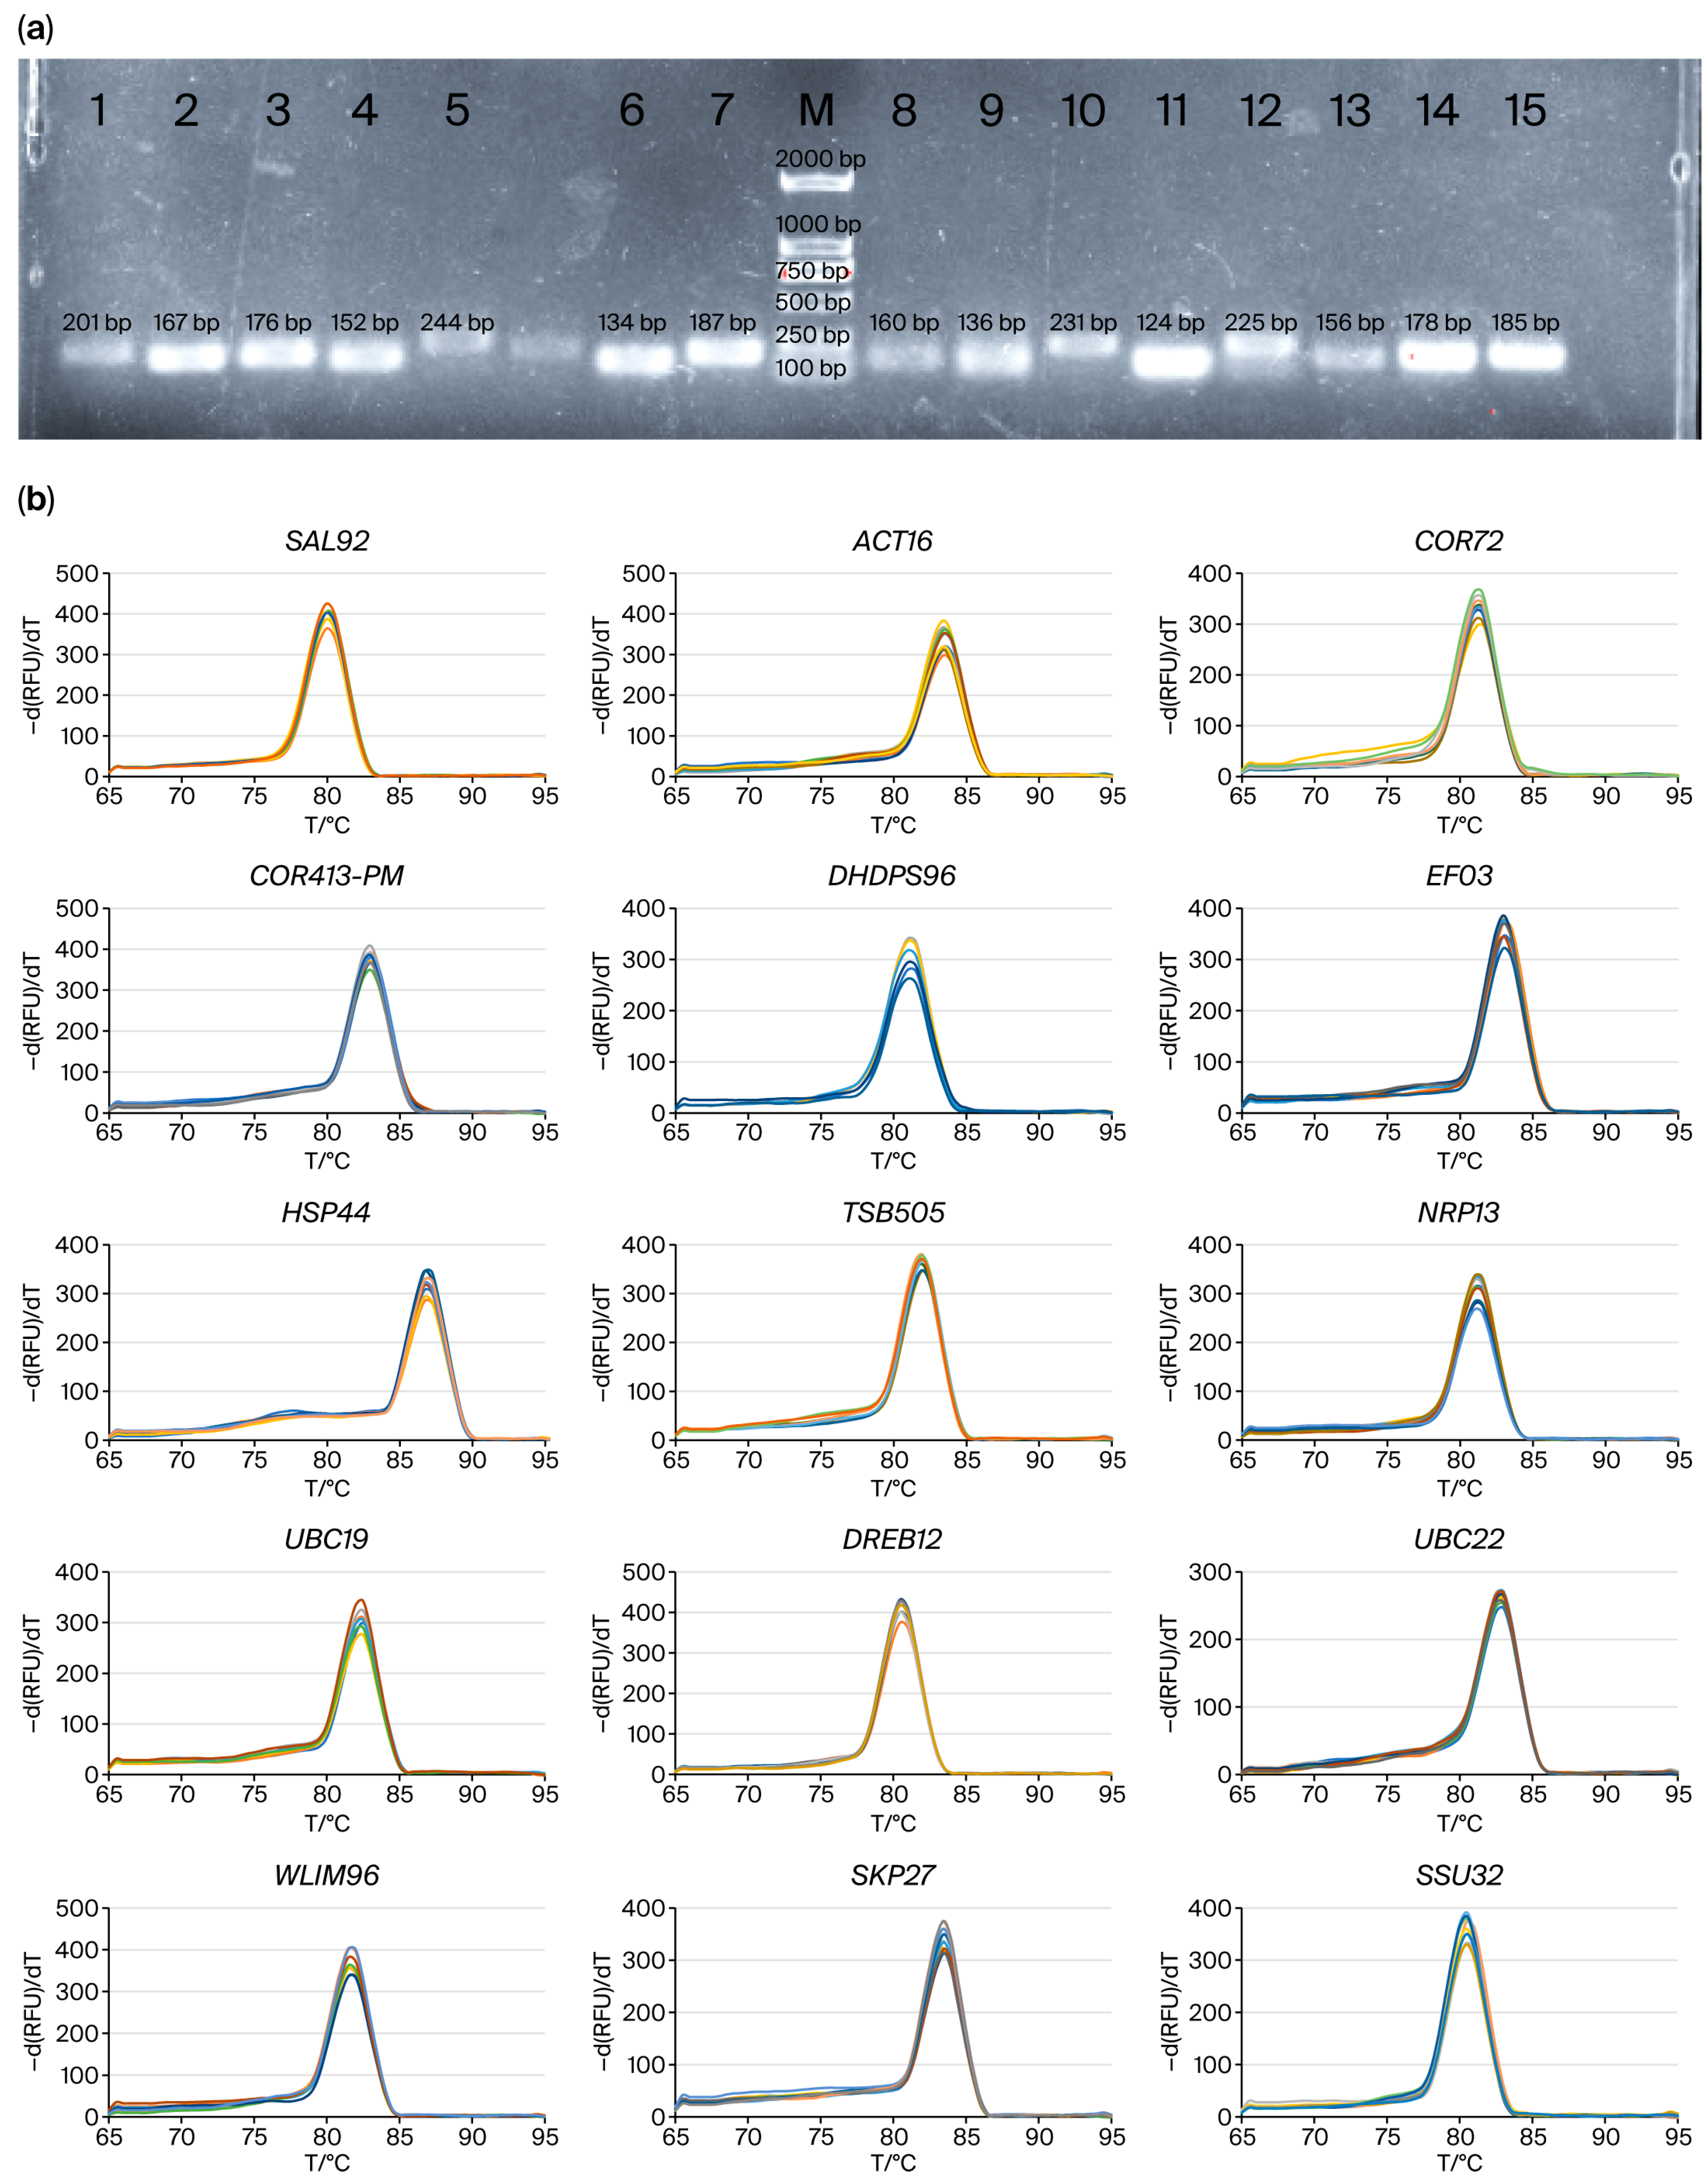
Figure 1. Specificity analysis of primers for candidate reference and target genes. (a) Agarose gel electrophoresis of PCR products of 11 candidate reference genes and 4 target genes in quinoa. M: DL2000 DNA Marker; 1: DHDPS96: dihydrodipicolinate synthase 2 (201 bp); 2: SAL92: IT4 phosphatase-associated protein (167 bp); 3: ACT16: actin (176 bp); 4: NRP13: asparagine-rich protein (152 bp); 5: UBC19: ubiquitin-conjugating enzyme E2 (244 bp); 6: EF03: translation elongation factor (134 bp); 7: WLIM96: LIM domain-containing protein (187 bp); 8: SKP27: S-phase kinase-associated protein (160 bp); 9: COR72: cold-regulated protein (136 bp); 10: HSP44: heat shock protein (231 bp); 11: COR413-PM: cold-regulated 413-plasma membrane protein (124 bp); 12: DREB12: dehydration response element binding protein (225 bp); 13: TSB05: tryptophan synthase beta-subunit 2 (156 bp); 14: SSU32: Ssu72-like family protein (178 bp); 15: UBC22: ubiquitin-conjugating enzyme E2 (185 bp). (b) Melting curves of 11 candidate reference genes and 4 target genes in quinoa.
Plants 14 02434 g001
Figure 2. A comparison of cycle threshold (Ct) values for the 11 candidate reference genes in samples subjected to different treatments. (a) Global group: Control (CK), low-temperature (LT), heat (HT), and drought (DR). (b) LT group: Low-temperature treatment group. (c) HT group: Heat treatment group. (d) DR group: Drought treatment group.
Plants 14 02434 g002
Figure 3. Analysis of expression stability of candidate reference genes using multiple software. (a) Global group: Control (CK), low-temperature (LT), heat (HT), and drought (DR). (b) LT group: Low-temperature treatment group. (c) HT group: Heat treatment group. (d) DR group: Drought treatment group.
Plants 14 02434 g003
Figure 4. Candidate reference genes assayed using GeNorm. (a) Expression stabilities of candidate reference genes. (b) Normalized number of reference genes. Global group: Control (CK), low-temperature (LT), heat (HT), and drought (DR). LT group: Low-temperature treatment group. HT group: Heat treatment group. DR group: Drought treatment group.
Plants 14 02434 g004
Figure 5. Expression pattern analysis of target genes with different candidate genes as reference genes. (a) COR72. (b) COR413-PM. (c) HSP44. (d) DREB12. LT combination: ACT16, SAL92, SSU32, and TSB05. HT combination: ACT16 and NRP13. DR combination: ACT16, SKP27, and NRP13. Global combination: ACT16, NRP13, WLIM96, SSU32, SKP27, SAL92, and UBC22.
Plants 14 02434 g005
Table 1. Amplification efficiency of candidate reference genes and target genes.
GeneCoefficient of Variation (CV)Amplification Efficiency/%Linear Correlation Coefficient (R2)
SAL920.0208 (LT)99.02%0.9881
ACT160.0411 (LT)96.66%0.9891
DHDPS960.0412 (HT)94.93%0.9877
EF030.0876 (HT)104.03%0.9961
TSB050.0417 (HT)102.34%0.9986
NPR130.0784 (DR)104.36%0.9911
UBC190.0463 (DR)102.83%0.9978
UBC220.0853 (Global)96.97%0.9967
WLIM960.0806 (Global)98.04%0.9837
SKP270.0829 (Global)108.03%0.9879
SSU320.0891 (Global)97.33%0.9901
COR721.2999 (Global)98.72%0.9835
COR413-PM0.5632 (Global)98.49%0.9919
HSP440.9073 (Global)102.31%0.9880
DREB120.6486 (Global)99.30%0.9900
Table 2. Experimental grouping and treatments.
GroupExperiment Treatments (Leaves Were Collected from Six-Week-Old Quinoa)
Normal treatment (CK) Plants were continuously maintained under normal growth conditions (24 °C, 12 h light/12 h dark cycle, with regular watering) in the growth chamber.
Low-temperature treatment (LT)Five temperature gradients were set: −2 °C, −4 °C, −6 °C, −8 °C, and −10 °C. Upon reaching the target temperature, plants were transferred from the growth conditions (24 °C) to a low-temperature incubator. Plants were subjected to stress treatment for 6 h at a constant temperature.
Heat treatment (HT)Four temperature gradients were set: 39 °C, 41 °C, 43 °C, and 45 °C. Plants were transferred directly from growth conditions (24 °C) into a growth chamber that had been pre-set and stabilized at the target temperature. Plants were subjected to stress treatment for 6 h at a constant temperature.
Drought treatment (DR)Four stress gradients were set based on the duration after watering cessation: 7, 9, 11, and 13 days. The day when watering was stopped was denoted as day 0 of drought treatment. Drought treatment was conducted within the growth chamber (24 °C, 12 h light/12 h dark).
Table 3. Candidate reference gene and primer information.
Gene IDGeneDescriptionFunctionPrimer Sequence (5′~3′)Product Size
AUR62038592SAL92IT4 phosphatase-associated proteinIt is required for SIT4’s role in G1 cyclin transcription and for bud formation.F: GAACACTCACATAGCACCTT
R: CGAACCAACACCTCCATA
167 bp
AUR62019116ACT16ActinActin is a ubiquitous protein involved in the formation of filaments that are major components of the cytoskeleton.F: TTGTGCTCAGTGGTGGTA
R: CATCTGTTGGAAGGTGCT
176 bp
AUR62003513NRP13Asparagine-rich proteinIt plays a role in phytohormone response, embryo development and programmed cell death by pathogens or ozone.F: GAACAAGCCGGAATGTAA
R: AAATAAACCCAAGCCAGA
152 bp
AUR62036119UBC19Ubiquitin-conjugating enzyme E2It acts as a ubiquitin-binding enzyme F: ATTGATAAGCTAGGGAGG
R: AGAGGGTAAAGTTGTTGC
244 bp
AUR62021096DHDPS96Dihydrodipicolinate synthase 2Key enzymes of lysine biosynthesis pathwayF: CTTTACAAACGCCACCAT
R: GAGAAGCAGAGCGAGGAC
201 bp
AUR62026903EF03Translation elongation factorCatalyzes the GTP-dependent ribosomal translocation step during translation elongationF: CCGCACTGTGATGAGCAA
R: TGGAACGAACCTTGGGAT
134 bp
AUR62012196WLIM96LIM domain-containing protein The exact function is unknownF: ACAAGGTCGCCAAGCAAA
R: TTCCATCAAGGGCAGCAT
187 bp
AUR62013027SKP27S-phase kinase-associated proteinParticipate in the ubiquitination of target proteins and subsequent proteasomal degradationF: TTTTGGCTGCTAACTACCT
R: TTCTCCCTCCTAACCTCC
160 bp
AUR62012972COR72Cold-regulated proteinParticipate in low temperature responseF: GGTAGACAAGGCAGAGGA
R: TGTAGGCTGATGATGGTTAT
136 bp
AUR62021644HSP44Heat shock proteinMolecular chaperones that suppress protein aggregation and protect against cell stressF: CCTCGCACAGTCCCATAC
R: CAACTCAGCCTTCGCATC
231 bp
AUR62016670COR413-PMCold-regulated 413-plasma membrane proteinParticipate in low temperature responseF: AGCATCCTATGTCCGTGGTG
R: CCCGTTAGCCCTTGTGAA
124 bp
AUR62012312DREB12Dehydration response element binding proteinParticipate in plant drought stressF: ACTTGCCGCATTACCCAG
R: GCATCATCGCAGCATTTT
225 bp
AUR62020505TSB05Tryptophan synthase beta-subunit 2Catalyzes the final step in the biosynthesis of L-tryptophanF: TCTGAAAGACTTGGGACG
R: TTCGGAAGAGTTGGACAC
156 bp
AUR62036432SSU32Ssu72-like family proteinIt has intrinsic phosphatase activity and plays an essential role in the transcription cycleF: CCTCAACGCTGGCAAGAT
R: CACCAATAGCCGCCTCCT
178 bp
AUR62028822UBC22Ubiquitin-conjugating enzyme E2It acts as a ubiquitin-binding enzyme F: AAGAGGTTGATGAGGGAT
R: GGAGGCTTATTTGGGTAG
185 bp
Disclaimer/Publisher’s Note: The statements, opinions and data contained in all publications are solely those of the individual author(s) and contributor(s) and not of MDPI and/or the editor(s). MDPI and/or the editor(s) disclaim responsibility for any injury to people or property resulting from any ideas, methods, instructions or products referred to in the content.