Article

Transcriptomic Profiling of Buds Unveils Insights into Floral Initiation in Tea-Oil Tree (Camellia oleifera ‘changlin53’)

1
Key Laboratory of Cultivation and Utilization for Oil-Camellia Resources, Experimental Center for Subtropical Forestry, Chinese Academy of Forestry, Xinyu 336600, China
2
Xinyu University, Xinyu 336600, China
3
Jiangxi Environmental Engineering Vocational College, Ganzhou 341000, China
*
Author to whom correspondence should be addressed.
Plants 2025, 14(15), 2348; https://doi.org/10.3390/plants14152348
Submission received: 27 June 2025 / Revised: 23 July 2025 / Accepted: 25 July 2025 / Published: 30 July 2025
(This article belongs to the Section Horticultural Science and Ornamental Plants)

Abstract

Flowering is a key agronomic trait that directly influences the yield of the tea-oil tree (Camellia oleifera). Floral initiation, which precedes flower bud differentiation, represents a critical developmental stage affecting the flowering outcomes. However, the molecular mechanisms underlying floral initiation in C. oleifera remain poorly understood. In this study, buds from five key developmental stages of a 12-year-old C. oleifera cultivar ‘changlin53’ were collected as experimental samples. Scanning electron microscopy was employed to identify the stage of floral initiation. UPLC-MS/MS was used to analyze endogenous gibberellin (GA) concentrations, while transcriptomic analysis was performed to reveal the underlying transcriptional regulatory network. Six GA types were detected during floral initiation and petal development. GA4 was exclusively detected at the sprouting stage (BII), while GA3 was present in all samples but was significantly lower in BII and the flower bud primordium formation stage (BIII) than in the other samples. A total of 64 differentially expressed genes were concurrently enriched in flower development, reproductive shoot system development, and shoot system development. Weighted gene co-expression network analysis (WGCNA) identified eight specific modules significantly associated with different developmental stages. The magenta module, containing Unigene0084708 (CoFT) and Unigene0037067 (CoLEAFY), emerged as a key regulatory module driving floral initiation. Additionally, GA20OX1 and GA2OX8 were identified as candidate genes involved in GA-mediated regulation of floral initiation. Based on morphological and transcriptomic analyses, we conclude that floral initiation of C. oleifera is a continuous regulatory process governed by multiple genes, with the FT-LFY module playing a central role in the transition from apical meristem to floral meristem.

1. Introduction

Camellia oleifera Abel. (C. oleifera) is an evergreen tree species cultivated in subtropical regions and is one among the four major woody oil plants globally, along with oil palm, olive, and coconut [1,2]. Because of geographical and climatic constraints, C. oleifera is widely distributed in the subtropical mountainous regions of the Yangtze River Basin [3]. Its seeds yield tea oil rich in oleic acid and natural antioxidants, with notable nutritional and health benefits [4,5,6]. Flowering is a critical agronomic trait affecting C. oleifera yield, and floral initiation plays a pivotal role in determining flowering time [7].
Floral initiation is influenced by both external and internal signals. Environmental factors, such as photoperiod, temperature, nutrient status, drought, salinity, exogenous hormones and chemicals, and microbial pathogens, as well as endogenous signals, such as plant age, hormone levels, and carbohydrate status, all contribute to its regulation [8,9,10,11,12,13]. These cues are perceived primarily in the leaves and shoot apical meristem [13,14]. In 1-year-old herbaceous plants, floral initiation marks the transition from vegetative to reproductive growth. Molecular studies on this process have largely focused on model herbs such as Arabidopsis thaliana and rice. In A. thaliana, flowering is regulated by a complex network involving more than 100 genes across multiple pathways: photoperiod, ambient temperature, autonomous, integrator, gibberellins (GAs), and vernalization [15,16]. By contrast, floral initiation in woody perennials occurs in two distinct phases: the initial transition from vegetative to reproductive growth in the life cycle (marking maturity and the capacity to flower) and the annual initiation of floral structures post-maturity. Unlike annuals—where flowering is terminal and leads to senescence—perennials undergo repeated cycles of vegetative and reproductive growth. Hence, annuals and perennials have different flowering traits.
In Arabidopsis, the FT gene promotes flowering and is upregulated by CONSTANS (CO), which is sensitive to photoperiods [17,18]. FT is repressed by FLOWERING LOCUS C (FLC), which delays flowering by blocking gene transcription in photoperiodic flowering. The attenuation of FLC, a key floral repressor, distinguishes summer- and winter-annual phenotypes [19,20]. In perennial poplar, functionally differentiated FT1 and FT2 separate the timing of reproductive initiation and vegetative growth to different seasons. FT1 rises in response to low temperatures of winter and promotes reproduction, and FT2 is induced by exposure to long days and warm temperatures of spring and early summer and promotes vegetative growth [21]. LEAFY (LFY), a primary activator of floral meristem development, plays a crucial role in determining floral transition timing. Its expression is promoted by SQUAMOSA PROMOTER BINDING-LIKE (SPL) transcription factors (e.g., SPL9) and GA-sensitive DELLA proteins [22,23,24]. Interestingly, LFY expression is high in alternate-bearing mango (Mangifera indica L.) cultivars during flowering but inhibited in ever-flowering longan cultivar ‘Sijimi’ [25,26]. These examples underscore the mechanistic differences in floral initiation between woody and herbaceous plants. Due to long generation times and complex genetic backgrounds, the molecular mechanisms of flowering in woody perennials remain less explored than in model herbs.
In C. oleifera, flowering is essential for yield, yet its regulation is complex. Flower buds typically form at the base of vegetative buds located at the terminals of spring shoots or in the axils of new leaves [27]. These spring shoots originate from vegetative buds formed in the previous year, which themselves are located at the terminals or leaf axils of older shoots. Flower bud differentiation in C. oleifera has been reported to occur between early April and late July, with flowering taking place from early October to the end of December. The timing of bud differentiation and flowering varies among cultivars. Floral initiation precedes flower bud differentiation and is a critical developmental stage influencing C. oleifera flowering. We revealed that old leaves in C. oleifera serve as key photoperiodically sensitive organs, promoting FT expression through light-responsive mechanisms to initiate floral bud formation. The transduction of endogenous signaling molecules from old leaves to axillary buds is required to initiate floral transition through induced transcriptional activation of floral meristem-specific genes. However, the specific genetic determinants mediating this developmental shift remain to be systematically characterized through comprehensive transcriptomic analysis, and the following question remains: which genes, LFY, APETALA1 (AP1) or any other genes, in the buds were activated?

2. Results

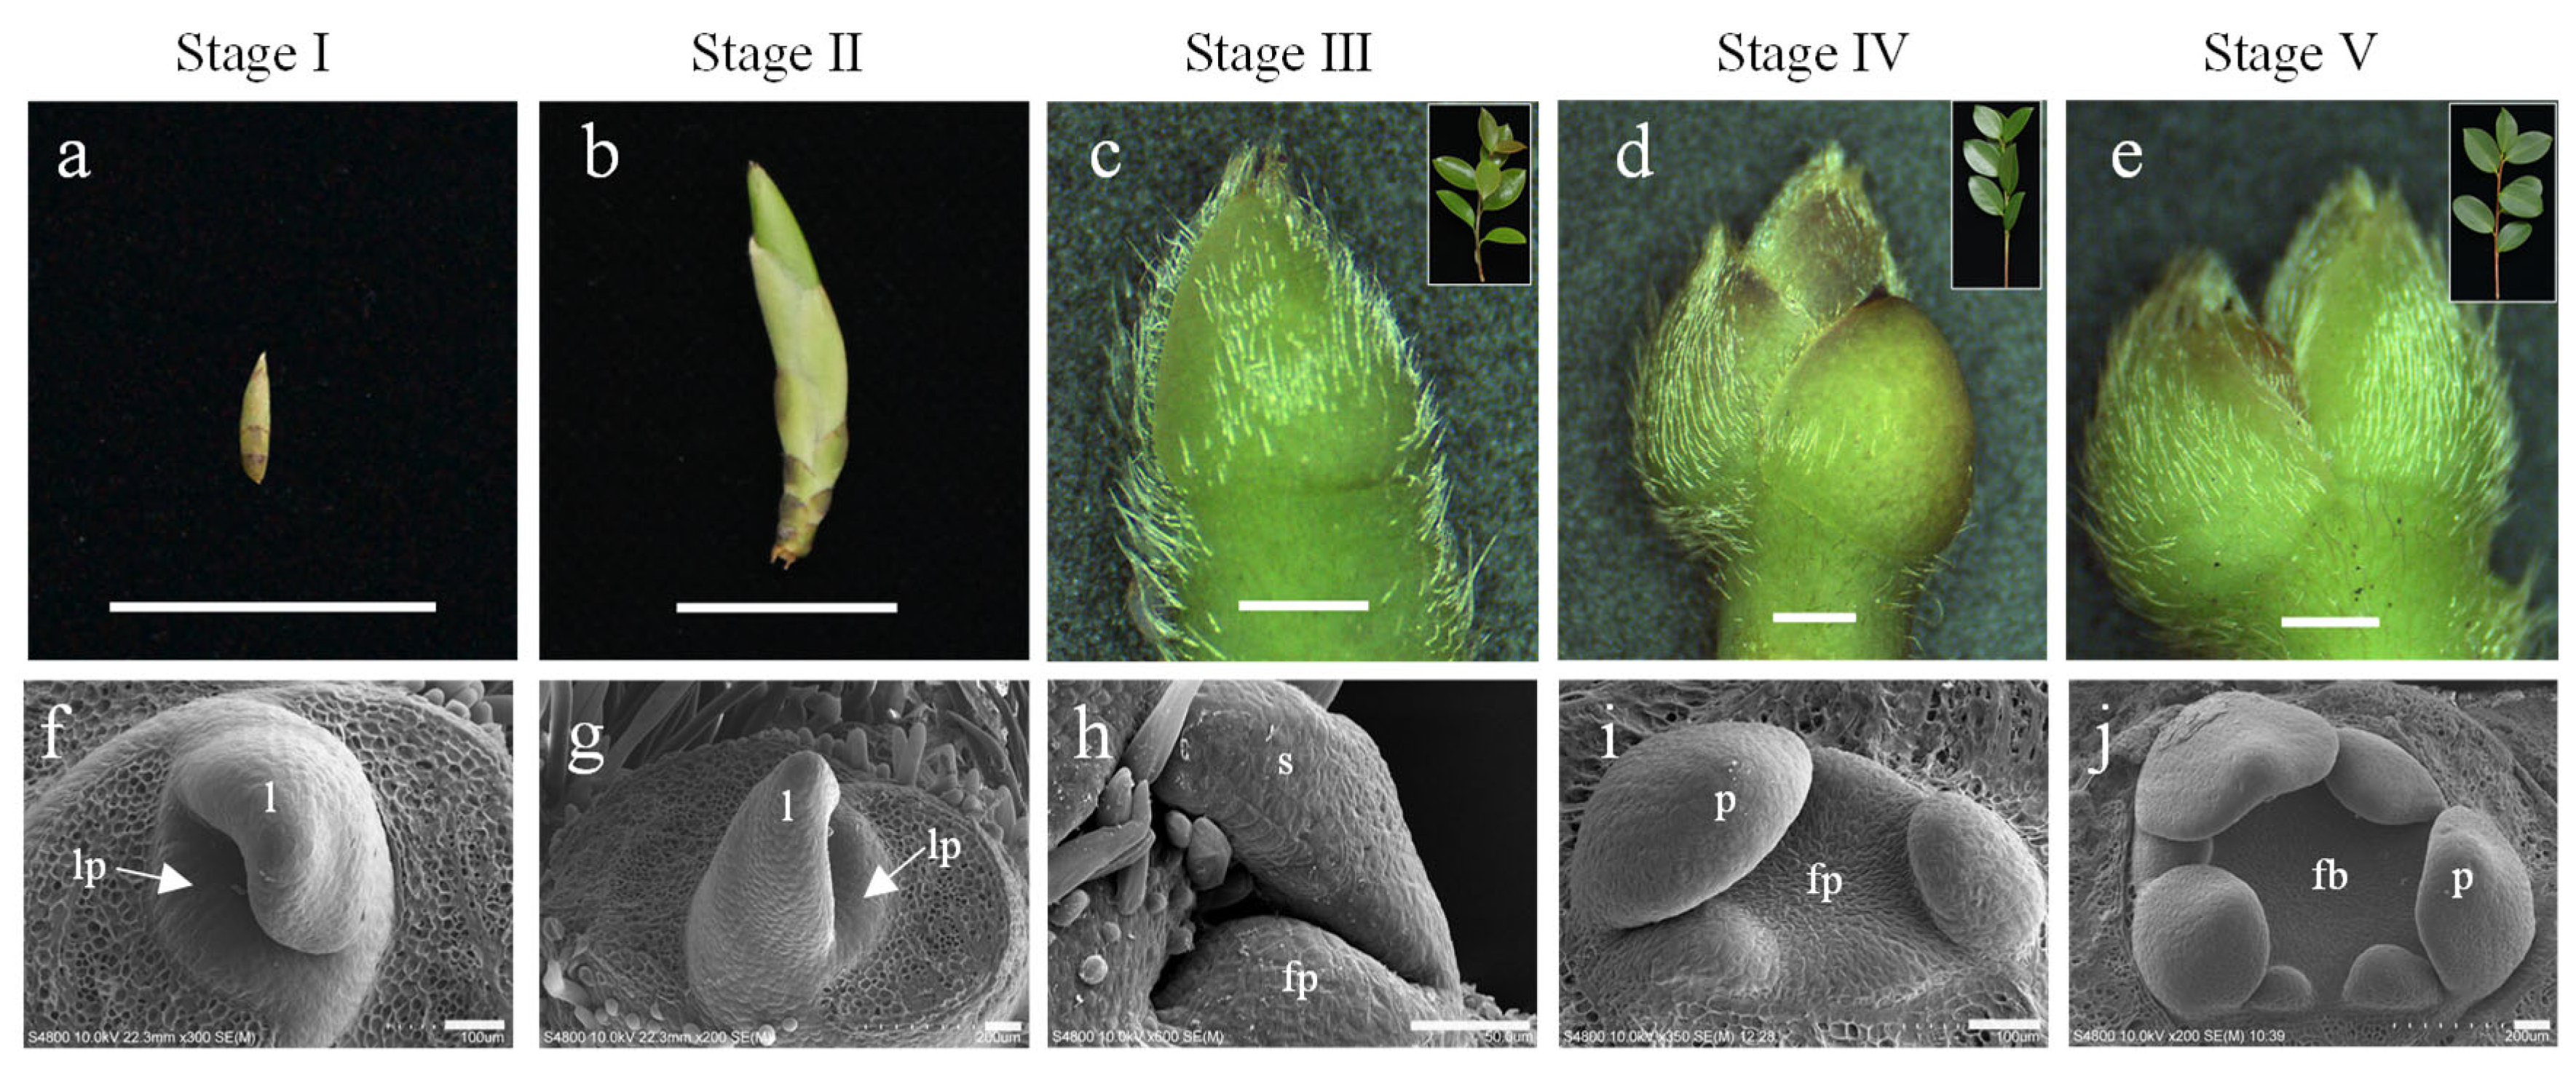
2.1. Morphological Characteristics of Floral Initiation in C. oleifera at Different Developmental Stages

The formation of flower bud primordia indicates that the floral meristem has been activated, and floral initiation has begun [28]. Buds are key organs during floral initiation; therefore, buds at five key developmental stages were selected for transcriptome analysis: dormancy stage (stage I), sprouting stage (stage II), flower bud primordium formation stage (stage III), petal differentiation stage (stage IV), and completion of petal differentiation stage (stage V) (Figure 1).

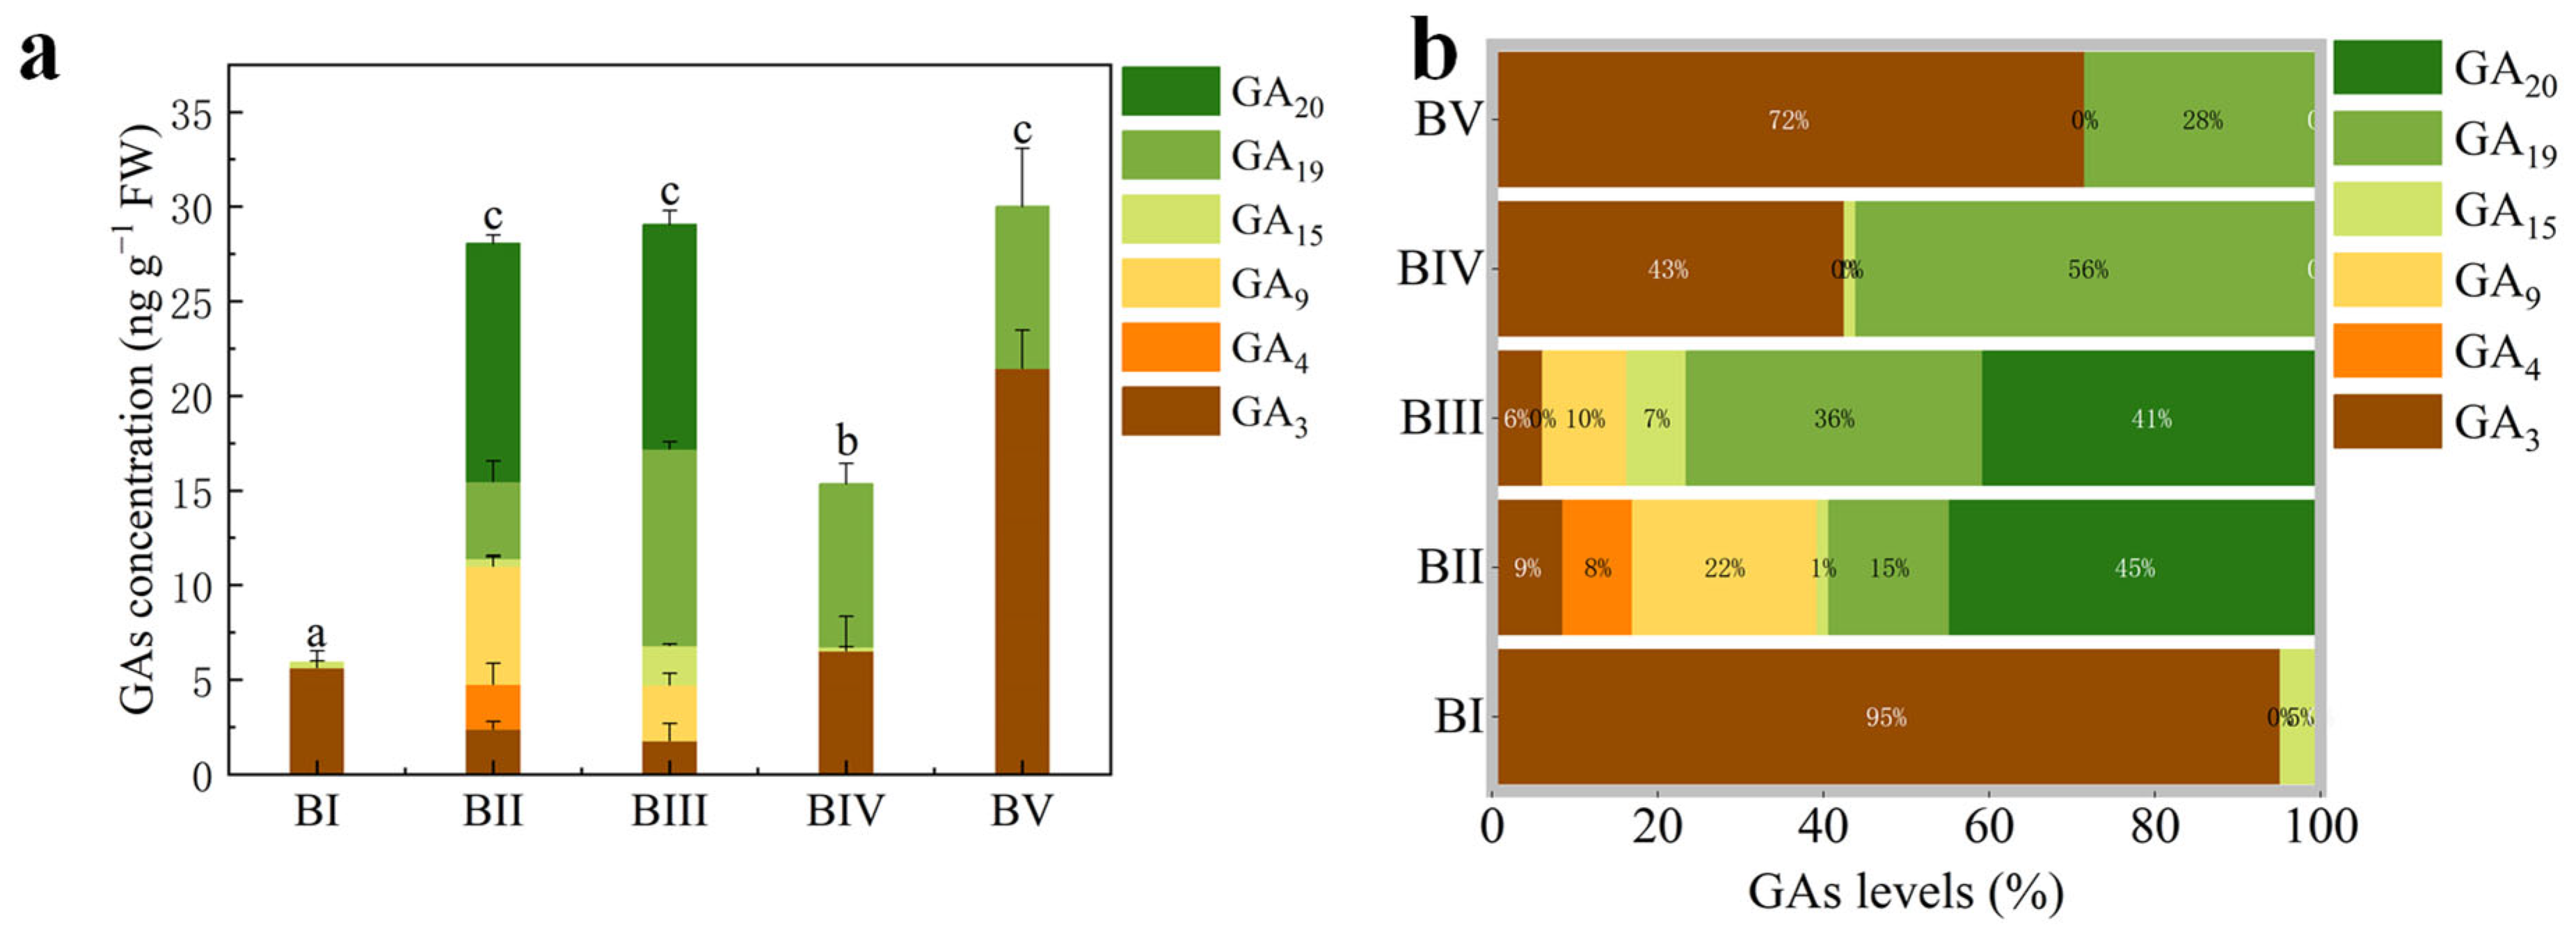
2.2. Quantitative Analysis of Endogenous Gibberellins in Buds at Different Developmental Stages

To investigate the involvement of GAs in floral initiation, we quantified endogenous GA levels in C. oleifera buds across five developmental stages. Of the 10 GA types assessed (GA1, GA3, GA4, GA7, GA9, GA15, GA19, GA20, GA24, and GA53), only 6 GAs—GA3, GA4, GA9, GA15, GA19, and GA20—were detected (Figure 2a). The total GA content was significantly higher in stages BII, BIII, and BV than in stages BI and BIV (Figure 2a). The dominant GA types in each stage were as follows: GA3 in BI and BV, GA19 in BIV, and GA20 in BII and BIII (Figure 2b). GA3 and GA4 are the biologically active forms of GA gibberellin. Notably, bioactive GA (GA3 + GA4) levels in BI, BII, BIII, and BIV were significantly lower than those in BV. GA4 was exclusively detected in BII, while GA3 was present in all stages, albeit at significantly lower levels in BII and BIII. These findings suggest that floral initiation in C. oleifera requires only a relatively low concentration of active GAs, whereas a higher concentration is essential for petal differentiation.

2.3. Transcriptome Assembly and Annotation

Transcriptomic analysis using RNA sequencing (RNA-seq) was performed to investigate the gene regulatory networks underlying floral initiation across the five developmental stages of C. oleifera buds. An overview of the RNA-seq samples and clean read counts is shown in Table 1. The proportion of mapped reads per library ranged from 79.05% to 83.41% (Table 1). Sequencing quality metrics were high, with Q30 values (sequences with a sequencing error rate of <0.1%) of >91% and Q20 values (sequences with a sequencing error rate of <0.1%) of >97%. The mean GC content across all samples ranged from 45.88% to 47.56%, indicating satisfactory transcriptome assembly quality.
Principal component analysis revealed that the 15 samples could be grouped into 3 clusters: BI, BII, and BIII–V (Figure 3a). Samples from stages BIII, BIV, and BV were clustered together, suggesting similar transcriptomic profiles. Transcript annotation was conducted using BLASTx (version 2.2.2.1) against several protein databases—NCBI non-redundant (Nr), Swiss-Prot, Clusters of Orthologous Groups, Gene Ontology (GO), and Kyoto Encyclopedia of Genes and Genomes (KEGG)—with an E-value threshold of 10−5. A total of 27468 unigenes were annotated across all databases, while 60632 unigenes (79.7%) were annotated in at least one database.

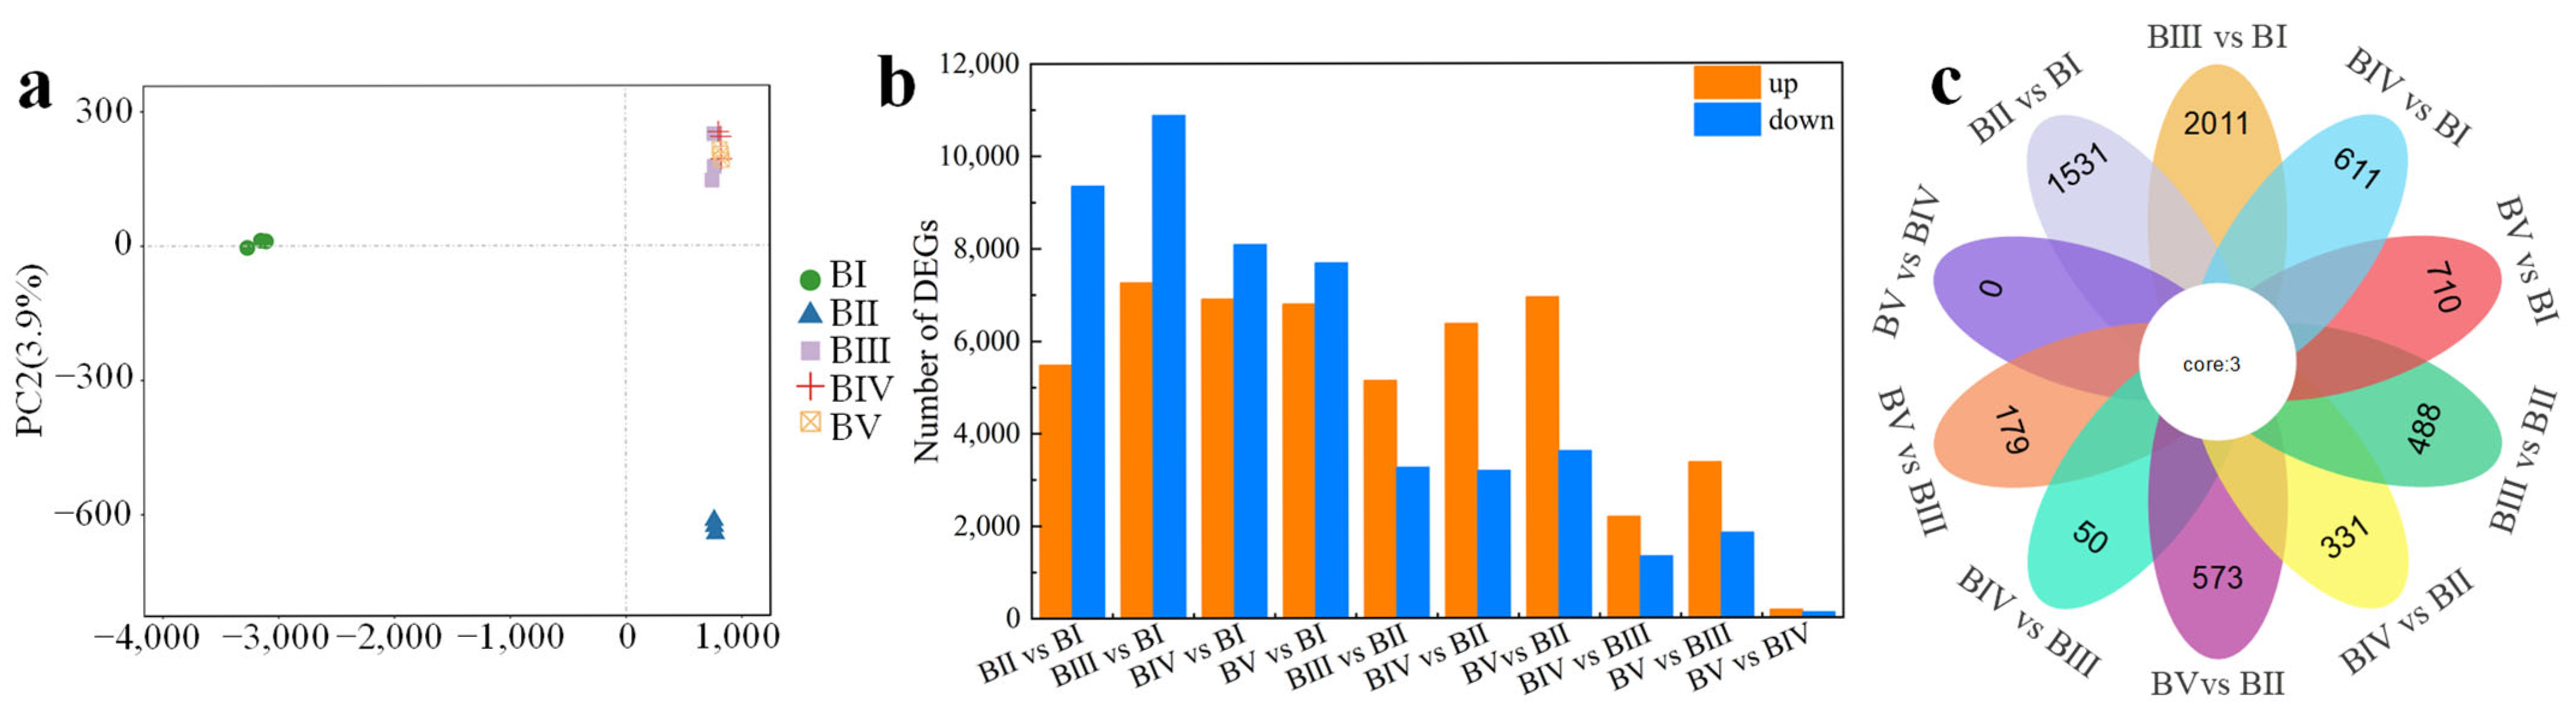
2.4. Differentially Expressed Genes at Different Developmental Stages

To identify genes associated with floral initiation, 10 pairwise comparisons of gene expression between stages were conducted. Differentially expressed genes (DEGs) were defined as those with |log2 (Fold Change)| > 1, a false discovery rate (FDR) < 0.05, and RPKM < 2 in all samples. A total of 26996 DEGs were identified across all comparisons. Notably, comparisons of BII vs. BI, BIII vs. BI, BIV vs. BI, and BV vs. BI each revealed more than 14,000 DEGs (Figure 2b), indicating substantial transcriptional differences between the dormancy stage (BI) and later stages (Figure 3b). Conversely, only 292 DEGs (173 upregulated and 119 downregulated) were identified in the BV vs. BIV comparison (Figure 3b), suggesting minimal transcription differences between these two stages. This indicates that stages IV and V share similar developmental characteristics. A comparison of common and unique DEGs across the 10 comparisons is shown in Figure 3c. Only three genes were differentially expressed in all comparisons. The absence of unique DEGs in the BV vs. BIV comparison supports the conclusion that transcriptional activity is highly conserved between these final stages.

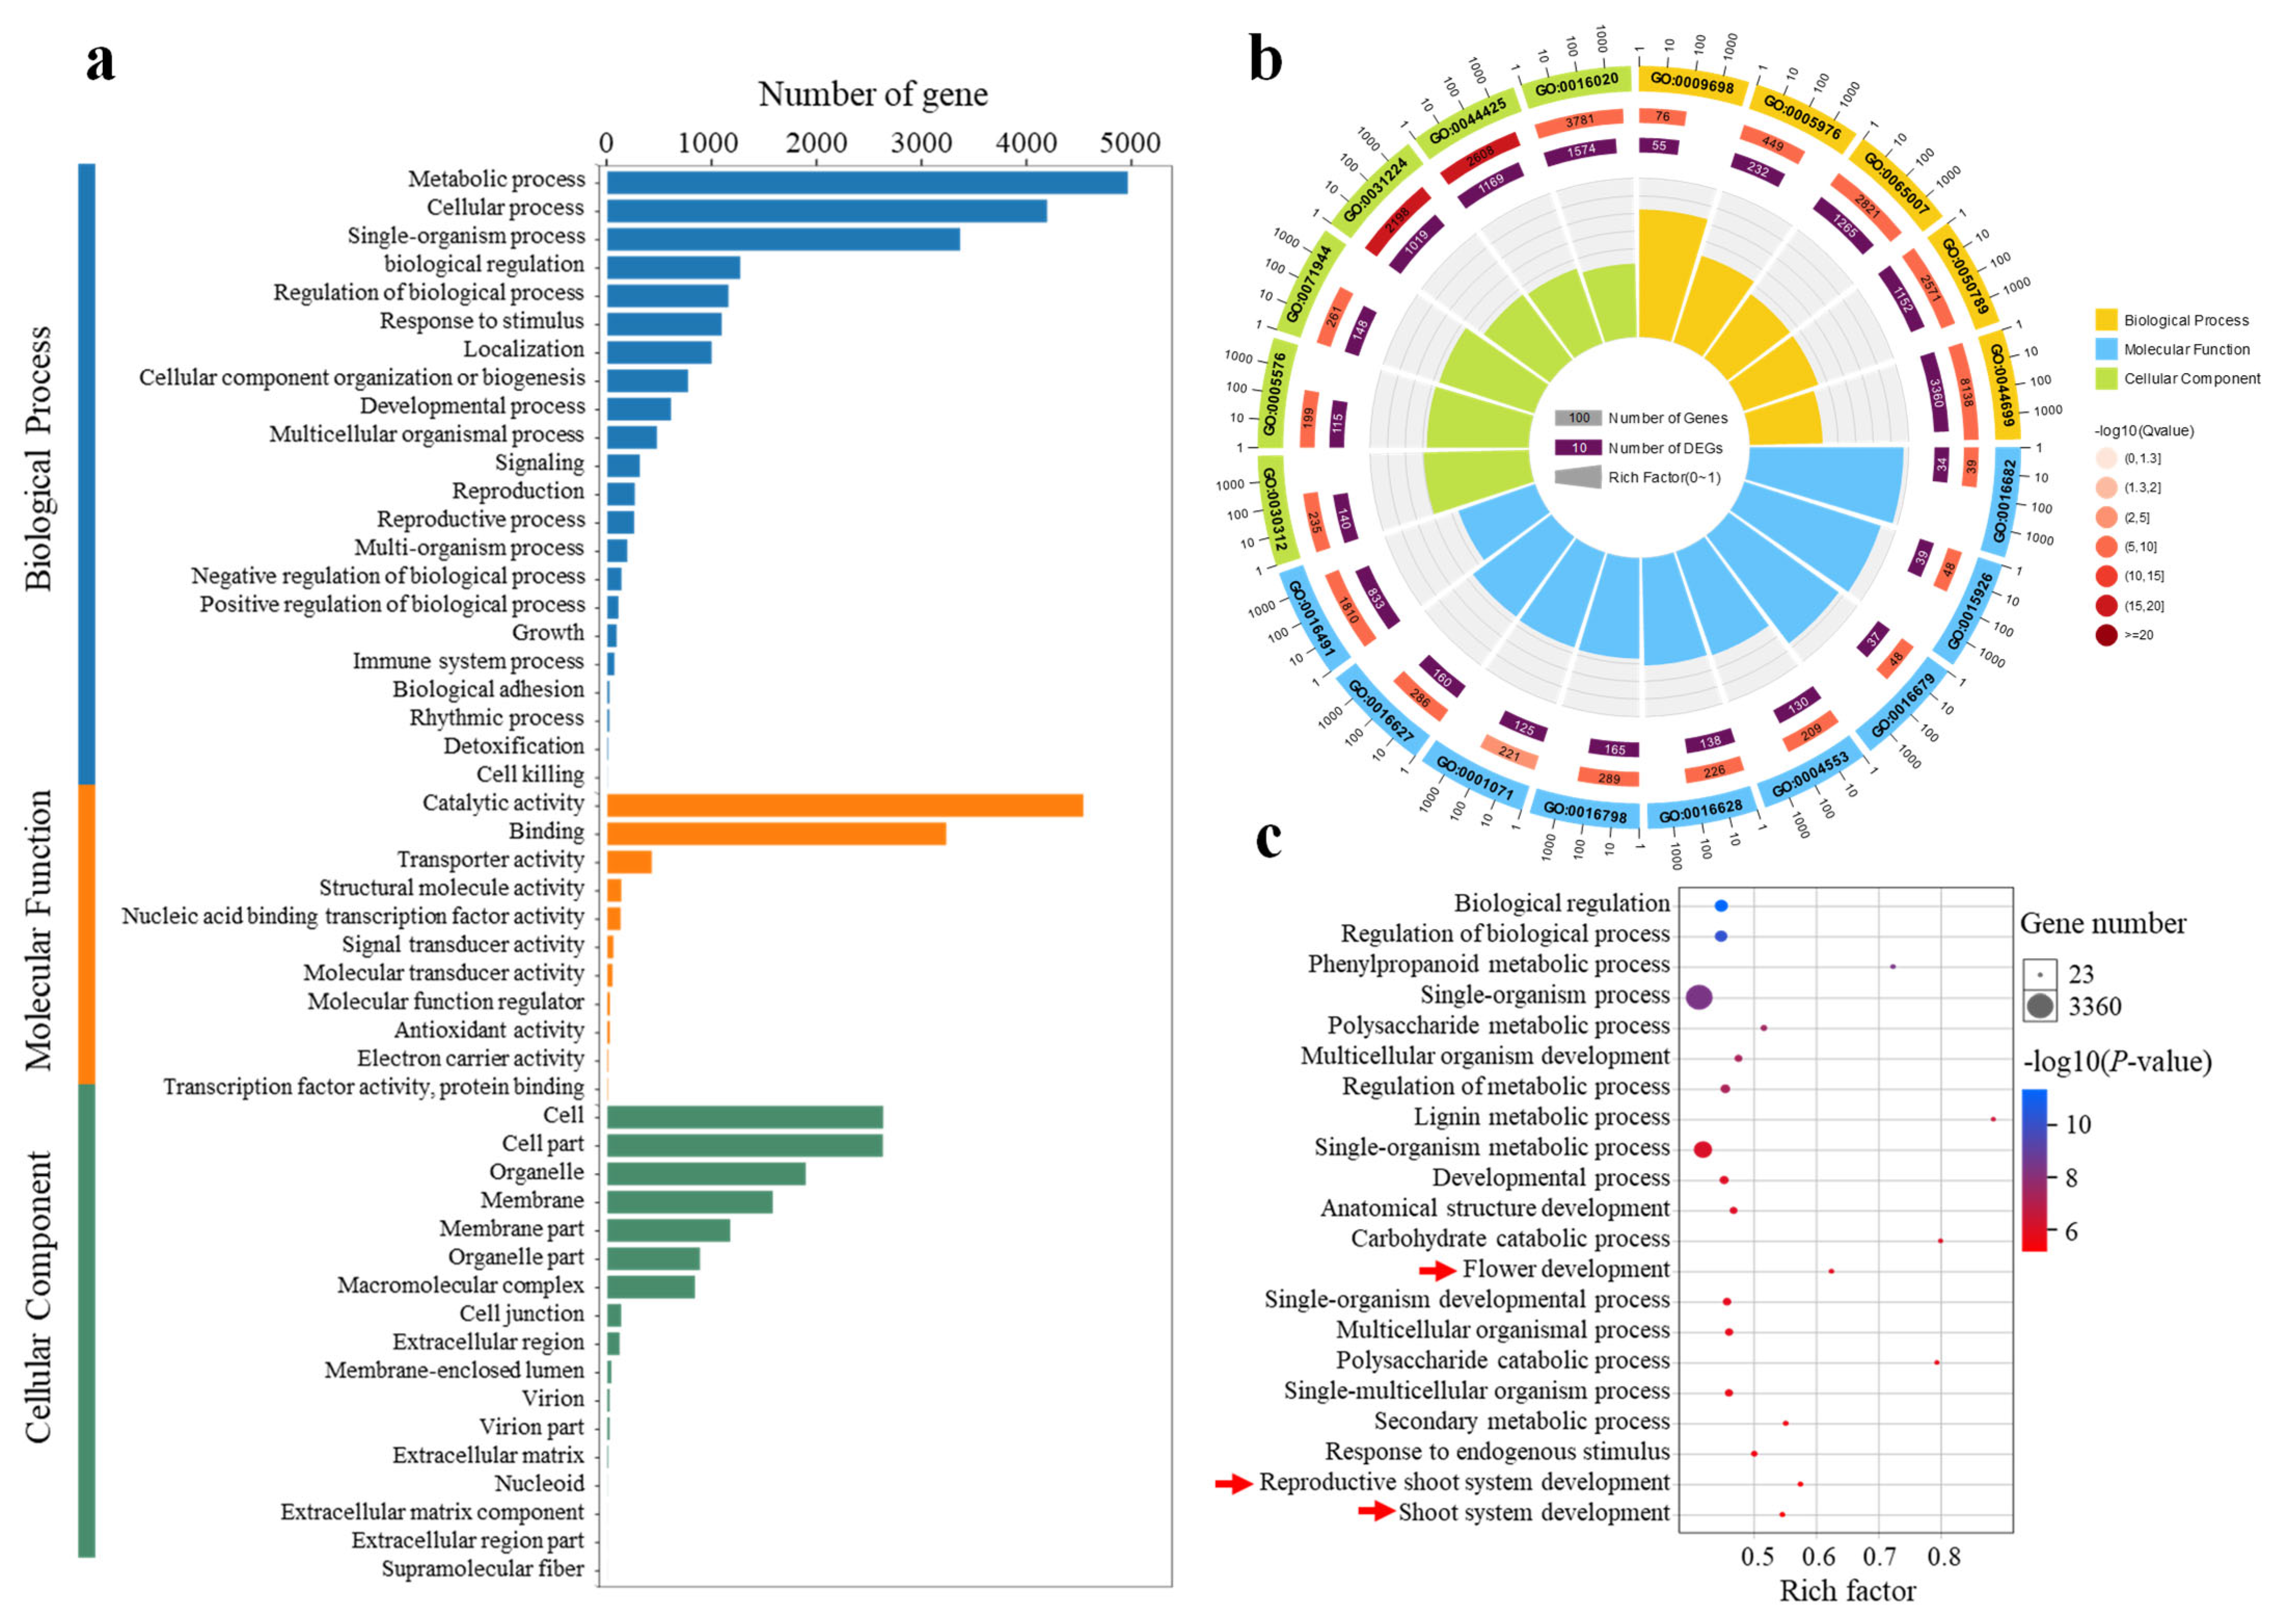
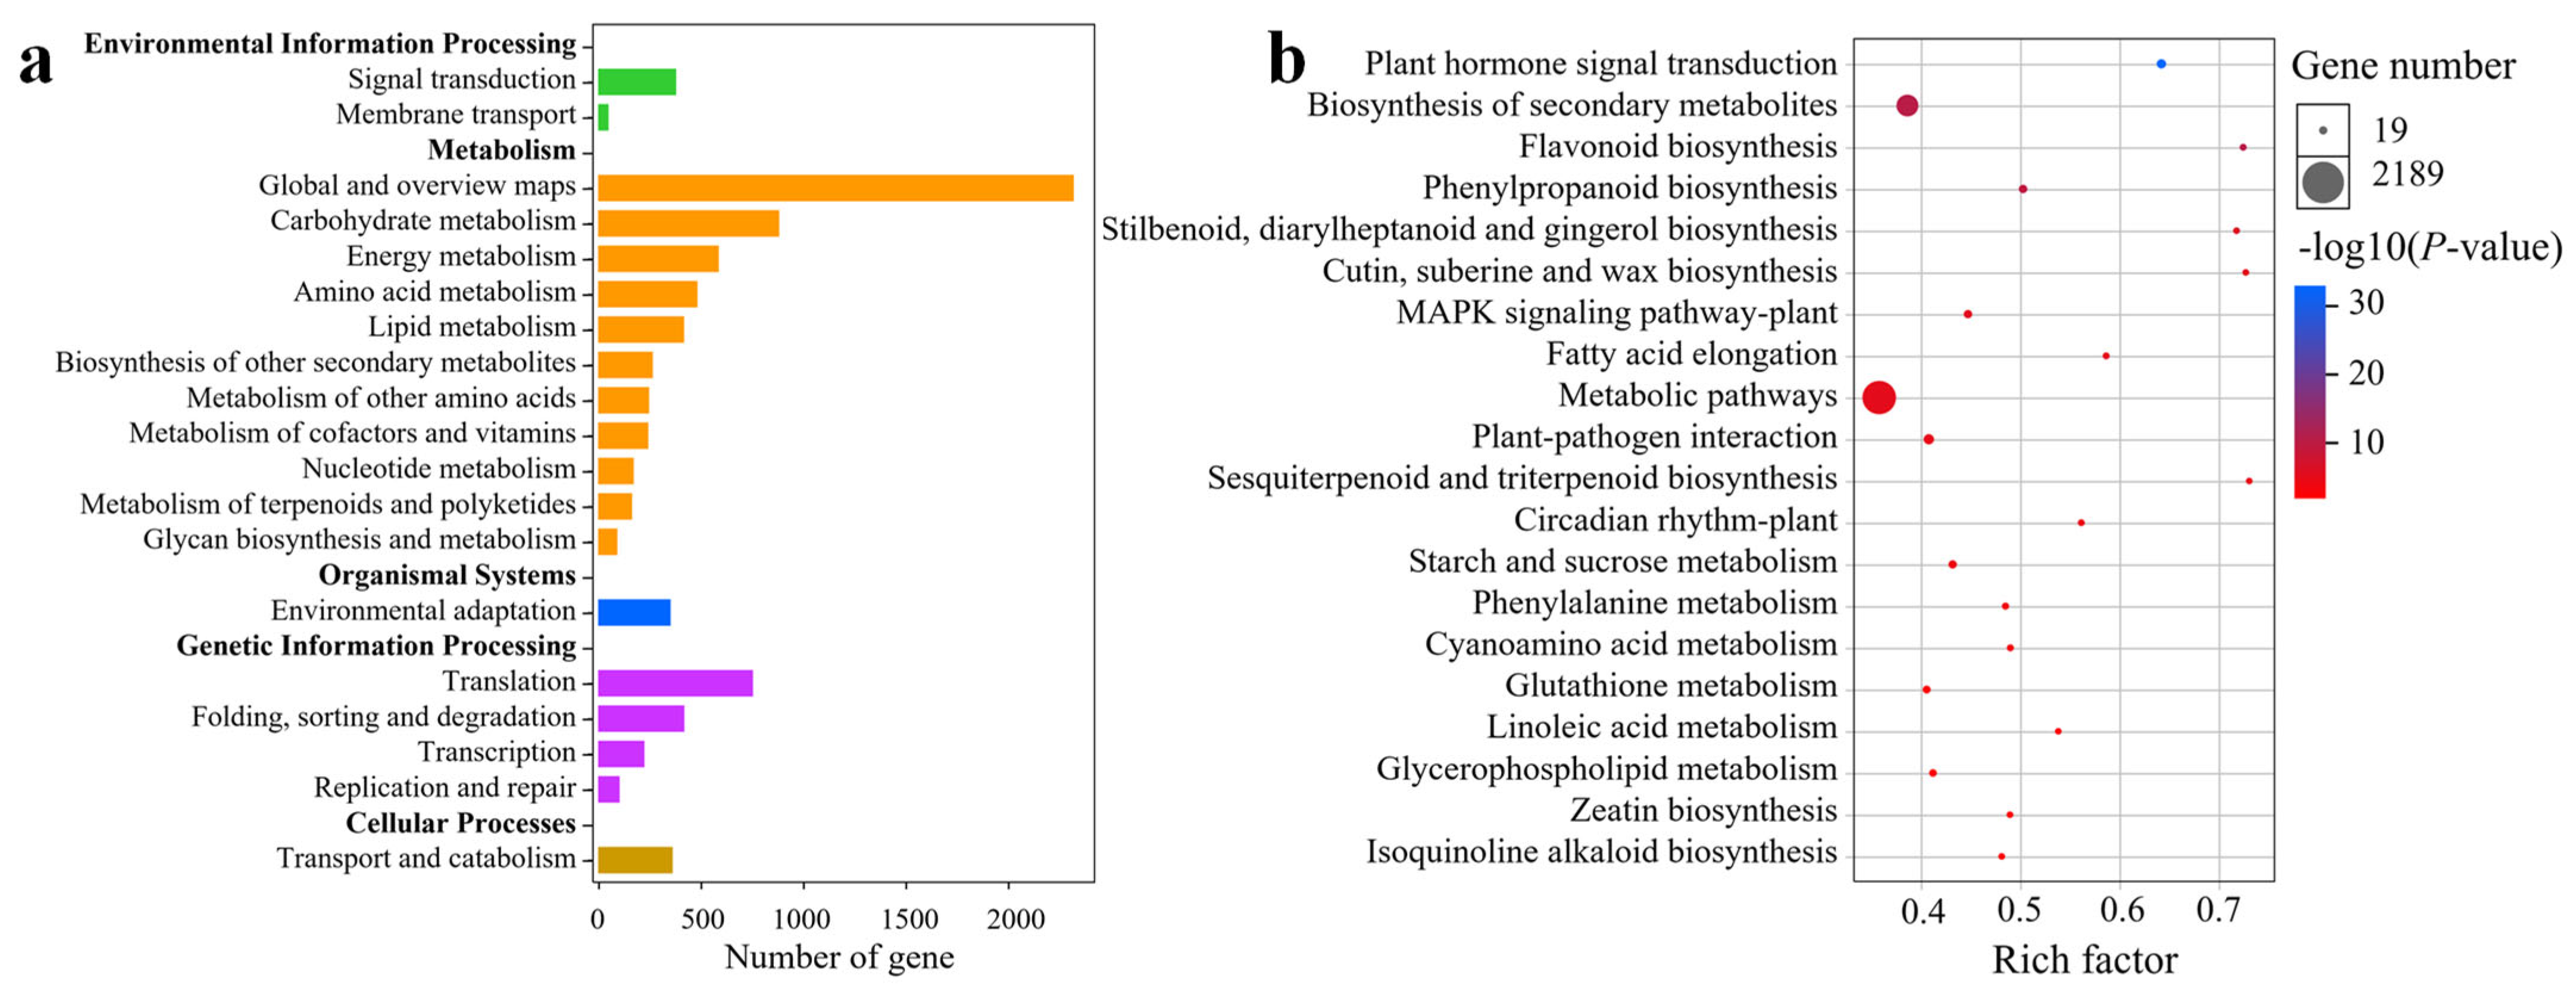
2.5. GO Enrichment Analysis of DEGs

To gain further insight into the DEGs, GO enrichment analysis was performed. Across all comparisons, 2457 GO terms were identified, including 50 Level-2 GO terms and 3 Level-1 GO terms distributed among the three major GO categories: biological process (BP), cellular component (CC), and molecular function (MF) (Figure 4a). Among the top 20 significantly enriched terms, 5 were classified as BP, 6 as CC, and 9 as MF (Figure 4b). As BPs are more directly related to floral initiation than CCs and MFs, these were analyzed in greater depth. A total of 6163 DEGs were enriched in 1606 BP GO terms, with the top 21 shown in Figure 4c. These primarily included biological regulation (GO:0065007), phenylpropanoid metabolic process (GO:0009698), developmental process (GO:0032502), flower development (GO:0009908), reproductive shoot system development (GO:0090567), and shoot system development (GO:0048367). Because floral initiation in C. oleifera occurs in the shoot apex or leaf axils, DEGs enriched in flower development, reproductive shoot system development, and shoot system development were further examined. The analysis revealed 65, 84, and 106 DEGs enriched in these respective categories. A Venn diagram showed that 64 DEGs were commonly enriched across all three processes, suggesting that floral initiation, flower development, and spring shoot growth are co-regulated by the same set of genes (Figure S1). This supports the hypothesis that floral initiation and shoot development may occur simultaneously in C. oleifera (Table S1).

2.6. KEGG Enrichment Analysis of DEGs

To further understand the significant DEGs identified, a KEGG pathway enrichment analysis was conducted. DEGs from 10 pairwise comparisons were categorized into 135 KEGG pathways, which were further grouped into 19 Level-B and 5 Level-A KEGG pathways (Figure 5a). The highest number of DEGs was associated with “Global and Overview Maps,” followed by pathways involved in carbohydrate metabolism and translation. Among the 135 KEGG pathways, 30 were significantly enriched (p < 0.05), and 18 of those were highly significantly enriched (p < 0.01). Analysis of the top 20 significantly enriched KEGG pathways revealed major involvement in plant hormone signal transduction, biosynthesis of secondary metabolites, flavonoid biosynthesis, phenylpropanoid biosynthesis, metabolic pathways, circadian rhythm plants, and starch and sucrose metabolism (Figure 5b). Specifically, 50 DEGs were related to the circadian rhythm plant pathway (Table S2), and 261 DEGs were associated with plant hormone signal transduction (Table S3). These findings suggest that circadian rhythm and hormone signaling likely play important roles in the floral initiation process of C. oleifera.

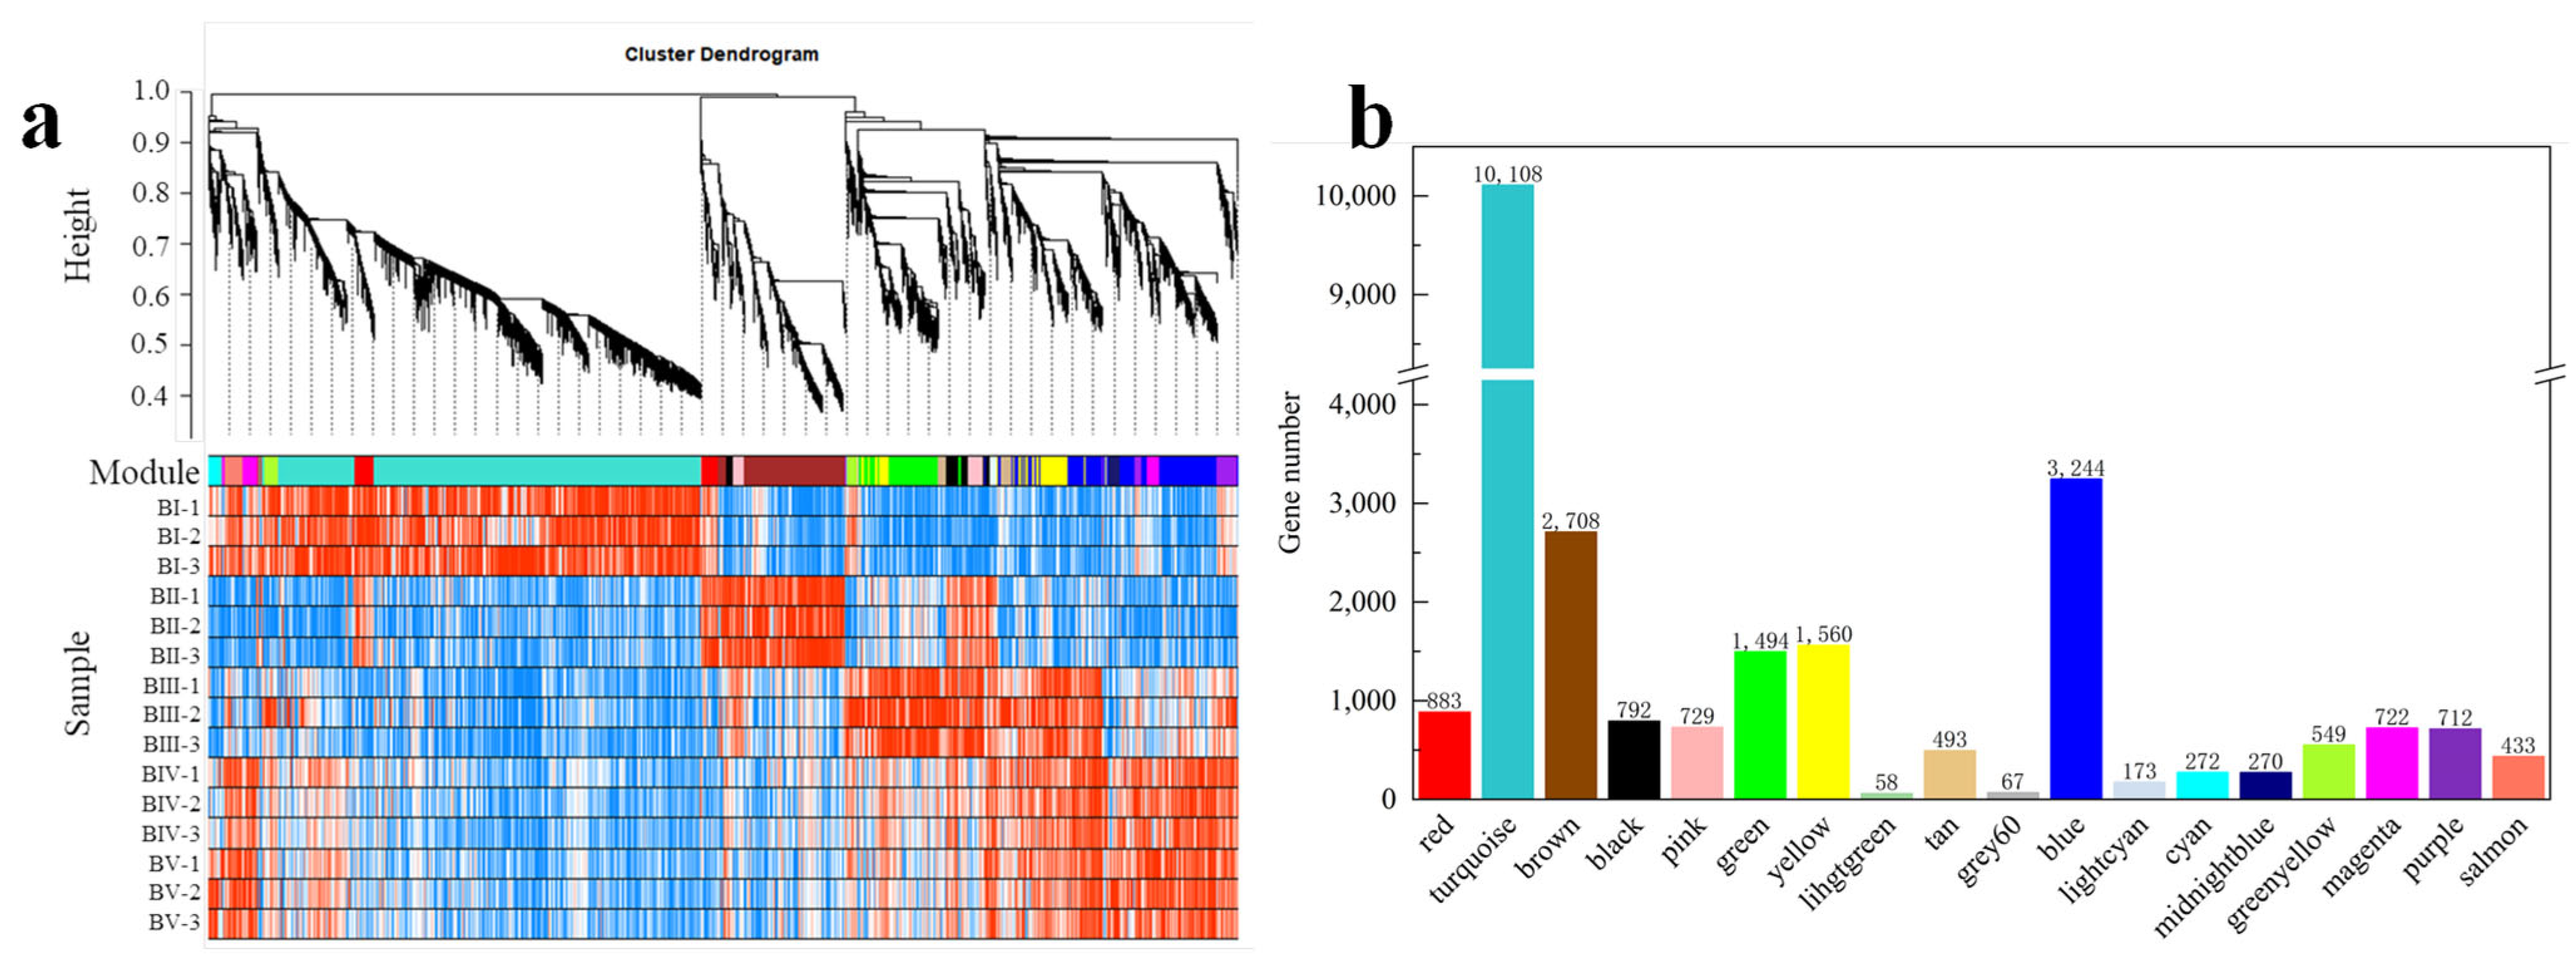
2.7. WGCNA Analysis of DEGs

To gain a comprehensive understanding of gene expression throughout the developmental stages of floral initiation and petal differentiation—and to identify key genes associated with floral initiation—a WGCNA was performed. From the 26,996 DEGs identified across the 10 comparisons, genes with low variation (MDA < 0.1) or excessive missing data (>10% samples) were filtered out. Ultimately, 25,267 genes with non-zero variance were retained. A co-expression network was constructed based on pairwise correlations of gene expression across samples. Highly correlated genes were grouped into modules, with smaller similar modules merged using a module merging threshold of 0.15 (Figure 6a). A total of 18 modules were generated, and the number of DEGs in each specific module is shown in Figure 6b.

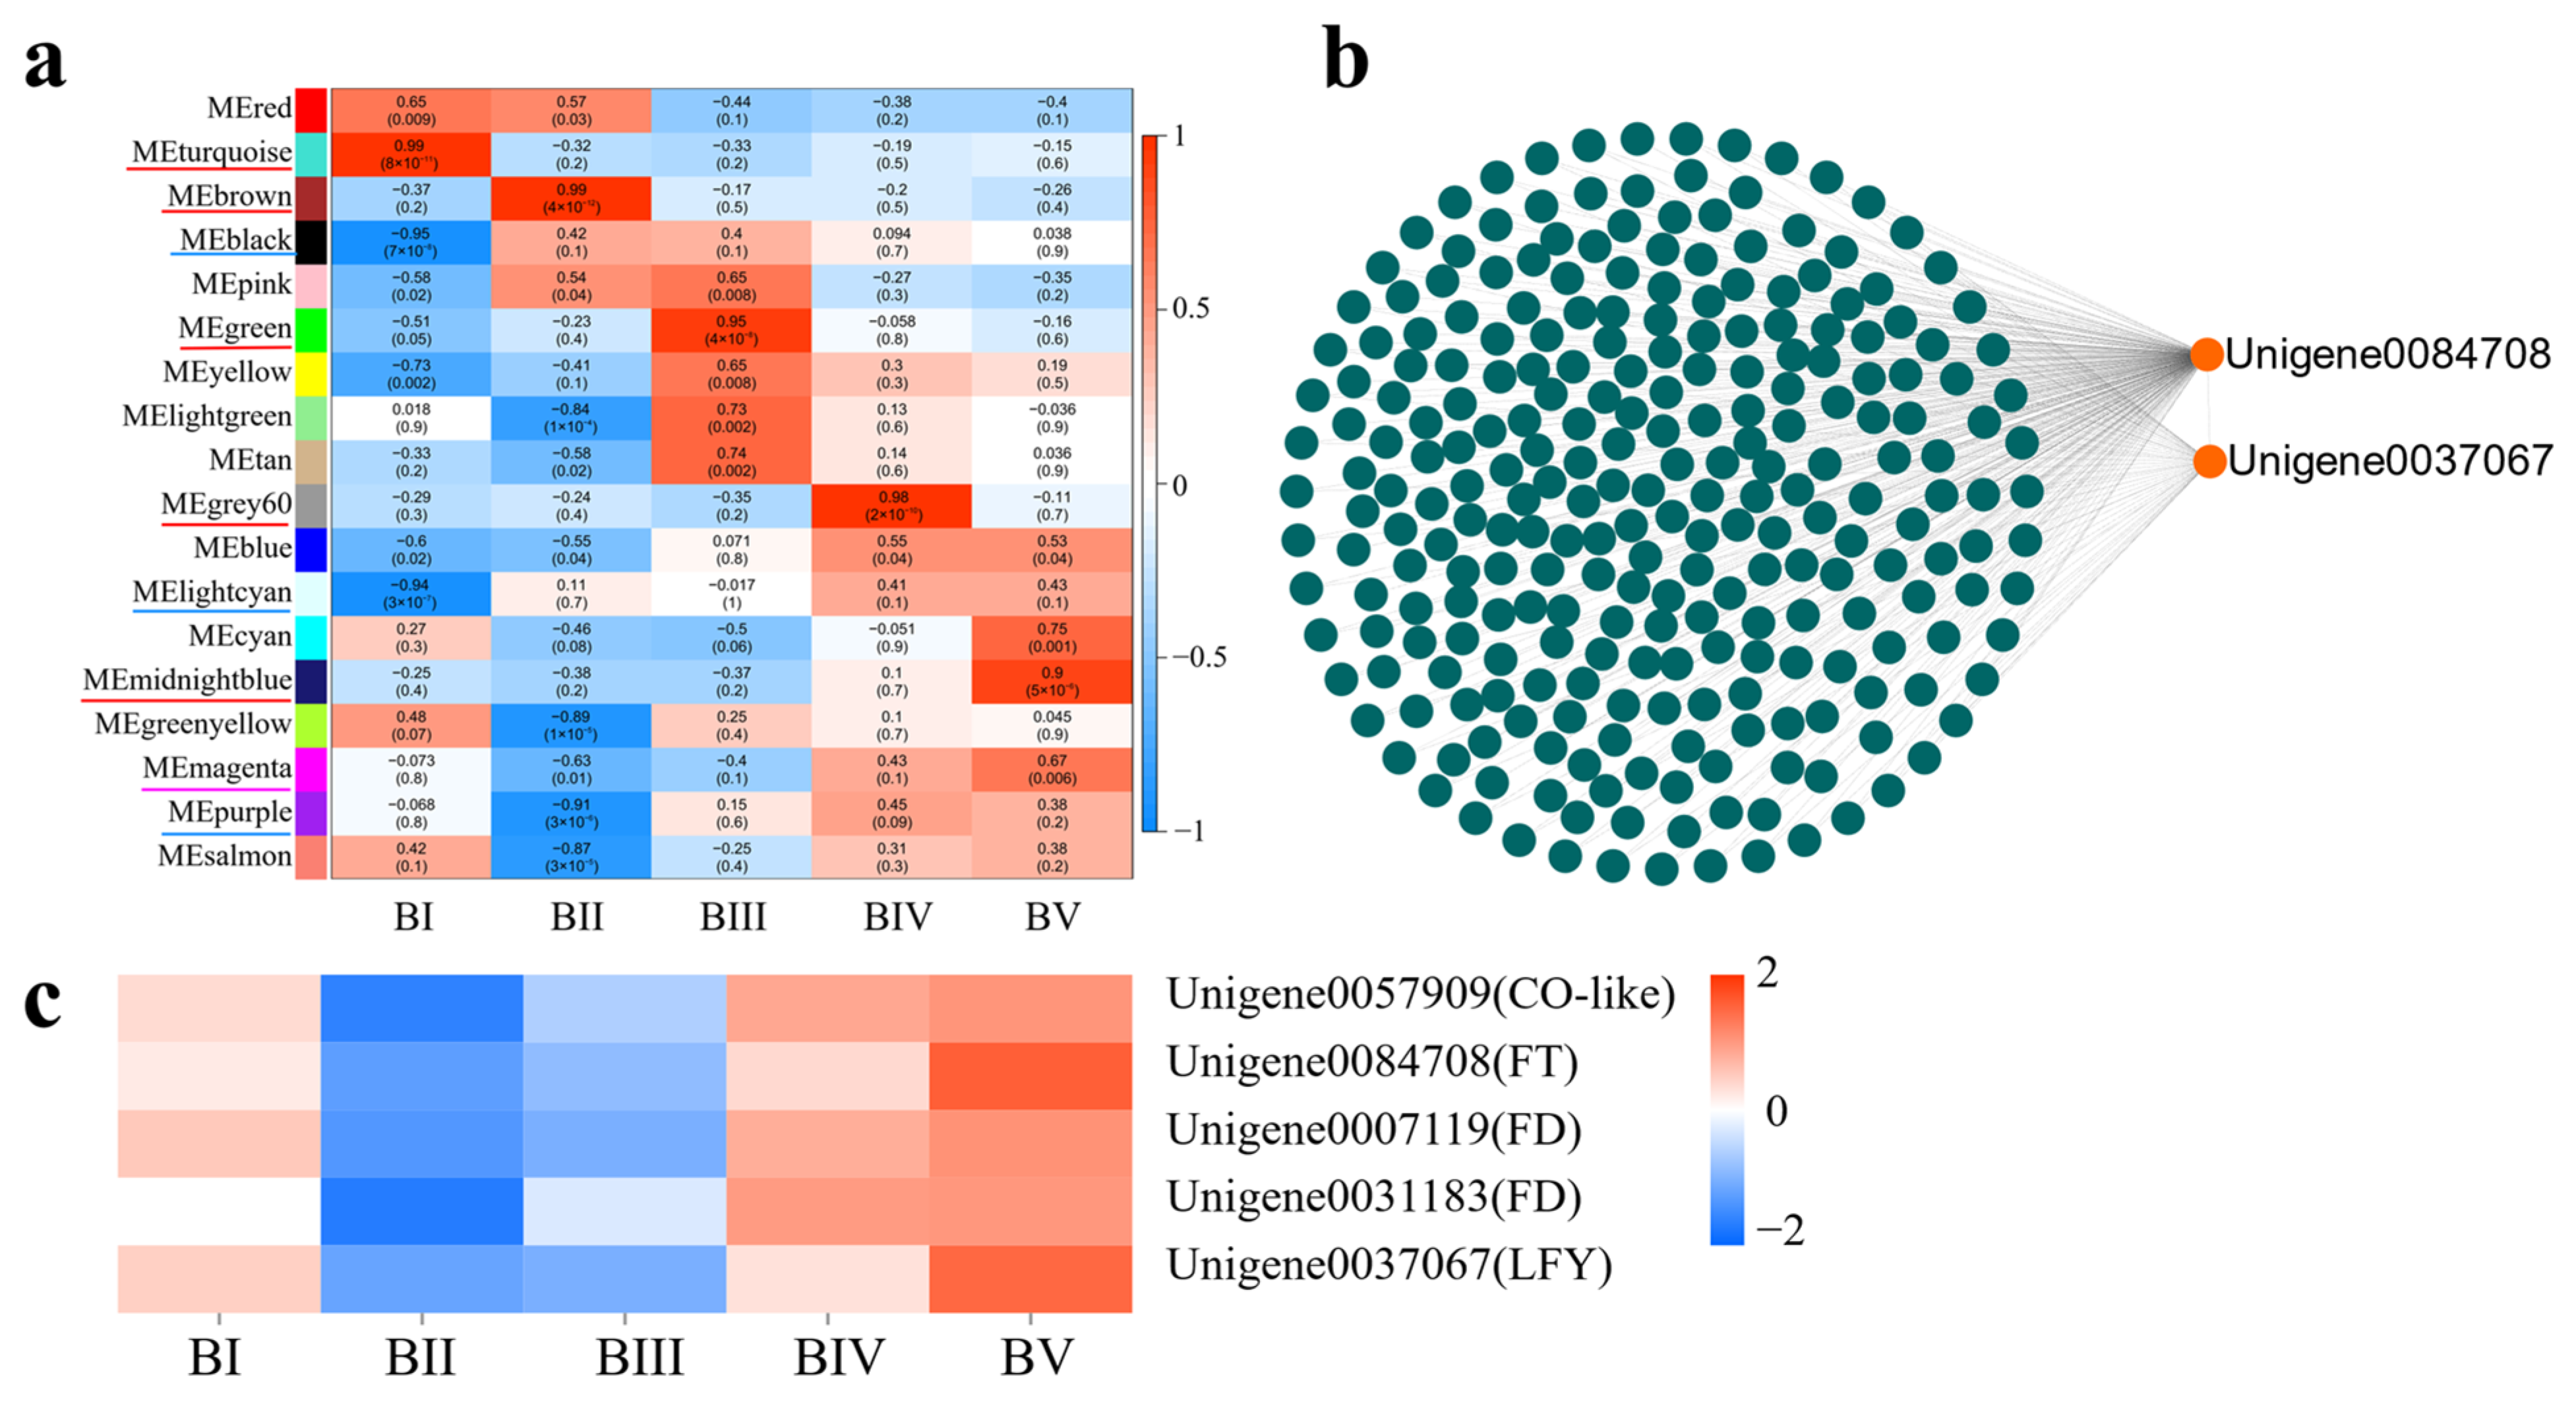
2.8. Identification of Core DEGs at Each Developmental Stage

To identify modules specifically associated with each developmental stage, a labeled heatmap was used to analyze the correlation between modules and sample stages. Modules with correlation coefficients above 0.90 and p < 0.01 were considered stage-specific, resulting in the identification of eight specific modules. Notably, the turquoise, brown, green, grey60, and midnightblue modules showed significant positive correlations with BI (dormancy), BII (sprouting), BIII (flower bud primordium formation), BIV (petal differentiation), and BV (completion of petal differentiation), respectively. These are marked with red underlines in Figure 7a. Conversely, the black and lightcyan modules were significantly negatively correlated with BI, and the purple module was negatively correlated with BII, indicated with blue underlines. The DEG information of the top seven KME in these specific modules is shown in Table S4.To explore the functional roles of these modules, GO enrichment analysis was performed on the DEGs within each. In the turquoise module, 1180 GO BP terms were enriched, with 121 GO terms being statistically significant (p < 0.05), including 9 terms related to flowering (p < 0.05). A total of 75 candidate DGEs enriched in these flowering-related terms were identified. Based on the WGCNA network relationships, a co-expression network was built using Cytoscape, revealing two core candidate genes (Table S5, Figure S2a). Applying the same method to other modules, five and three core candidate genes were identified in the brown and green modules, respectively (Tables S6 and S7, Figure S2b,c). However, no core floral initiation-related DEGs were found in the grey60 or midnightblue modules.

2.9. Identification of Core DEGs Related to Floral Initiation During Whole Floral Initiation

Because floral development is a continuous process, we also focused on DEGs with consistent expression trends during floral initiation. According to the WGCNA analysis, the DEGs in the magenta module stood out. This module contained 722 DEGs enriched into 510 GO BP terms, of which 99 were significantly enriched. Nine of these GO terms were directly related to floral initiation: flower development (GO:0009908), reproductive shoot system development (GO:0090567), reproductive structure development (GO:0048608), reproductive system development (GO:0061458), negative regulation of flower development (GO:0009910), negative regulation of the reproductive process (GO:2000242), floral organ development (GO:0048437), floral organ formation (GO:0048449), and floral organ morphogenesis (GO:0048444). A total of eight candidate DEGs significantly enriched in these nine GO terms were identified (Table S8). A co-expression network constructed in Cytoscape based on WGCNA relationship pairs revealed two key candidate genes: Unigene0084708 (CoFT) and Unigene0037067 (CoLEAFY) (Figure 7b). Meanwhile, the upstream regulatory gene Unigene0057909 (CoCO-like) and two interacting genes of CoFT—Unigene0007119 (CoFD) and Unigene0031183 (CoFD)—were also present in the magenta module (Figure 7c). Together, these findings suggest that the CoCO-like-CoFT signaling pathway plays a crucial regulatory role during the floral initiation process in C. oleifera.

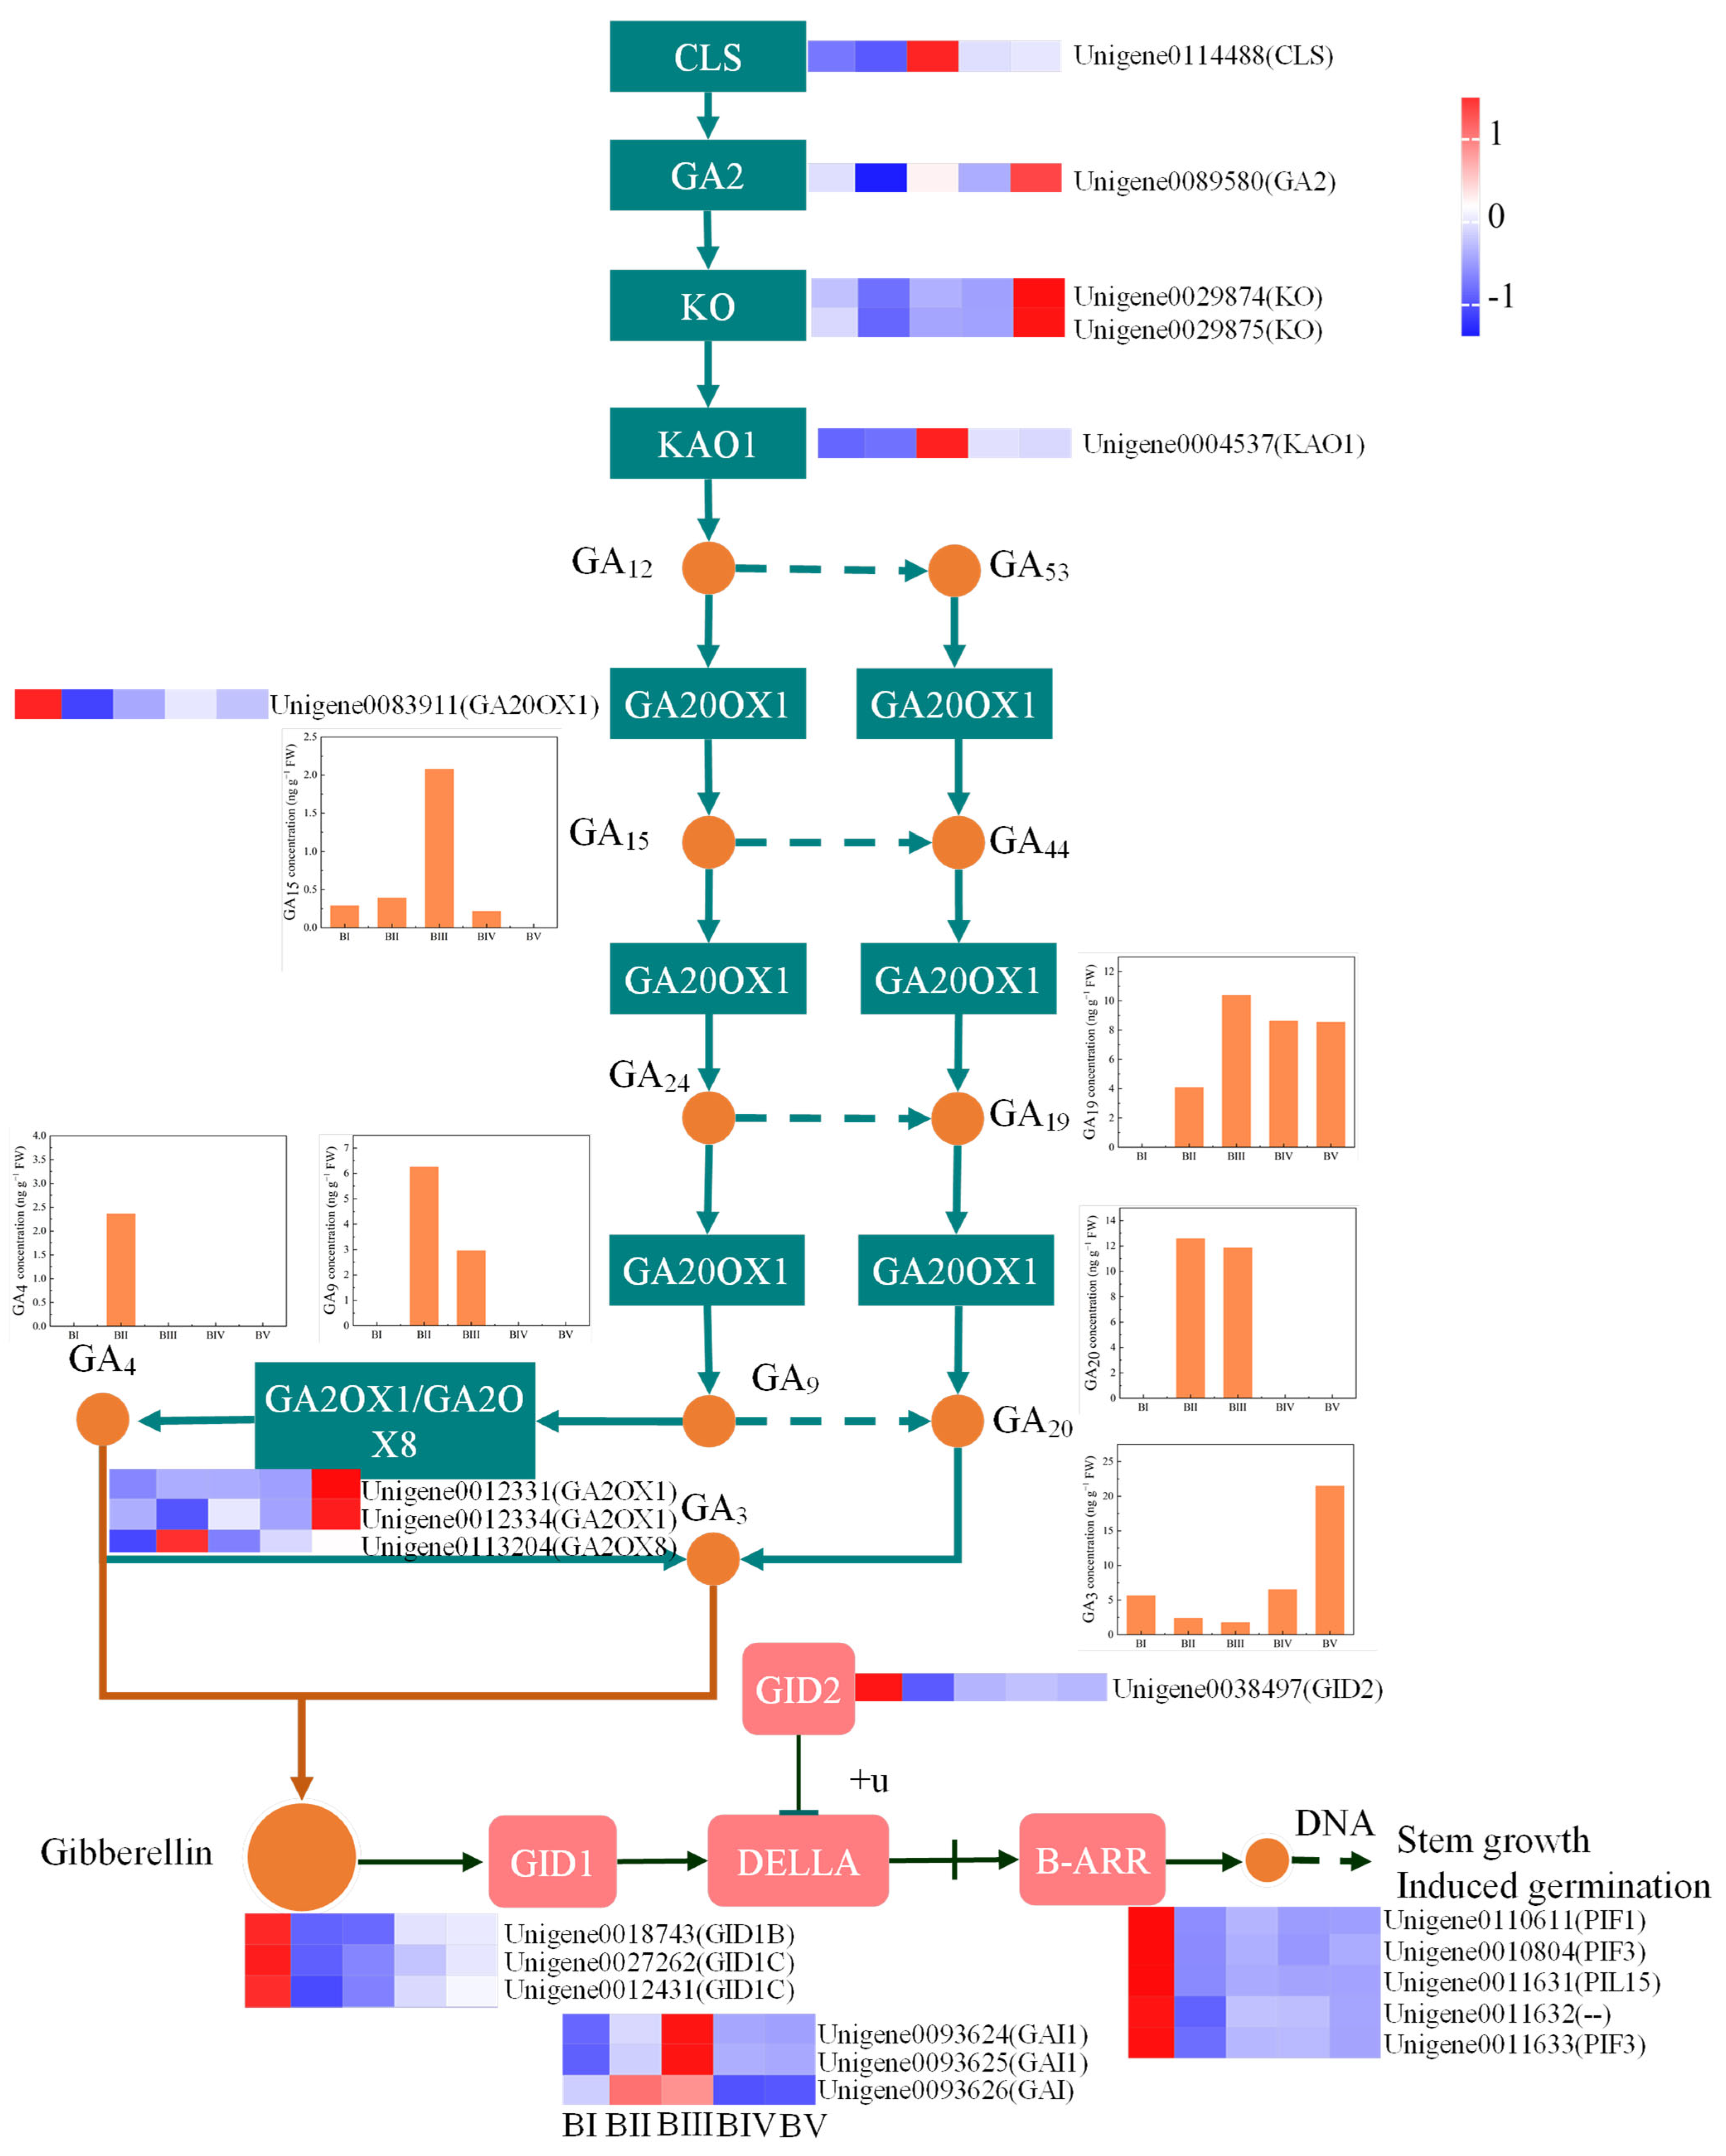
2.10. Identification of the DEGs Involved in Gibberellin Biosynthesis and Signal Transduction

GAs, a class of phytohormones, play a crucial role in floral initiation. KEGG enrichment analysis of DEGs revealed significant enrichment in plant hormone signaling pathways. Therefore, we further analyzed DEGs associated with GA biosynthesis and signal transduction. In the GA biosynthesis pathway, we identified eight DEGs involved in regulating the synthesis of various GAs, including ent-copalyl diphosphate; ent-kaurene; ent-7alpha-hydroxykaur-16-en-19-oic acid; and GA15, GA9, GA19, GA20, GA3, and GA4. In the GA signaling pathway, 12 DEGs were associated with GA signal transduction, namely, 3 GID1, 3 DELLA, 1 GID2, and 5 B-ARR genes.

2.11. Quantitative Real-Time PCR Analysis

Quantitative real-time PCR (qRT-PCR) analysis was conducted to validate the accuracy of the RNA-seq data. Twelve floral initiation-related DEGs were selected for qRT-PCR analysis across all samples. The expression patterns identified through qRT-PCR were consistent with those obtained from RNA-seq (Figure S3), confirming the reliability of the transcriptomic data.

3. Discussion

3.1. Reproductive Shoot Development Is a Key Component of the Reproductive Growth Initiation in the Annual Growth Cycle of Adult C. oleifera

Flowering is a pivotal phase in plant reproductive development, determining seed production and species propagation [27]. Flower formation begins when the vegetative stem apical meristem transitions to a reproductive meristem, which differentiates into a floral meristem and eventually gives rise to floral organs under the coordinated regulation of development signals and floral organ identity genes [14,29]. The regulation mechanisms of flowering differ between annual herbaceous and perennial woody plants [7]. In some woody perennials such as poplar, apple, citrus, and pear [21,30,31,32,33,34], flower bud differentiation occurs 1 year before blooming, with buds entering a dormancy phase before flowering the following year. By contrast, other species such as longan and mango initiate and complete flower development within the same year or even flower multiple times annually [25,35,36]. Thus, there are differences in the regulation of flowering traits between woody plants. In C. oleifera, floral bud primordia form at terminal or axillary buds during the growth of spring shoots and leaf expansion [28]. These spring shoots, serving as the primary flowering and fruiting structures, are identified as reproductive shoots. In the present study, 65 DEGs were implicated in both flower development and reproductive shoot development. Transcriptomic analysis confirmed that floral initiation and spring shoot growth in C. oleifera occur concurrently. Thus, reproductive shoot development is an integral component of reproductive growth initiation during the annual growth cycle. Based on morphological and transcriptomic findings, we propose that floral initiation and reproductive shoot growth originate simultaneously and spatially coincide.

3.2. The Photoperiod Pathway Involving CoCO-like, CoFT, and CoLFY Promotes Stem Apex Meristem Differentiation and Floral Initiation in C. oleifera

Extensive research has established that floral transition in plants is regulated by complex interactions between internal genetic factors and external environmental stimuli. Among these, the CO-FT signaling axis plays a central regulatory role [13,37]. Meanwhile, LFY acts as a master regulator of floral identity and is transcriptionally regulated by both TFL1 (a repressor) and FT (an activator) [32,38]. FT competes with TFL1 to form a complex with TFL1, thereby activating LFY expression and promoting the floral transition [39]. In C. oleifera, the regulatory role of FT in floral induction has been demonstrated experimentally [40,41,42]. Our results revealed similar expression patterns of CoCO-like, CoFD, CoFT, and CoLFY, suggesting that this photoperiod-regulated module orchestrates floral induction by integrating exogenous environmental cues into endogenous developmental programs. This CO-FT-LFY module likely plays a conserved and central role in floral regulation in C. oleifera.

3.3. GA4 and GA3 Might Play Different Roles in the Floral Initiation of C. oleifera

GA signaling is one of the principal floral pathways regulating flowering in plants [43]. Although many early studies have revealed the large chemodiversity of GAs in plants, only GA1, GA3, GA4, and GA7 are biologically active, controlling plant development [44,45,46]. The GA signaling pathway involves four key components, bioactive GAs, the GA-receptor GA INSENSITIVE DWARF1 (GID1), the central repressor DELLA, and the specific F-box protein SLEEPY1 (SLY1), which facilitates DELLA degradation [47]. This pathway is closely associated with endogenous GA levels in plants [45,46,48]. In chrysanthemums, elevated endogenous GA levels accelerate floral transitions from the juvenile to adult stage and promote early flowering [49]. In peach, bud sensitivity to GAs varies across developmental stages [50], and in tree peony, GA3 more effectively promotes endodormancy release than GA4 [51]. Thus, both GA type and concentration, along with development timing, are critical in GA-mediated floral regulation. In our work, six GAs were detected during floral initiation and petal development, but only GA3 and GA4 were bioactive. Noteworthy, GA4 was exclusively detected during the sprouting stage, along with its precursor GA9, suggesting a potential role for GA4 in bud break. Given our finding that floral initiation and reproductive shoot development occur concurrently in C. oleifera and previous reports stating that GA4 promotes dormancy release in the flower buds of Japanese apricot [52], we hypothesize that trace GA4 levels contribute to initiating floral and shoot development.
GA3 is known to regulate floral initiation and flowering time in plants, but the regulatory results are different or even opposite for different plants [53,54]. In our study, GA3 concentrations varied throughout floral development, with lower levels observed during the sprouting stage than during the dormancy and petal differentiation stages. This suggests that a low GA concentration may suffice for floral initiation in C. oleifera, whereas higher concentrations are required for petal differentiation. This also implied that GA3 may primarily influence petal development.

3.4. GA20OX1 and GA2OX8 Are the Key Candidate Genes in GA-Mediated Regulation of Floral Initiation by Gibberellin Pathway

GA20OX1 and GA3OX are critical enzymes for the biosynthesis of bioactive GAs, which in turn regulate flowering and other developmental processes [55]. The balanced activity of genes associated with GA biosynthesis and GA inactivation, like GA2OX, is essential for maintaining optimal GA levels and proper developmental timing by allowing plants to respond appropriately to environmental cues and internal signals [55,56]. Excessive and insufficient GA levels can both disrupt the timing and efficiency of flowering [57,58]. Our results detected bioactive GAs (GA3 and GA4) and their biosynthetic precursors (GA15, GA19, GA9, and GA20) during floral initiation. Integrative analysis of endogenous GA monomer concentrations, DEGs involved in GA biosynthesis, and those involved in GA signal transduction pathways identified GA20OX1 as a central gene regulating GA3 synthesis during floral initiation (Figure 8). Moreover, a positive correlation was found between GA4 levels and GA2OX8 expression, suggesting that GA2OX8 predominantly modulates GA4 levels. Notably, GA signaling-related genes exhibited elevated expression in early developmental stages, aligning with spring shoot sprouting—a critical phase of development. These findings suggest that low levels of active GAs are sufficient for spring shoot sprouting and floral initiation, whereas higher levels are required for floral organ development. This insight could inform targeted application of exogenous GAs to regulate distinct developmental phases in C. oleifera.

4. Materials and Methods

4.1. Plant Growth, Sample Collection, and Morphological Characteristics Analysis

The adult Camellia oleifera (cultivar ‘changlin53’) were grown under natural conditions in an experimental field at Experimental Center for Subtropical Forestry, Chinese Academy of Forestry (ECSF, CAF), which is located at Fenyi county, Jiangxi Province, China (27°49′ N, 114°39′ E; altitude 88–92 m). The different developmental stages of experimental materials were collected from February to June, and detailed information is shown in Table 1. After sampling, the tissues were quickly frozen in liquid nitrogen and stored at −80 °C until RNA isolation. Three biological replicates were used for each of the sampling points, and each biological replicate involved three mixed plant samples. Morphological characteristics analysis was performed according to Guo [59].

4.2. Quantitative Analysis of Endogenous Gibberellins

All biological specimens were cryogenically pulverized in liquid nitrogen. Precisely 50 mg of homogenized tissue was weighed (±0.1 mg accuracy) and supplemented with isotope-labeled internal standards. Metabolite extraction was carried out using 1 mL of methanol/water/formic acid (15:4:1, v/v/v) with vortex agitation for 30s, followed by ultrasonication (25 °C, 15 min). The supernatant was evaporated to dryness under a nitrogen stream (40 °C) and reconstituted in 100 μL of 80% methanol/water (v/v). The solution was filtered through a 0.22 μm Millipore filter prior to UPLC-MS/MS analysis. Quantitative profiling was conducted using ultra-performance liquid chromatography (UPLC; ExionLC™ AD system, SCIEX, https://sciex.com.cn/) coupled with tandem mass spectrometry (MS/MS; QTRAP® 6500+ system, SCIEX, https://sciex.com.cn/). Ionization was performed via electrospray ionization (ESI) under the following conditions: ion source temperature of 550 °C, ion spray voltage of +5500 V (positive ion mode)/−4500 V (negative ion mode), and curtain gas (CUR) at 35 psi. The calibration curve’s construction was carried out as follows: A 12-point calibration series (0.01–500 ng/mL) was prepared by serial dilution of certified reference standards. Calibration curves were constructed by plotting the ratio of analyte-to-internal standard peak areas against their corresponding concentration ratios. Linear regression models (weighting factor: 1/x2) were validated, with R2 > 0.995 for all analytes. Endogenous hormone concentrations were calculated using the following formula:
Concentration (ng/g) = c × v/1000/m
where C is the analyte concentration (ng/mL) derived from calibration curves based on integrated peak area ratios, V is the reconstitution volume (μL), and M is the sample’s mass (g).

4.3. Transcriptome Sequencing

Total RNA was extracted from all samples using the RNA prep Pure DP441 (Tiangen, Beijing, China), following the manufacturer’s protocol. The integrity and pollution were measured using agarose gel electrophoresis (AGE). The purity of the RNA samples was measured using a NanoDrop Micro-spectrophotometer (Thermo Scientifc, Waltham, MA, USA). The accurate concentration of the RNA samples was measured using a Qubit2.0 Fluorometer (Thermo Scientifc, Waltham, MA, USA). Accurate integrity was measured using an Agilent 2100 bioanalyzer (Agilent Technologies, Santa Clara, CA, USA). Clean data were obtained by removing reads containing adapters and removing poly-N and low-quality reads from raw data. Trinity software (Version v2.8.4) was used to assemble reads [60]. BUSCO software was used to evaluate the completeness of the assembly, and the results are shown in Figure S4 [61].

4.4. Functional Annotation of the Transcriptome

Gene function was annotated using the following databases: Nr (NCBI non-redundant protein sequences), Swiss-Prot (a database of manually annotated and reviewed protein sequences), Pfam (Protein family), COG/KOG (Clusters of Orthologous Groups of proteins), KEGG (the Kyoto Encyclopedia of Genes and Genomes), and the GO (Gene Ontology) database.

4.5. Differentially Expressed Genes

The DESeq2 R package (v1.20.0, parameters set to default)was used to conduct pairwise comparisons. Read counts for each gene were normalized to reads per kilobase per million reads (RPKMs), which is currently the most widely used method for estimating gene expression levels and represents the gene expression levels [62]. There are strict algorithms for screening differentially expressed genes between two samples. Based on the RPKM values, the differential expression gene number across ten pairwise comparisons were calculated (Figure 3b,c), and multiple comparisons using false discovery rate (FDR) tests were conducted between two samples. A corrected FDR value of < 0.05 and |Fold change| > 2 was used as the criteria to judge the significant difference of gene expression.

4.6. GO and KEGG Enrichment Analysis of DEGs and Construction of Coexpression Network

We performed KEGG and GO enrichment analysis to explore the relevant pathway and biological functions that were activated during flower transition in Camellia oleifera. The background documents of GO and KEGG were from the GO and KEGG annotation. The GO and KEGG enrichment analysis of DEGs was performed using OmicShare tools, a free online platform for data analysis (http://www.omicshare.com/tools, 30 September 2024). A gene coexpression network was built using the WGCNA package. Parameters were set up as power = 12, minModuleSize = 50, and mergeCutHeight = 0.15. The networks were visualized using Cytoscape (Version 3.2.0).

4.7. Quantitative Real-Time PCR (qRT-PCR) Analysis

The total RNA was extracted from the same plant used for RNA sequencing. The cDNA was synthesized using a PrimeScriptTM RT reagent kit with gDNA Eraser (Perfect Real Time) (Takara Biomedical Technology, Beijing, China), following the manufacturer’s protocol. The cDNA reverse-transcription products were used as templates for qRT-PCR. qRT-PCR was performed using TB Green® Premix Ex Taq™ II (Tli RNaseH Plus) (TaKaRa), according to the manufacturer’s instructions. The calculation of the relative expression of the target gene in each sample was conducted using the 2−ΔΔCt method. The relative expression values of qRT-PCR and RPKM values of RNA-seq were compared. All primers for qRT-PCR are listed in Table S9.

5. Conclusions

This study presents a comprehensive comparison of morphological traits, endogenous GA concentrations, and transcriptomic profiles of buds at various developmental stages during floral transition in adult C. oleifera ‘changlin53’. Six types of GAs were detected, among which GA4 and GA3 appeared to play distinct roles: GA4 was associated with floral initiation and bud break, while GA3 was linked to petal differentiation. Reproductive shoot development is a crucial aspect of reproductive growth initiation in the annual cycle of C. oleifera, with floral initiation and reproductive shoot growth occurring simultaneously and at the same location. The photoperiod pathway involving CoCO-like, CoFT, and CoLFY was identified as a key regulator of floral initiation, activating the transition of the stem apical meristem into a floral meristem. Combined morphological and transcriptomic analyses indicate that floral initiation in C. oleifera is a multigenic and continuous regulatory process. Among these, the FT-LFY regulatory module plays a central role in orchestrating the transition from vegetative to floral development.

Supplementary Materials

The following supporting information can be downloaded at https://www.mdpi.com/article/10.3390/plants14152348/s1. Figure S1: Venn diagram showing the DEG number in flower development (GO:0009908), reproductive shoot system development (GO:0090567), and shoot system development (GO:0048367). Figure S2: Co-expression network analysis of DEGs in turquoise, brown, and green module. Figure S3: The qRT-PCR validation for transcriptome data. Figure S4: The BUSCO assessment results. Table S1: The detailed information of differentially expressed genes that are enriched in flower development (GO:0009908), reproductive shoot system development (GO:0090567), and shoot system development (GO:0048367). Table S2: The detailed information of differentially expressed genes related to circadian rhythm plants. Table S3: The detailed information of differentially expressed genes related to plant hormone signal transduction. Table S4: The DEG information of the top 7 KME in turquoise, brown, green, grey60, midnightblue, and magenta modules. Table S5: The detailed information on 75 DEGs in turquoise module. Table S6: The detailed information on 69 DEGs in brown module. Table S7: The detailed information of 10 DEGs in green module. Table S8: The detailed information of 10 DEGs in magenta module. Table S9: Primers for real-time PCR.

Author Contributions

Conceptualization, H.G. and C.C.; methodology, H.G. and Z.Z.; formal analysis, H.G., C.Y. and C.L.; investigation, H.G., Y.Y., L.C. (Linqing Cao), W.Z., W.P., J.W. (Jinfeng Wang), J.W. (Jia Wang), T.H., Y.H., Y.L., Y.J. and L.C. (Lixian Cao); resources, H.G.; data curation, H.G.; writing—original draft preparation, H.G., C.C. and J.Z.; writing—review and editing, H.G., C.C. and J.Z.; visualization, H.G.; project administration, H.G.; funding acquisition, H.G. and W.Z. All authors have read and agreed to the published version of the manuscript.

Funding

This research study was funded by the Jiangxi Provincial Natural Science Foundation, grant number 20232BAB215050, and the APC was funded by the Jiangxi Provincial Natural Science Foundation.

Data Availability Statement

Data are contained within the article and Supplementary Materials.

Acknowledgments

We thank Xu Xiuping from the Plant Science Facility of the Institute of Botany, Chinese Academy of Sciences, for their excellent technical assistance with scanning electron microscopy. We are grateful to Guangzhou Genedenovo Biotechnology Co., Ltd., for assisting in the sequencing analysis.

Conflicts of Interest

The authors declare no conflicts of interest.

References

  1. Chen, J.; Yang, X.; Huang, X.; Duan, S.; Long, C.; Chen, J.; Rong, J. Leaf transcriptome analysis of a subtropical evergreen broadleaf plant, wild oil-tea camellia (Camellia oleifera), revealing candidate genes for cold acclimation. BMC Genom. 2017, 18, 211. [Google Scholar] [CrossRef] [PubMed]
  2. Wu, L.; Li, J.; Li, Z.; Zhang, F.; Tan, X. Transcriptomic Analyses of Camellia oleifera ‘Huaxin’ Leaf Reveal Candidate Genes Related to Long-Term Cold Stress. Int. J. Mol. Sci. 2020, 21, 846. [Google Scholar] [CrossRef]
  3. Fang, H.; Bai, H. Cultural distribution and site classification for Camellia oleifera. Sci. Silvae Sin. 2002, 38, 64–72. [Google Scholar]
  4. Ma, J.; Ye, H.; Rui, Y.; Chen, G.; Zhang, N. Fatty acid composition of Camellia oleifera oil. J. Für Verbraucherschutz Und Leb. 2010, 6, 9–12. [Google Scholar] [CrossRef]
  5. Zhang, F.; Li, Z.; Zhou, J.; Gu, Y.; Tan, X. Comparative study on fruit development and oil synthesis in two cultivars of Camellia oleifera. BMC Plant Biol. 2021, 21, 348. [Google Scholar] [CrossRef] [PubMed]
  6. Ye, Y.; Yang, Q.; Fang, F.; Li, Y. The camelliagenin from defatted seeds of Camellia oleifera as antibiotic substitute to treat chicken against infection of Escherichia coli and Staphylococcus aureus. BMC Vet. Res. 2015, 11, 214. [Google Scholar] [CrossRef]
  7. Wilkie, J.D.; Sedgley, M.; Olesen, T. Regulation of floral initiation in horticultural trees. J. Exp. Bot. 2008, 59, 3215–3228. [Google Scholar] [CrossRef]
  8. Bolouri Moghaddam, M.R.; Van den Ende, W. Sugars, the clock and transition to flowering. Front. Plant. Sci. 2013, 4, 22. [Google Scholar]
  9. Bendix, C.; Marshall, C.M.; Harmon, F.G. Circadian Clock Genes Universally Control Key Agricultural Traits. Mol. Plant 2015, 8, 1135–1152. [Google Scholar] [CrossRef]
  10. Blackman, B.K. Changing Responses to Changing Seasons: Natural Variation in the Plasticity of Flowering Time. Plant Physiol. 2017, 173, 16–26. [Google Scholar] [CrossRef] [PubMed]
  11. Bouche, F.; Lobet, G.; Tocquin, P.; Perilleux, C. FLOR-ID: An interactive database of flowering-time gene networks in Arabidopsis thaliana. Nucleic Acids Res. 2016, 44, D1167–D1171. [Google Scholar] [CrossRef]
  12. Domagalska, M.A.; Sarnowska, E.; Nagy, F.; Davis, S.J. Genetic analyses of interactions among gibberellin, abscisic acid, and brassinosteroids in the control of flowering time in Arabidopsis thaliana. PLoS ONE 2010, 5, e14012. [Google Scholar] [CrossRef]
  13. Cho, L.H.; Yoon, J.; An, G. The control of flowering time by environmental factors. Plant J. 2017, 90, 708–719. [Google Scholar] [CrossRef] [PubMed]
  14. Conti, L. Hormonal control of the floral transition: Can one catch them all? Dev. Biol. 2017, 430, 288–301. [Google Scholar] [CrossRef] [PubMed]
  15. Kinoshita, A.; Richter, R. Genetic and molecular basis of floral induction in Arabidopsis thaliana. J. Exp. Bot. 2020, 71, 2490–2504. [Google Scholar] [CrossRef] [PubMed]
  16. Sasaki, E.; Frommlet, F.; Nordborg, M. The genetic architecture of the network underlying flowering time variation in Arabidopsis thaliana. bioRxiv 2017. [Google Scholar] [CrossRef]
  17. An, H.; Roussot, C.; Suarez-Lopez, P.; Corbesier, L.; Vincent, C.; Pineiro, M.; Hepworth, S.; Mouradov, A.; Justin, S.; Turnbull, C.; et al. CONSTANS acts in the phloem to regulate a systemic signal that induces photoperiodic flowering of Arabidopsis. Development 2004, 131, 3615–3626. [Google Scholar] [CrossRef]
  18. Golembeski, G.S.; Imaizumi, T. Photoperiodic Regulation of Florigen Function in Arabidopsis thaliana. Arab. Book 2015, 13, e0178. [Google Scholar] [CrossRef]
  19. Kinmonth-Schultz, H.; Lewandowska-Sabat, A.; Imaizumi, T.; Ward, J.K.; Rognli, O.A.; Fjellheim, S. Flowering Times of Wild Arabidopsis Accessions From Across Norway Correlate With Expression Levels of FT, CO, and FLC Genes. Front. Plant Sci. 2021, 12, 747740. [Google Scholar] [CrossRef]
  20. Andres, F.; Coupland, G. The genetic basis of flowering responses to seasonal cues. Nat. Rev. Genet. 2012, 13, 627–639. [Google Scholar] [CrossRef]
  21. Hsu, C.Y.; Adams, J.P.; Kim, H.; No, K.; Ma, C.; Strauss, S.H.; Drnevich, J.; Vandervelde, L.; Ellis, J.D.; Rice, B.M.; et al. FLOWERING LOCUS T duplication coordinates reproductive and vegetative growth in perennial poplar. Proc. Natl. Acad. Sci. USA 2011, 108, 10756–10761. [Google Scholar] [CrossRef] [PubMed]
  22. Yamaguchi, N.; Winter, C.M.; Wu, M.; Kanno, Y.; Yamaguchi, A.; Seo, M.; Wagner, D. Gibberellin Acts Positively Then Negatively to Control Onset of Flower Formation in Arabidopsis. Science 2014, 344, 638–641. [Google Scholar] [CrossRef]
  23. Goslin, K.; Zheng, B.; Serrano-Mislata, A.; Rae, L.; Ryan, P.T.; Kwasniewska, K.; Thomson, B.; O’Maoileidigh, D.S.; Madueno, F.; Wellmer, F.; et al. Transcription Factor Interplay between LEAFY and APETALA1/CAULIFLOWER during Floral Initiation. Plant Physiol. 2017, 174, 1097–1109. [Google Scholar] [CrossRef] [PubMed]
  24. Winter, C.M.; Yamaguchi, N.; Wu, M.F.; Wagner, D. Transcriptional programs regulated by both LEAFY and APETALA1 at the time of flower formation. Physiol Plant 2015, 155, 55–73. [Google Scholar] [CrossRef]
  25. Jue, D.; Sang, X.; Liu, L.; Shu, B.; Wang, Y.; Liu, C.; Wang, Y.; Xie, J.; Shi, S. Comprehensive analysis of the longan transcriptome reveals distinct regulatory programs during the floral transition. BMC Genom. 2019, 20, 126. [Google Scholar] [CrossRef]
  26. Das, A.; Geetha, G.A.; Ravishankar, K.V.; Shivashankara, K.S.; Roy, T.K.; Dinesh, M.R. Interrelations of growth regulators, carbohydrates and expression of flowering genes (FT, LFY, AP1) in leaf and shoot apex of regular and alternate bearing mango (Mangifera indica L.) cultivars during flowering. Sci. Hortic. 2019, 253, 263–269. [Google Scholar] [CrossRef]
  27. Song, G.-Q.; Liu, Z.; Zhong, G.-Y. Regulatory frameworks involved in the floral induction, formation and developmental programming of woody horticultural plants: A case study on blueberries. Front. Plant Sci. 2024, 15, 1336892. [Google Scholar] [CrossRef]
  28. Hong-yan, G.; Xin-jian, T.; Feng, T.; Qiu-ping, Z. The Relationship between Floral Initiation and Spring-shoot Growth in Camellia oleifera. For. Res. 2022, 35, 123–130. [Google Scholar]
  29. Colasanti, J.; Sundaresan, V. Control of the transition to flowering. Plant Biotechnol. 1996, 7, 145–169. [Google Scholar] [CrossRef]
  30. Xing, L.B.; Zhang, D.; Li, Y.M.; Shen, Y.W.; Zhao, C.P.; Ma, J.J.; An, N.; Han, M.Y. Transcription Profiles Reveal Sugar and Hormone Signaling Pathways Mediating Flower Induction in Apple (Malus domestica Borkh.). Plant Cell Physiol. 2015, 56, 2052–2068. [Google Scholar] [CrossRef]
  31. Jiang, Z.; Sun, L.; Wei, Q.; Ju, Y.; Zou, X.; Wan, X.; Liu, X.; Yin, Z. A New Insight into Flowering Regulation: Molecular Basis of Flowering Initiation in Magnolia × soulangeana ‘Changchun’. Genes 2019, 11, 15. [Google Scholar] [CrossRef]
  32. Agusti, M.; Reig, C.; Martinez-Fuentes, A.; Mesejo, C. Advances in Citrus Flowering: A Review. Front. Plant Sci. 2022, 13, 868831. [Google Scholar] [CrossRef]
  33. Munoz-Fambuena, N.; Nicolas-Almansa, M.; Martinez-Fuentes, A.; Reig, C.; Iglesias, D.J.; Primo-Millo, E.; Mesejo, C.; Agusti, M. Genetic inhibition of flowering differs between juvenile and adult Citrus trees. Ann. Bot. 2019, 123, 483–490. [Google Scholar] [CrossRef]
  34. Li, J.; Xu, Y.; Niu, Q.; He, L.; Teng, Y.; Bai, S. Abscisic Acid (ABA) Promotes the Induction and Maintenance of Pear (Pyrus pyrifolia White Pear Group) Flower Bud Endodormancy. Int. J. Mol. Sci. 2018, 19, 310. [Google Scholar] [CrossRef]
  35. Winterhagen, P.; Hegele, M.; Tiyayon, P.; Wünsche, J.N. Cytokinin accumulation and flowering gene expression are orchestrated for floral meristem development in longan (Dimocarpus longan Lour.) after chemical flower induction. Sci. Hortic. 2020, 270, 109467. [Google Scholar] [CrossRef]
  36. Liang, Q.; Song, K.; Lu, M.; Dai, T.; Yang, J.; Wan, J.; Li, L.; Chen, J.; Zhan, R.; Wang, S. Transcriptome and Metabolome Analyses Reveal the Involvement of Multiple Pathways in Flowering Intensity in Mango. Front. Plant Sci. 2022, 13, 933923. [Google Scholar] [CrossRef] [PubMed]
  37. Chavez-Hernandez, E.C.; Quiroz, S.; Garcia-Ponce, B.; Alvarez-Buylla, E.R. The flowering transition pathways converge into a complex gene regulatory network that underlies the phase changes of the shoot apical meristem in Arabidopsis thaliana. Front. Plant Sci. 2022, 13, 852047. [Google Scholar] [CrossRef]
  38. Jin, R.; Klasfeld, S.; Zhu, Y.; Fernandez Garcia, M.; Xiao, J.; Han, S.-K.; Konkol, A.; Wagner, D. LEAFY is a pioneer transcription factor and licenses cell reprogramming to floral fate. Nat. Commun. 2021, 12, 626. [Google Scholar] [CrossRef] [PubMed]
  39. Zhu, Y.; Klasfeld, S.; Jeong, C.W.; Jin, R.; Goto, K.; Yamaguchi, N.; Wagner, D. TERMINAL FLOWER 1-FD complex target genes and competition with FLOWERING LOCUS T. Nat. Commun. 2020, 11, 5118. [Google Scholar] [CrossRef]
  40. Lei, H.; Su, S.; Ma, L.; Wen, Y.; Wang, X. Molecular cloning and functional characterization of CoFT1, a homolog of FLOWERING LOCUS T (FT) from Camellia oleifera. Gene 2017, 626, 215–226. [Google Scholar] [CrossRef] [PubMed]
  41. Yan, J.; He, J.; Li, J.; Ren, S.; Wang, Y.; Zhou, J.; Tan, X. Analysis of Camellia oleifera transcriptome reveals key pathways and hub genes involved during different photoperiods. BMC Plant Biol. 2022, 22, 435. [Google Scholar] [CrossRef]
  42. Yan, J.; Liu, Q.; Guo, P.; Wang, Y.; Sheng, S.; Liu, X.; Zhang, R.; Li, J.; Tan, X. Time-Course Transcriptome Analysis Unveils the CoFKF1-CoMYB4-CoFT1 Regulatory Module in Flowering Control of Camellia oleifera Abel. Plant Cell Environ. 2025, 48, 6153–6169. [Google Scholar] [CrossRef]
  43. Wu, T.; Liu, Z.; Yu, T.; Zhou, R.; Yang, Q.; Cao, R.; Nie, F.; Ma, X.; Bai, Y.; Song, X. Flowering genes identification, network analysis, and database construction for 837 plants. Hortic. Res. 2024, 11, uhae013. [Google Scholar] [CrossRef]
  44. Davis, S.J. Integrating hormones into the floral-transition pathway of Arabidopsis thaliana. Plant Cell Environ. 2009, 32, 1201–1210. [Google Scholar] [CrossRef]
  45. Hauvermale, A.L.; Ariizumi, T.; Steber, C.M. Gibberellin signaling: A theme and variations on DELLA repression. Plant Physiol. 2012, 160, 83–92. [Google Scholar] [CrossRef]
  46. Shi, B.; Felipo-Benavent, A.; Cerutti, G.; Galvan-Ampudia, C.; Jilli, L.; Brunoud, G.; Mutterer, J.; Vallet, E.; Sakvarelidze-Achard, L.; Davière, J.-M.; et al. A quantitative gibberellin signaling biosensor reveals a role for gibberellins in internode specification at the shoot apical meristem. Nat. Commun. 2024, 15, 3895. [Google Scholar] [CrossRef]
  47. Nemoto, K.; Ramadan, A.; Arimura, G.-I.; Imai, K.; Tomii, K.; Shinozaki, K.; Sawasaki, T. Tyrosine phosphorylation of the GARU E3 ubiquitin ligase promotes gibberellin signalling by preventing GID1 degradation. Nat. Commun. 2017, 8, 1004. [Google Scholar] [CrossRef]
  48. de Lucas, M.; Davière, J.-M.; Rodríguez-Falcón, M.; Pontin, M.; Iglesias-Pedraz, J.M.; Lorrain, S.; Fankhauser, C.; Blázquez, M.A.; Titarenko, E.; Prat, S. A molecular framework for light and gibberellin control of cell elongation. Nature 2008, 451, 480–484. [Google Scholar] [CrossRef]
  49. Zhao, X.; Liu, W.; Aiwaili, P.; Zhang, H.; Xu, Y.; Gu, Z.; Gao, J.; Hong, B. PHOTOLYASE/BLUE LIGHT RECEPTOR2 regulates chrysanthemum flowering by compensating for gibberellin perception. Plant Physiol. 2023, 193, 2848–2864. [Google Scholar] [CrossRef]
  50. Girardi, F.; Canton, M.; Populin, F.; Tijero, V.; Bettio, G.; Munné-Bosch, S.; Rasori, A.; Cardillo, V.; Costa, G.; Botton, A. A gibberellin-assisted study of the transcriptional and hormonal changes occurring at floral transition in peach buds (Prunus persica L. Batsch). BMC Plant Biol. 2024, 24, 643. [Google Scholar] [CrossRef]
  51. Yuxi, Z.; Yanchao, Y.; Zejun, L.; Tao, Z.; Feng, L.; Chunying, L.; Shupeng, G. GA3 is superior to GA4 in promoting bud endodormancy release in tree peony (Paeonia suffruticosa) and their potential working mechanism. BMC Plant Biol. 2021, 21, 323. [Google Scholar] [CrossRef]
  52. Zhuang, W.; Gao, Z.; Wen, L.; Huo, X.; Cai, B.; Zhang, Z. Metabolic changes upon flower bud break in Japanese apricot are enhanced by exogenous GA4. Hortic. Res. 2015, 2, 15046. [Google Scholar] [CrossRef]
  53. Nakagawa, M.; Honsho, C.; Kanzaki, S.; Shimizu, K.; Utsunomiya, N. Isolation and expression analysis of FLOWERING LOCUS T-like and gibberellin metabolism genes in biennial-bearing mango trees. Sci. Hortic. 2012, 139, 108–117. [Google Scholar] [CrossRef]
  54. Susawaengsup, C.; Rayanakorn, M.; Wongpornchai, S.; Wangkarn, S. Investigation of plant hormone level changes in shoot tips of longan (Dimocarpus longan Lour.) treated with potassium chlorate by liquid chromatography-electrospray ionization mass spectrometry. Talanta 2011, 85, 897–905. [Google Scholar] [CrossRef]
  55. Bao, S.; Hua, C.; Shen, L.; Yu, H. New insights into gibberellin signaling in regulating flowering in Arabidopsis. J. Integr. Plant Biol. 2020, 62, 118–131. [Google Scholar] [CrossRef]
  56. Teotia, S.; Tang, G. To Bloom or Not to Bloom: Role of MicroRNAs in Plant Flowering. Mol. Plant 2015, 8, 359–377. [Google Scholar] [CrossRef]
  57. Li, C.; Zheng, L.; Wang, X.; Hu, Z.; Zheng, Y.; Chen, Q.; Hao, X.; Xiao, X.; Wang, X.; Wang, G.; et al. Comprehensive expression analysis of Arabidopsis GA2-oxidase genes and their functional insights. Plant Sci. 2019, 285, 1–13. [Google Scholar] [CrossRef]
  58. Wu, W.; Zhu, L.; Wang, P.; Liao, Y.; Duan, L.; Lin, K.; Chen, X.; Li, L.; Xu, J.; Hu, H.; et al. Transcriptome-Based Construction of the Gibberellin Metabolism and Signaling Pathways in Eucalyptus grandis × E. urophylla, and Functional Characterization of GA20ox and GA2ox in Regulating Plant Development and Abiotic Stress Adaptations. Int. J. Mol. Sci. 2023, 24, 7051. [Google Scholar] [CrossRef]
  59. Guo, H.; Zhong, Q.; Tian, F.; Zhou, X.; Tan, X.; Luo, Z. Transcriptome Analysis Reveals Putative Induction of Floral Initiation by Old Leaves in Tea-Oil Tree (Camellia oleifera ‘changlin53’). Int. J. Mol. Sci. 2022, 23, 13021. [Google Scholar] [CrossRef]
  60. Grabherr, M.G.; Haas, B.J.; Yassour, M.; Levin, J.Z.; Thompson, D.A.; Amit, I.; Adiconis, X.; Fan, L.; Raychowdhury, R.; Zeng, Q.; et al. Full-length transcriptome assembly from RNA-Seq data without a reference genome. Nat. Biotechnol. 2011, 29, 644–652. [Google Scholar] [CrossRef]
  61. Simão, F.A.; Waterhouse, R.M.; Ioannidis, P.; Kriventseva, E.V.; Zdobnov, E.M. BUSCO: Assessing genome assembly and annotation completeness with single-copy orthologs. Bioinformatics 2015, 19, 3210–3212. [Google Scholar] [CrossRef] [PubMed]
  62. Mortazavi, A.; Williams, B.A.; McCue, K.; Schaeffer, L.; Wold, B. Mapping and quantifying mammalian transcriptomes by RNA-Seq. Nat. Methods 2008, 5, 621–628. [Google Scholar] [CrossRef] [PubMed]
Figure 1. Developmental stages of buds in C. oleifera. Buds (a,b) are referred to the vegetative bud formed in the last year. Buds in stages I are distinguished as follows: (a) developed into sprouted buds (b); only vegetative buds grown (f,g); no flower buds occurred in stages I and II. Buds (ce) in stages III, IV, and V were the apical buds of spring shoots (panel ce), which were developed from a vegetative bud (b). Flower buds (hj) in III, IV, and V were located at the base of apical buds (ce). lp: Leaf primordium; fp: floral primordium; l: leaf, s: sepal; p: petal. The scale bars in a to b, in c to e, and in f to j indicate 1.5 cm, 1000 μm, and 50 μm, respectively.
Plants 14 02348 g001
Figure 2. Concentrations of endogenous gibberellin types (a) and their relative proportions (b) at different developmental stages. The letters on the top of column indicate the multiple comparison results of total GAs concentration at 0.05 level.
Plants 14 02348 g002
Figure 3. Principal component analysis of the RNA-seq data in all samples (a). Numbers of DEGs in diverse pairwise comparisons (b) and Venn diagram showing the common and unique DEGs among different pairwise comparisons (c).
Plants 14 02348 g003
Figure 4. GO functional of the significantly differentially expressed genes (DEGs) in diverse pairwise comparisons (a). Top 20 significance-level GO terms of DEGs (b). Top 21 significance-level GO terms of BP (c). The red arrow indicates the GO term related to floral initiation.
Plants 14 02348 g004
Figure 5. KEGG pathway enrichment analysis of the significantly DEGs of buds in diverse pairwise comparisons (a). Top 20 significance-level KEGG pathways of DEGs in buds (b).
Plants 14 02348 g005
Figure 6. Hierarchical cluster tree showing co-expression modules identified by WGCNA (a) and the DEG number of each module (b).
Plants 14 02348 g006
Figure 7. Relationship between modules and developmental stages (a). Each row represents a module, and each column represents a developmental stage. The intersection cells display correlation coefficients and p-values between the modules and stages. Red cells indicate strong positive correlations between a specific module and a developmental stage, whereas blue cells indicate strong negative correlations. Modules with significant positive or negative correlations are underlined in red or blue, respectively. Magenta underlines denote modules with distinct correlation patterns. Co-expression network analysis of DEGs in the magenta module (b). Expression heatmap of candidate hub genes related to floral initiation in the magenta module (c).
Plants 14 02348 g007
Figure 8. Comprehensive analysis of DEGs and endogenous GA monomer concentrations in GA biosynthesis and GA signal transduction pathways. The box plot shows the concentration of different gibberellin monomers at different developmental stages in the GA biosynthesis pathway. The heatmap demonstrated the expression levels of DEGs in the GA synthesis pathway and the signal transduction pathway during different developmental stages.
Plants 14 02348 g008
Table 1. Overview of the samples for RNA-seq.
Developmental StagesSample NameNumber of Clean ReadsNumber of Clean DataQ20 (%)Q30 (%)GC (%)Total Mapped (%)
IBI-156,907,3488,497,755,6338,338,100,557 (98.12%)8,015,960,394 (94.33%)3,900,291,117 (45.90%)44,985,690 (79.05%)
BI-248,431,0607,215,452,9437,085,854,082 (98.20%)6,822,179,906 (94.55%)3,339,480,736 (46.28%)38,526,147 (79.55%)
BI-358,652,1908,740,998,4108,563,905,357 (97.97%)8,212,926,590 (93.96%)4,031,458,880 (46.12%)45,998,276 (78.43%)
IIBII-154,553,1608,112,660,0917,889,813,970 (97.25%)7,477,825,967 (92.17%)3,768,480,169 (46.45%)44,160,960 (80.95%)
BII-244,576,4226,624,937,0746,457,818,501 (97.48%)6,135,698,351 (92.62%)3,151,122,729 (47.56%)37,181,979 (83.41%)
BII-346,778,8866,962,446,5226,759,631,130 (97.09%)6,392,012,670 (91.81%)3,234,932,717 (46.46%)37,839,837 (80.89%)
IIIBIII-150,985,6607,586,849,1107,365,728,863 (97.09%)6,964,564,010 (91.80%)3,511,913,268 (46.29%)41,408,399 (81.22%)
BIII-250,562,4547,545,683,2707,317,183,863 (96.97%)6,915,262,966 (91.65%)3,461,771,628 (45.88%)40,696,612 (80.49%)
BIII-346,393,6006,891,860,9866,708,819,561 (97.34%)6367327747 (92.39%)3,208,481,881 (46.55%)38,154,413 (82.24%)
IVBIV-141,886,0366,228,273,0026,066,396,478 (97.40%)5,763,909,687 (92.54%)28,57,941,556 (45.89%)33,925,334 (80.99%)
BIV-251,563,1927,699,619,6037485225086 (97.22%)7,085,303,270 (92.02%)3,537,890,895 (45.95%)42,049,101 (81.55%)
BIV-352,264,3007,811,770,7837614802319 (97.48%)7,238,347,545 (92.66%)3,592,384,741 (45.99%)42,578,151 (81.47%)
VBV-149,788,9967,439,686,4997,227,532,557 (97.15%)6,835,950,341 (91.88%)3,417,730,361 (45.94%)40,375,415 (81.09%)
BV-248,638,6367,269,786,5027,078,040,967 (97.36%)6,716,162,908 (92.38%)3,349,964,297 (46.08%)39,285,275 (80.77%)
BV-357,903,4068,647,231,0848,394,242,589 (97.07%)7,932,070,431 (91.73%)3,978,878,410 (46.01%)46,499,461 (80.31%)
Disclaimer/Publisher’s Note: The statements, opinions and data contained in all publications are solely those of the individual author(s) and contributor(s) and not of MDPI and/or the editor(s). MDPI and/or the editor(s) disclaim responsibility for any injury to people or property resulting from any ideas, methods, instructions or products referred to in the content.

