

Optimization of Seed Oil Extraction from Asphodelus tenuifolius Cav. Using Response Surface Methodology

 ,
,  ,
,  ,
,  ,
, 
Abstract
1. Introduction
2. Materials and Methods
2.1. Materials
2.2. Extraction Procedure
2.3. Experimental Design
2.4. Characterization of Extracted Oils
3. Results
3.1. Extraction Process Modeling and Optimization
3.2. Characterization of the Extracted Oil
4. Conclusions
Author Contributions
Funding
Data Availability Statement
Conflicts of Interest
References
- Gul, H.; Jamshed, A.; Jabeen, Q. Pharmacological Investigation of Asphodelus tenuifolius Cav. for Its Potential Against Thrombosis in Experimental Models. Dose-Response 2022, 20, 15593258221127566. [Google Scholar] [CrossRef] [PubMed]
- Yang, Z.H.; Nill, K.; Takechi-Haraya, Y.; Playford, M.P.; Nguyen, D.; Yu, Z.X.; Remaley, A.T. Differential Effect of Dietary Supplementation with a Soybean Oil Enriched in Oleic Acid versus Linoleic Acid on Plasma Lipids and Atherosclerosis in LDLR-Deficient Mice. Int. J. Mol. Sci. 2022, 23, 8385. [Google Scholar] [CrossRef] [PubMed]
- Eddaoudi, F.E.; El Moudden, H.; El Guezzane, C.; Saber, M.; Harhar, H.; Tabyaoui, M. Effect of Extraction Process on Quality of Oil from Asphodelus tenuifolius Seeds. OCL 2023, 30, 20. [Google Scholar] [CrossRef]
- Sodeifian, G.; Ghorbandoost, S.; Sajadian, S.A.; Saadati Ardestani, N. Extraction of Oil from Pistacia khinjuk Using Supercritical Carbon Dioxide: Experimental and Modeling. J. Supercrit. Fluids 2016, 110, 265–274. [Google Scholar] [CrossRef]
- AOCS. Official Methods and Practices of the AOCS, 5th ed.; AOCS Press: Champaign, IL, USA, 1998. [Google Scholar]
- Le Man, H.; Behera, S.K.; Park, H.S. Optimization of operational parmeters for etanol production from Korean food waste leachate. Int. J. Environ. Sci. Technol. 2010, 7, 157–164. [Google Scholar] [CrossRef]
- Montgomery, D.C. Design and Analysis of Experiments, 9th ed.; Wiley: Hoboken, NJ, USA, 2017. [Google Scholar]
- Myers, R.H.; Montgomery, D.C.; Anderson-Cook, C.M. Response Surface Methodology: Process and Product Optimization Using Designed Experiments, 4th ed.; Wiley: Hoboken, NJ, USA, 2016. [Google Scholar]
- Khuri, A.I.; Cornell, J.A. Response Surfaces: Designs and Analyses, 2nd ed.; CRC Press: Boca Raton, FL, USA, 2018. [Google Scholar]
- Dean, A.; Voss, D.; Draguljić, D. Design and Analysis of Experiments; Springer: New York, NY, USA, 2017. [Google Scholar]
- Jisieike, C.F.; Betiku, E. Rubber Seed Oil Extraction: Effects of Solvent Polarity, Extraction Time and Solid-Solvent Ratio on Its Yield and Quality. Biocatal. Agric. Biotechnol. 2020, 24, 101522. [Google Scholar] [CrossRef]
- Barizão, É.O.; Boeing, J.S.; Martins, A.C.; Visentainer, J.V.; Almeida, V.C. Application of Response Surface Methodology for the Optimization of Ultrasound-Assisted Extraction of Pomegranate (Punica granatum L.) Seed Oil. Food Anal. Methods 2015, 8, 2392–2400. [Google Scholar] [CrossRef]
- Derringer, G.; Suich, R. Simultaneous Optimization of Several Response Variables. J. Qual. Technol. 1980, 12, 214–219. [Google Scholar] [CrossRef]
- Okeleye, A.A.; Betiku, E. Kariya (Hildegardia barteri) Seed Oil Extraction: Comparative Evaluation of Solvents, Modeling, and Optimization Techniques. Chem. Eng. Commun. 2019, 206, 1181–1198. [Google Scholar] [CrossRef]
- Indarti, K.; Apriani, E.F.; Wibowo, A.E.; Simanjuntak, P. Antioxidant Activity of Ethanolic Extract and Various Fractions from Green Tea (Camellia sinensis L.) Leaves. Pharmacogn. J. 2019, 11, 1010–1015. [Google Scholar] [CrossRef]
- Malmir, M.; Serrano, R.; Caniça, M.; Silva-Lima, B.; Silva, O. A Comprehensive Review on the Medicinal Plants from the Genus Asphodelus. Plants 2018, 7, 20. [Google Scholar] [CrossRef] [PubMed]
- Bassam, N.E. Energy Plant Species: Their Use and Impact on Environment and Development; Routledge: London, UK, 2013. [Google Scholar]
- Hagos, M.; Yaya, E.E.; Chandravanshi, B.S.; Redi-Abshiro, M. Determination of Fatty Acids Composition by Gc-Ms and Physicochemical Parameters of Pumpkin (Cucurbita maxima) Seed Oil Cultivated in Ethiopia. Bull. Chem. Soc. Ethiop. 2023, 37, 565–577. [Google Scholar] [CrossRef]
- Zhao, S.; Kwok, K.C.; Liang, H. Investigation on ultrasound assisted extraction of saikosaponins from Radix bupleuri. Sep. Purif. Technol. 2007, 55, 307–312. [Google Scholar] [CrossRef] [PubMed]
- Oladipo, B.; Betiku, E. Process Optimization of Solvent Extraction of Seed Oil from Moringa oleifera: An Appraisal of Quantitative and Qualitative Process Variables on Oil Quality Using D-Optimal Design. Biocatal. Agric. Biotechnol. 2019, 20, 101187. [Google Scholar] [CrossRef]
- Silverstein, R.M.; Webster, F.X.; Kiemle, D.J. Spectrometric Identification of Organic Compounds, 7th ed.; Wiley: Hoboken, NJ, USA, 2005. [Google Scholar]
- Oleszko, A.; Hartwich, J.; Wójtowicz, A.; Gąsior-Głogowska, M.; Huras, H.; Komorowska, M. Comparison of FTIR-ATR and Raman Spectroscopy in Determination of VLDL Triglycerides in Blood Serum with PLS Regression. Spectrochim. Acta A Mol. Biomol. Spectrosc. 2017, 183, 239–246. [Google Scholar] [CrossRef] [PubMed]
- Das, A.; Rokhum, S.L. Renewable Diesel and Biodiesel: A Comparative Analysis. In Renewable Diesel; Elsevier: Amsterdam, The Netherlands, 2024; pp. 123–166. [Google Scholar]
- Demirbas, A.; Bafail, A.; Ahmad, W.; Sheikh, M. Biodiesel Production from Non-Edible Plant Oils. Energy Explor. Exploit. 2016, 34, 290–318. [Google Scholar] [CrossRef]
- Moser, B.R. Biodiesel Production, Properties, and Feedstocks. Vitr. Cell. Dev. Biol.–Plant 2009, 45, 229–266. [Google Scholar] [CrossRef]


| Independent Variables | Symbol | Coded Level | |||
|---|---|---|---|---|---|
| Coded | Uncoded | −1 | 0 | +1 | |
| Ratio (g/mL) | X1 | R | 0.2 | 0.4 | 0.6 |
| Time (min) | X2 | T | 20 | 40 | 60 |
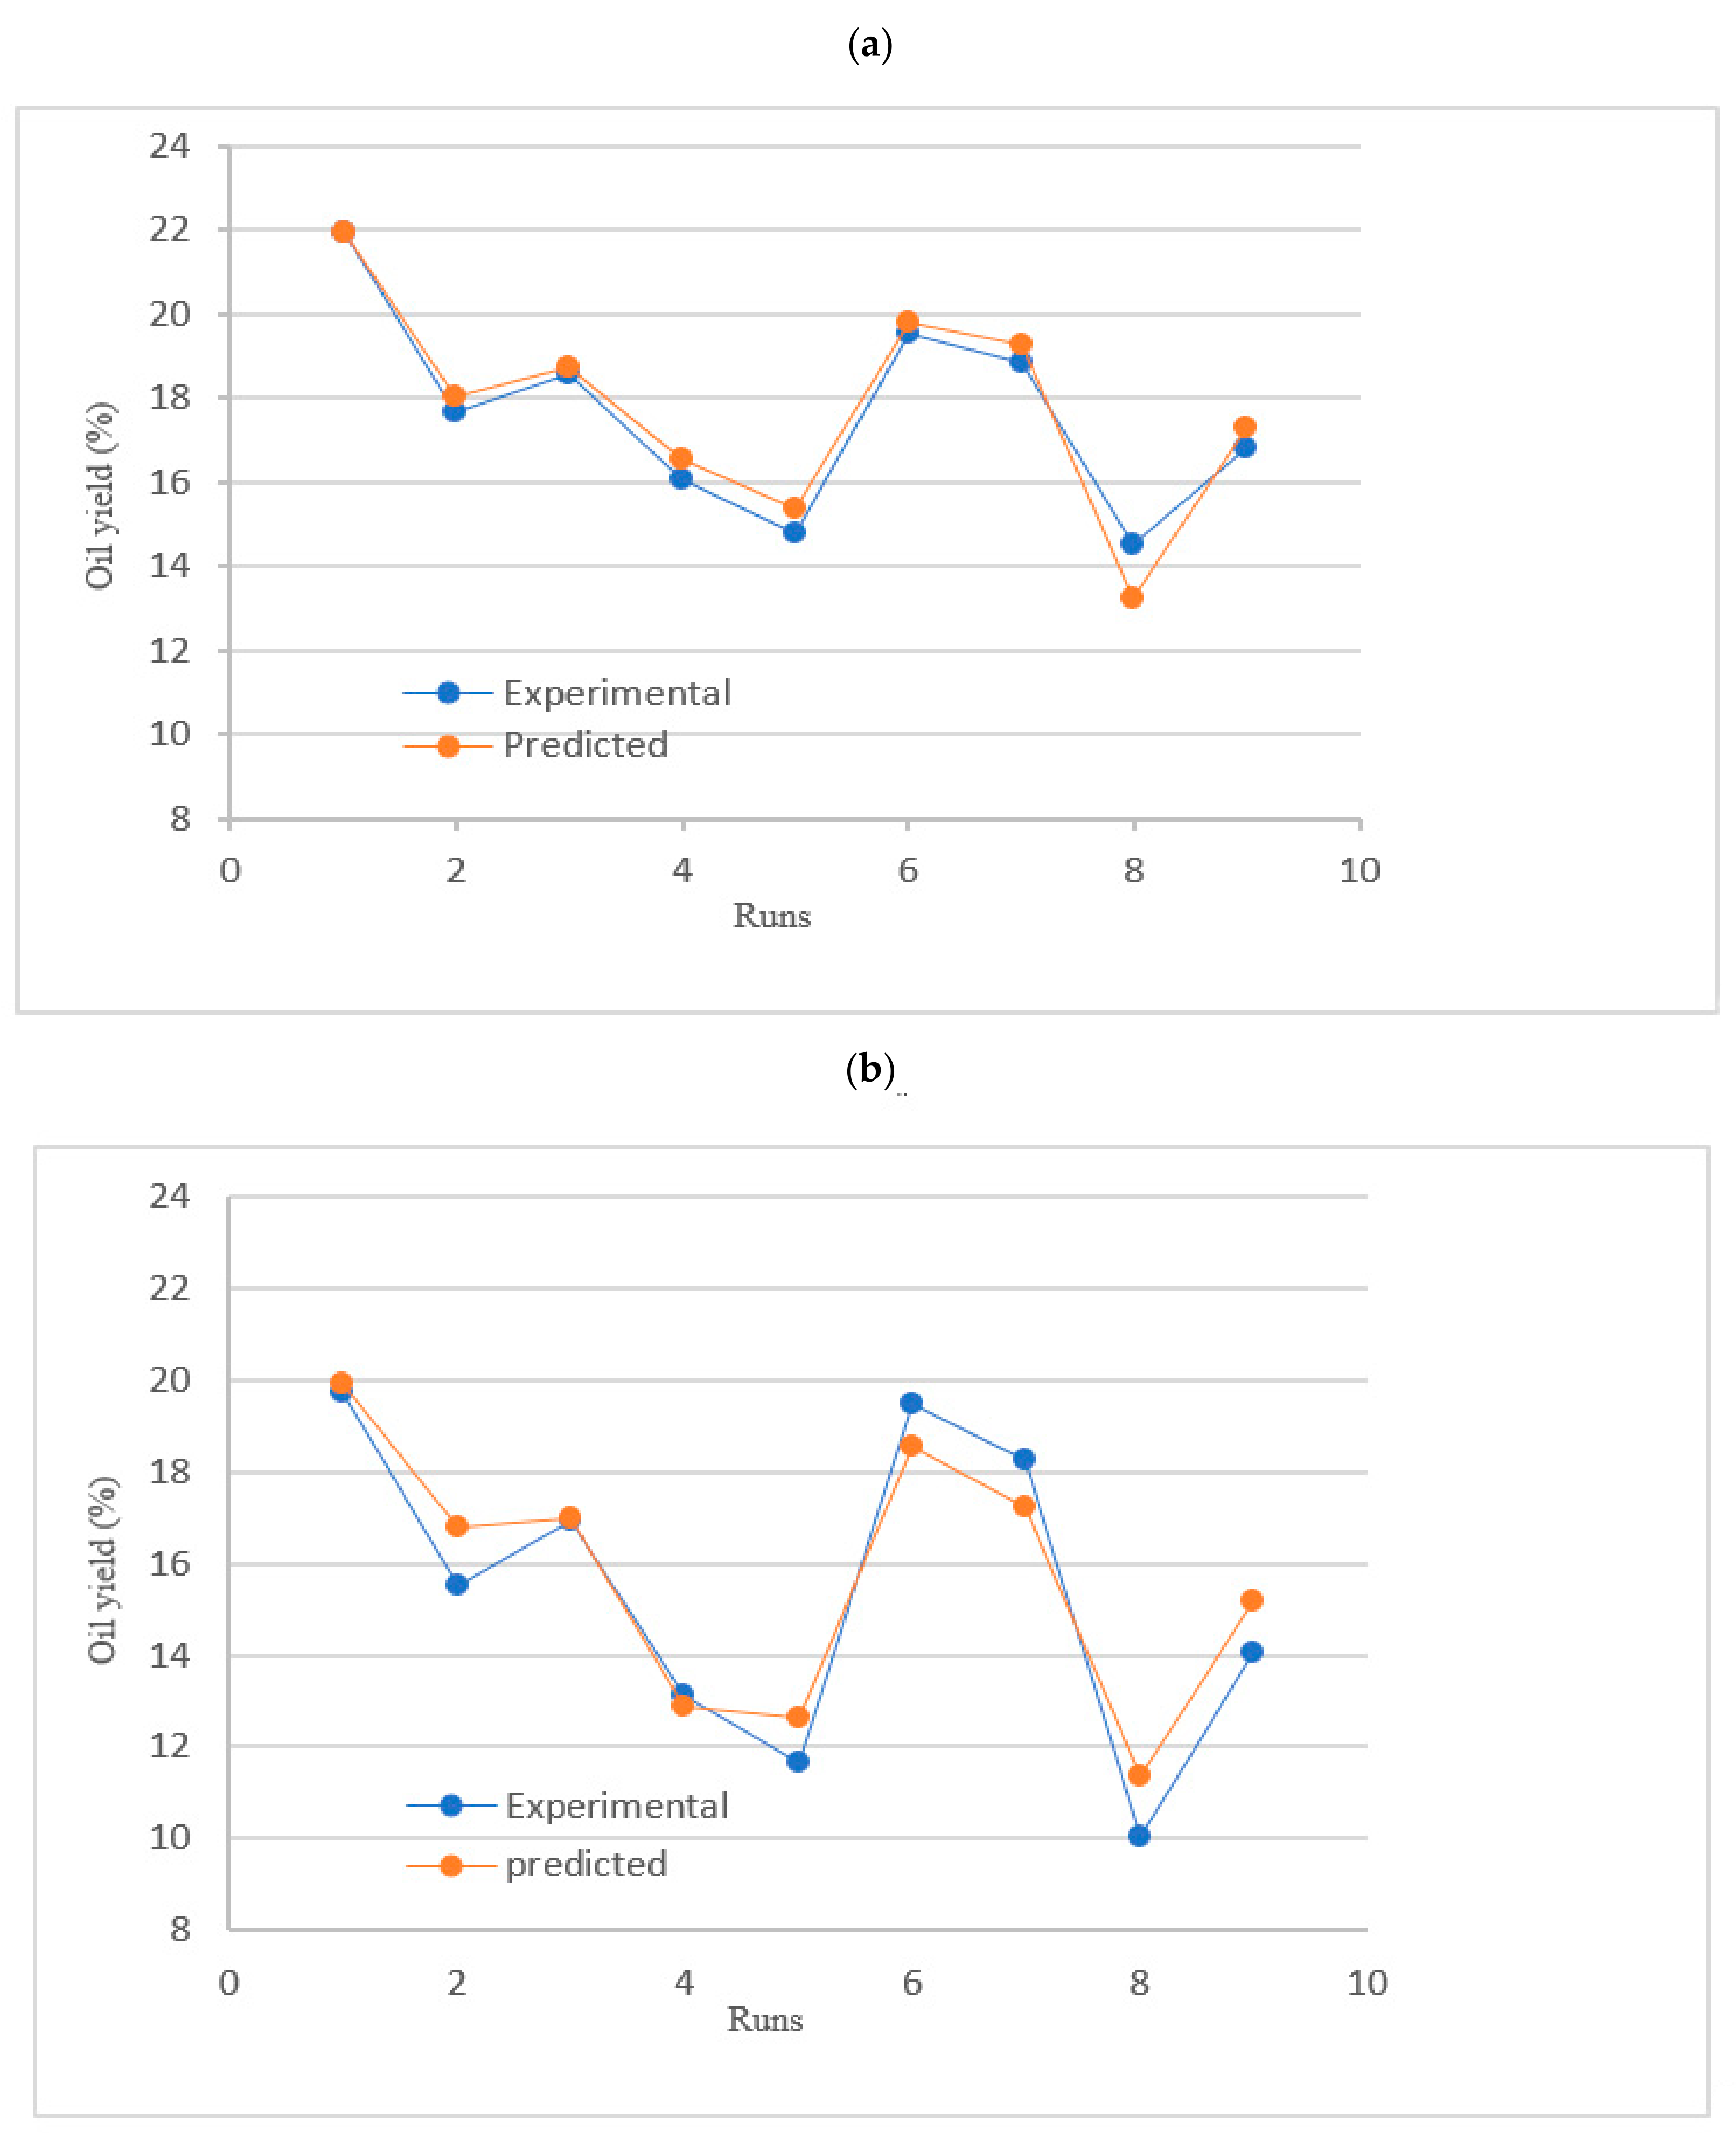
| No. of Run | Solid/Solvent Ratio (mg/mL) | Extraction Time (min) | Coded X1 | Level X2 | % Oil Yield for Hexane | Predicted % Oil Yield | % Oil Yield for Ethyl Acetate | Predicted % Oil Yield |
|---|---|---|---|---|---|---|---|---|
| 1 | 0.2 | 60 | −1 | +1 | 21.96 | 21.91 | 19.70 | 19.93 |
| 2 | 0.4 | 40 | 0 | 0 | 17.65 | 18.03 | 15.52 | 16.77 |
| 3 | 0.4 | 60 | 0 | +1 | 18.59 | 18.75 | 16.91 | 16.99 |
| 4 | 0.6 | 60 | +1 | +1 | 16.05 | 16.55 | 13.11 | 12.86 |
| 5 | 0.6 | 40 | +1 | 0 | 14.78 | 15.36 | 11.65 | 12.64 |
| 6 | 0.2 | 40 | −1 | 0 | 19.53 | 19.79 | 19.47 | 18.53 |
| 7 | 0.2 | 20 | −1 | −1 | 18.86 | 19.25 | 18.24 | 17.23 |
| 8 | 0.6 | 20 | +1 | −1 | 14.51 | 13.25 | 10.05 | 11.34 |
| 9 | 0.4 | 20 | 0 | −1 | 16.81 | 17.27 | 14.04 | 15.18 |
| (a) | |||||
| Source | Sum of Square | df | Mean Square | F-Value | p-Value |
| Model | 69.87 | 5 | 13.9751 | 9.0922 | 0.0263 * |
| R | 41.87 | 1 | 41.870417 | 27.2410 | 0.0064 * |
| T | 24.20 | 1 | 24.200417 | 15.7449 | 0.0166 * |
| RT | 1.102 | 1 | 1.102500 | 0.7173 | 0.4447 |
| RR | 1.27 | 1 | 1.272805 | 0.8281 | 0.4143 |
| TT | 0.98 | 1 | 0.981505 | 0.6386 | 0.4690 |
| Residual | 6.15 | 4 | 14.16 | ||
| Pure Error | 0.00005 | 1 | 0.00005 | ||
| Total Error | 6.15 | 4 | |||
| r2 | 0.919128 | ||||
| r adj2 | 0.818039 | ||||
| (b) | |||||
| Source | Sum of Square | df | Mean Square | F-Value | p-Value |
| Model | 94.904065 | 5 | 18.9808 | 354.6237 | <0.0001 * |
| R | 85.126667 | 1 | 85.126667 | 1590.445 | <0.0001 * |
| T | 9.028267 | 1 | 9.028267 | 168.6776 | 0.0002 * |
| RT | 0.640000 | 1 | 0.640000 | 11.9573 | 0.0259 * |
| RR | 0.024005 | 1 | 0.024005 | 0.4485 | 0.5297 |
| TT | 0.068571 | 1 | 0.068571 | 1.2811 | 0.3209 |
| Residual | 0.214095 | 4 | 0.0535 | ||
| Pure Error | 0.00020000 | 1 | 0.000200 | ||
| Total Error | 0.21409524 | 4 | |||
| r2 | 0.997749 | ||||
| r adj2 | 0.994936 | ||||
| Parameters | ||
|---|---|---|
| Solvent | Hexane | Ethyl Acetate |
| Yield (%) | 21.95 ± 0.05 a | 19.91 ± 0.01 b |
| Physical state at 25 °C | Golden yellow | Dark brown |
| Acid value (mg KOH/g oil) | 1.95 ± 0.00 a | 4.88 ± 0.00 b |
| Saponification index (mg KOH/oil) | 200.62 ± 0.02 a | 222.43 ± 0.00 b |
| Iodine index (g I2/100 g oil) | 168.87 ± 0.00 a | 176.96 ± 0.00 b |
| Fatty Acids | This Study | Malmir et al. (2018) [16] | Bassam (2013) [17] | |
|---|---|---|---|---|
| Hexane | Ethyl Acetate | NR | NR | |
| Saturated | ||||
| Myristic (C14:0) | 0.05 ± 0.00 a | 0.04 ± 0.00 a | 3.96 | - |
| Palmitic (C16:0) | 6.86 ± 0.01 a | 6.41 ± 0.00 b | 13.84 | 7.60 |
| Heptadecanoic (C17:0) | 0.06 ± 0.00 a | 0.09 ± 0.00 b | - | - |
| Stearic (C18:0) | 2.20 ± 0.10 a | 2.33 ± 0.01 a | - | 16.0 |
| Arachidic (C20:0) | 0.10 ± 0.00 a | 0.08 ± 0.00 b | - | - |
| Monounsaturated | ||||
| Palmitoleic (C16:1) | 0.08 ± 0.00 a | 0.07 ± 0.00 b | - | - |
| Heptadecenoic (C17:1) | 0.02 ± 0.00 a | 0.01 ± 0.00 a | - | - |
| Oleic (C18:1) | 11.66 ± 0.00 a | 11.79 ± 0.01 b | 15.60 | 12.80 |
| Gadoleic (C20:1) | 0.20 ± 0.00 a | 0.18 ± 0.00 b | - | - |
| Polyunsaturated | ||||
| Linoleic (C18:2) | 78.50 ± 0.00 a | 78.91 ± 0.00 b | 62.62 | 78 |
| Linolenic (C18:3) | 0.07 ± 0.00 a | 0.06 ± 0.00 a | 2.60 | - |
| SFA | 9.27 ± 0.12 a | 8.96 ± 0.00 a | 17.80 | 23.60 |
| MUFA | 11.97 ± 0.00 a | 12.06 ± 0.00 a | 15.60 | 12.80 |
| PUFA | 78.57 ± 0.01 a | 78.97 ± 0.01 b | 65.22 | 78 |
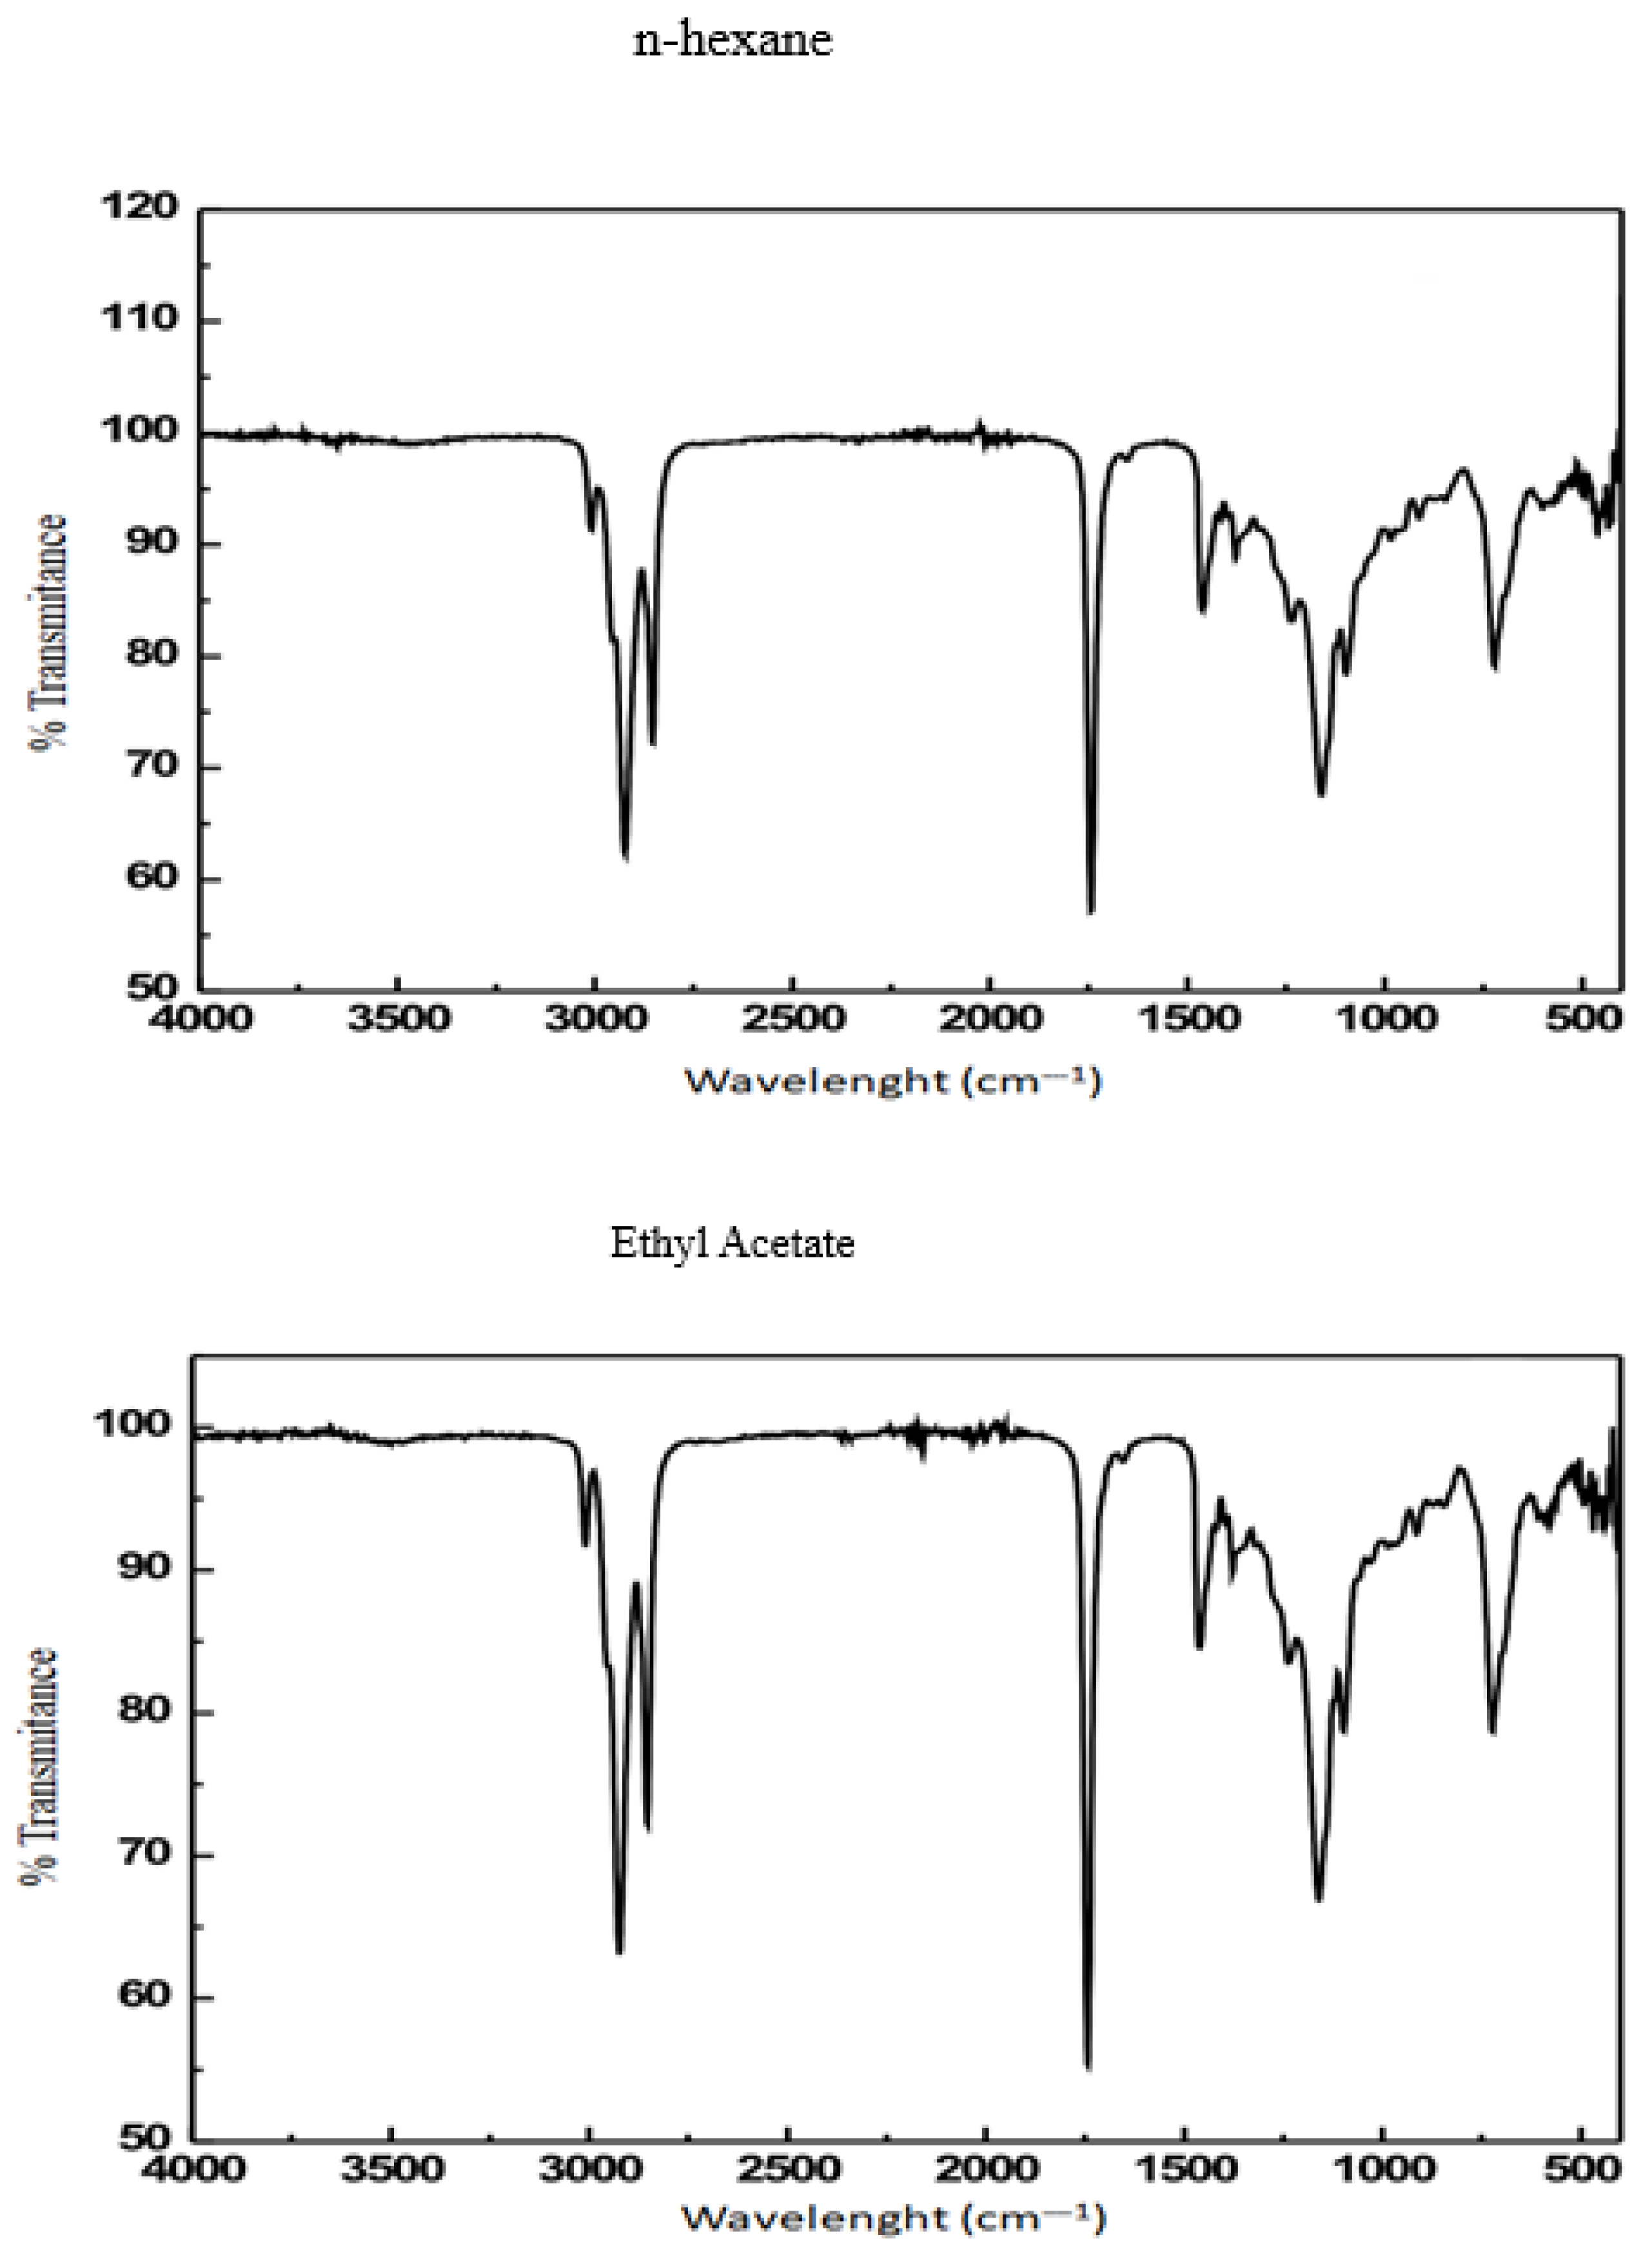
| Wavenumber (cm−1) | Functional Group | Vibration | Intensity |
|---|---|---|---|
| 2919–2854 | C–H | Stretching of methyl group | Strong |
| 1743 | –C=O | Stretching of esters | Strong and sharp |
| 1464 | –C-H | Bending vibration of CH2 | Variable |
| 1162 | C–O | Stretching of carboxylic acids, esters | Variable |
| 725 | =C–H | CH out-of-plane deformation | Strong |
Disclaimer/Publisher’s Note: The statements, opinions and data contained in all publications are solely those of the individual author(s) and contributor(s) and not of MDPI and/or the editor(s). MDPI and/or the editor(s) disclaim responsibility for any injury to people or property resulting from any ideas, methods, instructions or products referred to in the content. |
© 2025 by the authors. Licensee MDPI, Basel, Switzerland. This article is an open access article distributed under the terms and conditions of the Creative Commons Attribution (CC BY) license (https://creativecommons.org/licenses/by/4.0/).
Share and Cite
Eddaoudi, F.E.; Guezzane, C.E.; El Moudden, H.; Badi, A.; El Idrissi, Y.; Harhar, H.; Santanatoglia, A.; Maggi, F.; Caprioli, G.; Bouyahya, A.; et al. Optimization of Seed Oil Extraction from Asphodelus tenuifolius Cav. Using Response Surface Methodology. Plants 2025, 14, 2298. https://doi.org/10.3390/plants14152298
Eddaoudi FE, Guezzane CE, El Moudden H, Badi A, El Idrissi Y, Harhar H, Santanatoglia A, Maggi F, Caprioli G, Bouyahya A, et al. Optimization of Seed Oil Extraction from Asphodelus tenuifolius Cav. Using Response Surface Methodology. Plants. 2025; 14(15):2298. https://doi.org/10.3390/plants14152298
Chicago/Turabian StyleEddaoudi, Fatima Ezzahra, Chakir El Guezzane, Hamza El Moudden, Ayoub Badi, Yousra El Idrissi, Hicham Harhar, Agnese Santanatoglia, Filippo Maggi, Giovanni Caprioli, Abdelhakim Bouyahya, and et al. 2025. "Optimization of Seed Oil Extraction from Asphodelus tenuifolius Cav. Using Response Surface Methodology" Plants 14, no. 15: 2298. https://doi.org/10.3390/plants14152298
APA StyleEddaoudi, F. E., Guezzane, C. E., El Moudden, H., Badi, A., El Idrissi, Y., Harhar, H., Santanatoglia, A., Maggi, F., Caprioli, G., Bouyahya, A., & Tabyaoui, M. (2025). Optimization of Seed Oil Extraction from Asphodelus tenuifolius Cav. Using Response Surface Methodology. Plants, 14(15), 2298. https://doi.org/10.3390/plants14152298