Article

Genome-Wide Identification, Evolution and Expression Analysis of GRAS Transcription Factor Gene Family Under Viral Stress in Nicotiana benthamiana

1
Zhejiang Green Pesticide 2011 Collaborative Innovation Center, Zhejiang Agriculture and Forestry University, Hangzhou 311300, China
2
Key Laboratory of Pest Management of Horticultural Crop of Hunan Province, Hunan Academy of Agricultural Science, Changsha 410125, China
*
Authors to whom correspondence should be addressed.
Plants 2025, 14(15), 2295; https://doi.org/10.3390/plants14152295
Submission received: 27 June 2025 / Revised: 17 July 2025 / Accepted: 23 July 2025 / Published: 25 July 2025
(This article belongs to the Section Plant Protection and Biotic Interactions)

Abstract

The GRAS gene family not only performs a variety of regulatory functions in plant growth and development but also plays a key role in the defense mechanisms of plants in response to environmental stresses. Although GRASs have been identified in many species, research on them in Nicotiana benthamiana remains relatively limited until now. In this study, we comprehensively analyzed the GRAS gene family in N. benthamiana plants. Phylogenetic analysis displayed that all identified NbGRASs were classified into eight different subfamilies. Gene duplication analysis revealed that segmental duplication was the main driving force for the expansion of the NbGRAS gene family, with a total of 40 segmental duplication pairs identified. NbGRASs were unevenly distributed across the 19 chromosomes. Additionally, both gene families exhibited a relatively weak codon usage bias, a pattern shaped by mutational and selective pressures. Expression analysis showed that NbGRASs had tissue-specific expression patterns, with relatively high expression levels being observed in leaves and roots. The expression of NbGRASs was significantly changed under tomato yellow leaf curl virus or bamboo mosaic virus infection, suggesting that these NbGRASs can be involved in the plant’s antiviral response. These findings provide new perspectives for in-depth understanding of the evolution and functions of the GRAS gene family in N. benthamiana.

1. Introduction

Transcription factors (TFs) are of vital importance in controlling gene expression across diverse organisms. They participate in processes such as cellular signaling, the cell cycle, developmental stages, and responses to various stress in plants [1]. The GRAS family is one of the most important families of transcription factors. The designation of GRAS stems from the three initial members that were identified, specifically GAI (Gibberellin-Acid Insensitive), RGA (Repressor of GA1), and SCR (Scarecrow) [2,3]. GRAS proteins usually contain 360–850 amino acids [4]. The N-terminus of the GRAS family is highly diverse in length and sequence, while the C-terminus is highly homologous, with conserved motifs: LHRI, VHIID, LHRII, PFYRE, and SAW [5,6,7]. The VHIID motif of the C-terminal region is a core structure responsible for protein–protein interaction, which interacts with LHR I and LHR II, forming the LHR I-VHIID-LHR II complex. The variability in the N-terminal sequences of GRAS proteins, which may determine their specificity, is highly pronounced. Moreover, within the DELLA subfamily, these sequences notably include two conserved N-terminal domains: the DELLA and TVHYNP domains [7]. In early studies, the GRASs were divided into eight subfamilies based on Arabidopsis thaliana and rice, namely DELLA (the DELLA motif containing protein), HAM (hairy meristem), LAS (lateral suppressor), PAT1 (phytochrome A signal transduction 1), SHR (short root), SCR (scarecrow), SCL3 (SCR-like 3), and LISCL (lilium longiflorum SCR-like) [6].
Previous studies have revealed that GRAS transcription factors play crucial roles not only in plant growth and development but also in signal transduction, along with responses to both biotic and abiotic stresses [8,9,10]. Zhang et al. observed that overexpression of a GRAS TF, HcSCL3 could not only promote plant growth but also induce salt stress adaptation in Arabidopsis [11]. The GRAS family member DELLA protein can regulate jasmonic acid signaling to regulate plant growth and development through the GA signaling pathway, thereby enhancing the viability of plants under stress conditions [12]. The overexpression of the VaPAT1 gene derived from Amur grape (Vitis amurensis) in transgenic Arabidopsis results in an augmentation of the plant’s resilience to abiotic stress [13]. Studies have shown that in petunia, the HAM gene encodes a putative transcription factor of the GRAS family. This gene not only regulates the development of lateral organ primordia and stem vascular tissue, but also controls the maintenance of the shoot apical meristem [14]. The novel GRAS family member LlSCL gene in lily is prominently expressed during meiosis and regulates related genes during microsporogenesis through the transcriptional activation activity of its amino terminus [15]. In transgenic rice, overexpressing the OsGRAS23 could promote plant growth and bolster the rice’s tolerance to drought and oxidative stress through inducing the expression of several stress-responsive genes [16].
As a crucial model plant for exploring host–pathogen interactions, Nicotiana benthamiana hosts extensive application in molecular biology research and biotechnology, notably in the fields of synthetic biology and the gene editing industry [17,18,19,20]. Currently, the GRAS family has been identified in a variety of species, including Oryza sativa [5], Arabidopsis [21], Zea mays [22], Chinese cabbage [23], Solanum lycopersicum [24], and Castor bean [25]. Despite ongoing research, the GRAS gene family in N. benthamiana is underexplored. Luckily, several updated chromosome-level reference genomes of N. benthamiana (2n = 19) have been released, providing a solid basis for investigating the GRAS gene families within its genome [26,27].
A thorough genome-wide analysis of the GRAS gene family in N. benthamiana was performed using the recently available genome data [26,27]. A total of 83 NbGRAS members were identified in this study. Furthermore, a comprehensive analysis was conducted on the gene structure, phylogenetic relationships, motif composition, codon usage bias, and synteny of the GRAS gene family in N. benthamiana plants. The expression patterns of NbGRAS genes in response to viral infection were also examined. Our research will not only facilitate further investigation into GRAS transcription factor genes but also aid in the genetic enhancement of plant resistance.

2. Results

2.1. Identification and Characterization of the GRAS Gene Family in Nicotiana benthamiana

In order to identify all potential GRAS genes, we used Tbtools to perform a genome-wide search in the Nicotiana benthamiana genome to identify all members of the GRAS family [28,29]. Then, the functional annotation of all candidate genes was further confirmed through analysis with the protein family database (Pfam) and the NCBI Batch CDD tool. A total of 83 GRAS genes were identified in the genome of N. benthamiana. To gain a clearer understanding of the characteristics of NbGRAS genes, we analyzed their basic information, including amino acid lengths, molecular weights (MWs), theoretical isoelectric points (PIs), numbers of introns and exons and subcellular locations. The number of amino acids in NbGRASs ranged from 188 (NbGRAS73) to 874 (NbGRAS70), with a molecular weight range of 20.8 kDa to 99.4 kDa. The isoelectric point (pI) values of NbGRASs ranged from 4.61 to 9.24. The number of introns and exons varied from 0 to 3 and from 1 to 3, respectively (Table S1). Moreover, subcellular localization analysis indicated that all identified NbGRASs were localized in the nucleus (Table S1).
In order to systematically analyze the evolutionary relationships between the GRAS gene family of N. benthamiana and other representative plant species, we collected GRAS protein sequences including 23 AtGRASs, 60 OsGRASs, and 54 SlGRASs (Figure 1). Utilizing the IQ-TREE 2.2.5 software (IQ-TREE 2.2.5, Canberra, Australia), we constructed a maximum likelihood (ML) phylogenetic tree employing the JTT + F + R10 model. Based on the results of the phylogenetic tree, the 83 NbGRASs can be categorized into eight subfamilies: DELLA, SCL3, SCR, LAS, HAM, LISCL, SHR, and PAT1. Among these, the DELLA and PAT1 subfamilies have the highest number of members, with 19 and 15 members, respectively, while the LAS and SCL3 subfamilies have the fewest, with 3 and 4 members, respectively (Figure 1), which is consistent with several previous reports [23,24,28,29].

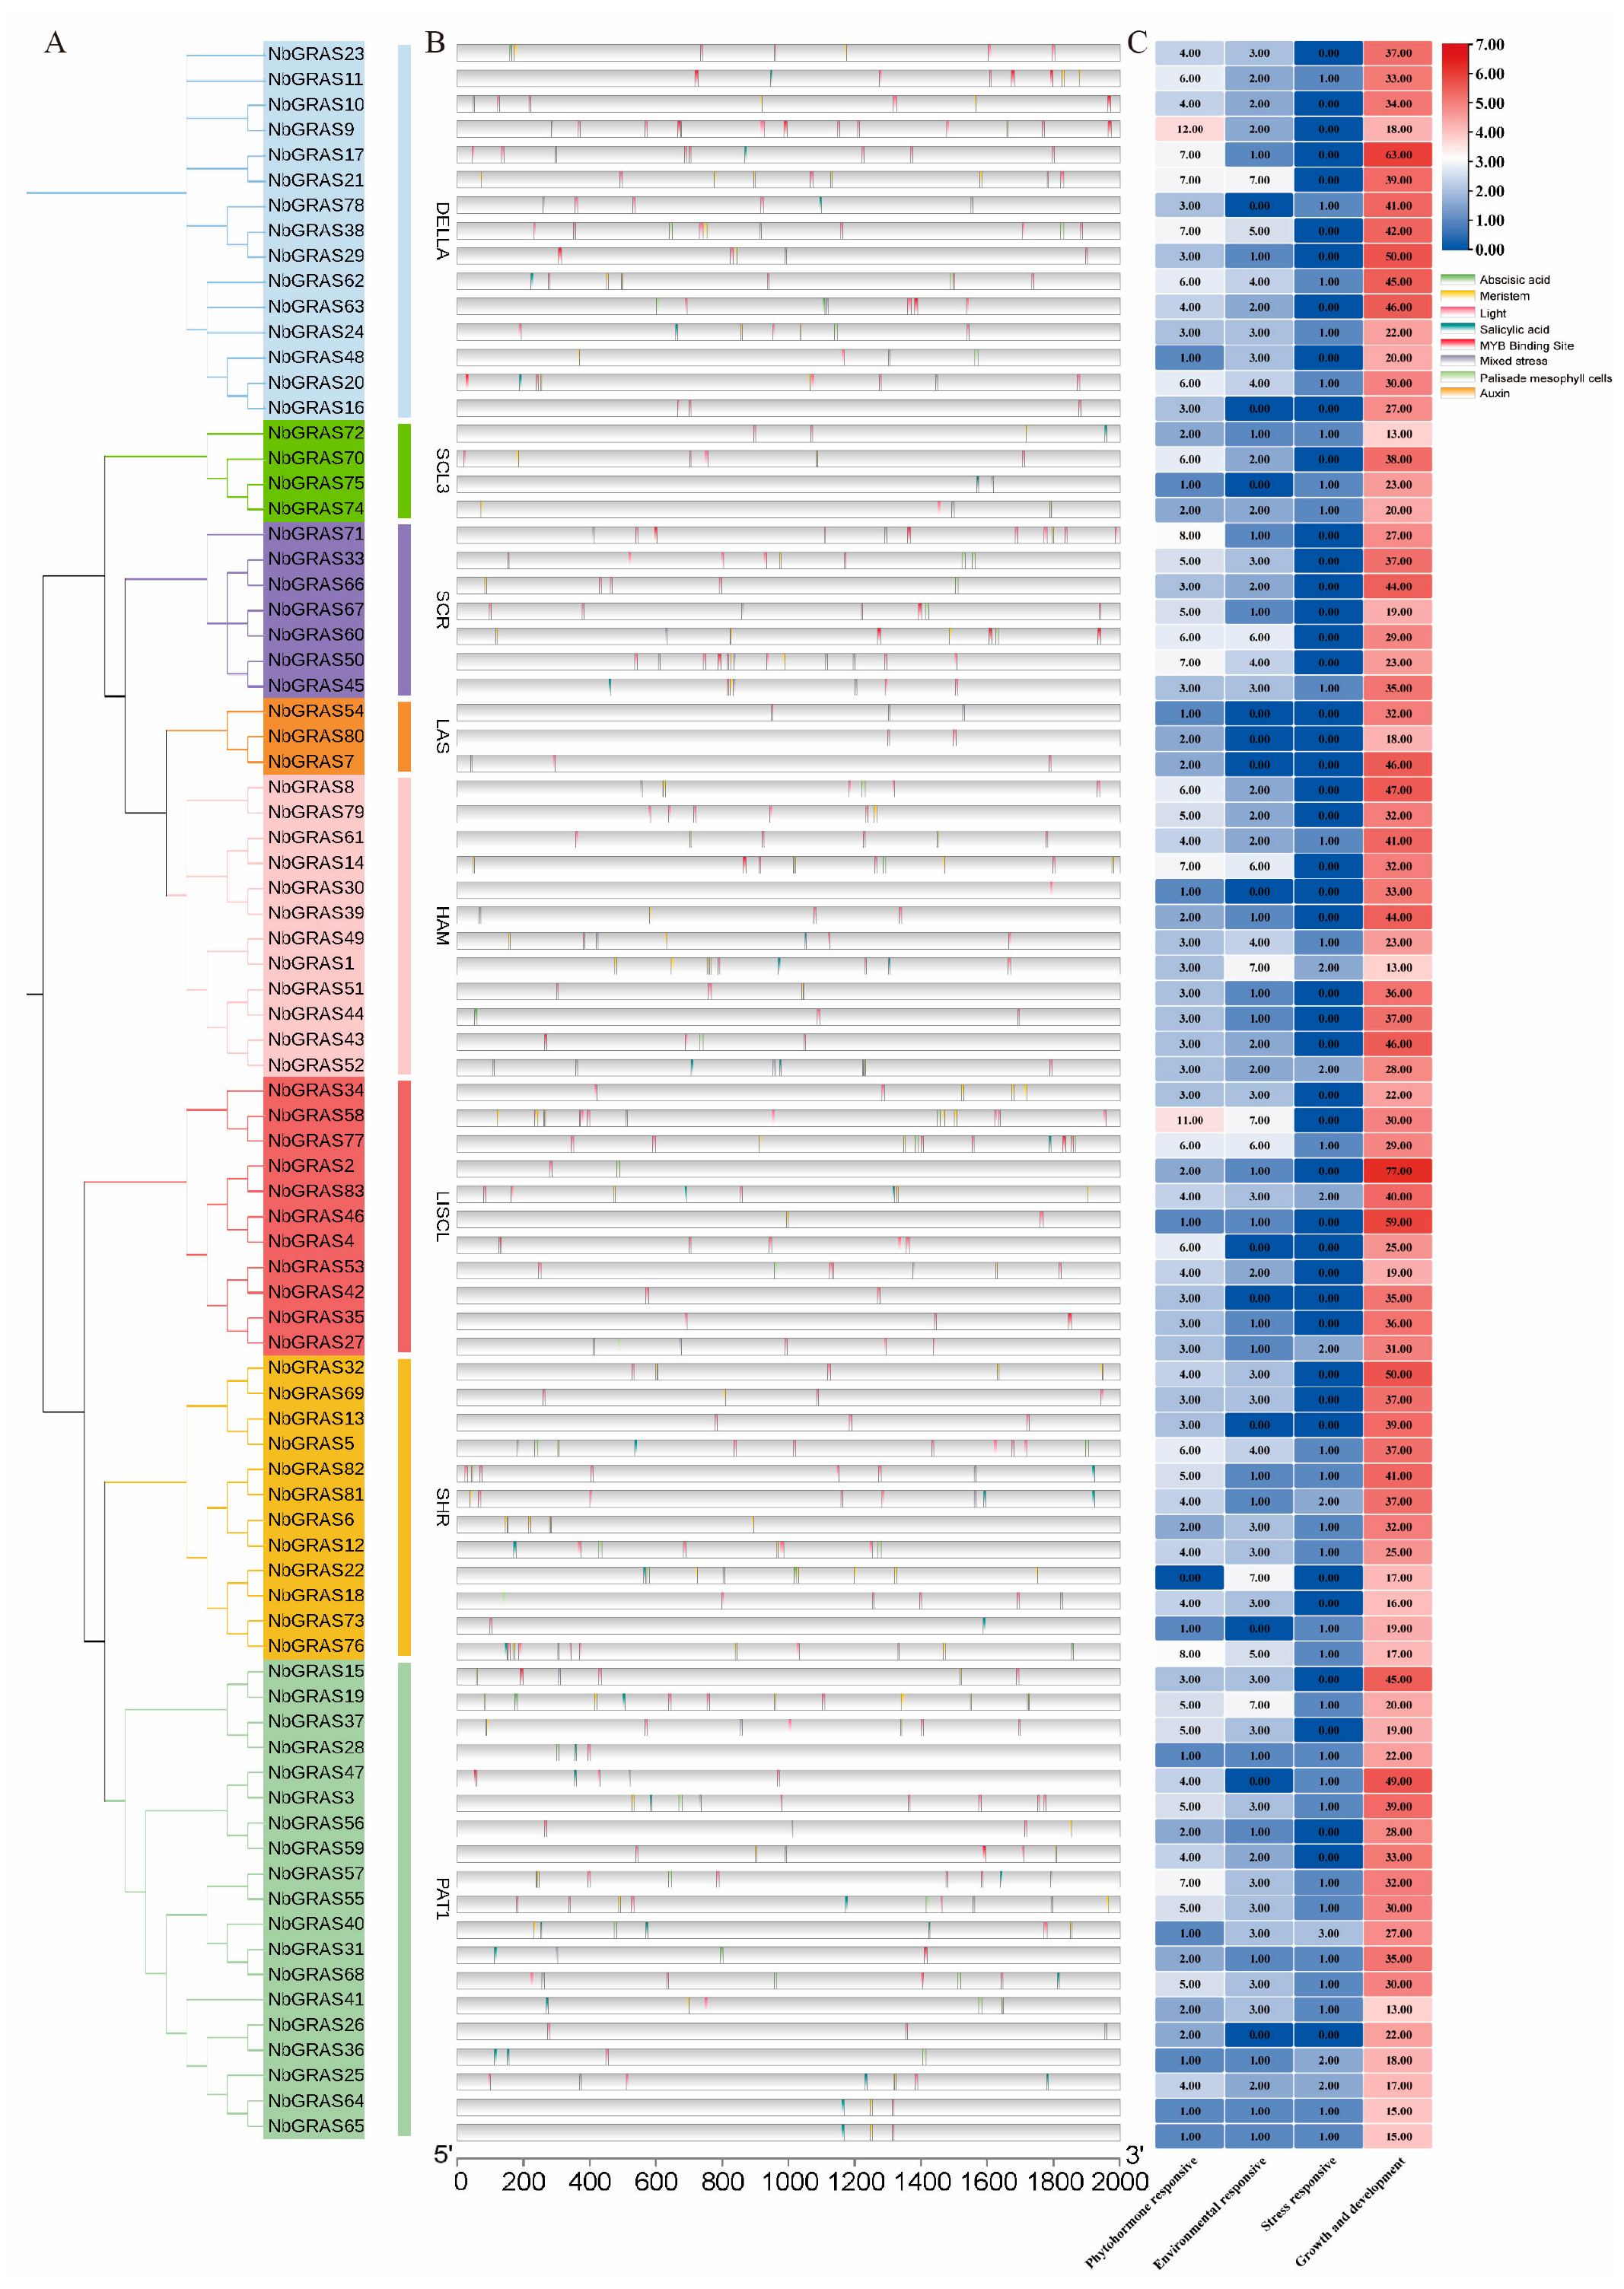
2.2. Analysis of Conserved Motifs and Gene Structures of the NbGRASs

In order to determine the differences in gene structure and provide a basis for the evolution of NbGRAS family structural diversity, the intron and exon structures of 83 NbGRASs were compared and visualized. The number of introns of NbGRASs varies from 0 to 3 (Figure 2C). Subsequently, 10 conserved motifs were identified in NbGRASs by MEME kit. The number of motifs for NbGRASs varied from 2 to 10. Five conserved motifs, including motif 1, motif 3, motif 6, motif 7 and motif 10, were highly conserved in the NbGRAS family, except for NbGRAS73 (Figure 2B). Moreover, NbGRASs within the same subfamily exhibit relatively conserved motifs and gene structures, suggesting potential functional consistency among these members.

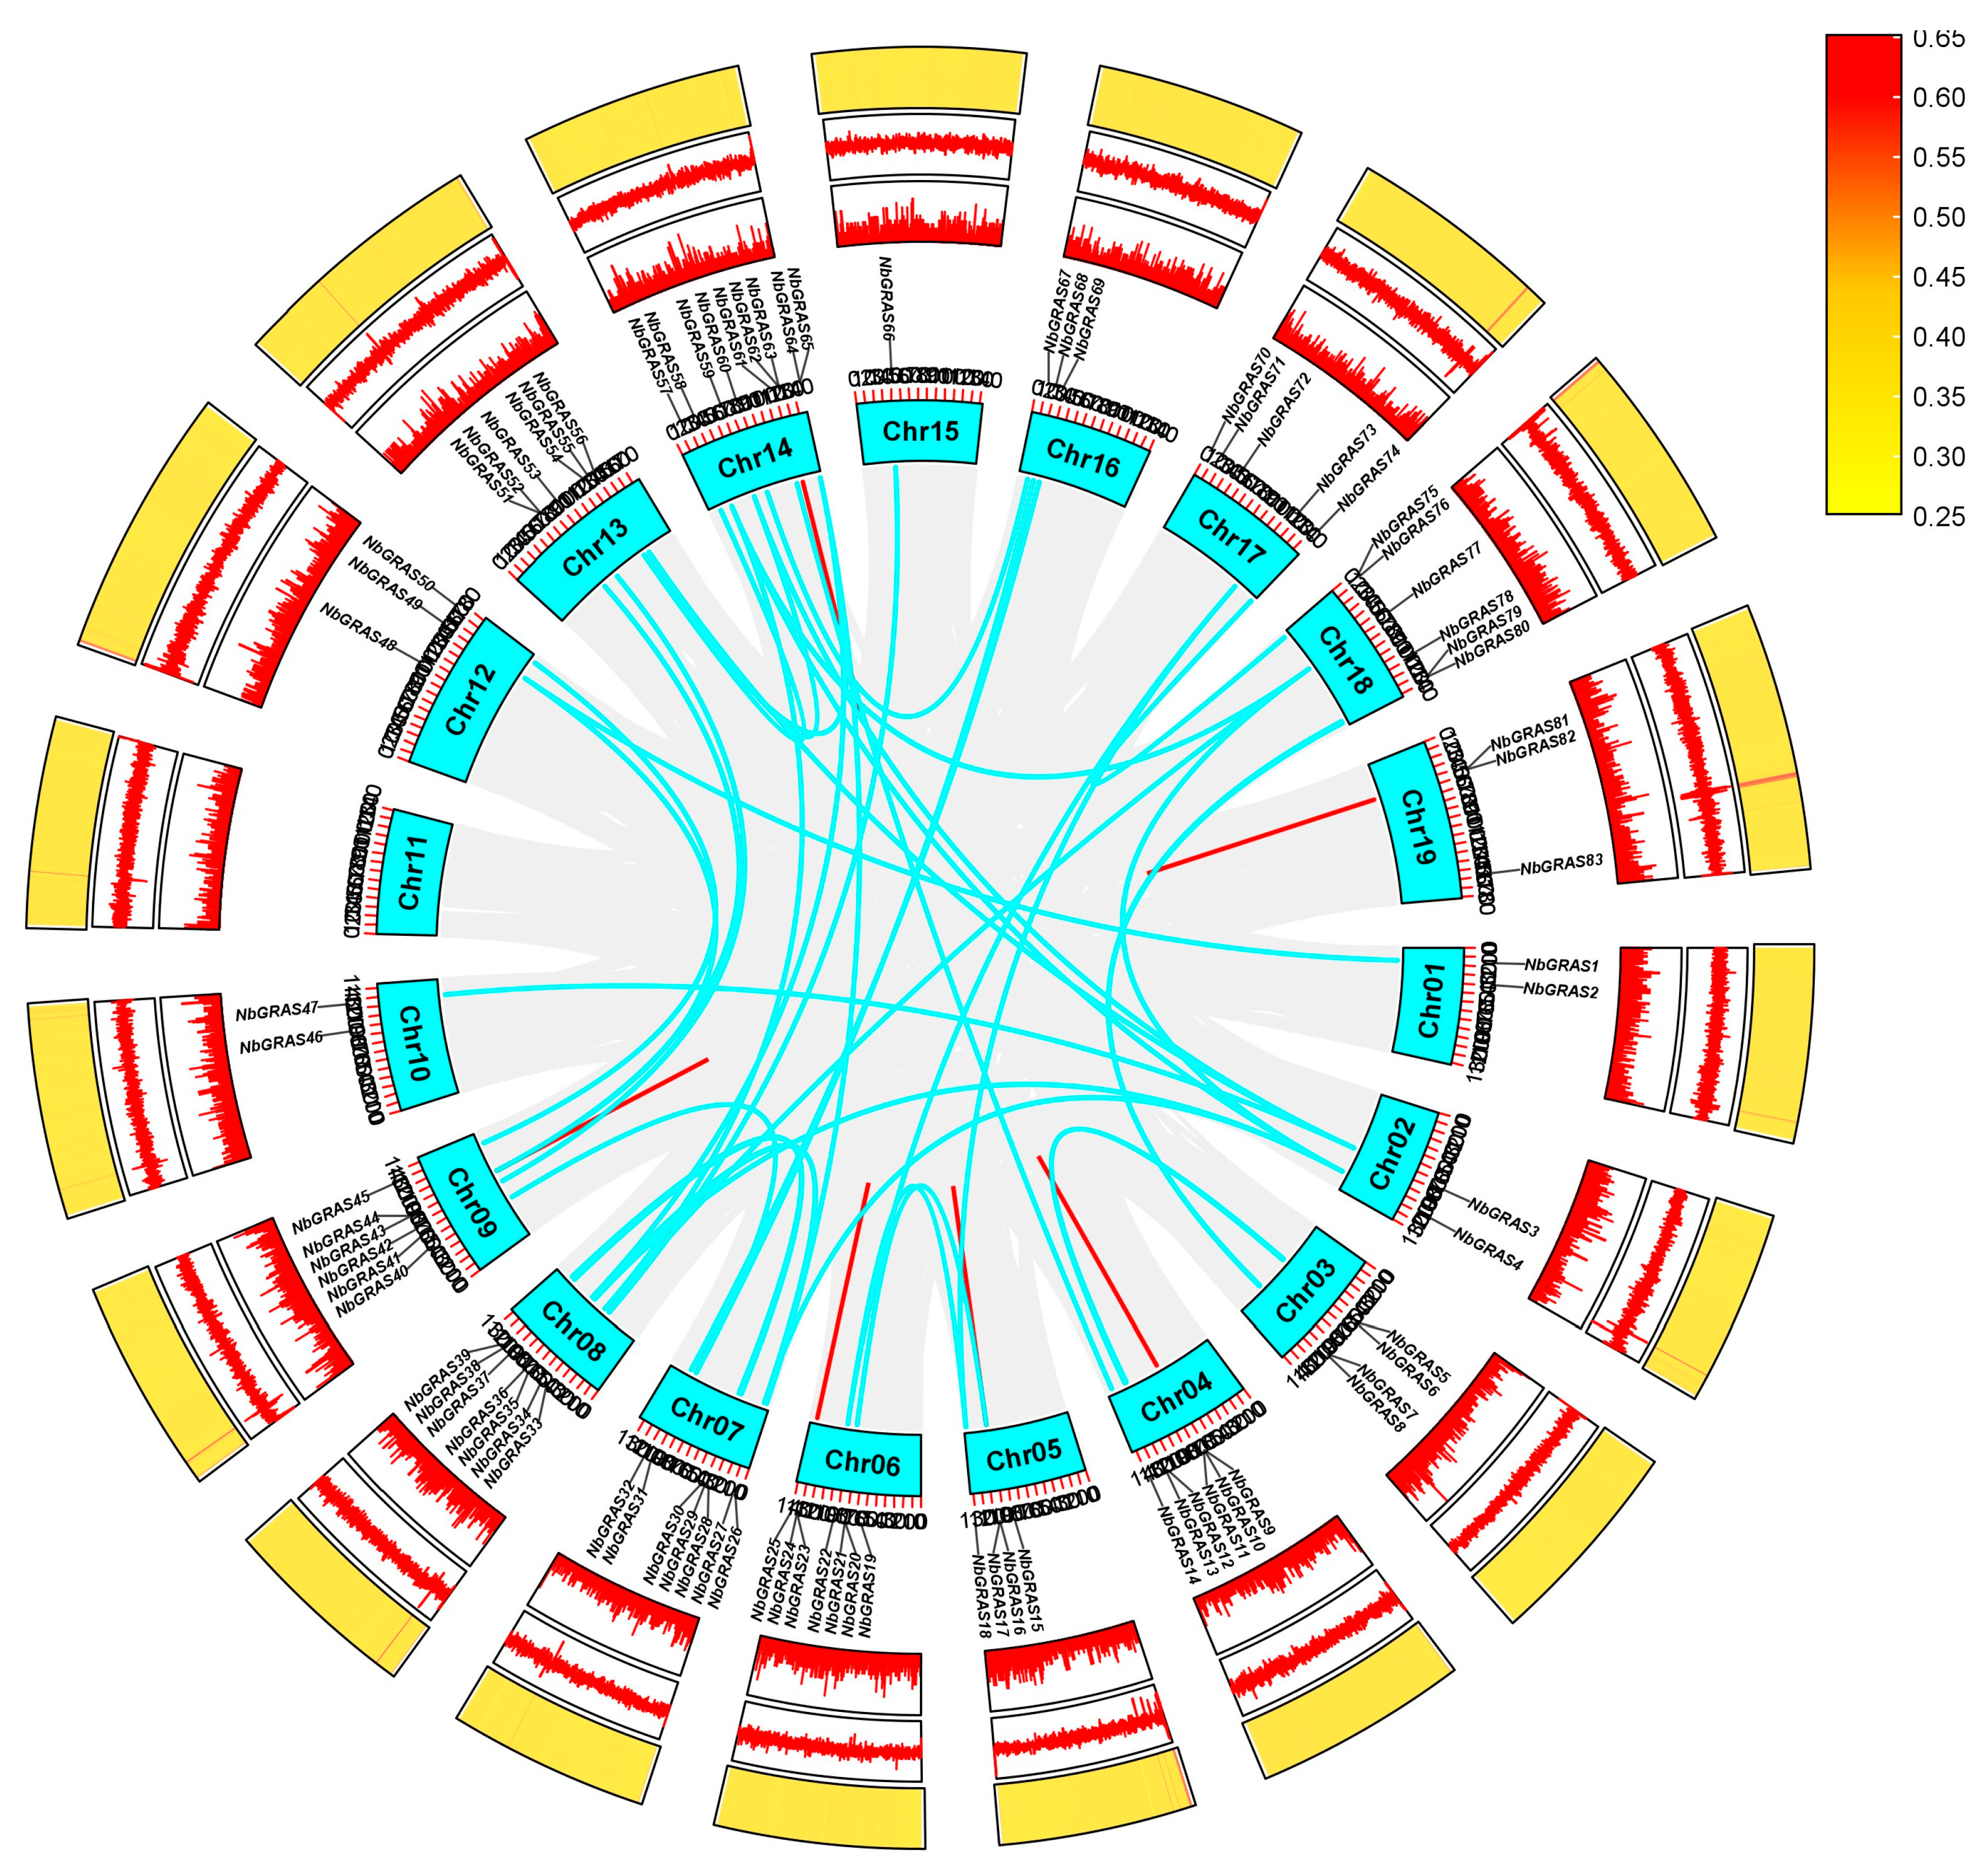
2.3. Chromosomal Distribution and Gene Duplication of the NbGRAS Family

The results of chromosome (chr) mapping showed that 83 NbGRAS genes were unevenly distributed on 19 chromosomes (Figure S1). Chr14 showed the highest density of NbGRAS genes, including nine members (10.84% of the total). The remaining NbGRAS genes were mostly distributed across Chr04, Chr06, Chr07, Chr08, Chr09, Chr13, Chr17 and Chr18, while the number of genes on Chr01, Chr02, Chr03, Chr05, Chr10, Chr12, Chr15, Chr16 and Chr19 ranged from only two to five. Collinearity analysis showed distinct patterns of gene duplication events in the NbGRASs. A set of 40 segmental duplication pairs, together with 13 tandem repeat pairs, were identified for NbGRASs (Figure 3). Evolutionary analysis of the NbGRAS gene pairs verified that all Ka/Ks ratios of them were significantly less than 1, displaying strong purifying selection pressure acting on these duplicated genes of NbGRASs throughout their evolutionary history.

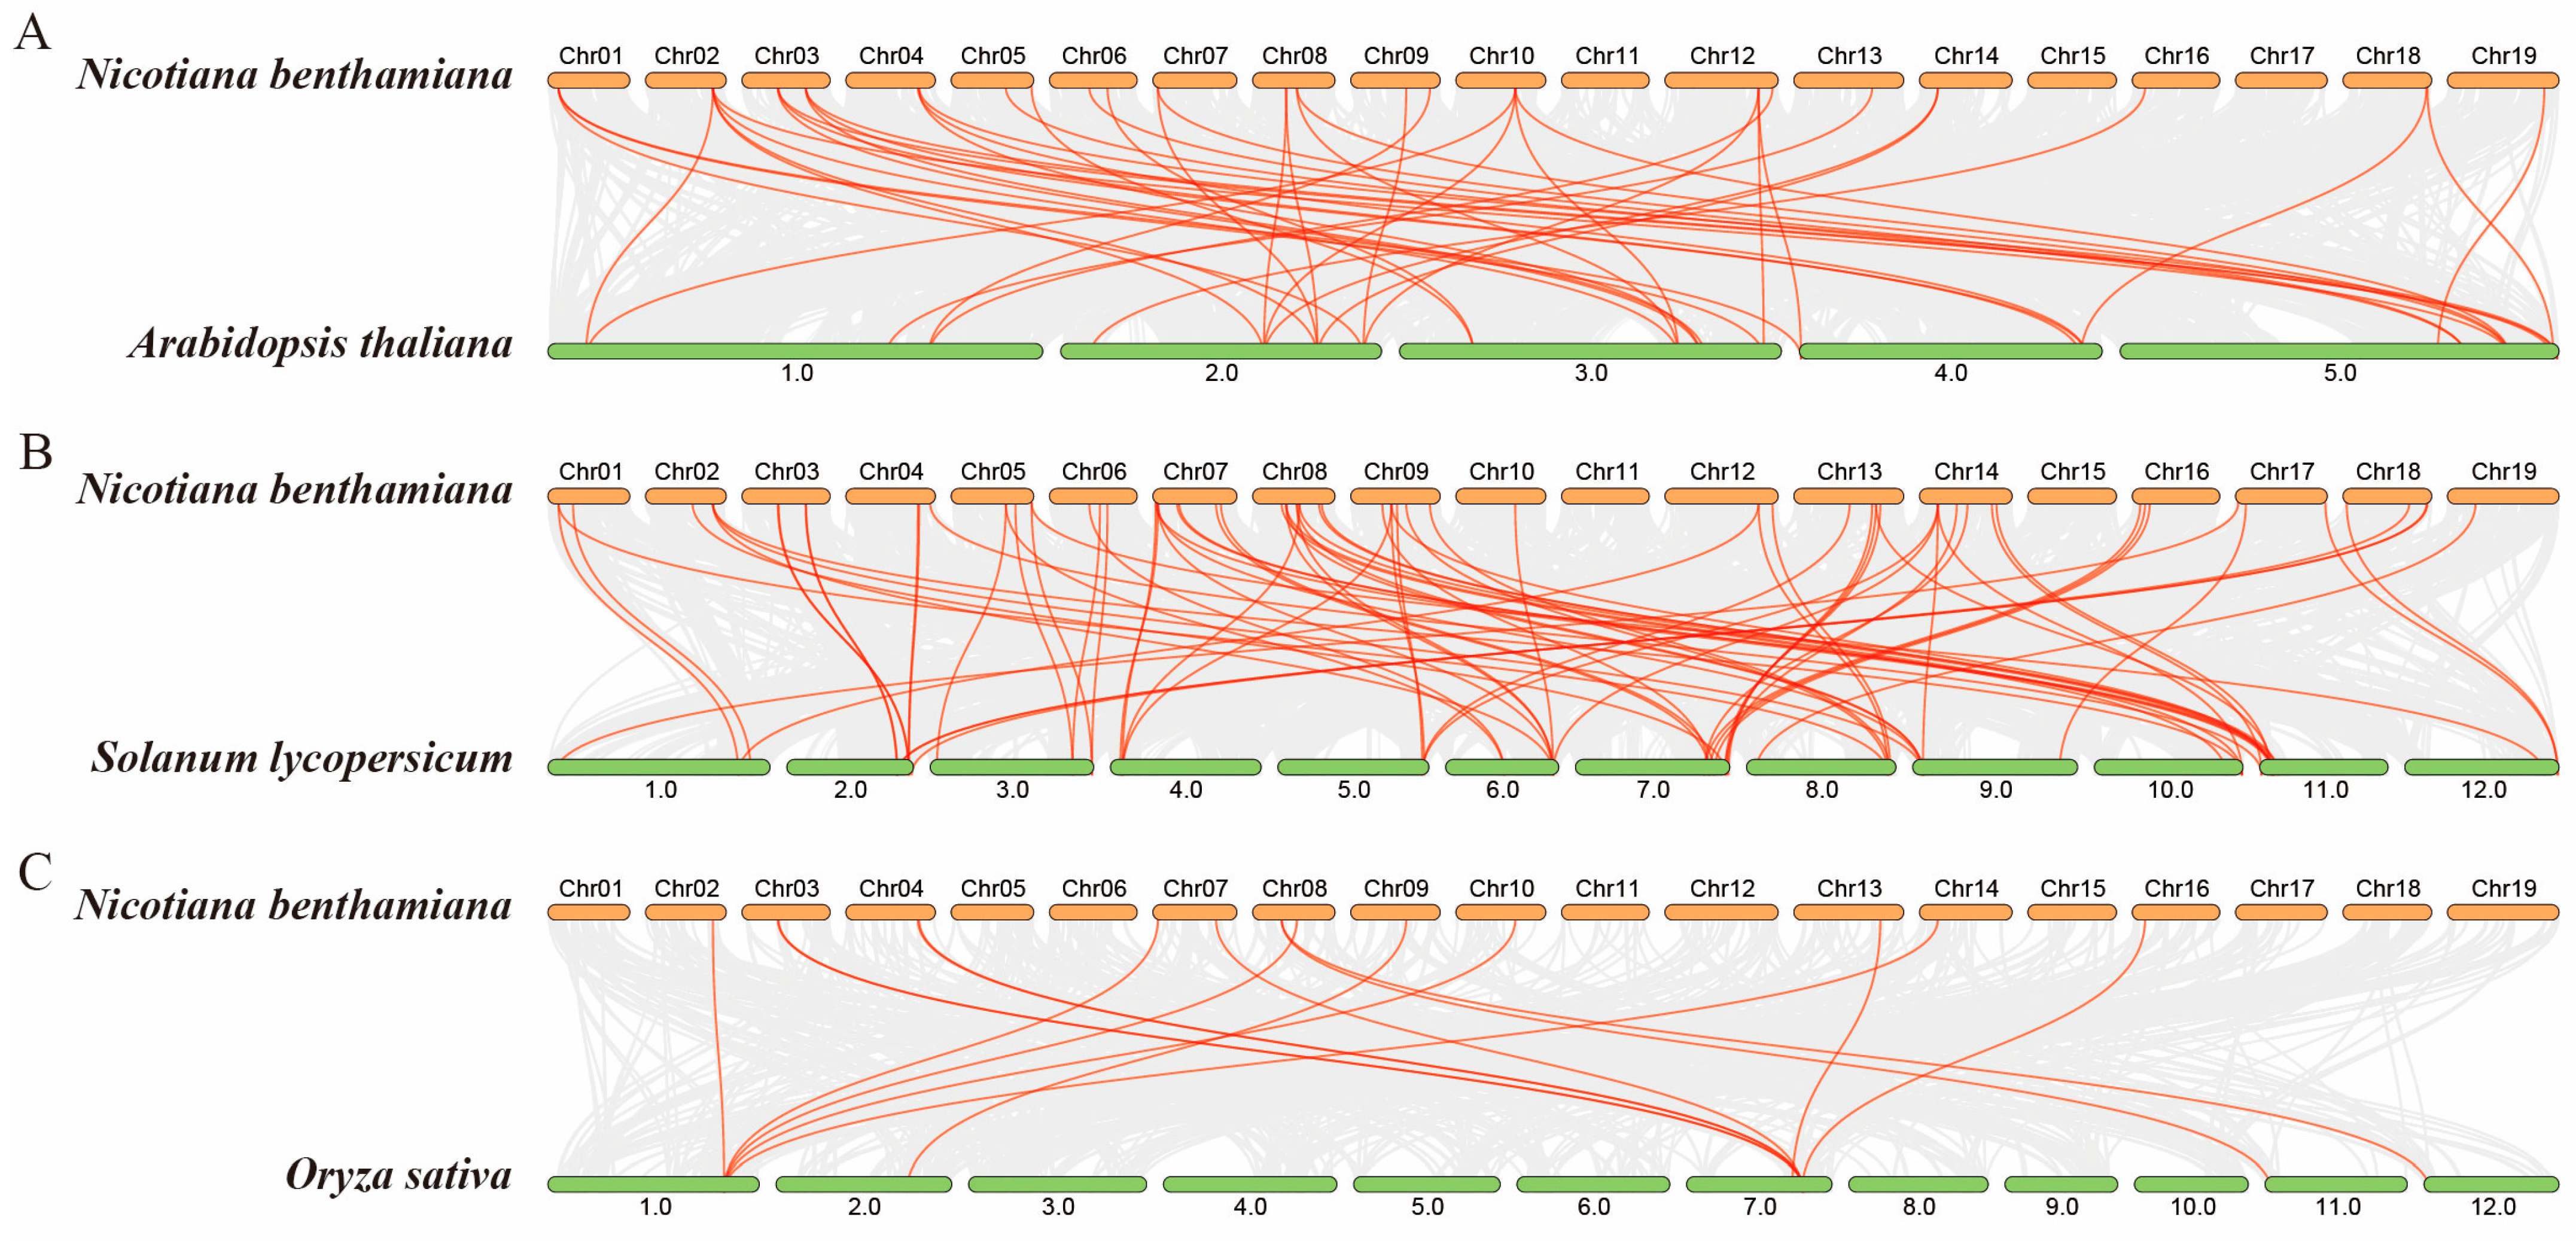
2.4. Synteny Analysis of GRAS Genes

In order to explore the evolutionary relationships of GRAS genes in Nicotiana benthamiana, the collinearity characteristics of GRAS gene pairs in the genome of N. benthamiana, monocot Oryza sativa, dicot Arabidopsis thaliana and Solanum lycopersicum were analyzed by using the multicollinearity scanning toolkit (MCScanX, Athens, Greece) [30]. The results showed that 44 GRAS gene homologous pairs were identified between A. thaliana and N. benthamiana (Nb-At) (Figure 4A), 75 GRAS gene homologous pairs were found between tomato and N. benthamiana (Nb-Sl) (Figure 4B), while only 15 GRAS gene homologous pairs were found between O. sativa and N. benthamiana (Nb-Os) (Figure 4C). The results showed that the number of homologous GRAS gene pairs between N. benthamiana and S. lycopersicum is greater than that between N. benthamiana and Arabidopsis or O. sativa, which might be because both N. benthamiana and tomato belong to the Solanaceae family.

2.5. Prediction of Cis-Acting Elements in the NbGRASs Promoters

Specific cis-acting regulatory elements play a crucial role in the fine-tuning of gene expression by binding to their corresponding transcription factors [31,32]. A wealth of research has shown that these elements are involved in the processes of plant responses to various stress conditions [33,34,35]. We screened the 2000 bp promoter sequences of the NbGRAS genes utilizing the PlantCARE database [36]. A total of 10,580 cis-acting elements were isolated and characterized. We classified and counted most of the identified cis-acting elements based on their functions, which include phytohormones, environmental factors, stress, as well as growth and development. As shown in Figure 5B,C, we identified a total of 2842 cis-acting elements related to growth and development and 322 elements related to phytohormone responses within the NbGRAS gene family. These observations indicated that the NbGRAS family held an important position in regulating the response to various stress conditions and environmental adaptability [37,38].

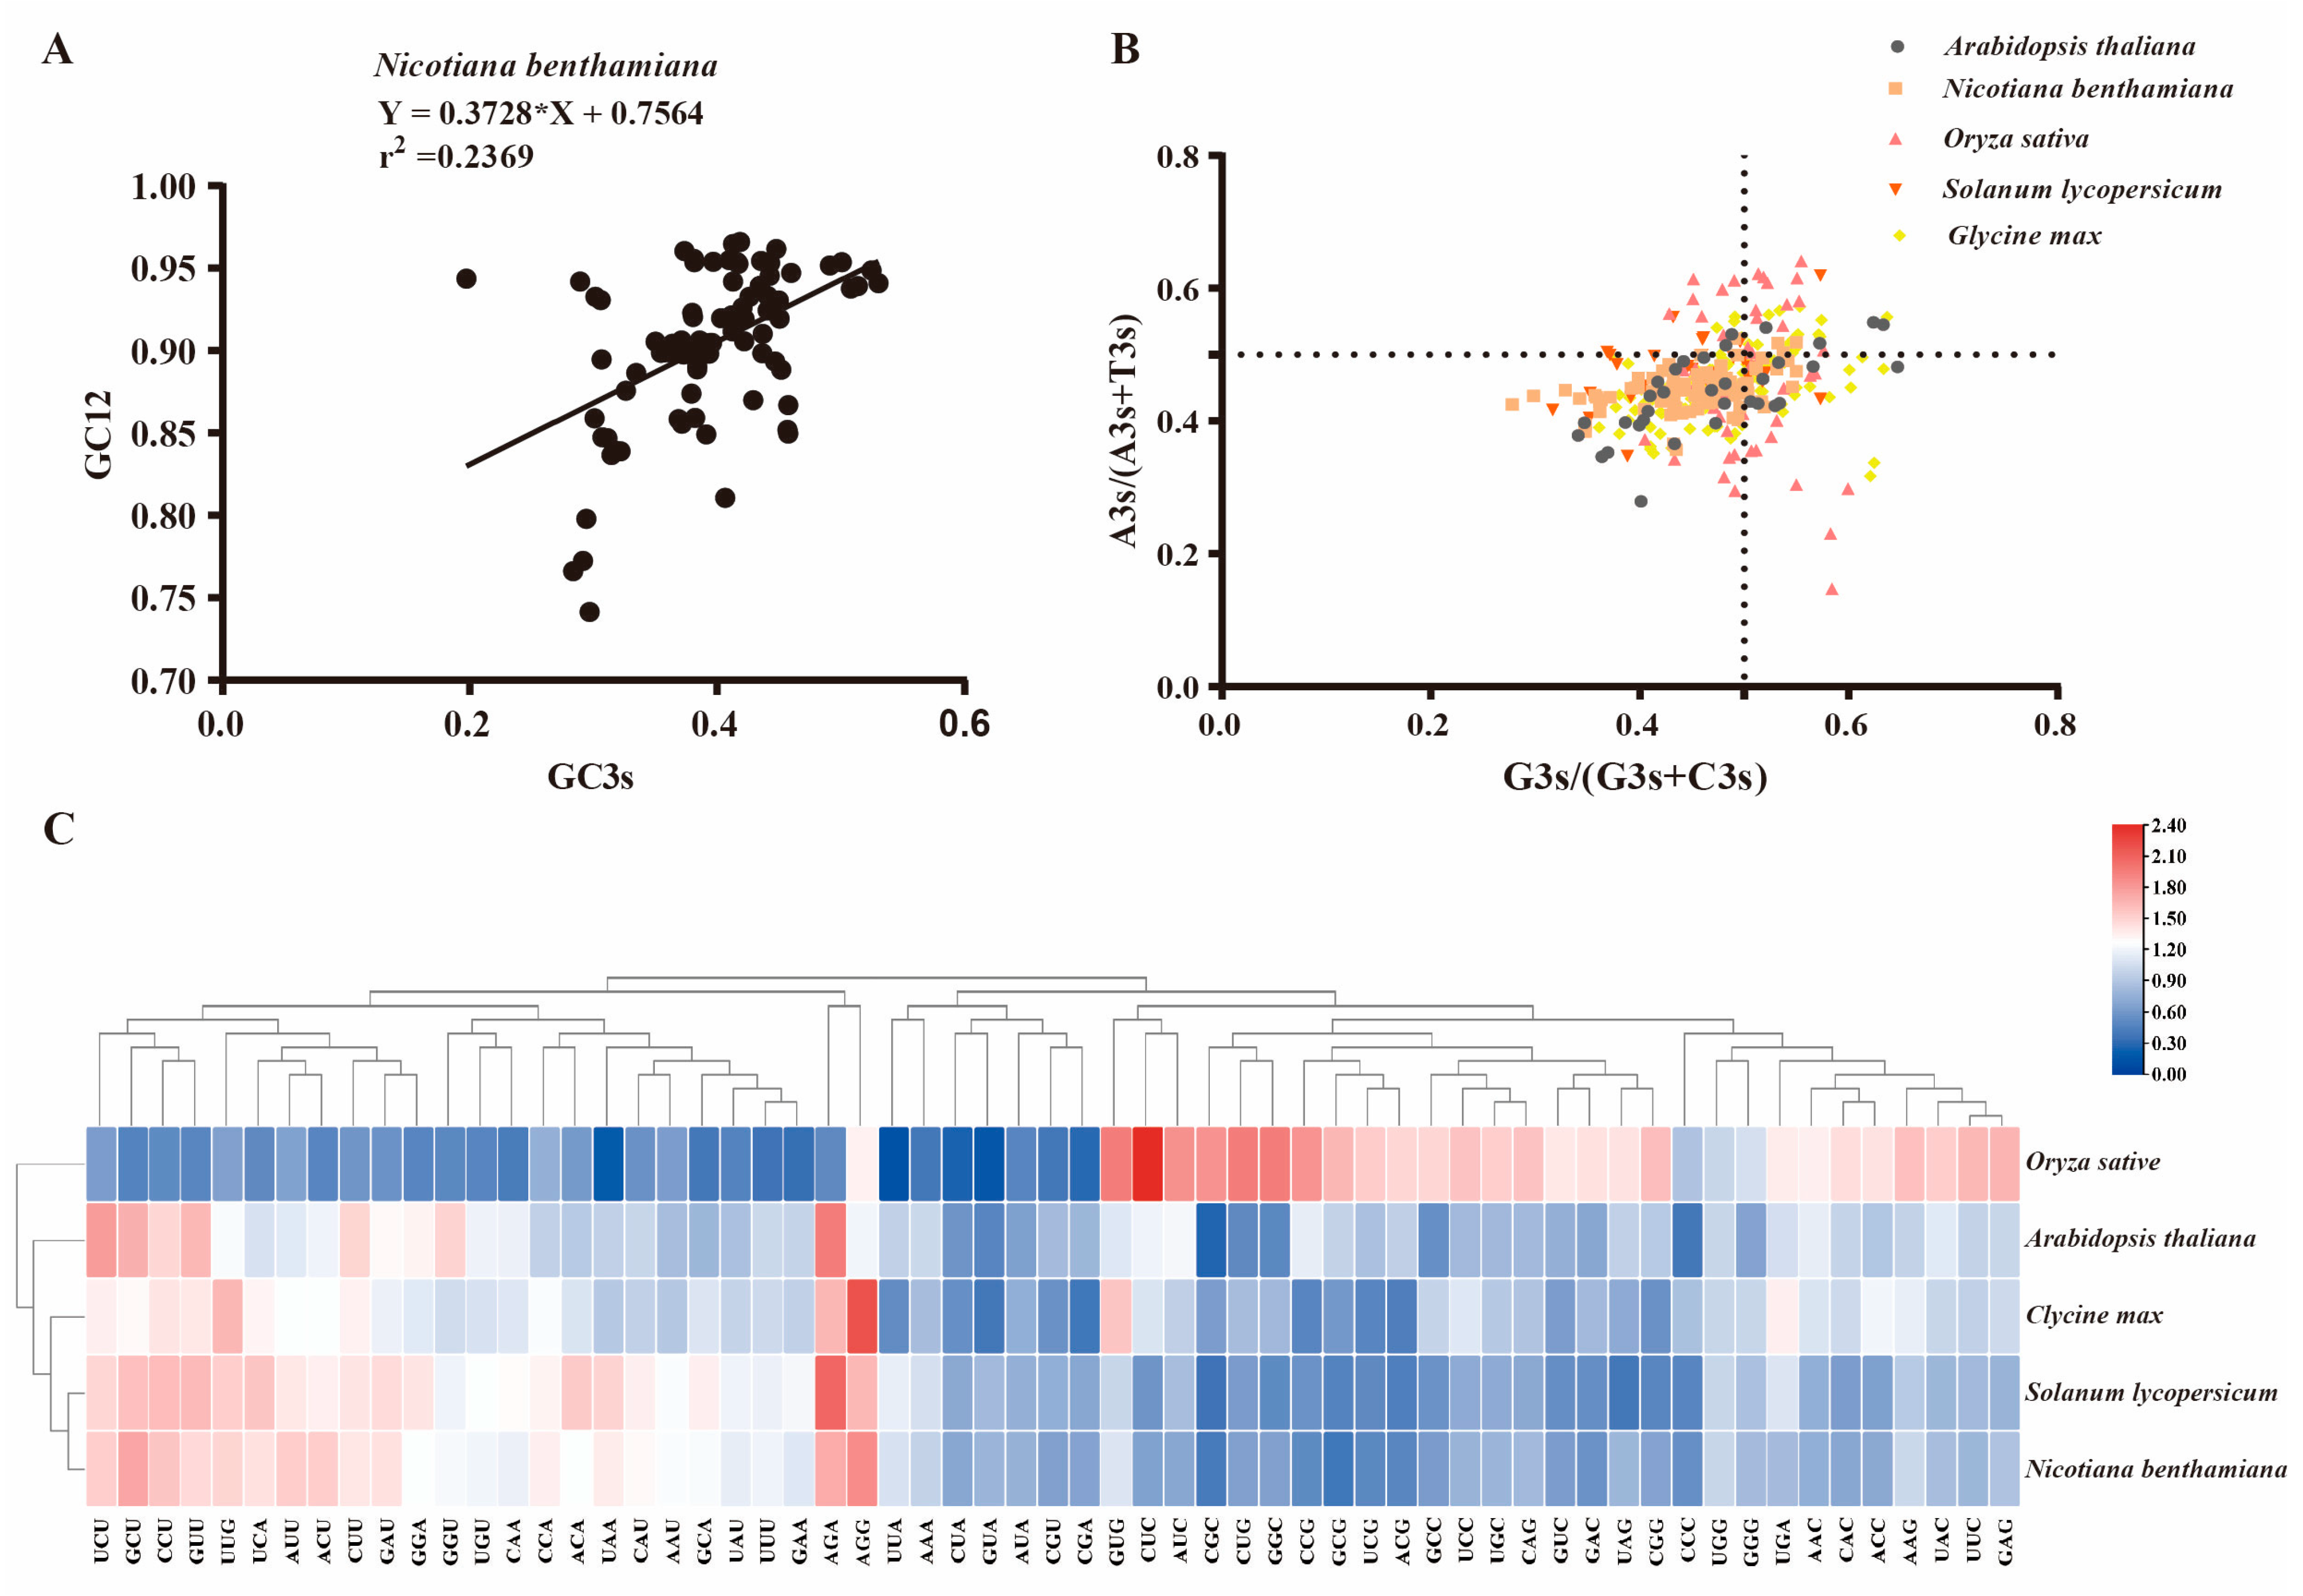
2.6. Analysis of Codon Usage Patterns for GRAS Genes Across Different Species

In the genetic code system of organisms, each codon typically corresponds to a specific amino acid [10]. However, many amino acids can be encoded by multiple different codons, which are referred to as synonymous codons. Notably, the usage of codons in different genes or species often exhibits a preference for certain specific codons, and this preferential phenomenon in the use of synonymous codons is termed codon usage bias [39,40]. This may be of great significance for understanding the genomic evolution mechanism among related species. Through the analysis of codon usage bias (CUB) of GRAS genes in five species including Oryza sativa, Arabidopsis thaliana, Nicotiana benthamiana, Solanum lycopersicum and Glycine max, it was found that the average GC content of GRAS genes in these species was between 0.421 and 0.634, and the GC3s (G or C base content at the third position of synonymous codon) ranged from 0.356 to 0.769. The results showed that the average effective number of codons (ENC) of GRAS genes in monocots (O. sativa) was significantly lower than that in dicots (G. max, A. thaliana, N. benthamiana and S. lycopersicum) (Table 1), indicating that monocots exhibit stronger codon usage bias.
Analysis of relative synonymous codon usage (RSCU) has revealed the characteristics of codon usage bias (CUB) [41]. We observed that the RSCU patterns of GRAS genes in S. lycopersicum and N. benthamiana were extremely similar, which may be related to the close genetic relationship between these two plants. The similarity in RSCU patterns of GRAS genes between G. max and O. sativa is lower than that between S. lycopersicum and N. benthamiana. It is worth noting that as a monocotyledonous plant, the RSCU pattern of O. sativa is significantly different from that of N. benthamiana. In five species—A. thaliana, N. benthamiana, O. sativa, S. lycopersicum, and G. max—the majority of species do not have a high usage proportion of G and A at the third codon position, nor do they exhibit extreme preference for G or A. Instead, they tend to use two bases, C and T, to form the third codon position. In N. benthamiana (r2 = 0.02369, p < 0.01) (Figure 6A), S. lycopersicum (r2 = 0.2631, p < 0.01) (Figure S2A), and A. thaliana (r2 = 0.1570, p < 0.01) (Figure S2B), there was a relatively weak positive correlation between GC3s and GC12 in the coding sequences of GRAS genes. These results indicate that in dicotyledonous plants (such as N. benthamiana, S. lycopersicum, and A. thaliana), the codon bias of GRAS genes was jointly influenced by mutational pressure and natural selection. As for O. sativa (r2 = 0.6362, p < 0.01) (Figure S2C), there was a significant positive correlation between GC3s and GC12 in the coding sequences of GRAS genes, which might be closely related to its taxonomic status as a monocotyledonous plant, suggesting that monocotyledonous plants may have unique evolutionary mechanisms or selective pressures in the process of codon bias formation. Interestingly, in Glycine max (r2 = 0.2362, p < 0.01) (Figure S2D), there is a weak negative correlation between GC3s and GC12 in the coding sequences of GRAS genes.

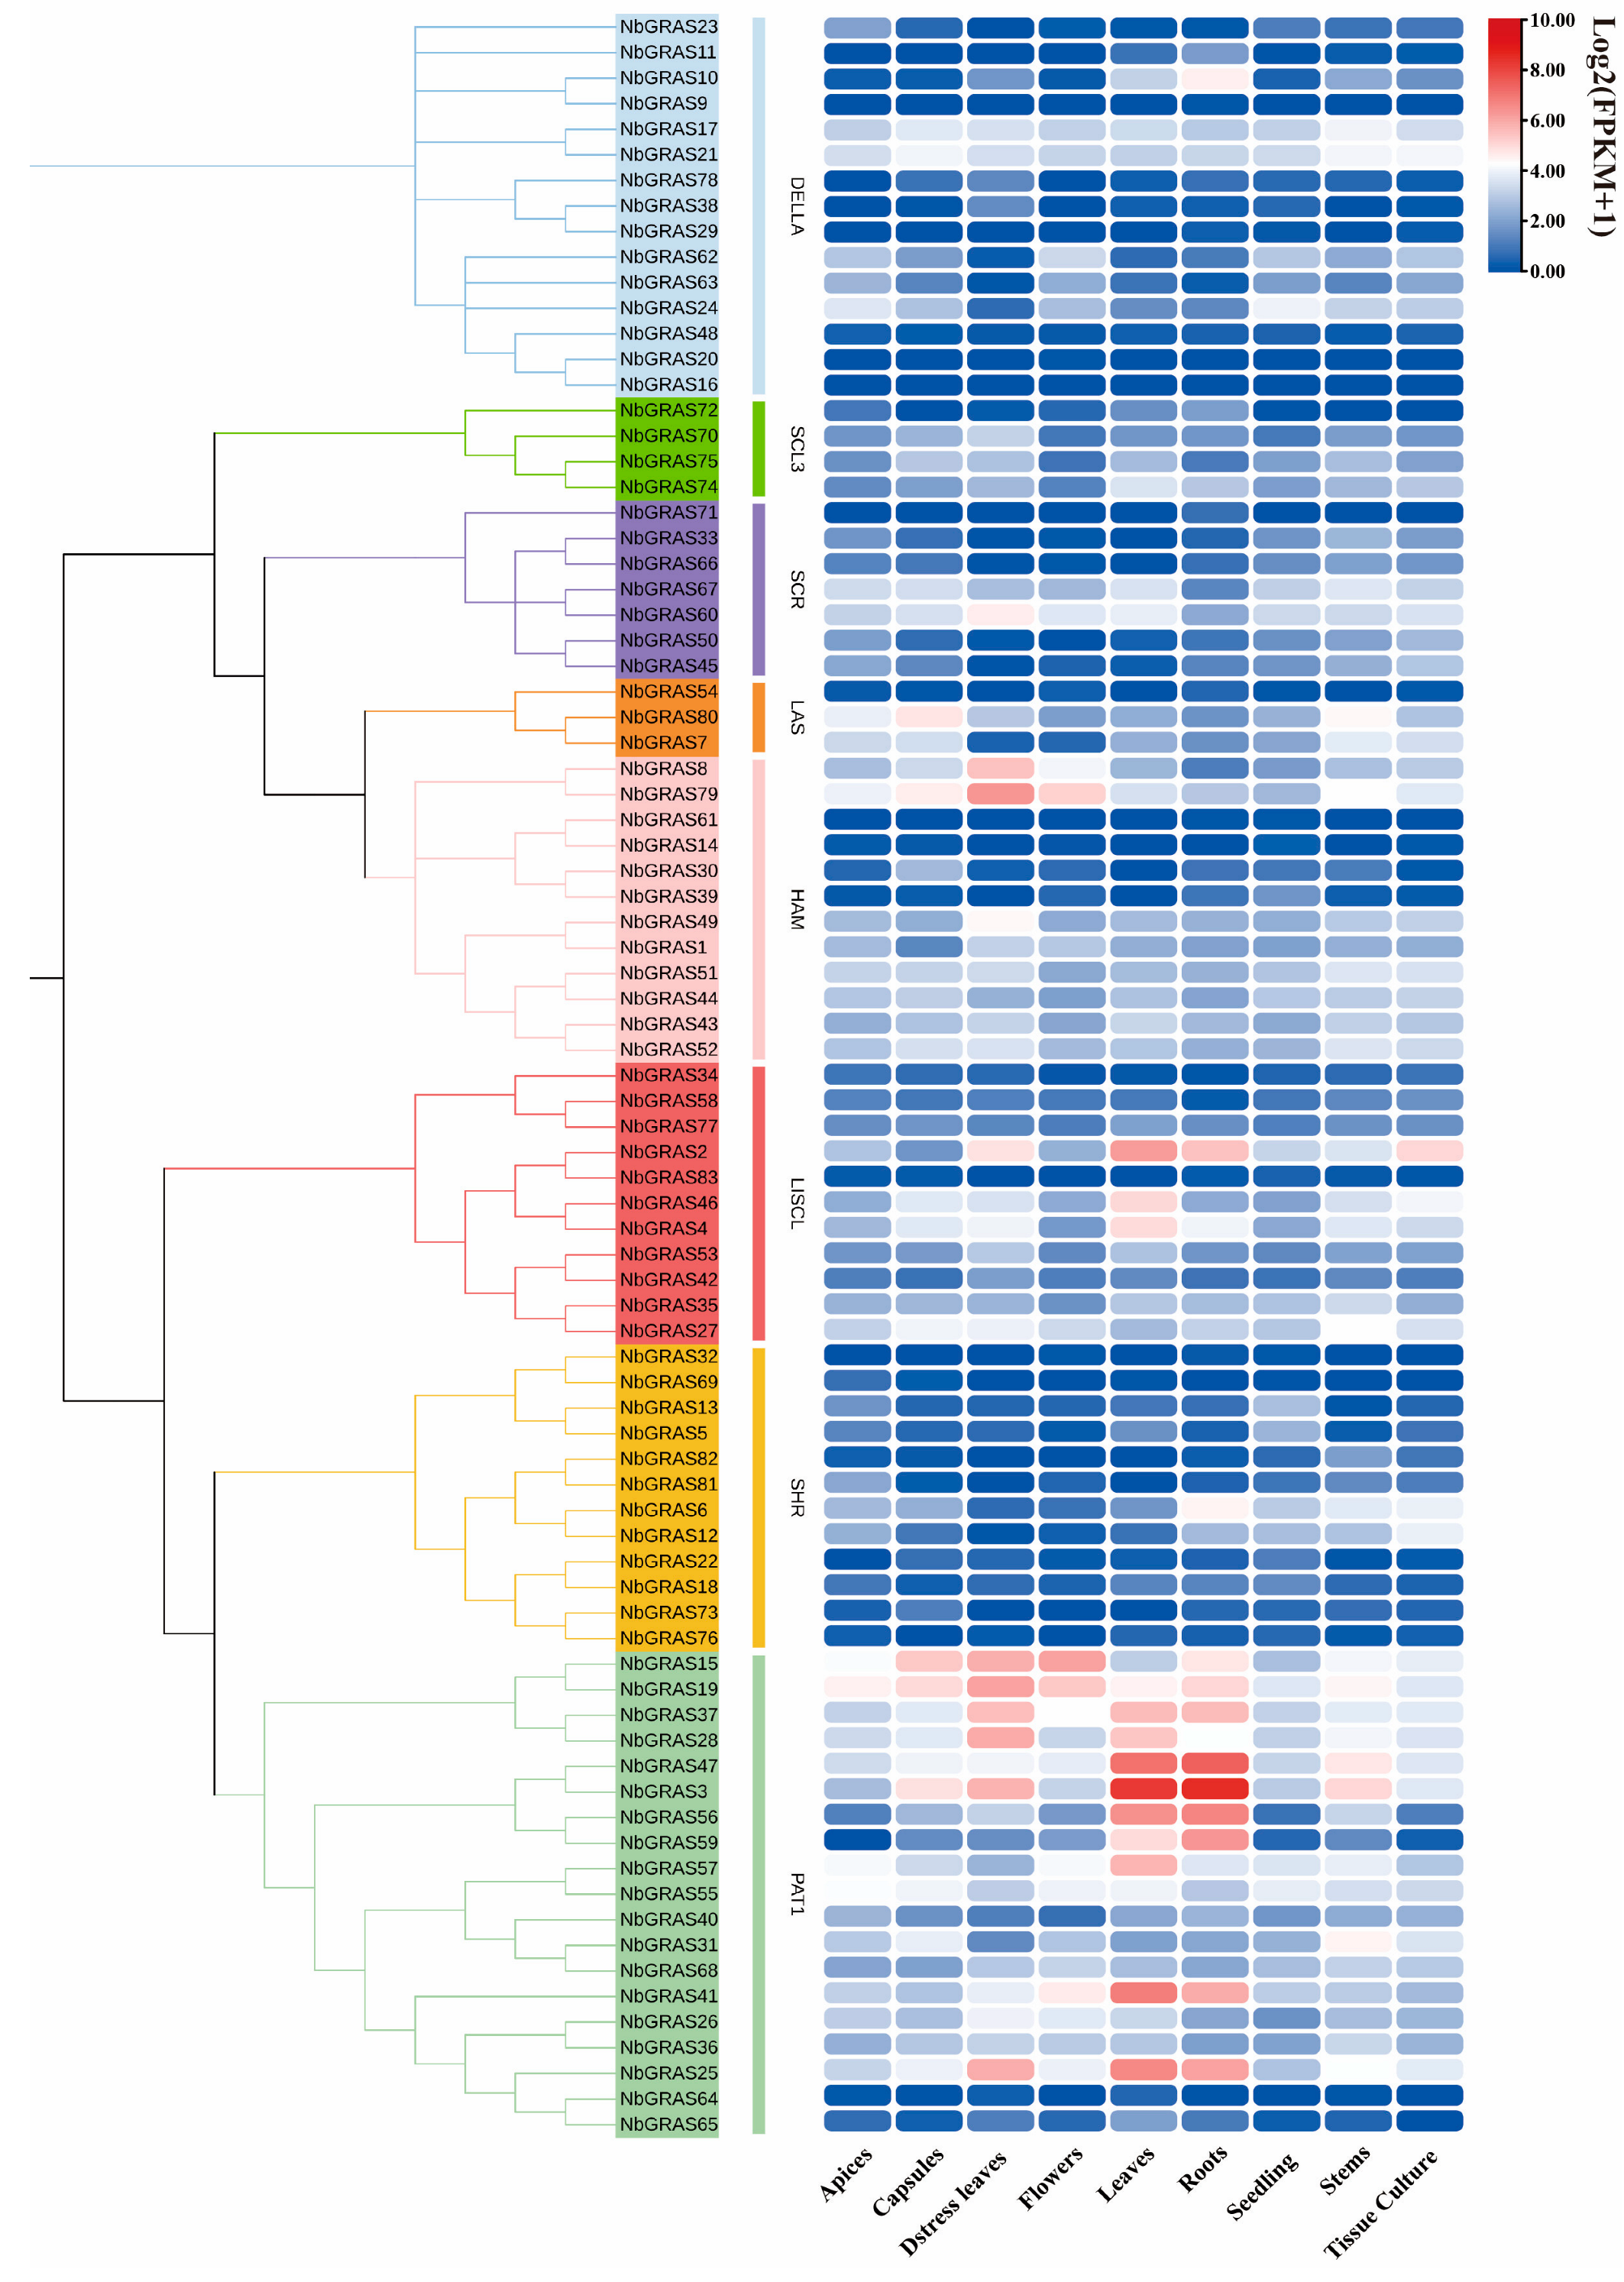
2.7. Expression Analysis of NbGRASs in Different Tissues

In order to explore the expression patterns of NbGRAS genes across different tissues and organs, we detected the expression levels of all identified NbGRASs in different tissues, including apices, capsules, distress leaves, flowers, leaves, roots, seedlings, stems and tissue culture, based on the publicly available RNA sequencing data [8]. Tissue expression pattern analysis showed that NbGRASs were expressed in all detected tissues. Especially in leaf and root tissues, the NbGRASs genes showed higher expression levels. Among them, there were 12 genes with higher expression levels in leaf tissues and 10 genes with higher expression levels in root tissues (Figure 7). These results indicated that the NbGRASs exhibited high transcriptional activity in these tissues.

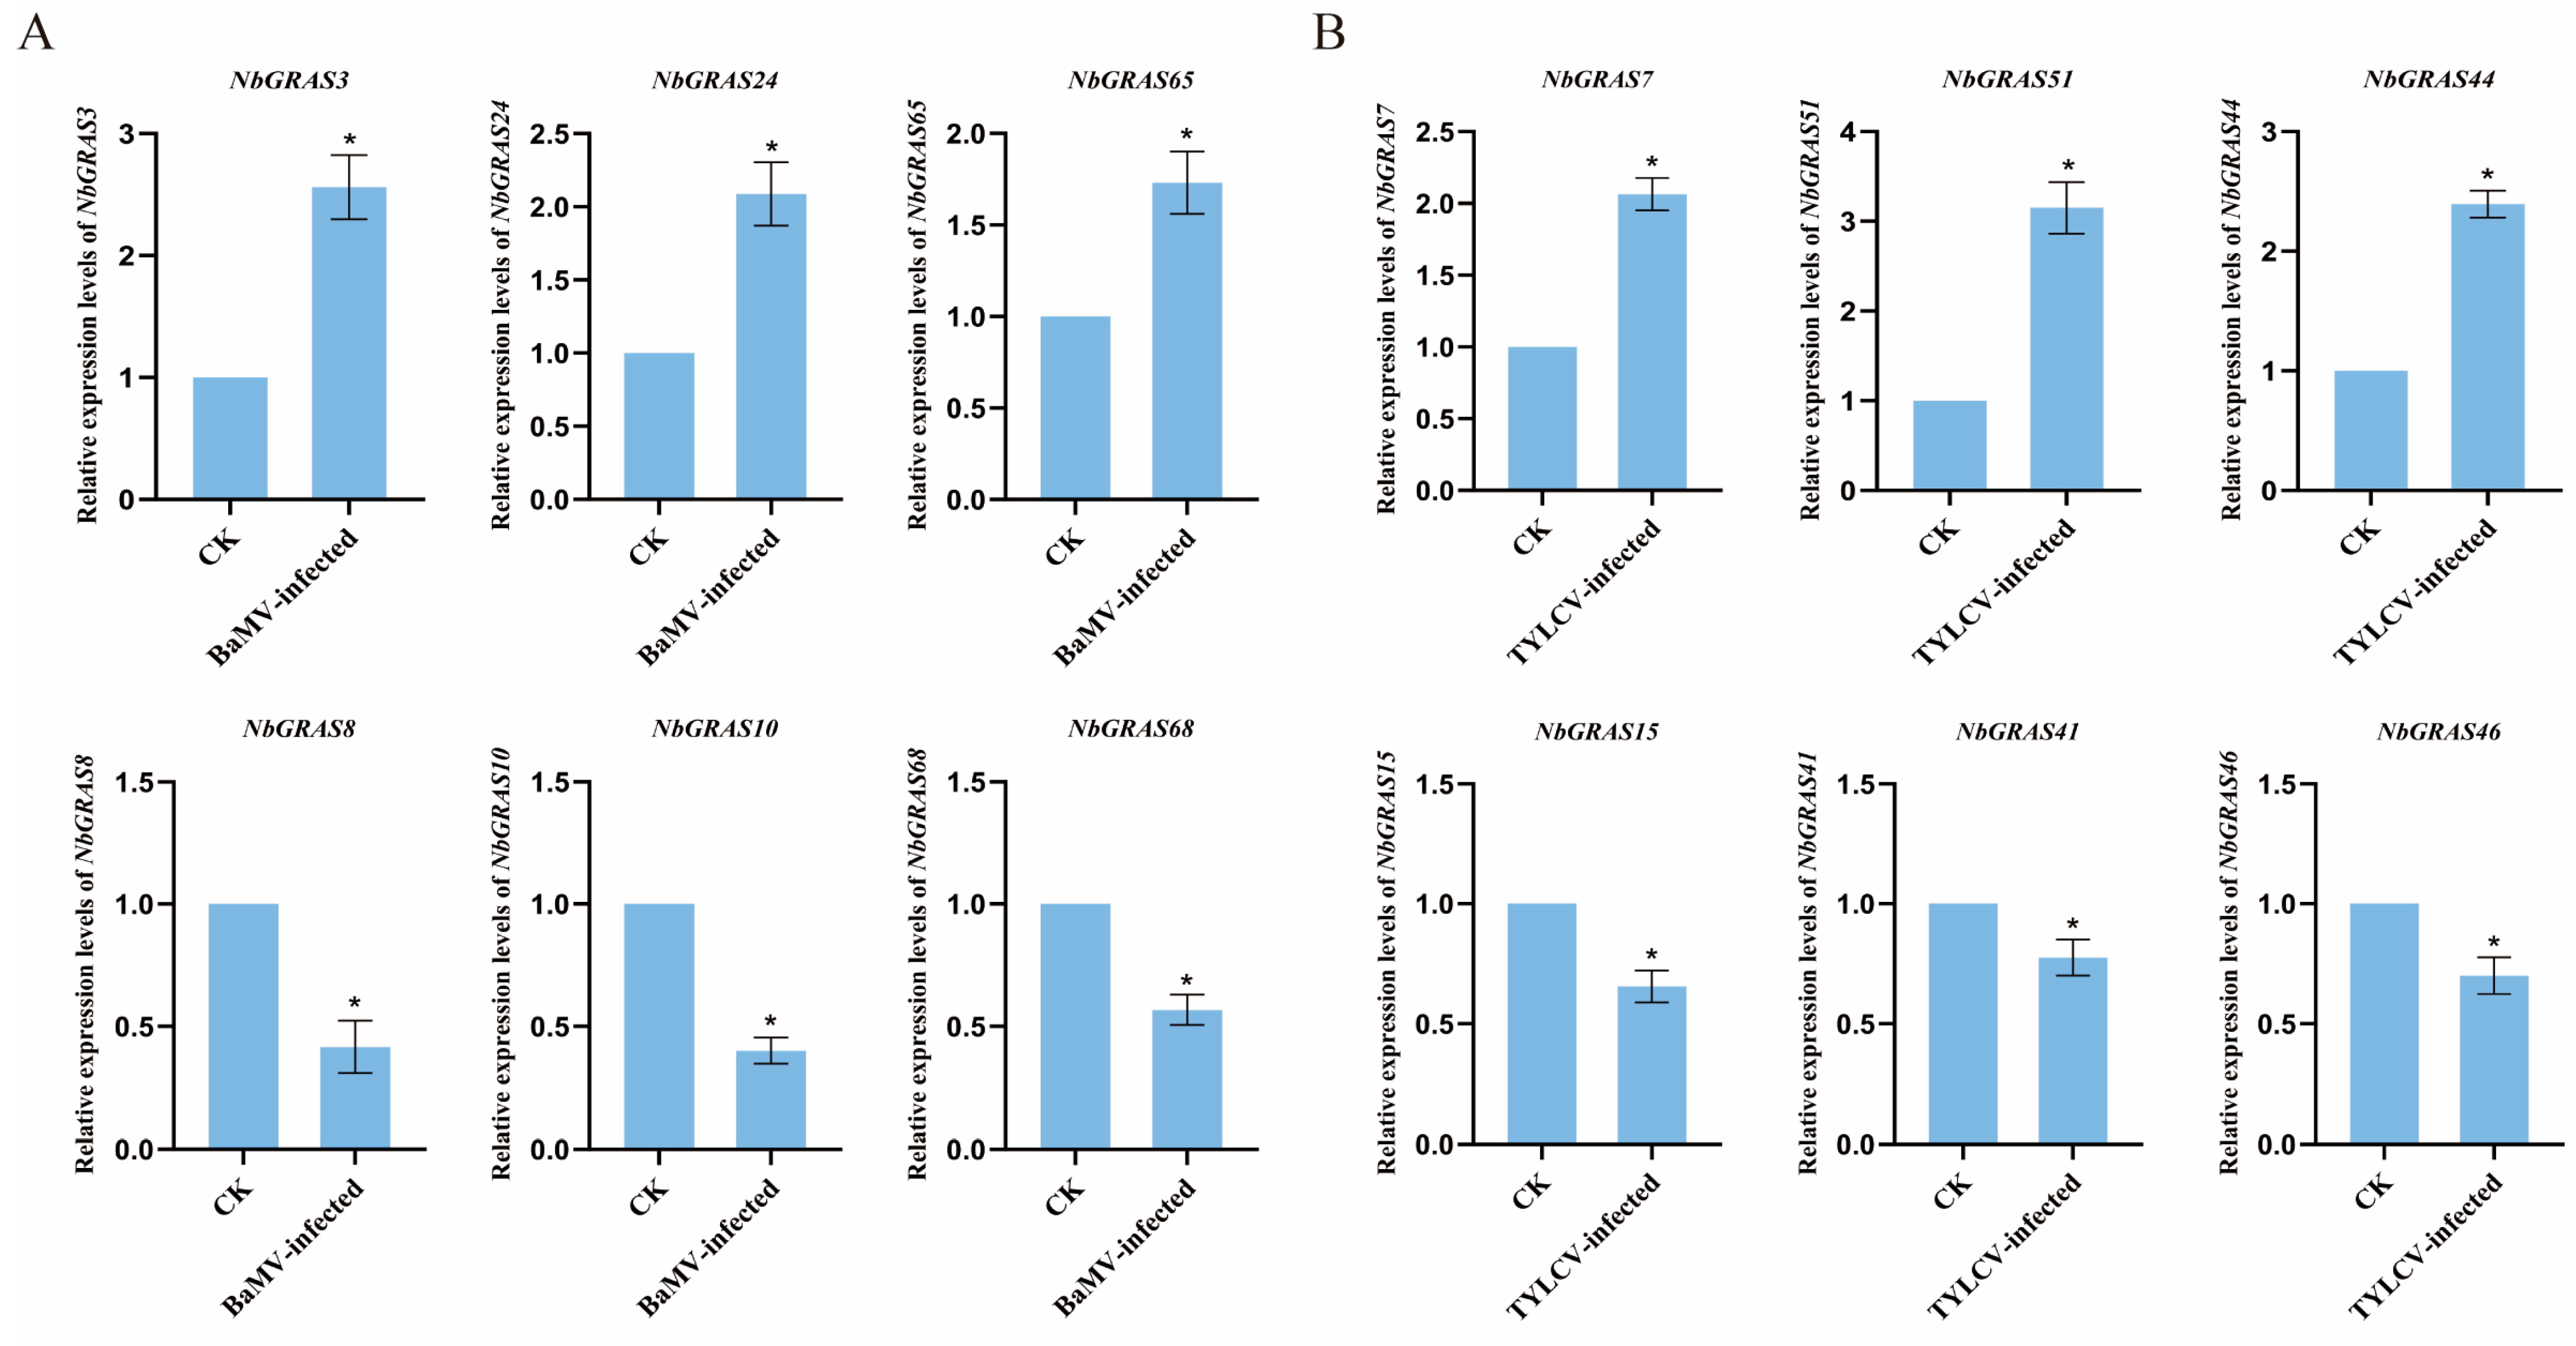
2.8. Expression Analysis of NbGRASs Under Viral Stress

In order to elucidate the potential function of NbGRASs in response to viral infection, this study analyzed the expression patterns of NbGRASs in the leaves of Nicotiana benthamiana after infection with bamboo mosaic virus (BaMV) and tomato yellow leaf curl virus (TYLCV) according to the published literature [42,43].
The members of the NbGRASs gene family showed different expression patterns for different virus infections (Figure 8). Among them, NbGRAS3, NbGRAS24, NbGRAS47 and NbGRAS63 showed significant up-regulation under BaMV infection; however, NbGRAS8, NbGRAS10, NbGRAS31, NbGRAS51 and NbGRAS74 showed significant down-regulation (Figure 8). After inoculation with TYLCV, the expressions of NbGRAS5, NbGRAS7, NbGRAS8, NbGRAS31, NbGRAS43, NbGRAS44, NbGRAS51, NbGRAS68 and NbGRAS80 were significantly up-regulated, while the expressions of NbGRAS15, NbGRAS41 and NbGRAS46 were significantly down-regulated. These results suggest that the GRAS gene in N. benthamiana may play an important role in virus stress response.

2.9. Expression Analysis of NbGRASs Under Viral Stress

After screening multiple NbGRAS genes by real-time quantitative polymerase chain reaction (RT-qPCR) analysis (Figure 9), it was found that the expression levels of NbGRAS3, NbGRAS24 and NbGRAS65 were significantly up-regulated at 15 days post inoculation (dpi) inoculated with bamboo mosaic virus (BaMV), while the expression levels of NbGRAS8, NbGRAS10 and NbGRAS68 were significantly down-regulated (Figure 9A). Fifteen days post inoculation (dpi) inoculated tomato yellow leaf curl virus (TYLCV), the expression levels of NbGRAS7, NbGRAS51 and NbGRAS44 were significantly increased, while the expression levels of NbGRAS15, NbGRAS41 and NbGRAS46 were significantly decreased (Figure 9B). The results showed that different NbGRAS family members showed different expression regulation patterns in response to BaMV and TYLCV infection.

3. Discussion

Functioning as evolutionarily conserved master regulators, GRAS transcription factors not only orchestrate plant growth and development but also mediate light signal perception, hormone signaling transduction, and stress-responsive adaptation to biotic and abiotic stresses. [1,44,45,46]. Significant progress has been made in the GRAS gene family for a series of plants with the rapid development of whole-genome sequencing technology.
Extensive research has demonstrated that the GRAS family is widely present in various plant species, including Oryza sativa [5], Arabidopsis thaliana [5], Zea mays [22], cassava [47], and Chinese cabbage [23]. In this study, we systematically identified the GRAS gene family for the first time based on the new chromosome-level genome in Nicotiana benthamiana [27], uncovering a total of 83 NbGRAS family members. Comparative analysis revealed that the number of GRASs in N. benthamiana was significantly higher than those reported in other plant species, such as Solanum lycopersicum [24], Medicago truncatula [48], and Prunus mume [49]. Notably, these findings were highly consistent with several previous studies [24,49], confirming that the number of GRAS genes was not only correlated with genome size, but also more likely determined by gene duplication events during species evolution. These discoveries provide us with novel insights for further research on the evolutionary mechanisms and functional diversification of the GRAS gene family. Phylogenetic analysis revealed that the all the identified NbGRASs could be classified into eight distinct subfamilies—DELLA, SCL3, SCR, LAS, HAM, LISCL, SHR, and PAT1 (Figure 1)—which was consistent with previously reported evolutionary characteristics of GRAS families in various plant species [23,24,48,49]. Notably, GRAS genes have been found in the Gv6 and OS19 subfamilies in tomato in previous studies, but not in N. benthamiana [24,50]. The phylogenetic tree demonstrated that most NbGRAS clustered within the same evolutionary clades as their orthologs from the model plant Arabidopsis or the economically important crop Solanum lycopersicum (tomato), indicating their closer phylogenetic relationships [5,24,51]. Interestingly, as members of the Solanaceae family, N. benthamiana and tomato GRAS genes exhibited remarkable evolutionary conservation, a phenomenon likely attributable to their close phylogenetic relationship and shared speciation events.
Gene amplification is one of the key factors promoting genome evolution, and it is also an important source of new functional genes [52]. Specifically, as two main ways of gene amplification, fragment and tandem replication are very common in the evolution of organisms. These two replication mechanisms not only enrich the diversity of genes, but also provide a genetic basis for organisms to adapt to environmental changes [53]. Studies have demonstrated that gene duplication events have contributed to the expansion of the GRAS gene family in plants such as rice, tomato, and Arabidopsis [5,24]. Through chromosomal localization analysis, we identified 13 tandemly duplicated NbGRAS gene pairs and 40 segmentally duplicated pairs in N. benthamiana. These findings highlight the pivotal role of both segmental and tandem duplication events in the expansion of NbGRAS genes. Comparative genomic analysis revealed that 75 orthologous gene pairs were observed between tomato and N. benthamiana, significantly exceeding homologous pairs in other species (Figure 4). This divergence likely stems from their shared phylogenetic position within the Solanaceae family. The limited number of orthologous gene pairs between N. benthamiana (dicot) and O. sativa (monocot) likely reflects their deep phylogenetic divergence within angiosperms, consistent with fundamental distinctions in monocot–dicot genome evolution.
Promoter analyses showed that the promoter region of the NbGRASs was tremendous in a large number of cis-acting elements related to growth and hormone response (Figure 5). These findings were of great significance as a number of studies have shown that plant hormones play a central role in regulating growth and development [54,55,56,57]. Specifically, hormones regulate plant growth and development by inducing or inhibiting the expression of related genes, and such a hormone-mediated gene expression regulation mechanism is one of the most in-depth and well-characterized plant response pathways. At present, the understanding of the interaction mechanism between the GRASs and plant hormones is still limited.
Codon usage bias (CUB) is widespread in plant genomes [10]. Codon usage bias (CUB) plays a key role in regulating gene expression and molecular evolution [9]. In this study, a codon usage bias (CUB) analysis was carried out on the GRAS gene family of Nicotiana benthamiana. Core parameters such as codon bias index (CBI), frequency of optimal codons (Fop), effective number of codons (ENC), GC content at the third codon position (GC3s), and overall GC content were calculated and analyzed. Comprehensive analysis based on multi-dimensional CUB indicators showed that the codon usage bias of GRAS genes in dicotyledonous plants (cultivated soybean Glycine max, Arabidopsis thaliana, Nicotiana benthamiana and Solanum lycopersicum) was significantly stronger than that in monocotyledonous plants (Oryza sativa) (Table 1). Further analysis of the relative synonymous codon usage (RSCU) of the GRAS gene family in five species showed that there was a conservative RSCU distribution pattern in both monocots and dicots (Figure 6C). Neutral mapping and Parity Rule 2 analysis revealed that the CUB of the GRAS gene family in monocots was mainly driven by natural selection, while dicots were driven by both mutation pressure and natural selection (Figure 6).
Extensive evidence verified that GRASs play a key role in the gibberellin signaling pathway, while only a few studies showed that a small number of GRAS family members may be involved in the signal transduction process of auxin and brassinosteroids signaling pathway [2,12]. In the plant hormone regulatory network, auxin shows particularly prominent versatility, and its regulatory range covers the entire life cycle from embryo formation to senescence, as well as various organ parts from root apical meristem to stem tip development [58]. The results of transcriptome analysis revealed that the expression levels of NbGRASs in different tissues of N. benthamiana showed significant differences (Figure 7).
The PAT1 subfamily showed the most significant expression level in the GRAS gene family, and its expression level was significantly higher than that of other subfamily members. GRAS genes were mainly expressed in stressed leaves and roots, with generally moderate to high expression levels. A number of studies have revealed that the GRAS gene family has conserved tissue-specific expression characteristics in different plant species. Taking cucumber as an example, Li et al. found that members of the HAM subfamily were mainly enriched in reproductive tissues such as floral organs, while subfamilies such as SCL3, HAM and PAT1 showed higher expression levels in vegetative organs such as leaves [59]. Similarly, the study by Wang and his team on soybean showed that PAT1, HAM, LISCL, SHR and SCL3 subfamilies showed obvious expression preference, especially in root and nodule tissues [60]. These findings collectively indicate that members of the GRAS gene family may be involved in the regulation of the development of different organs of plants through tissue-specific expression patterns. The tissue-specific expression patterns of these NbGRAS genes suggested that they may be involved in multiple key processes regulating plant growth and development [55,58,59].
As an important plant pathogen, plant viruses pose a serious threat to the growth and development of agricultural and forestry economic crops, often causing a significant decline in crop yield and leading to major economic losses [61,62]. Previous studies have shown that the GRAS signaling system plays a key role in plant growth and development regulation and biotic and abiotic stress response [5,23,24,49]. However, it is worth noting that there are relatively few studies on the function of this signaling pathway in plant–virus interaction, and its molecular mechanism has not been elucidated.
Tomato yellow leaf curl virus (TYLCV), a single-stranded circular DNA virus, belongs to the genus Begomovirus (family Geminiviridae). The virus is transmitted permanently through the vector of Bemisia tabaci. After infection, it can cause typical symptoms such as systemic yellowing, leaf curling, and limited growth of plants. It has been listed as a major limiting factor for the development of the global tomato industry [62,63,64]. Bamboo mosaic virus (BaMV) is a single-stranded positive-sense RNA virus with a genome length of about 6.4 kb, encoding five functional polypeptides. It is classified as Alphaflexiviridae [65,66].
Under the conditions of TYLCV and BaMV infection, we conducted a systematic study on the expression levels of the NbGRAS genes. The results showed that the transcription levels of several NbGRAS members (such as NbGRAS3, NbGRAS5, NbGRAS15, NbGRAS31, NbGRAS47, NbGRAS51, NbGRAS65, and NbGRAS80) all underwent significant changes (Figure 8). In summary, the results show that NbGRASs are likely to play a central role in the process of plant resistance to virus invasion and adaptation to stress environment. This important discovery not only provides a new perspective for in-depth analysis of the mechanism of GRAS signaling module in biotic stress response but also will strongly promote the research progress in this field.

4. Materials and Methods

4.1. Identification of the GRAS Family in Nicotiana benthamiana

The GRAS protein sequence files for Arabidopsis thaliana (TAIR10) and Oryza sativa (v7.0) were downloaded from the Phytozome 13 database (https://phytozome-next.jgi.doe.gov/, accessed on 16 October 2024). The Nicotiana benthamiana genome dataset was obtained from the N. benthamiana and tabacum Omics database (http://lifenglab.hzau.edu.cn/Nicomics/, accessed on 16 October 2024) [27]. Reference genomic data for tomatoes were sourced from the MicroTom database (https://eplant.njau.edu.cn/microTomBase/downloads.html, accessed on 16 October 2024) [67]. Additionally, the Hidden Markov Model (HMM) for the GRAS protein domain, identified as PF03514, was obtained from an online database (http://pfam.xfam.org/, accessed on 16 October 2024) [49,68]. The HMMER software (version 3.0; HMMER3, Cambridge, UK) was then employed to perform a scan analysis on the protein dataset of Nicotiana benthamiana. The GRAS gene family members identified were subsequently validated using the SMART protein database and the NCBI-CDD website. Members of the GRAS family that were present in both databases were selected and named.
The online software ExPASy and ProtParam (https://www.expasy.org/, accessed on 16 October 2024) were used to analyze the physicochemical properties of GRAS family members, such as molecular weight (MW), isoelectric point (pI), and amino acid count. We utilized the NCBI batch online CD-Search tool (https://www.ncbi.nlm.nih.gov/Structure/bwrpsb/bwrpsb.cgi, accessed on 16 October 2024) to calculate the number of exons, the number of introns, and the chromosomal distribution in the candidate protein sequences [69,70]. In addition, the subcellular localization of NbGRAS was predicted by the WoLF PSORT online program (https://wolfpsort.hgc.jp/, accessed on 16 October 2024) [71].

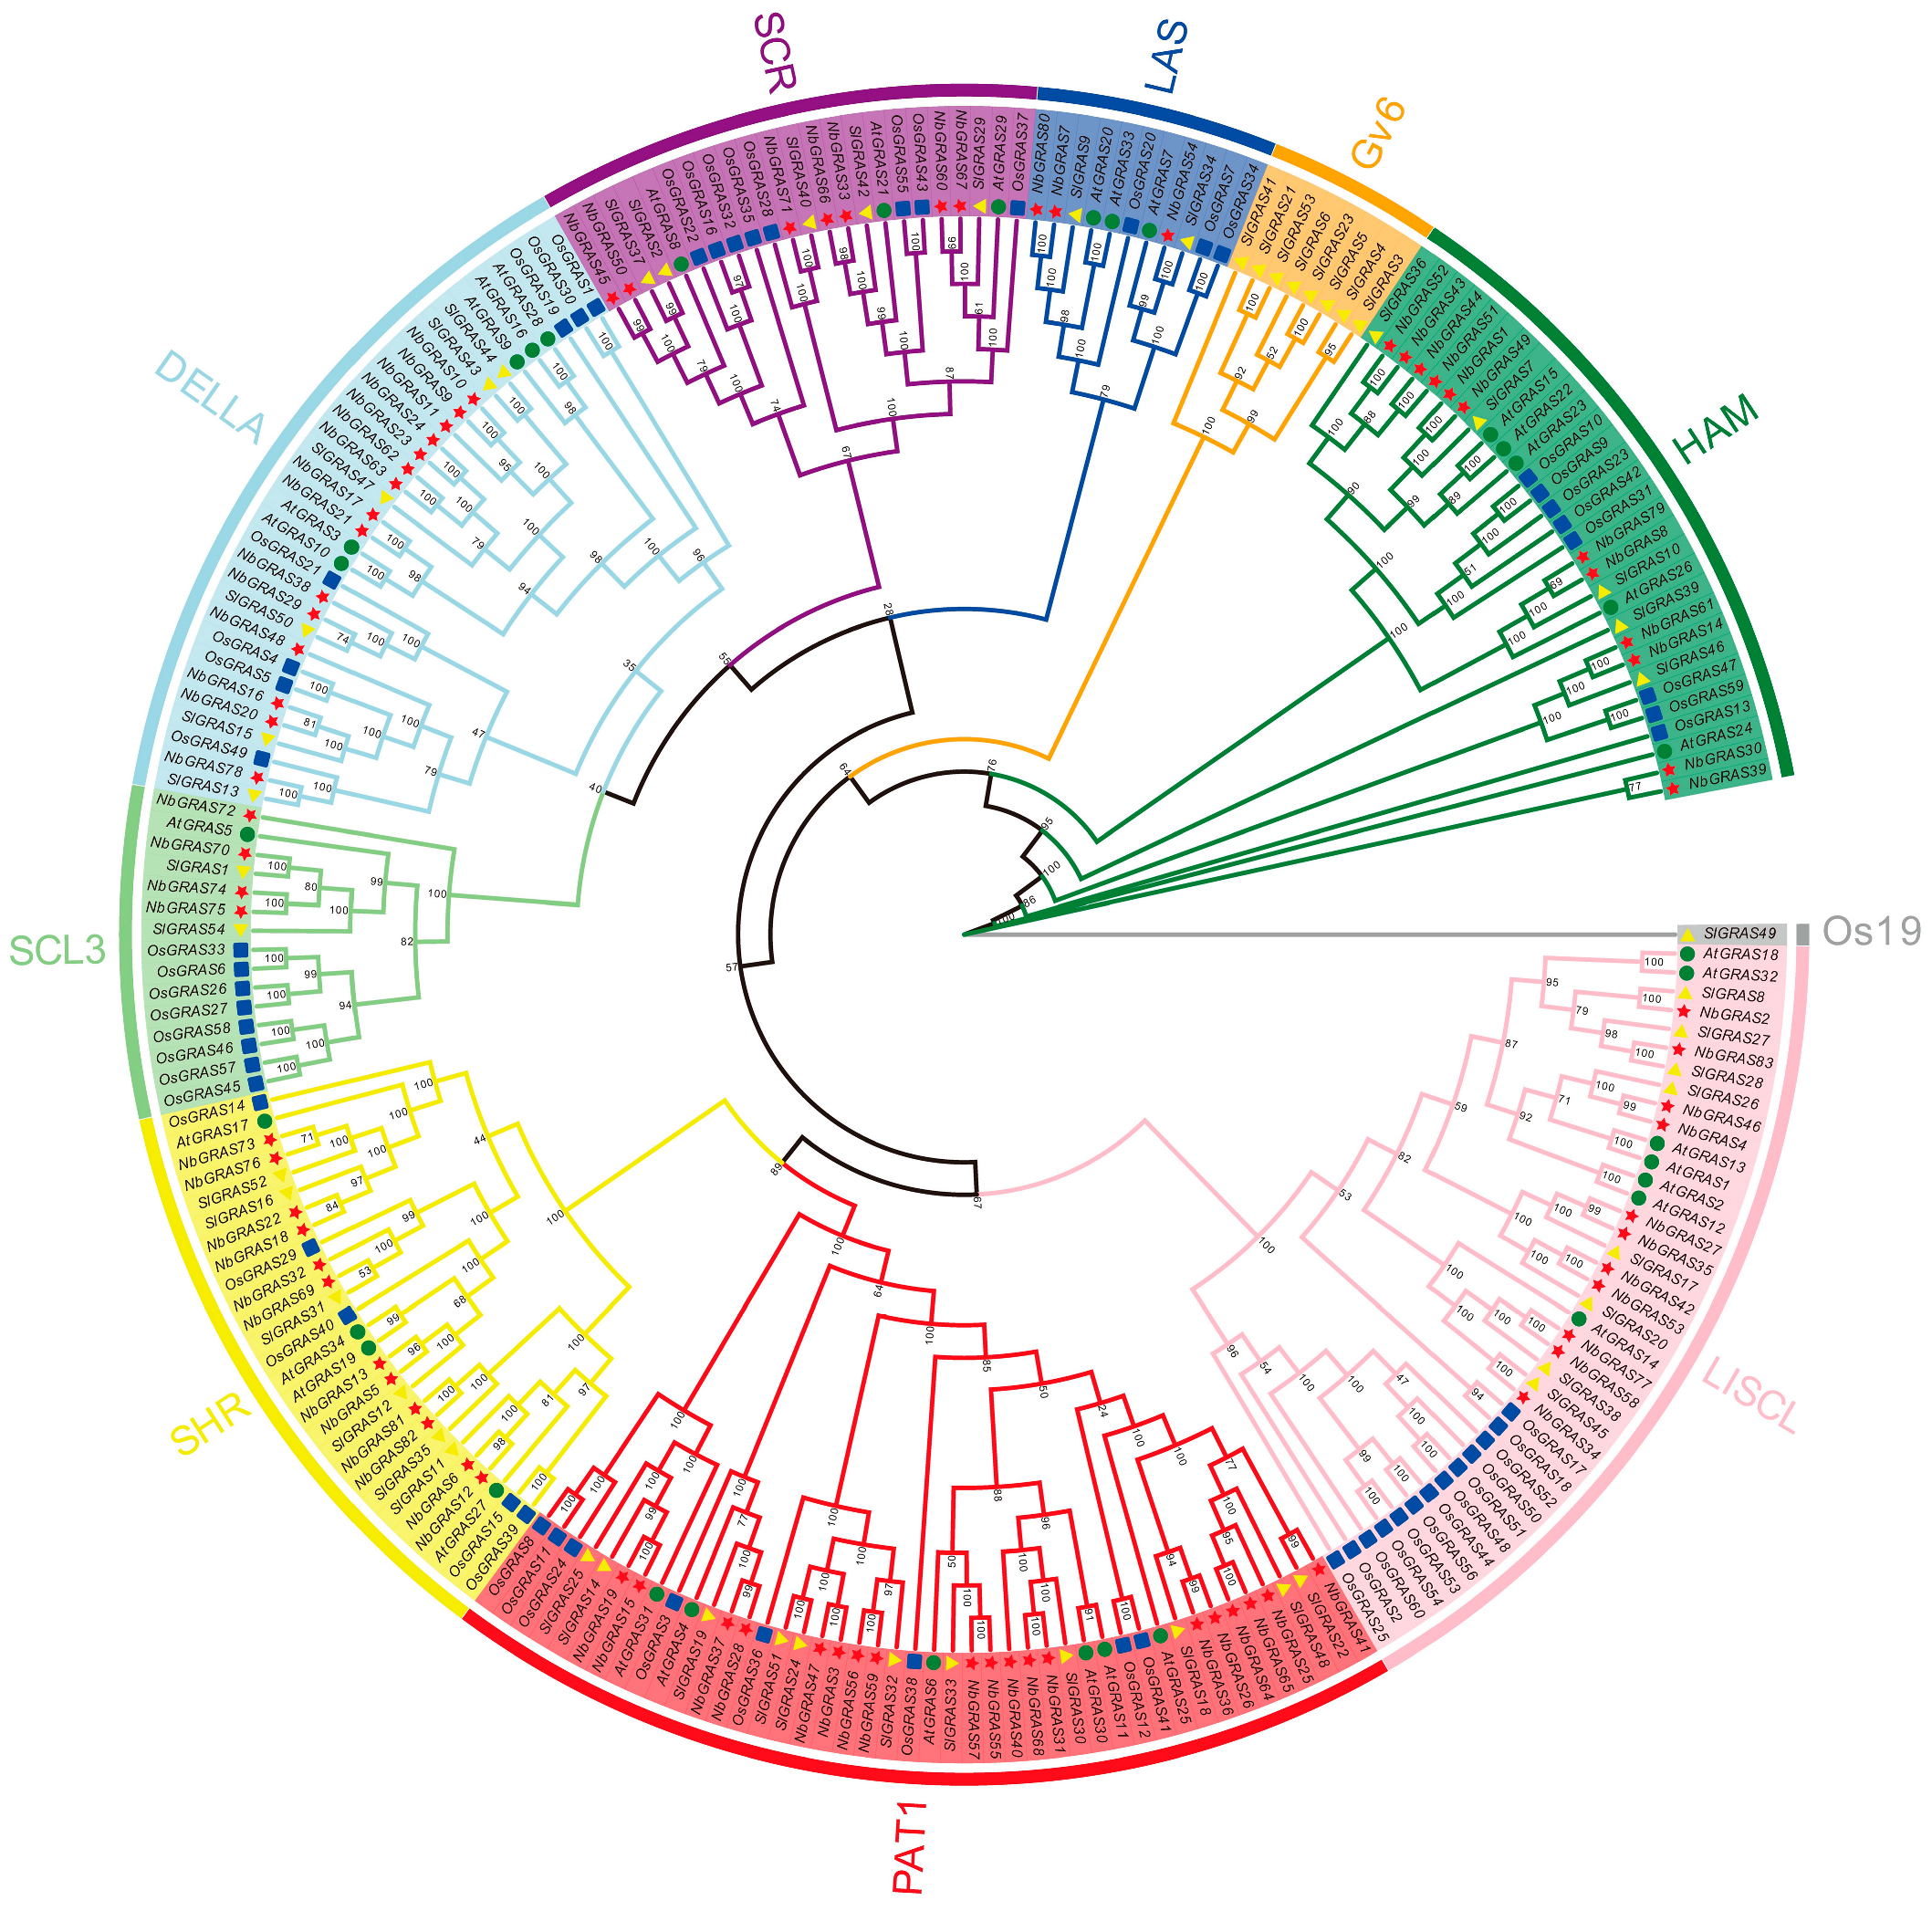
4.2. Phylogenetic Analysis of GRAS Genes

The NbGRAS sequences from Nicotiana benthamiana, Arabidopsis thaliana, Oryza sativa, and tomato were subjected to multiple sequence alignment analysis using the ClustalW software [72]. Subsequently, a maximum likelihood (ML) phylogenetic tree was constructed using the IQ-Tree 2.2.5 program (located in Canberra, Australia) [73]. Finally, the constructed phylogenetic tree was visualized and further refined using the iTOL online platform (https://itol.embl.de, accessed on 16 October 2024).

4.3. Chromosome Location and Collinearity Analysis

We extracted positional information of GRAS genes from the Nicotiana benthamiana and Nicotiana tabacum Omics database (http://lifenglab.hzau.edu.cn/Nicomics/, accessed on 16 October 2024) and utilized the MG2C v2.1 online tool (http://mg2c.iask.in/mg2c_v2.1/, accessed on 16 October 2024) to visualize the chromosomal locations of GRAS genes in N. benthamiana. The synteny of the GRAS gene family in N. benthamiana, A. thaliana, Oryza sativa, and tomato was analyzed using the MCScanX tool, and the analysis results were visualized using the TBtools software [30,69]. The proportion of nonsynonymous substitutions to synonymous substitutions (Ka/Ks) in tandem duplication sequences was ascertained by employing the Ka/Ks calculator in TBtools [74].

4.4. Promoter Element Analysis

To detect potential cis-acting elements in the promoter region, a 2000 base pair (bp) sequence upstream of the transcription initiation site was extracted from the Nicotiana benthamiana genome using TBtools. The PlantCARE web-based tool (https://bioinformatics.psb.ugent.be/webtools/plantcare/html/, accessed on 16 October 2024) was then used to analyze the cis-regulatory elements present in the promoter region of the NbGRAS gene. The collected data were processed using SPSS 21, followed by visualization using TBtools software [69].

4.5. Motif and Gene Structure Analysis

The conserved motifs within the NbGRASs were identified using the MEME sequence analysis tool (https://meme-suite.org/meme/, accessed on 16 October 2024) [75], with the parameter for the maximum number of motifs set to 10, while all other parameters were maintained at their default settings. Subsequently, TBtools software (TBtools, Guangzhou, China) was employed to visualize the results [74]. In addition, the advanced gene structure view function of TBtools was utilized to analyze and display the gene structures of the NbGRAS genes [74].

4.6. RNA-Seq Analysis of Expression Patterns

We obtained a set of public RNA sequencing datasets, specifically SRR6915, SRR685298, SRR696988, SRR696940, SRR697013, SRR696884, SRR696961, SRR696938, and SRR696992 [8]. To quantify the expression levels of NbGRASs under tomato yellow leaf curl virus (TYLCV) or bamboo mosaic virus (BaMV) infection, their gene expression datasets were obtained from several previous reports [42,43]. Sequence alignment was performed using HISAT2 (version 2.1.0) [76], and expression levels were quantified using StringTie2 (version 2.1.5) in the form of FPKM (per million alignment readings per thousand base transcripts) [77]. In addition, in order to visualize the gene expression profiles of various tissues such as terminal buds, fruits, stressed leaves, flowers, leaves, roots, seedlings, stems, and tissue culture, we used TBtools software to generate layout heat maps [69].

4.7. Plant Growth and Viral Stress

In an anti-free radical greenhouse, Nicotiana benthamiana seedlings grew at a constant temperature of 25 °C, with a photoperiod of 16 h of light (2000 lx) and 8 h of darkness. Agrobacterium strains harboring infectious clones of tomato yellow leaf curl virus (TYLCV) and bamboo mosaic virus (BaMV) were transferred onto LB agar plates containing kanamycin and rifampicin, and cultured at 28 °C for two days. Well-grown single colonies were selected and inoculated into liquid LB medium, followed by shaking incubation at 28 °C and 220 rpm for 12–16 h until the optical density (OD600) reached 0.6–1.0.
The bacterial cultures were transferred to EP tubes, centrifuged at 5000 rpm for eight minutes at room temperature, and the supernatants were discarded. The pellets were resuspended in infiltration buffer (1 M MgCl2, 10 mM MES, pH = 5.6, and 100 mM acetosyringone) to an OD600 of 0.05, and incubated in the dark at room temperature for 2–3 h. When the seedlings grew to the five-leaf stage, the Agrobacterium suspensions containing TYLCV and BaMV infectious clones were injected into the abaxial side of vein-free areas on healthy N. benthamiana leaves using a sterile syringe.

4.8. Codon Usage Bias Analysis

CodonW 1.4.2 (Houston, TX, USA) was used to analyze the codon usage bias of GRAS coding sequences in Nicotiana benthamiana, A. thaliana, tomato and Oryza sativa. Through the EMBOSS online tool, the optimal codon frequency, effective number of codons (ENC), GC content and GC3 content were calculated, and the relative synonymous codon usage frequency (RSCU) was analyzed [78].

4.9. RNA Isolation and Real-Time Quantitative Polymerase Chain Reaction (RT-qPCR)

Total RNA was extracted adhering to the manufacturer’s protocol employing TRIzol Reagent (Vazyme, Nanjing, China). Subsequently, single-stranded cDNA was generated through reverse transcription utilizing a First-Strand cDNA Synthesis Kit (Vazyme, Nanjing, China), in strict compliance with the provided specifications. Real-time quantitative PCR (RT-qPCR) was conducted employing an ABI QuantStudio5 Detection System (Applied Biosystems, Foster City, CA, USA) in conjunction with Hieff qPCR SYBR Green Master Mix (YEASEN, Shanghai, China). The experimental design incorporated a minimum of three biological replicates and three technical replicates per condition to ensure robust statistical analysis. The quantification of relative expression levels for the target genes was achieved via the 2−ΔΔC(t) method, as detailed in reference [79]. All experiments were performed in triplicate, with data presented as mean ± standard deviation (SD). Statistical significance of differences was analyzed by Student’s t-test, and p-value < 0.05 was considered statistically significant. In each assay, the actin gene was utilized as the internal control. The primers employed in RT-qPCR are listed in Table S2.

5. Conclusions

In this study, we conducted an in-depth exploration of Nicotiana benthamiana and successfully identified 83 GRAS genes, which were systematically classified into eight subfamilies. Through detailed analysis of gene structure and motifs, it was found that gene members within the same subfamily generally possess conserved motifs, and their gene structures show significant similarity. Based on the results of evolutionary analysis, segmental duplication was confirmed as the main factor driving the expansion of this gene family. In terms of tissue expression patterns, the expression of NbGRASs is highly tissue-specific, with high expression levels in leaves and root tissues. Further investigation into their response mechanisms under biotic stress revealed that after infection with Tomato yellow leaf curl virus and Bamboo mosaic virus, the expression levels of several NbGRASs changed significantly. This fully indicates that members of this gene family are widely involved in the plant’s antiviral response process. These findings not only reveal the potential functions of NbGRASs in plant growth and development but also provide a new perspective and theoretical basis for further elucidating their regulatory mechanisms in the process of stress adaptation.

Supplementary Materials

The following supporting information can be downloaded at: https://www.mdpi.com/article/10.3390/plants14152295/s1, Figure S1: Chromone distribution of identified NbGRAS; Figure S2: Neutrality plot analysis. Neutrality plot analysis of SlGRAS (A), AtGRAS (B), OsGRAS (C) and GmGRAS (D) coding sequences; Figure S3: Multi-sequence alignment of NbGRASs, Table S1: Detailed information of the putative GRASs in Nicotiana benthamiana; Table S2: The primers used in this study.

Author Contributions

K.Y., S.C. and S.Z. performed the research; K.Y., H.C., S.C. and L.H. designed the research; K.Y., S.C. and L.H. analyzed the data; K.Y. and J.C. wrote the manuscript. All authors assisted with the manuscript’s revision. All authors have read and agreed to the published version of the manuscript.

Funding

This work was supported by the “Pioneer” and “Leading Goose” R&D of Zhejiang (2025C01118), the National Natural Science Foundation of China (32302292) and Scientific Research Foundation of Zhejiang Agriculture and Forestry University (grant no. 203402025901).

Data Availability Statement

All data generated or analyzed during this study are included in this published article and its Supplementary Information Files.

Acknowledgments

We are grateful for the aid from Lianfeng Gu, Mingbing Zhou and Yuzheng Mei Labs for viral inoculations.

Conflicts of Interest

The authors declare no conflicts of interest.

Abbreviations

TYLCVtomato yellow leaf curl virus
BaMVbamboo mosaic virus
TFstranscription factors
MWsmolecular weights
PIsisoelectric points
chrchromosome
RSCUrelative synonymous codon usage
ENCeffective number of codons
RT-qPCRreal-time quantitative PCR

References

  1. Wang, B.; Sun, Z.; Liu, Y.; Xu, B.; Li, J.; Chi, M.; Xing, Y.; Yang, B.; Li, J.; Liu, J.; et al. A pervasive phosphorylation cascade modulation of plant transcription factors in response to abiotic stress. Planta 2023, 258, 73. [Google Scholar] [CrossRef] [PubMed]
  2. Peng, J.; Carol, P.; Richards, D.E.; King, K.E.; Cowling, R.J.; Murphy, G.P.; Harberd, N.P. The Arabidopsis GAI gene defines a signaling pathway that negatively regulates gibberellin responses. Genes Dev. 1997, 11, 3194–3205. [Google Scholar] [CrossRef] [PubMed]
  3. Silverstone, A.L.; Ciampaglio, C.N.; Sun, T. The Arabidopsis RGA gene encodes a transcriptional regulator repressing the gibberellin signal transduction pathway. Plant Cell 1998, 10, 155–169. [Google Scholar] [CrossRef] [PubMed]
  4. Cenci, A.; Rouard, M. Evolutionary Analyses of GRAS Transcription Factors in Angiosperms. Front. Plant Sci. 2017, 8, 273. [Google Scholar] [CrossRef] [PubMed]
  5. Tian, C.; Wan, P.; Sun, S.; Li, J.; Chen, M. Genome-wide analysis of the GRAS gene family in rice and Arabidopsis. Plant Mol. Biol. 2004, 54, 519–532. [Google Scholar] [CrossRef] [PubMed]
  6. Bolle, C. The role of GRAS proteins in plant signal transduction and development. Planta 2004, 218, 683–692. [Google Scholar] [CrossRef] [PubMed]
  7. Sun, X.; Xue, B.; Jones, W.T.; Rikkerink, E.; Dunker, A.K.; Uversky, V.N. A functionally required unfoldome from the plant kingdom: Intrinsically disordered N-terminal domains of GRAS proteins are involved in molecular recognition during plant development. Plant Mol. Biol. 2011, 77, 205–223. [Google Scholar] [CrossRef] [PubMed]
  8. Nakasugi, K.; Crowhurst, R.N.; Bally, J.; Wood, C.C.; Hellens, R.P.; Waterhouse, P.M. De novo transcriptome sequence assembly and analysis of RNA silencing genes of Nicotiana benthamiana. PLoS ONE 2013, 8, e59534. [Google Scholar] [CrossRef] [PubMed]
  9. Brule, C.E.; Grayhack, E.J. Synonymous Codons: Choose Wisely for Expression. Trends Genet. 2017, 33, 283–297. [Google Scholar] [CrossRef] [PubMed]
  10. Parvathy, S.T.; Udayasuriyan, V.; Bhadana, V. Codon usage bias. Mol. Biol. Rep. 2022, 49, 539–565. [Google Scholar] [CrossRef] [PubMed]
  11. Zhang, S.; Li, X.; Fan, S.; Zhou, L.; Wang, Y. Overexpression of HcSCL13, a Halostachys caspica GRAS transcription factor, enhances plant growth and salt stress tolerance in transgenic Arabidopsis. Plant Physiol. Biochem. PPB 2020, 151, 243–254. [Google Scholar] [CrossRef] [PubMed]
  12. Hou, X.; Lee, L.Y.; Xia, K.; Yan, Y.; Yu, H. DELLAs modulate jasmonate signaling via competitive binding to JAZs. Dev. Cell 2010, 19, 884–894. [Google Scholar] [CrossRef] [PubMed]
  13. Yuan, Y.; Fang, L.; Karungo, S.K.; Zhang, L.; Gao, Y.; Li, S.; Xin, H. Overexpression of VaPAT1, a GRAS transcription factor from Vitis amurensis, confers abiotic stress tolerance in Arabidopsis. Plant Cell Rep. 2016, 35, 655–666. [Google Scholar] [CrossRef] [PubMed]
  14. Stuurman, J.; Jäggi, F.; Kuhlemeier, C. Shoot meristem maintenance is controlled by a GRAS-gene mediated signal from differentiating cells. Genes Dev. 2002, 16, 2213–2218. [Google Scholar] [CrossRef] [PubMed]
  15. Morohashi, K.; Minami, M.; Takase, H.; Hotta, Y.; Hiratsuka, K. Isolation and characterization of a novel GRAS gene that regulates meiosis-associated gene expression. J. Biol. Chem. 2003, 278, 20865–20873. [Google Scholar] [CrossRef] [PubMed]
  16. Xu, K.; Chen, S.; Li, T.; Ma, X.; Liang, X.; Ding, X.; Liu, H.; Luo, L. OsGRAS23, a rice GRAS transcription factor gene, is involved in drought stress response through regulating expression of stress-responsive genes. BMC Plant Biol. 2015, 15, 141. [Google Scholar] [CrossRef] [PubMed]
  17. Cody, J.P.; Maher, M.F.; Nasti, R.A.; Starker, C.G.; Chamness, J.C.; Voytas, D.F. Direct delivery and fast-treated Agrobacterium co-culture (Fast-TrACC) plant transformation methods for Nicotiana benthamiana. Nat. Protoc. 2023, 18, 81–107. [Google Scholar] [CrossRef] [PubMed]
  18. Jiang, W.; Sivakrishna Rao, G.; Aman, R.; Butt, H.; Kamel, R.; Sedeek, K.; Mahfouz, M.M. High-efficiency retron-mediated single-stranded DNA production in plants. Synth. Biol. 2022, 7, ysac025. [Google Scholar] [CrossRef] [PubMed]
  19. Kwan, B.D.; Seligmann, B.; Nguyen, T.D.; Franke, J.; Dang, T.T. Leveraging synthetic biology and metabolic engineering to overcome obstacles in plant pathway elucidation. Curr. Opin. Plant Biol. 2023, 71, 102330. [Google Scholar] [CrossRef] [PubMed]
  20. Gülck, T.; Booth, J.K.; Carvalho, Â.; Khakimov, B.; Crocoll, C.; Motawia, M.S.; Møller, B.L.; Bohlmann, J.; Gallage, N.J. Synthetic Biology of Cannabinoids and Cannabinoid Glucosides in Nicotiana benthamiana and Saccharomyces cerevisiae. J. Nat. Prod. 2020, 83, 2877–2893. [Google Scholar] [CrossRef] [PubMed]
  21. Torres-Galea, P.; Hirtreiter, B.; Bolle, C. Two GRAS proteins, SCARECROW-LIKE21 and PHYTOCHROME A SIGNAL TRANSDUCTION1, function cooperatively in phytochrome A signal transduction. Plant Physiol. 2013, 161, 291–304. [Google Scholar] [CrossRef] [PubMed]
  22. Guo, Y.; Wu, H.; Li, X.; Li, Q.; Zhao, X.; Duan, X.; An, Y.; Lv, W.; An, H. Identification and expression of GRAS family genes in maize (Zea mays L.). PLoS ONE 2017, 12, e0185418. [Google Scholar] [CrossRef] [PubMed]
  23. Song, X.M.; Liu, T.K.; Duan, W.K.; Ma, Q.H.; Ren, J.; Wang, Z.; Li, Y.; Hou, X.L. Genome-wide analysis of the GRAS gene family in Chinese cabbage (Brassica rapa ssp. pekinensis). Genomics 2014, 103, 135–146. [Google Scholar] [CrossRef] [PubMed]
  24. Huang, W.; Xian, Z.; Kang, X.; Tang, N.; Li, Z. Genome-wide identification, phylogeny and expression analysis of GRAS gene family in tomato. BMC Plant Biol. 2015, 15, 209. [Google Scholar] [CrossRef] [PubMed]
  25. Xu, W.; Chen, Z.; Ahmed, N.; Han, B.; Cui, Q.; Liu, A. Genome-Wide Identification, Evolutionary Analysis, and Stress Responses of the GRAS Gene Family in Castor Beans. Int. J. Mol. Sci. 2016, 17, 1004. [Google Scholar] [CrossRef] [PubMed]
  26. Chen, W.; Yan, M.; Chen, S.; Sun, J.; Wang, J.; Meng, D.; Li, J.; Zhang, L.; Guo, L. The complete genome assembly of Nicotiana benthamiana reveals the genetic and epigenetic landscape of centromeres. Nat. Plants 2024, 10, 1928–1943. [Google Scholar] [CrossRef] [PubMed]
  27. Wang, J.; Zhang, Q.; Tung, J.; Zhang, X.; Liu, D.; Deng, Y.; Tian, Z.; Chen, H.; Wang, T.; Yin, W.; et al. High-quality assembled and annotated genomes of Nicotiana tabacum and Nicotiana benthamiana reveal chromosome evolution and changes in defense arsenals. Mol. Plant 2024, 17, 423–437. [Google Scholar] [CrossRef] [PubMed]
  28. Liu, Y.; Wang, W. Characterization of the GRAS gene family reveals their contribution to the high adaptability of wheat. PeerJ 2021, 9, e10811. [Google Scholar] [CrossRef] [PubMed]
  29. Fan, Y.; Wan, X.; Zhang, X.; Zhang, J.; Zheng, C.; Yang, Q.; Yang, L.; Li, X.; Feng, L.; Zou, L.; et al. GRAS gene family in rye (Secale cereale L.): Genome-wide identification, phylogeny, evolutionary expansion and expression analyses. BMC Plant Biol. 2024, 24, 46. [Google Scholar] [CrossRef] [PubMed]
  30. Wang, Y.; Tang, H.; Debarry, J.D.; Tan, X.; Li, J.; Wang, X.; Lee, T.H.; Jin, H.; Marler, B.; Guo, H.; et al. MCScanX: A toolkit for detection and evolutionary analysis of gene synteny and collinearity. Nucleic Acids Res. 2012, 40, e49. [Google Scholar] [CrossRef] [PubMed]
  31. Biłas, R.; Szafran, K.; Hnatuszko-Konka, K.; Kononowicz, A.K. Cis-regulatory elements used to control gene expression in plants. Plant Cell Tissue Organ Cult. (PCTOC) 2016, 127, 269–287. [Google Scholar] [CrossRef]
  32. Hernandez-Garcia, C.M.; Finer, J.J. Identification and validation of promoters and cis-acting regulatory elements. Plant Sci. Int. J. Exp. Plant Biol. 2014, 217–218, 109–119. [Google Scholar] [CrossRef] [PubMed]
  33. Chow, C.N.; Chiang-Hsieh, Y.F.; Chien, C.H.; Zheng, H.Q.; Lee, T.Y.; Wu, N.Y.; Tseng, K.C.; Hou, P.F.; Chang, W.C. Delineation of condition specific Cis- and Trans-acting elements in plant promoters under various Endo- and exogenous stimuli. BMC Genom. 2018, 19 (Suppl. S2), 85. [Google Scholar] [CrossRef] [PubMed]
  34. He, F.; Arce, A.L.; Schmitz, G.; Koornneef, M.; Novikova, P.; Beyer, A.; de Meaux, J. The Footprint of Polygenic Adaptation on Stress-Responsive Cis-Regulatory Divergence in the Arabidopsis Genus. Mol. Biol. Evol. 2016, 33, 2088–2101. [Google Scholar] [CrossRef] [PubMed]
  35. Felipez, W.; de Freitas, K.E.J.; Dos Santos, R.S.; Yamamoto, R.R.; Costa de Oliveira, A. The roles of WRKY transcription factors in Malus spp. and Pyrus spp. Funct. Integr. Genom. 2022, 22, 713–729. [Google Scholar] [CrossRef] [PubMed]
  36. Lescot, M.; Déhais, P.; Thijs, G.; Marchal, K.; Moreau, Y.; Van de Peer, Y.; Rouzé, P.; Rombauts, S. PlantCARE, a database of plant cis-acting regulatory elements and a portal to tools for in silico analysis of promoter sequences. Nucleic Acids Res. 2002, 30, 325–327. [Google Scholar] [CrossRef] [PubMed]
  37. Cui, Y.; Cao, Q.; Li, Y.; He, M.; Liu, X. Advances in cis-element- and natural variation-mediated transcriptional regulation and applications in gene editing of major crops. J. Exp. Bot. 2023, 74, 5441–5457. [Google Scholar] [CrossRef] [PubMed]
  38. Marand, A.P.; Eveland, A.L.; Kaufmann, K.; Springer, N.M. cis-Regulatory Elements in Plant Development, Adaptation, and Evolution. Annu. Rev. Plant Biol. 2023, 74, 111–137. [Google Scholar] [CrossRef] [PubMed]
  39. Behura, S.K.; Severson, D.W. Comparative analysis of codon usage bias and codon context patterns between dipteran and hymenopteran sequenced genomes. PLoS ONE 2012, 7, e43111. [Google Scholar] [CrossRef] [PubMed]
  40. Plotkin, J.B.; Kudla, G. Synonymous but not the same: The causes and consequences of codon bias. Nat. Rev. Genet. 2011, 12, 32–42. [Google Scholar] [CrossRef] [PubMed]
  41. Li, G.; Pan, Z.; Gao, S.; He, Y.; Xia, Q.; Jin, Y.; Yao, H. Analysis of synonymous codon usage of chloroplast genome in Porphyra umbilicalis. Genes Genom. 2019, 41, 1173–1181. [Google Scholar] [CrossRef] [PubMed]
  42. Wang, J.D.; Hsu, Y.H.; Lee, Y.S.; Lin, N.S. Importin α2 participates in RNA interference against bamboo mosaic virus accumulation in Nicotiana benthamiana via NbAGO10a-mediated small RNA clearance. Mol. Plant Pathol. 2024, 25, e13422. [Google Scholar] [CrossRef] [PubMed]
  43. Wu, M.; Ding, X.; Fu, X.; Lozano-Duran, R. Transcriptional reprogramming caused by the geminivirus Tomato yellow leaf curl virus in local or systemic infections in Nicotiana benthamiana. BMC Genom. 2019, 20, 542. [Google Scholar] [CrossRef] [PubMed]
  44. Ishikawa, M.; Fujiwara, A.; Kosetsu, K.; Horiuchi, Y.; Kamamoto, N.; Umakawa, N.; Tamada, Y.; Zhang, L.; Matsushita, K.; Palfalvi, G.; et al. GRAS transcription factors regulate cell division planes in moss overriding the default rule. Proc. Natl. Acad. Sci. USA 2023, 120, e2210632120. [Google Scholar] [CrossRef] [PubMed]
  45. Achard, P.; Gong, F.; Cheminant, S.; Alioua, M.; Hedden, P.; Genschik, P. The cold-inducible CBF1 factor-dependent signaling pathway modulates the accumulation of the growth-repressing DELLA proteins via its effect on gibberellin metabolism. Plant Cell 2008, 20, 2117–2129. [Google Scholar] [CrossRef] [PubMed]
  46. Ali, S.; Baloch, A.M. Overview of Sustainable Plant Growth and Differentiation and the Role of Hormones in Controlling Growth and Development of Plants Under Various Stresses. Recent Pat. Food Nutr. Agric. 2020, 11, 105–114. [Google Scholar] [CrossRef] [PubMed]
  47. Shan, Z.; Luo, X.; Wu, M.; Wei, L.; Fan, Z.; Zhu, Y. Genome-wide identification and expression of GRAS gene family members in cassava. BMC Plant Biol. 2020, 20, 46. [Google Scholar] [CrossRef] [PubMed]
  48. Zhang, H.; Cao, Y.; Shang, C.; Li, J.; Wang, J.; Wu, Z.; Ma, L.; Qi, T.; Fu, C.; Bai, Z.; et al. Genome-wide characterization of GRAS family genes in Medicago truncatula reveals their evolutionary dynamics and functional diversification. PLoS ONE 2017, 12, e0185439. [Google Scholar] [CrossRef] [PubMed]
  49. Lu, J.; Wang, T.; Xu, Z.; Sun, L.; Zhang, Q. Genome-wide analysis of the GRAS gene family in Prunus mume. Mol. Genet. Genom. 2015, 290, 303–317. [Google Scholar] [CrossRef] [PubMed]
  50. Niu, Y.; Zhao, T.; Xu, X.; Li, J. Genome-wide identification and characterization of GRAS transcription factors in tomato (Solanum lycopersicum). PeerJ 2017, 5, e3955. [Google Scholar] [CrossRef] [PubMed]
  51. Lee, M.H.; Kim, B.; Song, S.K.; Heo, J.O.; Yu, N.I.; Lee, S.A.; Kim, M.; Kim, D.G.; Sohn, S.O.; Lim, C.E.; et al. Large-scale analysis of the GRAS gene family in Arabidopsis thaliana. Plant Mol. Biol. 2008, 67, 659–670. [Google Scholar] [CrossRef] [PubMed]
  52. Dassanayake, M.; Oh, D.H.; Haas, J.S.; Hernandez, A.; Hong, H.; Ali, S.; Yun, D.J.; Bressan, R.A.; Zhu, J.K.; Bohnert, H.J.; et al. The genome of the extremophile crucifer Thellungiella parvula. Nat. Genet. 2011, 43, 913–918. [Google Scholar] [CrossRef] [PubMed]
  53. Magadum, S.; Banerjee, U.; Murugan, P.; Gangapur, D.; Ravikesavan, R. Gene duplication as a major force in evolution. J. Genet. 2013, 92, 155–161. [Google Scholar] [CrossRef] [PubMed]
  54. Waseem, M.; Nkurikiyimfura, O.; Niyitanga, S.; Jakada, B.H.; Shaheen, I.; Aslam, M.M. GRAS transcription factors emerging regulator in plants growth, development, and multiple stresses. Mol. Biol. Rep. 2022, 49, 9673–9685. [Google Scholar] [CrossRef] [PubMed]
  55. Mazzoni-Putman, S.M.; Brumos, J.; Zhao, C.; Alonso, J.M.; Stepanova, A.N. Auxin Interactions with Other Hormones in Plant Development. Cold Spring Harb. Perspect. Biol. 2021, 13, a039990. [Google Scholar] [CrossRef] [PubMed]
  56. Kieber, J.J.; Schaller, G.E. Cytokinin signaling in plant development. Development 2018, 145, dev149344. [Google Scholar] [CrossRef] [PubMed]
  57. Jodder, J. miRNA-mediated regulation of auxin signaling pathway during plant development and stress responses. J. Biosci. 2020, 45, 91. [Google Scholar] [CrossRef]
  58. Woodward, A.W.; Bartel, B. Auxin: Regulation, action, and interaction. Ann. Bot. 2005, 95, 707–735. [Google Scholar] [CrossRef] [PubMed]
  59. Lu, X.; Liu, W.; Xiang, C.; Li, X.; Wang, Q.; Wang, T.; Liu, Z.; Zhang, J.; Gao, L.; Zhang, W. Genome-Wide Characterization of GRAS Family and Their Potential Roles in Cold Tolerance of Cucumber (Cucumis sativus L.). Int. J. Mol. Sci. 2020, 21, 3857. [Google Scholar] [CrossRef] [PubMed]
  60. Wang, T.T.; Yu, T.F.; Fu, J.D.; Su, H.G.; Chen, J.; Zhou, Y.B.; Chen, M.; Guo, J.; Ma, Y.Z.; Wei, W.L.; et al. Genome-Wide Analysis of the GRAS Gene Family and Functional Identification of GmGRAS37 in Drought and Salt Tolerance. Front. Plant Sci. 2020, 11, 604690. [Google Scholar] [CrossRef] [PubMed]
  61. Wu, J.; Zhang, Y.; Li, F.; Zhang, X.; Ye, J.; Wei, T.; Li, Z.; Tao, X.; Cui, F.; Wang, X.; et al. Plant virology in the 21st century in China: Recent advances and future directions. J. Integr. Plant Biol. 2024, 66, 579–622. [Google Scholar] [CrossRef] [PubMed]
  62. Cai, L.; Mei, Y.; Ye, R.; Deng, Y.; Zhang, X.; Hu, Z.; Zhou, X.; Zhang, M.; Yang, J. Tomato leaf curl New Delhi virus: An emerging plant begomovirus threatening cucurbit production. aBIOTECH 2023, 4, 257–266. [Google Scholar] [CrossRef] [PubMed]
  63. Cao, X.; Huang, M.; Wang, S.; Li, T.; Huang, Y. Tomato yellow leaf curl virus: Characteristics, influence, and regulation mechanism. Plant Physiol. Biochem. PPB 2024, 213, 108812. [Google Scholar] [CrossRef] [PubMed]
  64. Prasad, A.; Sharma, N.; Hari-Gowthem, G.; Muthamilarasan, M.; Prasad, M. Tomato Yellow Leaf Curl Virus: Impact, Challenges, and Management. Trends Plant Sci. 2020, 25, 897–911. [Google Scholar] [CrossRef] [PubMed]
  65. Meng, M.; Lee, C.C. Function and Structural Organization of the Replication Protein of Bamboo mosaic virus. Front. Microbiol. 2017, 8, 522. [Google Scholar] [CrossRef] [PubMed]
  66. Huang, Y.P.; Chen, I.H.; Tsai, C.H. Host Factors in the Infection Cycle of Bamboo mosaic virus. Front. Microbiol. 2017, 8, 437. [Google Scholar] [CrossRef] [PubMed]
  67. Xue, J.Y.; Fan, H.Y.; Zeng, Z.; Zhou, Y.H.; Hu, S.Y.; Li, S.X.; Cheng, Y.J.; Meng, X.R.; Chen, F.; Shao, Z.Q.; et al. Comprehensive regulatory networks for tomato organ development based on the genome and RNAome of MicroTom tomato. Hortic. Res. 2023, 10, uhad147. [Google Scholar] [CrossRef] [PubMed]
  68. El-Gebali, S.; Mistry, J.; Bateman, A.; Eddy, S.R.; Luciani, A.; Potter, S.C.; Qureshi, M.; Richardson, L.J.; Salazar, G.A.; Smart, A.; et al. The Pfam protein families database in 2019. Nucleic Acids Res. 2019, 47, D427–D432. [Google Scholar] [CrossRef] [PubMed]
  69. Chen, C.; Chen, H.; Zhang, Y.; Thomas, H.R.; Frank, M.H.; He, Y.; Xia, R. TBtools: An Integrative Toolkit Developed for Interactive Analyses of Big Biological Data. Mol. Plant 2020, 13, 1194–1202. [Google Scholar] [CrossRef] [PubMed]
  70. Duvaud, S.; Gabella, C.; Lisacek, F.; Stockinger, H.; Ioannidis, V.; Durinx, C. Expasy, the Swiss Bioinformatics Resource Portal, as designed by its users. Nucleic Acids Res. 2021, 49, W216–W227. [Google Scholar] [CrossRef] [PubMed]
  71. Horton, P.; Park, K.J.; Obayashi, T.; Fujita, N.; Harada, H.; Adams-Collier, C.J.; Nakai, K. WoLF PSORT: Protein localization predictor. Nucleic Acids Res. 2007, 35, W585–W587. [Google Scholar] [CrossRef] [PubMed]
  72. Edgar, R.C. Muscle: Multiple Sequence Alignment with High Accuracy and High Throughput. Nucleic Acids Res. 2004, 32, 1792–1797. [Google Scholar] [CrossRef] [PubMed]
  73. Nguyen, L.T.; Schmidt, H.A.; von Haeseler, A.; Minh, B.Q. IQ-TREE: A fast and effective stochastic algorithm for estimating maximum-likelihood phylogenies. Mol. Biol. Evol. 2015, 32, 268–274. [Google Scholar] [CrossRef] [PubMed]
  74. Chen, C.; Wu, Y.; Li, J.; Wang, X.; Zeng, Z.; Xu, J.; Liu, Y.; Feng, J.; Chen, H.; He, Y.; et al. TBtools-II: A “one for all, all for one” bioinformatics platform for biological big-data mining. Mol. Plant 2023, 16, 1733–1742. [Google Scholar] [CrossRef] [PubMed]
  75. Bailey, T.L.; Boden, M.; Buske, F.A.; Frith, M.; Grant, C.E.; Clementi, L.; Ren, J.; Li, W.W.; Noble, W.S. MEME SUITE: Tools for motif discovery and searching. Nucleic Acids Res. 2009, 37, W202–W208. [Google Scholar] [CrossRef] [PubMed]
  76. Kim, D.; Paggi, J.M.; Park, C.; Bennett, C.; Salzberg, S.L. Graph-based genome alignment and genotyping with HISAT2 and HISAT-genotype. Nat. Biotechnol. 2019, 37, 907–915. [Google Scholar] [CrossRef] [PubMed]
  77. Pertea, M.; Pertea, G.M.; Antonescu, C.M.; Chang, T.C.; Mendell, J.T.; Salzberg, S.L. StringTie enables improved reconstruction of a transcriptome from RNA-seq reads. Nat. Biotechnol. 2015, 33, 290–295. [Google Scholar] [CrossRef] [PubMed]
  78. Itaya, H.; Oshita, K.; Arakawa, K.; Tomita, M. GEMBASSY: An EMBOSS associated software package for comprehensive genome analyses. Source Code Biol. Med. 2013, 8, 17. [Google Scholar] [CrossRef] [PubMed]
  79. Livak, K.J.; Schmittgen, T.D. Analysis of relative gene expression data using real-time quantitative PCR and the 2(-Delta Delta C(T)) Method. Methods 2001, 25, 402–408. [Google Scholar] [CrossRef] [PubMed]
Figure 1. The maximum likelihood (ML) phylogenetic tree based on the GRAS amino acid sequences in Arabidopsis thaliana, Nicotiana benthamiana, Oryza sativa, and Solanum lycopersicum with IQ-TREE 2.2.5 software (IQ-TREE 2.2.5, Canberra, Australia). Green circles represent AtGRAS, red pentagrams represent NbGRAS, blue squares represent OsGRAS, and yellow triangles represent SlGRAS.
Plants 14 02295 g001
Figure 2. Phylogenetic relationships, motif composition, and gene structures of NbGRASs. (A) Maximum likelihood phylogenetic tree of NbGRAS gene family members. (B) Distribution of conserved motifs (numbered 1–10) among NbGRAS, with distinct colors representing different motifs. (C) Exon-intron organization of NbGRAS genes. Green boxes indicate coding sequences (CDS), while yellow boxes denote untranslated regions (UTRs).
Plants 14 02295 g002
Figure 3. Chromosome location and gene duplication analysis of NbGRAS genes. Slight gray lines indicate all synteny blocks within Nicotiana benthamiana genome. The duplicated gene pairs are highlighted with colored lines. In the inner circle, the heat map represents chromosomal gene density; in the middle circle, it shows chromosomal GC skew; and in the outer circle, it displays chromosomal GC content.
Plants 14 02295 g003
Figure 4. Synteny analysis of GRAS genes between Nicotiana benthamiana and three other species including Arabidopsis thaliana (A), Solanum lycopersicum (B), and Oryza sativa (C).
Plants 14 02295 g004
Figure 5. Cis-acting regulatory elements analysis of NbGRASs. (A) Phylogenetic tree of NbGRASs. (B) Summary view of cis-acting regulatory elements of NbGRASs. (C) The numbers of cis-acting regulatory elements of NbGRASs.
Plants 14 02295 g005
Figure 6. Analysis of codon usage bias: (A) Neutral mapping analysis was performed on all identified NbGRAS gene CDS sequences. (B) Parity rule 2 (PR2) analysis was performed on the CDS sequences of NbGRAS genes in five species: A. thaliana, N. benthamiana, O. sativa, S. lycopersicum, and G. max. (C) The relative synonymous codon usage (RSCU) heat map of five species (A. thaliana, N. benthamiana, O. sativa, S. lycopersicum, and G. max); blue to red indicates that the RSCU value of the codon is from low to high.
Plants 14 02295 g006
Figure 7. Heatmap showing the tissue-specific expression profiles of NbGRASs. Transcriptomic data obtained from the NCBI Sequence Read Archive (SRA) database (https://www.ncbi.nlm.nih.gov/sra/, accessed on 16 October 2024) with accession number PRJNA188486 [8].
Plants 14 02295 g007
Figure 8. Heatmap showing expression profiles of NbGRASs under infection by tomato yellow leaf curl virus (TYLCV) and bamboo mosaic virus (BaMV) [42,43].
Plants 14 02295 g008
Figure 9. RT-qPCR results of relative expression levels of NbGRASs. (A) Relative expression levels of NbGRAS genes in BaMV-infected and control (CK). (B) Relative expression levels of NbGRAS genes in TYLCV-infected and control (CK). Mean ± SD values are from three biological replicates, and each replicate had three technical replicates.; *, p < 0.05 according to Student’s t-test.
Plants 14 02295 g009
Table 1. Codon usage indicators of the GRASs in five different species.
Species NameCAICBIFopENCGC3sGC Content
Arabidopsis thaliana0.2070.0130.42655.410.4380.467
Nicotiana benthamiana0.188−0.080.37353.920.3750.435
Solanum lycopersicum0.187−0.0820.37252.980.3560.421
Oryza sativa0.2310.140.49845.60.7690.634
Glycine max0.201−0.0240.40655.240.4760.471
Abbreviations: CBI, codon bias index; Fop, frequency of optimal codons; ENC, effective number of codons; and GC3s, contents of G or C bases at the third position of the codons; and GC content, the contents of the G and C bases of the codons.
Disclaimer/Publisher’s Note: The statements, opinions and data contained in all publications are solely those of the individual author(s) and contributor(s) and not of MDPI and/or the editor(s). MDPI and/or the editor(s) disclaim responsibility for any injury to people or property resulting from any ideas, methods, instructions or products referred to in the content.

