Abstract
Changes in habitat suitability are critical indicators of the ecological impacts of climate change. Syndiclis Hook. f., a rare and endangered genus endemic to montane limestone and cloud forest ecosystems in China, holds considerable ecological and economic value. However, knowledge of its current distribution and the key environmental factors influencing its habitat suitability remains limited. In this study, we employed the MaxEnt model, integrated with geographic information systems (ArcGIS), to predict the potential distribution of Syndiclis under current and future climate scenarios, identify dominant bioclimatic drivers, and assess temporal and spatial shifts in habitat patterns. We also analyzed spatial displacement of habitat centroids to explore potential migration pathways. The model demonstrated excellent performance (AUC = 0.988), with current suitable habitats primarily located in Hainan, Taiwan, Southeastern Yunnan, and along the Yunnan–Guangxi border. Temperature seasonality (bio7) emerged as the most important predictor (67.00%), followed by precipitation of the driest quarter (bio17, 14.90%), while soil factors played a relatively minor role. Under future climate projections, Hainan and Taiwan are expected to serve as stable climatic refugia, whereas the overall suitable habitat area is projected to decline significantly. Combined with topographic constraints, population decline, and limited dispersal ability, these changes elevate the risk of extinction for Syndiclis in the wild. Landscape pattern analysis revealed increased habitat fragmentation under warming conditions, with only 4.08% of suitable areas currently under effective protection. We recommend prioritizing conservation efforts in regions with habitat contraction (e.g., Guangxi and Yunnan) and stable refugia (e.g., Hainan and Taiwan). Conservation strategies should integrate targeted in situ and ex situ actions, guided by dominant environmental variables and projected migration routes, to ensure the long-term persistence of Syndiclis populations and support evidence-based conservation planning.
1. Introduction
Climate is a fundamental ecological factor shaping the natural geographic distribution of species. Its ongoing changes exert profound effects on ecosystem structure and function, community composition, and species spatial patterns, thereby posing a severe threat to global biodiversity [1,2]. Consequently, understanding biotic responses to climate change has emerged as a major focus in ecological research [3], particularly in biogeographical studies exploring the relationship between plant distribution and climatic variables [4]. The Sixth Assessment Report of the Intergovernmental Panel on Climate Change (IPCC) projects that global warming will accelerate, with surface temperatures likely to exceed 1.5 °C above pre-industrial levels by 2030 [5]. The intensifying climate crisis, along with increasing anthropogenic disturbances, has led to significant ecological disruptions, rendering many habitats unsuitable for native species [6]. As a result, numerous species are undergoing range shifts or experiencing habitat fragmentation and contraction [7,8], while some face heightened risks of local or global extinction due to limited adaptive capacity [9]. Plant species show considerable variation in ecological plasticity: widespread taxa with broader niches are generally more resilient, whereas narrowly distributed or endangered species with specialized habitat requirements tend to be more vulnerable to environmental stressors [10]. As climate regimes continue to shift, plant physiological and ecological traits may undergo significant changes, and species unable to adapt promptly are increasingly at risk of extinction [11,12]. In this context, accurately predicting the distribution patterns and suitable habitats of rare and endangered species is critical for informing conservation planning. Establishing protection measures within climatically favorable regions and monitoring temporal trends in habitat suitability can provide vital insights for designing adaptive, forward-looking conservation strategies. Nonetheless, our understanding of how rare plants respond to climate change across space and time remains limited, underscoring the urgent need for predictive approaches to support biodiversity conservation in a changing world [13].
Species distribution models (SDMs) are widely used tools in biodiversity and conservation research, offering a statistical framework to correlate species occurrences with environmental variables to assess habitat preferences and ecological tolerances [14]. By integrating species records with climatic, topographic, and edaphic variables, SDMs facilitate the identification of key environmental drivers, the inference of ecological niche characteristics, and the projection of suitable habitats under both current and future climate scenarios [14]. In recent years, SDMs have become essential in conservation planning for rare and endangered species, supporting applications such as habitat suitability mapping, conservation priority setting, and invasive species risk assessment [15,16]. Common modeling approaches include Bioclim, the Genetic Algorithm for Rule-set Prediction (GARP), Ecological Niche Factor Analysis (ENFA), Random Forest (RF), and the Maximum Entropy (MaxEnt) model [17]. Among these, MaxEnt has gained widespread use due to its high predictive performance, flexibility, and ability to perform reliably with small sample sizes and limited occurrence data [18,19]. Notably, MaxEnt is particularly effective in modeling potential distributions for narrowly distributed or data-deficient plant species [20]. For example, the suitable habitat of Picea chihuahuana Martínez is projected to decrease significantly under future warming scenarios, primarily influenced by minimum temperature of the coldest month, cold- and warm-season precipitation, and mean annual temperature [21]. In contrast, Horsfieldia hainanensis Merr. is expected to expand its suitable range under future climate conditions, with suitability mainly determined by the coldest month’s minimum temperature, annual temperature range, and the normalized difference vegetation index (NDVI) [22]. Similarly, the distribution of Camellia luteoflora Y. K. Li ex Hung T. Chang & F. A. Zeng is primarily affected by average temperature and precipitation during the hottest and coldest seasons [23]. Research on Camphora Fabr. species has shown that cold-season temperatures, temperature seasonality, and annual precipitation are key factors influencing their distribution, with suitable habitats showing varying degrees of expansion or contraction under future climate scenarios [24]. These case studies highlight the effectiveness of MaxEnt in predicting the distributional responses of threatened plants under changing climates, providing a valuable tool for biodiversity conservation.
Syndiclis, a genus within the Subtribe Beilschmiediineae of the Lauraceae family, currently comprises twelve recognized species, with eleven endemic to China and primarily distributed across Yunnan, Guizhou, Guangxi, Hainan, Guangdong, and Hong Kong [25]. These species are ecologically specialized, favoring humid environments and predominantly occurring in karst limestone landscapes, where natural populations tend to be highly fragmented and sparse. Characterized by low fruit set, limited seed dispersal, and poor seedling survival, Syndiclis populations exhibit inherent vulnerability and a trend toward decline [26]. Beyond their ecological importance, Syndiclis species possess considerable economic value, as their seeds are rich in high-quality oils suitable for both industrial and edible uses, and some taxa have been proposed for afforestation in karst regions [27]. Recent research has explored various facets of the genus, including morphology [28,29], phylogeny [30,31,32], biogeography [33], population ecology [26], and genomics [34], with a strong focus on taxonomic delimitation. Syndiclis is believed to have originated in the early Eocene (~51 Ma), with X.W. Li proposing a local origin in Southwestern China [35]. The type species, S. paradoxa Hook. f., was described by Hooker in 1886 from a Bhutanese specimen collected by Booth [36], followed by descriptions of additional species such as S. chinensis Allen [37], S. hongkongensis N. H. Xia, Y. F. Deng & K.L. Yip [38], and Sinopora hsiwenii Bing Liu & Y. Yang (2008, Hunan) [39]. Taxonomic debates have occurred, with some authors, including Kostermans and Rohwer, advocating for merging Syndiclis into Potameia [40,41], whereas others, such as Li X.W., Bai P.Y., and Li J., supported maintaining Syndiclis as a distinct genus based on diagnostic traits, including sterile stamen count and glandular positions [42,43]. In 2008, J. Li et al. reassigned S. hongkongensis to the newly established genus Sinopora based on floral merism [43]; however, due to complex floral variation and advances in morphological and molecular data, current taxonomic consensus generally treats Chinese species of Syndiclis and Sinopora as a single genus [31,44], a view embraced in this study. Currently, research on the geographic distribution of this genus remains limited, with its distribution centers and future trends still unclear. Conservation priorities are lacking, and studies on habitat suitability modeling and the identification of key environmental drivers are notably absent.
In this study, we investigate the genus Syndiclis (Lauraceae) to evaluate its potential distribution and key environmental constraints under current and future climate scenarios. Using the MaxEnt model integrated with ArcGIS, we combined topographic, climatic, and edaphic variables to assess the impacts of climate change on habitat suitability and species range dynamics. This approach allows us to identify climatically suitable areas, track spatiotemporal shifts in distribution, and determine dominant environmental drivers. Specifically, we aim to (1) predict suitable habitats for Syndiclis under present climate conditions, (2) identify major contributing variables using the Jackknife test, and (3) analyze distributional changes under future scenarios. Our findings provide a scientific foundation for conservation planning, ex situ preservation, and sustainable use of Syndiclis, particularly in regions vulnerable to climate change.
2. Results
2.1. Model Performance and Accuracy Assessment
The MaxEnt model exhibited strong performance under the default parameter settings (regularization multiplier = 1; feature classes = LQHPT), as indicated by the area under the receiver operating characteristic (ROC) curve (AUC = 0.988) (Figure 1). An AUC value approaching 1.0 reflects excellent model performance, and values above 0.9 are generally regarded as highly accurate. These results confirm that the model provides reliable predictions of the potential distribution of Syndiclis species and meets the accuracy standards required for ecological niche modeling in this study.
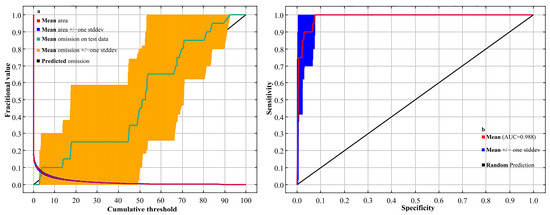
Figure 1.
The validation of the MaxEnt model predicting Syndiclis distribution: (a) omission rate and (b) ROC curve.
2.2. Dominant Environmental Variables Influencing the Distribution of Syndiclis
As shown in Table 1, two environmental variables contributed more than 10% to the model: temperature annual range (bio7, 67.00%) and precipitation of the driest quarter (bio17, 14.90%). Permutation importance analysis further confirmed the dominance of bio7 (78.50%), followed by mean diurnal range (bio2, 9.90%). As illustrated in Figure 2, four variables—bio7, bio13, bio17, and bio2—showed high contributions to model performance. Accordingly, six key environmental predictors were identified: bio2 and bio7 (temperature-related), bio13 and bio17 (precipitation-related), and s_bs and s_clay (soil-related). These six variables collectively accounted for 91.80% of the total contribution, with bio7 ranking highest, followed by bio17 and bio2. Temperature-related variables had a more substantial effect on the predicted distribution of Syndiclis than precipitation or soil factors. This highlights the critical role of thermal variability—especially temperature annual range (bio7)—in shaping the ecological niche of this genus.

Table 1.
Projected changes in suitable habitats of Syndiclis under future climate scenarios.

Figure 2.
Jackknife test for environmental variables.
2.3. Response Ranges of Dominant Environmental Variables
Figure 3 illustrates the response curves of six dominant environmental variables influencing the potential distribution of Syndiclis. These include temperature-related variables (bio2 and bio7), precipitation-related variables (bio13 and bio17), and soil variables (s_bs and s_clay). For temperature, Syndiclis exhibited optimal conditions when the mean diurnal range (bio2) ranged between 5.12 °C and 7.52 °C, with maximum suitability (0.86) at 5.12 °C. The annual temperature range (bio7) showed a suitable interval of 13.91–20.29 °C, peaking at 0.89 at 13.91 °C. Regarding precipitation, the most suitable range for bio13 (precipitation of the wettest month) was 277.63–950.38 mm, with highest suitability (0.78) at 371.95 mm; for bio17 (precipitation of the driest quarter), suitability was highest (0.70) at 60.52 mm within a range of 53.85–93.52 mm. Soil variables also influenced habitat suitability: base saturation (s_bs) ranged from 2.34% to 82.76%, with peak suitability (0.78) at 4.76%, while optimal clay content (s_clay) was between 37.85% and 59.09%, with maximum suitability (0.78) at 46.49%. These results underscore the narrow environmental thresholds of Syndiclis, particularly with respect to thermal and hydrological conditions, which play a pivotal role in determining its ecological niche.
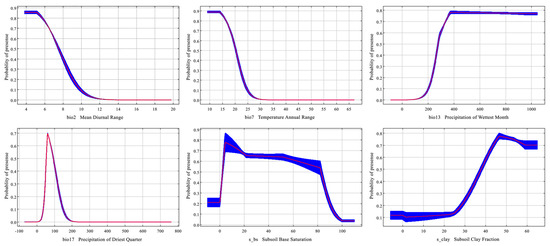
Figure 3.
Response curves of Syndiclis to important climatic factors. The red lines represent the mean, while the blue represent the standard deviation for 10 replications.
2.4. Current and Future Potentially Suitable Habitats for Syndiclis in China
As illustrated in Figure 4, Figure 5 and Figure 6a, the total area of potentially suitable habitat for Syndiclis in China under current climate conditions is approximately 29.63 × 10⁴ km2, including 4.02 × 10⁴ km2 of highly suitable habitat, 5.02 × 10⁴ km2 of moderately suitable habitat, and 20.60 × 10⁴ km2 of marginally suitable habitat. Future climate projections reveal distinct trends under different scenarios. Compared to the present, SSP126 generally predicts an expansion of suitable habitat, while SSP245 and SSP585 suggest a contraction, with the most pronounced reduction occurring under SSP585. As illustrated in Table 1, by 2050, the suitable area is projected to decrease to 25.97 × 10⁴ km2 (3.39 × 10⁴ km2 highly suitable) under SSP126, expand to 35.66 × 10⁴ km2 (4.49 × 10⁴ km2) under SSP245, and slightly decline to 27.07 × 10⁴ km2 (2.86 × 10⁴ km2) under SSP585. In 2070, SSP126 continues to show a slight expansion (30.85 × 10⁴ km2; 4.09 × 10⁴ km2 highly suitable), while SSP245 and SSP585 project declines to 27.84 × 10⁴ km2 (3.85 × 10⁴ km2) and 26.76 × 10⁴ km2 (3.19 × 10⁴ km2), respectively. By 2090, SSP126 predicts the largest expansion (36.50 × 10⁴ km2; 5.37 × 10⁴ km2), whereas SSP245 and SSP585 project significant contractions to 22.72 × 10⁴ km2 (3.31 × 10⁴ km2) and 17.06 × 10⁴ km2 (2.56 × 10⁴ km2), respectively. Currently, Syndiclis is mainly distributed in Southern China, particularly in Hainan, Taiwan, Southeastern Yunnan, and Southwestern Guangxi. Although the extent of suitable habitats varies across climate scenarios, these core distribution areas are expected to remain relatively stable and may serve as long-term climatic refugia.
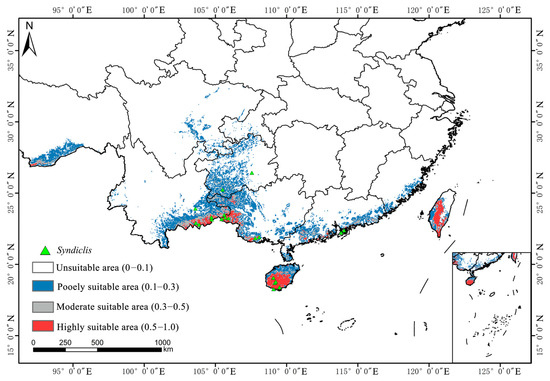
Figure 4.
Distribution of suitable areas of Syndiclis under current climatic conditions.
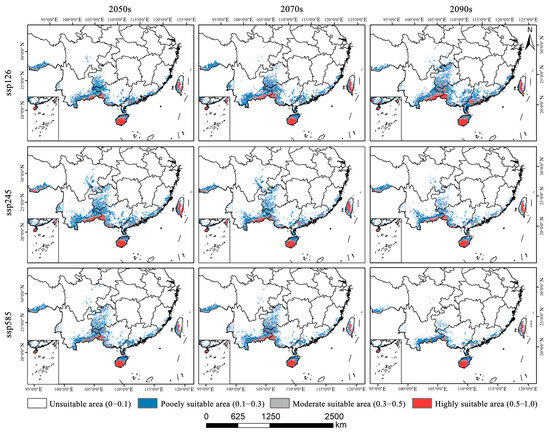
Figure 5.
Projected distribution of suitable areas for Syndiclis under future climatic conditions.
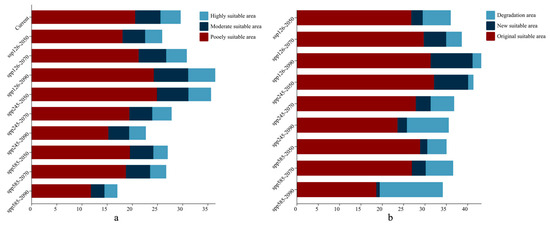
Figure 6.
Areas (a) and area changes (b) of predicted suitable habitat in different climatic periods based on MaxEnt model.
2.5. Spatiotemporal Shifts in Syndiclis Distribution Under Future Climate Scenarios
As shown in Figure 6b and Figure 7, Syndiclis is projected to undergo significant shifts in suitable habitat under future climate scenarios, with substantial variations in both magnitude and direction across different time periods and Shared Socioeconomic Pathways (SSPs). Compared to the current distribution, SSP126 shows an initial contraction followed by expansion; SSP245 exhibits the opposite trend; and SSP585 presents a continuous decline. By 2050, SSP126 predicts the greatest habitat loss (22.16%) with limited gain (9.04%), whereas SSP245 forecasts the largest expansion (26.98%) and the smallest loss (4.17%). SSP585 projects moderate loss (15.18%) and minimal gain (5.71%). By 2070, SSP126 will shift toward expansion (17.78% gain vs. 12.32% loss); SSP245 will remain relatively stable (11.74% gain vs. 18.59% loss), and SSP585 will continue to decline (21.66% loss, 10.92% gain). By 2090, expansion under SSP126 becomes more prominent (33.18% gain, 6.85% loss), while SSP245 shows net contraction (33.04% loss, 7.47% gain), and SSP585 exhibits the most severe decline, with nearly half (49.81%) of suitable habitats lost and only 2.73% newly gained. Regionally, habitat loss is primarily concentrated in Sichuan, Guizhou, and Guangxi, whereas gains are predominantly observed in Yunnan and Guangdong. Suitable areas in Hainan and Taiwan remain relatively stable, although slight variations in suitability levels are anticipated.
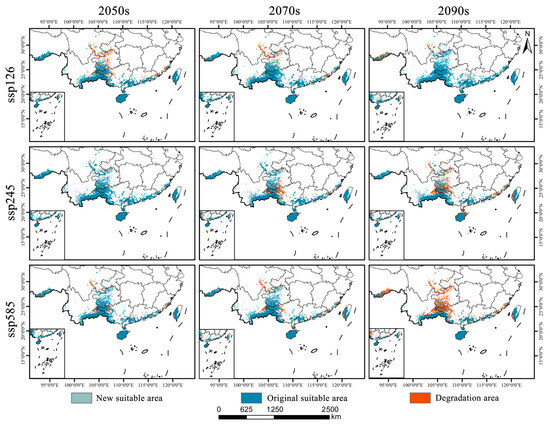
Figure 7.
Spatial change patterns of suitable habitats of Syndiclis under different climate scenarios.
2.6. Centroid Shift Analysis
As illustrated in Figure 8, the current centroid of suitable habitat for Syndiclis is located in Hechi City, Guangxi. Under SSP126, the centroid is expected to shift 57.62 km southwest to Baise by 2050, move 38.20 km northwest within Baise by 2070, and migrate 142.66 km northeast to Nanning by 2090. In the SSP245 scenario, the centroid is expected to shift 33.91 km westward within Hechi by 2050, followed by a slight northward displacement of 8.55 km by 2070, and a further southwestward movement of 54.02 km to Baise by 2090. Under the SSP585 scenario, the centroid is projected to shift 16.90 km southwest within Hechi by 2050, continue 63.53 km southwest to Baise by 2070, and finally shift significantly southeastward by 219.78 km to Nanning by 2090. Overall, centroid trajectories vary considerably across both scenarios and timeframes. By 2050, all scenarios exhibit moderate latitudinal displacements, generally trending toward lower latitudes and higher elevations. In 2070, the directional patterns diverge: SSP126 indicates a northwestward shift; SSP245 shows a minor northward movement, and SSP585 trends southwestward—all maintaining a tendency toward higher elevations. By 2090, shifts become more pronounced in both direction and topographic context: SSP126 projects a northeastward movement toward lower-elevation regions; SSP245 indicates a southwestward migration toward mountainous zones, and SSP585 reveals a marked southeastward shift toward lowland areas.
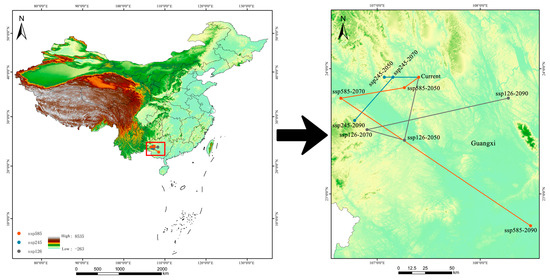
Figure 8.
The centroid change in suitable habitats of Syndiclis under different climate scenarios.
2.7. Landscape Pattern Analysis
Figure 9 illustrates notable changes in landscape metrics of Syndiclis suitable habitats under future emission scenarios. The patch number (NP) in highly suitable areas remained relatively stable, ranging from 98 to 189. In contrast, medium and low suitability zones showed divergent trends. Under SSP126, NP initially declined and then increased, while under SSP585, it followed the opposite pattern. The largest patch index (LPI) generally decreased in low suitability areas. Specifically, under SSP585, LPI steadily declined. Under SSP126, it showed a dip–rise–fall pattern. SSP245 caused a sharp increase in LPI after an initial decline. Cohesion (COHESION) remained stable in low suitability zones. It declined in medium zones but increased in highly suitable areas, although these changes varied with scenarios. Division (DIVISION) was relatively unchanged overall but was highest in medium suitability zones, indicating greater fragmentation there. Highly suitable areas showed consistent aggregation, reflected by low division values. The aggregation index (AI) was stable in low suitability zones. In medium and high zones, it generally increased, except for a steady decline under SSP126. High suitability zones showed a pattern of decline followed by recovery across all scenarios. Finally, the contagion index (CONTAG) declined across all scenarios by 2090, indicating reduced spatial connectivity among suitable habitats. SSP126 and SSP245 exhibited initial increases followed by decreases in CONTAG, whereas SSP585 showed a wave-like fluctuation, suggesting distinct spatial dynamics across scenarios.
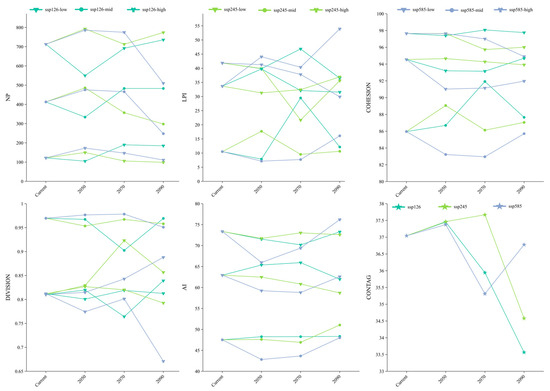
Figure 9.
Potential suitable area landscape index change of wild Syndiclis species.
2.8. Gap Analysis of Conservation Coverage
Based on predictions of highly suitable habitat for Syndiclis, the total area of priority conservation areas is estimated at approximately 90,300 km2. However, only 3700 km2 (4.08%) of these areas currently fall within the boundaries of established nature reserves, indicating that 95.92% of critical habitats remain outside existing protection frameworks (Figure 10). Spatial distribution analysis (Figure 11) reveals marked regional disparities in conservation coverage. Most existing reserves are confined to parts of Yunnan, Hainan, and Guangxi, whereas large portions of high-priority habitats in Guizhou, Taiwan, and other areas of Yunnan remain beyond the formal conservation network. These findings highlight a substantial conservation shortfall and emphasize the urgent need for region-specific protection strategies.
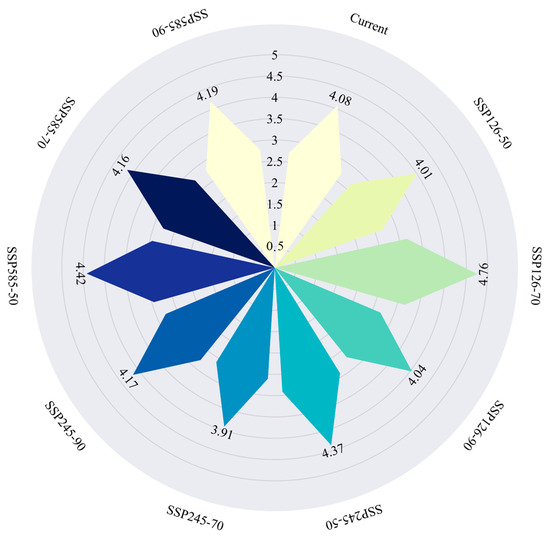
Figure 10.
Area ratio of protected areas (the coverage area ratio of the priority protection area).
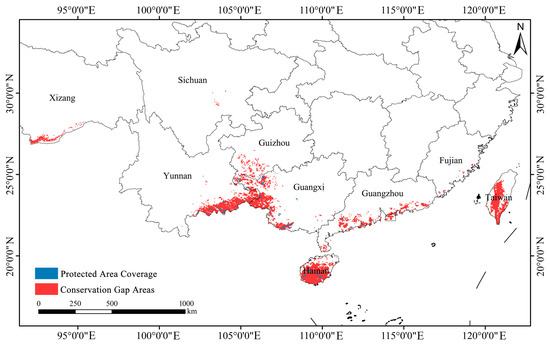
Figure 11.
Protection gap of Syndiclis species.
3. Discussion
3.1. Model Accuracy Assessment and Conservation Gap Analysis
The predictive performance of the MaxEnt model is influenced by both species occurrence data and environmental variables. Its reliability depends largely on the selection of the ecological niche model, the quality and spatial coverage of occurrence records, and the type and number of environmental predictors used [45]. Ecological niche models serve as effective tools for inferring the climatic requirements of species and projecting their potential distributions across spatial and temporal gradients. Divergent emission trajectories and GCM uncertainties across SSPs propagate habitat prediction variability. MaxEnt inherently assumes species–environment equilibrium and excludes biotic interactions/dispersal constraints. We emphasize cautious interpretation and advocate for future integration of dynamic processes with field validation, using the MaxEnt model with ArcGIS to assess Syndiclis distribution in relation to environmental variables and future climate scenarios. Spatial filtering reduced sampling bias, while multicollinearity was addressed through correlation analysis, variable importance ranking, and jackknife testing [46]. Model performance (AUC = 0.988) was evaluated via ROC curves. The model’s performance was evaluated using the receiver operating characteristic (ROC) curve, yielding an AUC value of 0.988. This value is consistent with previous findings for related taxa, including Camphora [24], Litsea [47], Woonyoungia septentrionalis [48], and Michelia odora [49], confirming the model’s high reliability and strong predictive accuracy in capturing the distribution patterns of Syndiclis.
Scientifically predicting the potential distribution of rare and endangered plant species and establishing wild germplasm banks and nature reserves have become essential strategies for biodiversity conservation [50]. Currently, Syndiclis, as a rare and ecologically specialized genus, faces several challenges, including sparse and uneven natural distribution, insufficient scientific investigation, limited natural regeneration of wild populations, and ongoing population decline. All species within this genus are narrow-range endemics, making them particularly susceptible to climate change impacts [51,52]. Due to their strict hydrothermal requirements and weak climatic adaptability, Syndiclis species are likely to face further habitat reductions under future climate scenarios. Our conservation gap analysis revealed that only 4.08% of priority conservation areas are currently covered by existing nature reserves, highlighting a significant shortfall in protection. Therefore, identifying and designating priority conservation units is critical for formulating effective conservation strategies in the face of climate change. In addition, we recommend strengthening forest management and supervision, raising public awareness about plant conservation, promoting the importance of plant protection in the context of ecological civilization, and implementing artificial afforestation or assisted restoration when necessary.
3.2. The Dominant Factors That Restrict the Distribution of Syndiclis Habitat
The interaction between environmental factors and species distribution is a central theme in ecology, biogeography, and conservation management of rare and endangered plants [53]. Species’ geographical distribution is regulated by multiple environmental variables and reflects the outcome of long-term species–environment interactions. Climate change, as a major determinant of global vegetation patterns, directly influences species distribution, migration, and survival [54]. In the present study, six variables, bio2, bio7, bio13, bio17, S_bs, and S_clay, were identified as key factors shaping the potential distribution of Syndiclis, among which bio7 (temperature annual range) contributed up to 67.00%, serving as the dominant determinant. Hydrothermal conditions are known to be major bioclimatic drivers for woody plants, but their specific influence often varies across species. Temperature plays a pivotal role in plant growth, development, and biogeography [55]. For Syndiclis, temperature was found to be the most significant limiting factor, followed by precipitation, while soil variables had relatively minor effects. This is consistent with findings in other Lauraceae species. For instance, Li Hui et al. [24] reported that temperature-related factors primarily constrained the distribution of rare and endangered Camphora species. Zhou Run et al. [56] further noted that while most Camphora species are influenced by hydrothermal conditions, some are mainly governed by temperature. Similarly, Cassytha L. distribution was predominantly shaped by temperature, which exerted a stronger effect than precipitation [57]. In contrast, studies on Litsea Lam. indicated precipitation as the dominant factor, with temperature being secondary [47], slightly differing from our results, though hydrothermal variables still played the central role. Other studies have confirmed temperature as the primary determinant in species such as Salix tetrasperma Roxb. [58], alpine Quercus sect. Heterobalanus in the Hengduan Mountains [59], evergreen Sclerocarpus oaks [60], and endangered Horsfieldia hainanensis Merr. [22]. Woonyoungia septentrionalis, a rare species, was mainly influenced by combined hydrothermal conditions [48], aligning with our findings. Overall, species exhibit distinct responses to environmental variables, and the dominant factors governing their potential habitats are often species-specific [61]. These differences underscore the importance of tailored strategies in conservation planning and habitat suitability modeling.
Hydrothermal conditions significantly influence the germination, growth, and spatial distribution of seedlings in rare and endangered plant species [62]. This is further corroborated in Syndiclis, a narrowly distributed genus highly sensitive to environmental changes. Its flowering phenology is notably affected by temperature and precipitation [63], and the link between phenology and hydrothermal conditions has been similarly reported in other members of the Lauraceae [64]. Syndiclis exhibits unique phenological traits, such as two flowering periods and one fruiting phase per year, short flowering durations, and extremely small flowers. The first flowering peak typically occurs between May and June and is fertile, during which temperature is significantly correlated with phenological development. Pollination success, a key determinant of reproductive output, is jointly influenced by flowering temperature, flower number, and anther orientation. In some species, upward-facing anthers lead to increased pollen exposure to rainfall, reducing pollen viability and further emphasizing the dominant regulatory role of temperature [39]. Additionally, Syndiclis predominantly inhabits limestone mountainous regions and mid- to high-elevation cloud forests—habitats characterized by thin soil layers, high rock exposure, and microclimatic variability. In these environments, soil temperature is strongly influenced by surface rocks, and thick seed coats hinder natural germination. Although winter humidity and spring rainfall can facilitate seed coat decomposition, temperature remains the principal driver of seed germination [30]. The interception of rainfall by litter and water storage in soil layers further attenuates the direct impact of precipitation. As a tropical-origin family, Lauraceae members generally require higher temperatures. Decreasing temperatures associated with higher latitudes and elevations are known to reduce species richness within this family [24], consistent with the restricted distribution patterns of Syndiclis observed in this study.
The declining contagion index (CONTAG) across future scenarios indicates reduced habitat connectivity, potentially impeding pollen/seed dispersal and restricting gene flow in Syndiclis. This fragmentation may drive smaller, isolated populations with increased inbreeding depression and diminished genetic diversity, ultimately eroding adaptive capacity. Concurrently, persistently high division index (DIVISION) in medium-suitability zones suggests stable fragmentation of critical dispersal corridors. Given Syndiclis’ narrow habitat specificity and limited dispersal, such landscape disintegration exacerbates climate vulnerability by reducing effective population connectivity. These findings underscore the imperative to integrate spatial metrics into conservation frameworks for fragmented-endemic taxa.
3.3. Current Distribution Prediction and Distribution Center of Syndiclis
This study reveals the potential spatial pattern changes and distribution centroid shifts of Syndiclis under different scenarios in the present and future by modeling and analyzing the species distribution data and climate data with the help of software such as MaxEnt and GIS, which is of great significance for the conservation of species and ecosystems. The results show that Syndiclis is mainly distributed in 103°41′–114°08′ E, 18°25′–26°26′ N, covering Hainan, Taiwan, Southwestern Guangxi, Southeastern Yunnan, Southeastern Tibet, Southeastern Guizhou, and Southeastern Sichuan, consistent with actual records. Highly suitable areas in Yunnan and Guangxi are concentrated in Xichou County, Jingxi City, and Baise City, demonstrating distributional stability. This corroborates the hypothesized origin in Southwestern China (particularly Southeastern Yunnan) [35], while we propose Hainan and Taiwan as “modern refuges” due to their persistent habitat suitability. Stable distributions in limestone mountains and mid-elevation cloud forests provide suitable microclimates and vertical migration space. However, future warming and drought intensification will reduce high-suitability habitats, forcing migration toward low-elevation/latitude humid zones. This intensifies habitat fragmentation, blocking migration routes and increasing extinction risk [65], aligning with the narrow thermal adaptation of tropical taxa [66]. Syndiclis exhibits significant range dynamics and centroid shifts: by 2050, contraction under SSP126/SSP585 but expansion under SSP245 are expected, with southwest centroid shifts; by 2070, only SSP126 will show expansion with directional centroid shifts; by 2090, intensified “southwest–southeast” shifts and atypical elevation changes are expected [67]. This study concluded that the reduced habitat adaptability in the west, the degradation of the northern boundary suitable area, and the complexity of topography and climate were the main causes of the southward distribution of Syndiclis and that the trend was driven by geographic factors rather than physiological adaptations of the species [24], and it was consistent with the results of some rare camphor tree studies, which further verified the scientific validity of this study.
Landscape index analysis further showed that with climate change, the area of suitable habitat is shrinking and habitat fragmentation is increasing. This is mainly affected by temperature factors, indicating that warmer temperatures do not universally promote habitat dispersal of plants [68]. Therefore, environmental factors such as temperature should be prioritized when introducing and domesticating species, while the distribution of species’ fitness is also limited by anthropogenic factors and other abiotic factors that affect the growth and survival of species [69]. Therefore, we should pay special attention to the changes in suitable habitats at low latitudes and low altitudes in the future study of the fitness changes in Syndiclis due to climate warming. In particular, we should incorporate the effects of anthropogenic factors, the species’ own characteristics, and community ecosystems into the study of the fitness distribution of the species, which can be further verified by combining with molecular studies and fossilized plants to improve the accuracy and scientificity of the simulation and prediction.
4. Materials and Methods
4.1. Data and Materials
4.1.1. Species Occurrence Data
To collect occurrence data for Syndiclis species, two complementary approaches were employed. First, 12 presence records were obtained from field investigations conducted in natural habitats across Southern China. Second, additional occurrence data were compiled from multiple secondary sources, including the Chinese Virtual Herbarium (CVH; https://www.cvh.ac.cn/, accessed on 5 January 2025), the Global Biodiversity Information Facility (GBIF; https://www.gbif.org/, accessed on 10 January 2025), the published literature, and floristic monographs. This process yielded a total of 95 raw occurrence records within China. To improve data quality and reduce spatial autocorrelation and potential model overfitting, duplicated and erroneous records were removed. Furthermore, to account for sampling bias, only one occurrence point was retained within each 5 km × 5 km grid cell. This spatial filtering was performed using the SDMToolbox v2.5 implemented in ArcGIS 10.8. After filtering, a total of 20 valid occurrence points were retained for modeling. Each record contained species name, longitude, and latitude, and the final dataset was exported in CSV format for subsequent ecological niche modeling.
4.1.2. Environmental Data Sources and Variable Selection
Environmental variables used in this study encompassed climate, topography, soil, and ultraviolet (UV) radiation factors, totaling 60 variables. Nineteen bioclimatic variables (bio1-bio19) were obtained from WorldClim version 2.1 (https://www.worldclim.org/, accessed on 1 March 2025), representing current conditions as well as future projections for the 2050s (2041–2060), 2070s (2061–2080), and 2090s (2081–2100). Future climate data were based on the Beijing Climate Center Climate System Model version 2.1 (BCC-CSM2-MR), a coupled global climate model widely used for regional climate projections, with a spatial resolution of 2.5 arc-minutes. Three Shared Socioeconomic Pathway (SSP) scenarios, SSP126, SSP245, and SSP585, were selected to capture a range of potential future climate conditions. Topographic variables, including slope, aspect, and elevation, were derived from a digital elevation model (DEM) provided by the Geospatial Data Cloud (http://www.gscloud.cn/, accessed on 5 March 2025). These variables were computed using spatial analysis tools in ArcGIS 10.8. Soil data comprising 32 variables were sourced from the Harmonized World Soil Database (HWSD, https://www.fao.org/soils-portal/data-hub/soil-maps-and-databases/harmonized-world-soil-database-v20/en/, accessed on 10 March 2025). Additionally, six UV radiation variables were acquired from the Global UV Radiation Database (https://www.ufz.de/gluv/, accessed on 15 March 2025). The base map used for modeling was obtained from the Standard Map Service System of the Ministry of Natural Resources of China (http://bzdt.ch.mnr.gov.cn/, accessed on 20 March 2025). To ensure consistency and model stability, all environmental raster layers were converted to ASCII format, reprojected to a common geographic coordinate system (GCS-WGS1984), and resampled to a uniform spatial resolution of 2.5 arc-minutes using ArcGIS 10.8. Given the potential for multicollinearity among predictor variables, we implemented a multi-step variable selection process to optimize model performance and reduce overfitting. First, a preliminary MaxEnt run was conducted to assess the importance and contribution of each variable via Jackknife tests. Next, environmental values were extracted at species occurrence points using ArcGIS extraction tools, and pairwise Pearson correlation coefficients were calculated to evaluate inter-variable correlations. Variables with an absolute correlation coefficient |r| > 0.80 were considered highly correlated, and among these, those with negligible contribution to the model prediction (contribution rate = 0) were excluded. The final set of variables was selected based on ecological relevance and statistical criteria following established protocols [18,19], which has been shown to improve simulation accuracy [20]. Ultimately, the optimal variable set included four climatic variables (bio2: Mean Diurnal Range, bio7: Temperature Annual Range, bio13: Precipitation of Wettest Month, bio17: Precipitation of Driest Quarter), six soil variables (t_usda_tex: USDA soil texture, t_bs: base saturation, t_gravel: gravel content, s_bs: soil base saturation, s_clay: clay content, s_teb: total exchangeable bases), and two topographic variables (slope, elevation) (Table 2).

Table 2.
Parameters of Environmental Variables.
4.2. Species Distribution Modeling and Model Accuracy Assessment
In this study, the accuracy of the MaxEnt model was evaluated using the area under the receiver operating characteristic curve (AUC-ROC) [70]. The AUC value is minimally affected by sample size and threshold selection, making it a robust metric for assessing the predictive performance of MaxEnt models. As shown in Figure 1, the red curve represents the training dataset’s ROC analysis, with AUC values ranging from 0.5 to 1.0, where values closer to 1.0 indicate higher model accuracy [71]. Based on the criteria established by Kumar et al. [72], AUC values are interpreted as follows: 0.5–0.6 indicates no predictive ability; 0.6–0.7 indicates low accuracy; 0.7–0.8 represents moderate accuracy; 0.8–0.9 denotes high accuracy; and 0.9–1.0 indicates excellent predictive performance [73,74]. A total of 20 occurrence records and 12 environmental variables were input into the MaxEnt model. The dataset was randomly split, with 75% used for model training and 25% reserved for testing, to ensure robust model validation. Response curves for individual environmental variables were generated to evaluate the species’ habitat suitability. A predicted presence probability (p) of ≤0.5 was interpreted as low habitat suitability, whereas p > 0.5 indicated high suitability [75]. Variable importance and contribution were assessed using the Jackknife test, with default MaxEnt parameters maintained. Ten replicate runs were performed to enhance result reliability, culminating in the production of species distribution prediction maps.
4.3. Classification of Habitat Suitability Levels, Spatial Dynamics, and Environmental Variable Importance Assessment
The output of the MaxEnt model was visualized using ArcGIS 10.2. Habitat suitability was classified into four categories using the Reclassify tool combined with the Natural Breaks (Jenks) method. Threshold values were manually set to define the following suitability classes: unsuitable area (0–0.1), poorly suitable area (0.1–0.3), moderately suitable area (0.3–0.5), and highly suitable area (0.5–1.0). The suitable habitat area of Syndiclis was quantified for different time periods, and its distributional changes under various future climate scenarios were compared. In this study, regions with a habitat suitability index ≥ 0.1 were considered suitable habitats, whereas those with a suitability index < 0.1 were classified as unsuitable. Presence/absence (binary) matrices were constructed for Syndiclis suitability distributions under future climate scenarios, where “1” indicated presence (suitable habitat), and “0” indicated absence (unsuitable habitat). Based on these matrices, changes in habitat suitability were categorized into four types: new suitable areas (areas becoming suitable), degradation areas (areas losing suitability), original suitable areas (areas consistently suitable), and unsuitable areas (consistently unsuitable).
4.4. Habitat Landscape Pattern Analysis
Landscape pattern metrics serve as key indicators to characterize spatial heterogeneity and structural attributes of habitats, enabling systematic analysis of habitat fragmentation, patch connectivity, and spatial configuration [76]. In this study, Fragstats 4.2 software was employed to calculate six landscape metrics at both the class and landscape levels: Patch Number (NP), Largest Patch Index (LPI), Aggregation Index (AI), Landscape Division Index (DIVISION), Patch Cohesion Index (COHESION), and Contagion Index (CONTAG). These metrics were used to analyze the fragmentation degree, aggregation status, and heterogeneity of Syndiclis’ potential suitable habitats under different climate scenarios, thereby elucidating the dynamic changes in landscape patterns.
4.5. Species Distribution Centroid Migration Analysis
The direction and distance of species habitat suitability shifts can be inferred from changes in the geographic centroid of suitable habitats [77]. Using ArcGIS and the SDM_Toolbox, the geometric centroids of current and future suitable habitat distributions (binary maps) were identified. The latitude and longitude coordinates of these centroids were extracted, and centroid shifts and migration distances of Syndiclis under various future climate scenarios were calculated [78].
4.6. Conservation Gap Analysis
Potential highly suitable habitat areas of Syndiclis were designated as priority conservation zones. Using ArcGIS, highly suitable areas were extracted for each temporal climate scenario. The spatial boundaries of existing global nature reserves were applied as masks via the Extract by Mask tool to identify overlaps between Syndiclis priority habitats and protected areas. Changes in the extent of protected suitable habitats were quantified across different time periods to assess the impact of future climate change on the spatial distribution and coverage of Syndiclis’ potential conservation areas.
5. Conclusions
This study integrates species distribution modeling (MaxEnt), landscape pattern analysis, and conservation gap assessment to evaluate the climate-driven distributional shifts and conservation risks of the rare laurel genus Syndiclis in China. The species’ distribution is strongly influenced by thermal factors, particularly the temperature annual range (Bio7), with a narrow thermal niche (13.91–20.29 °C; <6.4 °C amplitude), indicating high climate sensitivity. Compared to other Lauraceae, Syndiclis exhibits stricter thermal tolerance, increasing its vulnerability to warming. Projections show divergent outcomes: potential range expansion under SSP126 and significant contraction (up to −42.4%) under SSP585. Centroid shifts toward lower latitudes and mid-to-high elevations suggest that karst terrains may serve as climate refugia. However, habitat fragmentation intensifies under high-emission scenarios, leading to increased isolation, reduced connectivity, and potential gene flow disruption. Conservation gap analysis reveals that only 4.08% of high-suitability areas—mainly in Southeastern Yunnan, Southwestern Guangxi, and Hainan—are currently protected, underscoring urgent conservation needs. To address this, a three-tiered strategy is proposed: (1) Core Climate Refugia—stable, high-suitability zones needing strict protection and microclimate monitoring; (2) Buffer Restoration Zones—adjacent habitats to be restored using Lauraceae species and substrate improvements; and (3) Climate-Adaptive Corridors—linking shifting habitats with ex situ stations to maintain gene flow and adaptive potential. Syndiclis provides a model for understanding climatic limits in edge-tropical taxa, emphasizing the need for integrated, forward-looking conservation strategies supported by ecological and paleoenvironmental data.
Author Contributions
Conceptualization, L.H. and W.Y.; methodology, L.H. and W.Y.; software, W.Y.; validation, X.X., Y.Z. and Y.Y.; formal analysis, X.X.; investigation, L.H., R.C. and Y.Y.; data curation, L.H., R.C. and W.Y.; writing—original draft preparation, L.H. and W.Y.; writing—review and editing, L.H., W.Y., X.X. and Z.L.; visualization, L.H. and W.Y.; supervision, Z.L.; project administration, L.H., R.C. and Z.L.; funding acquisition, L.H., R.C. and Z.L. All authors have read and agreed to the published version of the manuscript.
Funding
This research was supported by the Guizhou Provincial Science and Technology Program Project (Qiankehejichu–ZK [2022] General 240), Guizhou Academy of Forestry Project (Guilinkehe [2024] 09). The survey and evaluation of newly added national key protected wild plant resources in Guizhou Province (the third phase) (MCHC-ZD20242057), National Natural Science Foundation of China (Grant No. 32400179).
Data Availability Statement
Data are contained within this article.
Acknowledgments
We are grateful to Yu Song (Guangxi Normal University) for providing distribution data for certain species. We also thank Zenghui Wang, a graduate student at the College of Forestry, Guizhou University, for his assistance and guidance in the graphical analyses of this paper.
Conflicts of Interest
The authors declare no conflicts of interest.
References
- Bellard, C.; Bertelsmeier, C.; Leadley, P.; Thuiller, W.; Courchamp, F. Impacts of climate change on the future of biodiversity. Ecol. Lett. 2012, 15, 365–377. [Google Scholar] [CrossRef] [PubMed]
- Zheng, F.; Huang, Z.C.; Chen, L.J.; Wang, M.; Yan, Y.H.; Chen, J.B. Prediction of distribution patterns and dominant climatic factors of Cymbidium in China using MaxEnt model. Guihaia 2023, 43, 1027–1040. [Google Scholar]
- Pounds, J.A.; Bustamante, M.R.; Coloma, L.A.; Consuegra, J.A.; Fogden, M.P.L.; Foster, P.N.; La Marca, E.; Masters, K.L.; Merino-Viteri, A.; Puschendorf, R.; et al. Widespread amphibian extinctions from epidemic disease driven by global warming. Nature 2006, 439, 161–167. [Google Scholar] [CrossRef] [PubMed]
- Zhang, C.H.; Lei, C.Y.; Wang, C.; Feng, D.F.; Sun, Y.Y. Predicting the potentially suitable climate areas for four varietas of Toona ciliata in Yunnan Province by maximum entropy (MaxEnt) Model. J. Yunnan Agric. Univ. Nat. Sci. 2022, 37, 294–301. [Google Scholar]
- Masson-Delmotte, V.; Zhai, P.; Pörtner, H.-O.; Roberts, D.; Skea, J.; Shukla, P.R.; Pirani, A.; Moufouma-Okia, W.; Péan, C.; Pidcock, R.; et al. (Eds.) Global Warming of 1.5 °C: IPCC Special Report on Impacts of Global Warming of 1.5 °C above Pre-Industrial Levels in Context of Strengthening Response to Climate Change, Sustainable Development, and Efforts to Eradicate Poverty; Cambridge University Press: Cambridge, UK, 2022. [Google Scholar][Green Version]
- Howarth, C.; Viner, D. Integrating Adaptation Practice in Assessments of Climate Change Science: The Case of IPCC Working Group II Reports. Environ. Sci. Policy 2022, 135, 1–5. [Google Scholar] [CrossRef]
- Jordà, G.; Marbà, N.; Bennett, S.; Santana-Garcon, J.; Agusti, S.; Duarte, C.M. Ocean Warming Compresses the Three-Dimensional Habitat of Marine Life. Nat. Ecol. Evol. 2020, 4, 109–114. [Google Scholar] [CrossRef] [PubMed]
- Kellner, J.R.; Kendrick, J.; Sax, D.F. High-Velocity Upward Shifts in Vegetation Are Ubiquitous in Mountains of Western North America. PLoS Clim. 2023, 2, e0000071. [Google Scholar] [CrossRef]
- Ma, X.P.; Ma, L.L. Research on biodiversity conservation legislation in Qinghai Province. J. Qinghai Environ. 2023, 33, 166–169. [Google Scholar]
- Yang, X.; Xu, Y.; Gong, B.C.; Xie, Q.J. Fruit and Seed Phenotypic Diversity of Two Species of Diospyros spp. in Dabie Mountains. For. Res. 2022, 35, 188–196. [Google Scholar]
- Matías, L.; Linares, J.C.; Sánchez-Miranda, Á.; Jump, A.S. Contrasting growth forecasts across the geographical range of Scots pine due to altitudinal and latitudinal differences in climatic sensitivity. Glob. Change Biol. 2017, 23, 4106–4116. [Google Scholar] [CrossRef] [PubMed]
- Urban, M.C. Accelerating Extinction Risk from Climate Change. Science 2015, 348, 571–573. [Google Scholar] [CrossRef] [PubMed]
- Xiao, J.; Xu, W.; Kang, D.; Li, J. Nature Reserve Group Planning for Conservation of Giant Pandas in North Minshan, China. J. Nat. Conserv. 2011, 19, 209–214. [Google Scholar] [CrossRef]
- Colli-Silva, M.; Pirani, J.R.; Zizka, A. Ecological Niche Models and Point Distribution Data Reveal a Differential Coverage of the Cacao Relatives (Malvaceae) in South American Protected Areas. Ecol. Inform. 2022, 69, 101668. [Google Scholar] [CrossRef]
- Pennekamp, F.; Pontarp, M.; Tabi, A.; Altermatt, F.; Alther, R.; Choffat, Y.; Fronhofer, E.A.; Ganesanandamoorthy, P.; Garnier, A.; Griffiths, J.I.; et al. Biodiversity Increases and Decreases Ecosystem Stability. Nature 2018, 563, 109–112. [Google Scholar] [CrossRef] [PubMed]
- Youri, M.; Van Dyck, H.; Dendoncker, N.; Titeux, N. Testing Instead of Assuming the Importance of Land Use Change Scenarios to Model Species Distributions Under Climate Change. Glob. Ecol. Biogeogr. 2013, 22, 1204–1216. [Google Scholar] [CrossRef]
- Elith, J.; Phillips, S.J.; Hastie, T.; Dudík, M.; Chee, Y.E.; Yates, C.J. A Statistical Explanation of MaxEnt for Ecologists. Divers. Distrib. 2011, 17, 43–57. [Google Scholar] [CrossRef]
- He, Y.L.; Ma, J.M.; Chen, G.S. Potential Geographical Distribution and Its Multi-Factor Analysis of Pinus massoniana in China Based on the MaxEnt Model. Ecol. Indic. 2023, 154, 110790. [Google Scholar] [CrossRef]
- Zhao, Z.Y.; Xiao, N.W.; Shen, M.; Li, J.S. Comparison Between Optimized MaxEnt and Random Forest Modeling in Predicting Potential Distribution: A Case Study with Quasipaa boulengeri in China. Sci. Total Environ. 2022, 842, 156867. [Google Scholar] [CrossRef] [PubMed]
- Zhang, L. Application of MaxEnt Maximum Entropy Model in Predicting Species’ Potential Distribution Ranges. Bull. Biol. 2015, 50, 9–12. [Google Scholar]
- Pinedo-Alvarez, C.; Renteria-Villalobos, M.; Aguilar-Soto, V.; Vega-Mares, J.H.; Melgoza-Castillo, A. Distribution Dynamics of Picea chihuahuana Martínez Populations Under Different Climate Change Scenarios in Mexico. Glob. Ecol. Conserv. 2019, 17, e00559. [Google Scholar] [CrossRef]
- Liang, H.Z.; Lin, Y.; Liu, X.S.; Jiang, Y.; Yang, J.S.; Huang, R.L.; Wang, R.J. Evaluating Habitat Suitability of Endangered Plant Horsfieldia hainanensis Based on the Optimized MaxEnt Model. J. Cent. South Univ. For. Technol. 2024, 44, 16–26. [Google Scholar]
- Dai, Y.X.; Jin, T.; Xu, H.X.; Wang, D.; Wang, L. Study on the Suitable Area of Camellia luteoflora Y.K.Li in China Based on MaxEnt Model. J. Sichuan Univ. Nat. Sci. Ed. 2021, 58, 189–198. [Google Scholar]
- Li, H.; Teng, J.; Yin, X.J.; Li, G.; Chen, Z.; Wang, Y. Simulation Prediction of Suitable Distribution Area of Rare and Endangered Species of Camphora in China Under Different Climatic Environment. J. Northeast. For. Univ. 2023, 51, 43–53. [Google Scholar]
- Wu, Z.Y.; Raven, P.H.; Hong, D.Y. (Eds.) Flora of China; Volume 7: Menispermaceae Through Capparaceae; Science Press: Beijing, China; Missouri Botanical Garden Press: St. Louis, MO, USA, 2008; pp. 244–247. [Google Scholar]
- Chen, R.; Xu, C.R.; Huang, L.; Li, M.; Yang, C.H. Habitat, Community Characteristics and Species Diversity of an Endemic Tree Species (Syndiclis anlungensis) in Guizhou. Guizhou For. Sci. Technol. 2023, 51, 30–37+44. [Google Scholar]
- Liu, Y. Syndiclis anlungensis. Guizhou For. Sci. Technol. 2015, 43, 65. [Google Scholar]
- Zeng, G.; Liu, B.; Ferguson, D.K.; Rohwer, J.G.; Yang, Y. Floral Structure and Ontogeny of Syndiclis (Lauraceae). PLoS ONE 2017, 12, e0186358. [Google Scholar] [CrossRef] [PubMed]
- Zeng, G. Floral Organs and Leaf Epidermis of a Few Groups of the Lauraceae. Ph.D. Thesis, University of Chinese Academy of Sciences, Beijing, China, 2017. [Google Scholar]
- Huang, H.H.; Li, J.Z. Flower Fossils of Lauraceae in the Geological Time and Its Phylogenetic Evolutionary Significance. Guihaia 2018, 38, 210–219. [Google Scholar]
- Li, H.W. Phylogeny and Biogeography of the Beilschmiedia Group (Lauraceae). Ph.D. Thesis, University of Chinese Academy of Sciences, Beijing, China, 2020. [Google Scholar]
- Yang, Y.; Zhang, L.Y.; Liu, B.; van der Werff, H. Leaf Cuticular Anatomy and Taxonomy of Syndiclis (Lauraceae) and Its Allies. Syst. Bot. 2012, 37, 861–878. [Google Scholar] [CrossRef]
- Yang, S.T. Phylogeny and Biogeography of Beilschmiedia Species in the Family Lauraceae. Master’s Thesis, Guangxi Normal University, Guilin, China, 2024. [Google Scholar]
- Lou, L.; Yuan, C.J.; Chen, R.; Huang, L.; Huang, A.X.; Ding, F.J. Analysis of Codon Usage in the Chloroplast Genome of Syndiclis anlungensis. Mol. Plant Breed. 2025, 1–17. Available online: http://kns.cnki.net/kcms/detail/46.1068.S.20220602.0920.004.html (accessed on 18 July 2025).
- Li, H.W. Notes on the Taxonomy and Distribution of the Genus Syndiclis Hook. f. of Lauraceae and to Discuss the Characteristic of Its Area-Type. Acta Bot. Yunnanica 1979, 1, 11–16. [Google Scholar]
- Hooker, J.D. Lauraceae. In The Flora of British India; Hooker, J.D., Ed.; L. Reeve and Co.: London, UK, 1886; Volume 5, pp. 116–189. [Google Scholar]
- Allen, C.K. Studies in the Lauraceae, V: Some Eastern Asiatic Species of Beilschmiedia and Related Genera. J. Arnold Arbor. 1942, 23, 444–463. [Google Scholar] [CrossRef]
- Xia, N.H.; Deng, Y.F.; Yip, K.L. Syndiclis hongkongensis (Lauraceae), a New Species from China. J. Trop. Subtrop. Bot. 2006, 14, 75–77. [Google Scholar]
- Liu, B. Systematics and Biogeography of the Subtribe Beilschmiediinae (Lauraceae) in China. Ph.D. Thesis, University of Chinese Academy of Sciences, Beijing, China, 2013. [Google Scholar]
- Kostermans, A.J.G.H. Enumeratio Lauracearum madagascariensium et ex insulis Mascarenis (Revisio Lauracearum VI). Not. Syst. 1939, 8, 67–128. [Google Scholar]
- Rohwer, J.G. Nectandra. In Flora Neotropica; The New York Botanical Garden, Ed.; The New York Botanical Garden Press: New York, NY, USA, 1993; Volume 60, pp. 1–332. [Google Scholar]
- Li, S.G.; Bai, P.Y. Endiandra, Syndiclis. In Flora Reipublicae Popularis Sinicae; Editorial Committee of Flora of China, Ed.; Science Press: Beijing, China, 1982; Volume 31, pp. 149–160. [Google Scholar]
- Li, J.; Xia, N.H.; Li, X.W. Sinopora, a New Genus of Lauraceae from South China. Novon 2008, 18, 199–201. [Google Scholar] [CrossRef]
- Yang, Y.; Zhang, L.Y. Venation Pattern of Syndiclis Hook. f. and Its Related Genera. J. Trop. Subtrop. Bot. 2010, 18, 643–649. [Google Scholar]
- Ye, X.Z.; Zhang, M.Z.; Lai, W.F.; Yang, M.M.; Fan, H.H.; Zhang, G.F.; Chen, S.P.; Liu, B. Prediction of Potential Suitable Distribution of Phoebe bournei Based on MaxEnt Optimization Model. Acta Ecol. Sin. 2021, 41, 8135–8144. [Google Scholar] [CrossRef]
- Zhu, G.P.; Qiao, H.J. Effect of the MaxEnt Model’s Complexity on the Prediction of Species Potential Distributions. Biodivers. Sci. 2016, 24, 1189–1196. [Google Scholar] [CrossRef]
- Qiao, S.; Wang, Y.D.; Chen, Y.C.; Zhao, Y.X.; Zeng, W.; Jin, S.M.; Gao, M. Study on the Influence of Climate Change on the Distribution and Future Change of Five Litsea Species. Acta Ecol. Sin. 2025, 45, 1–20. [Google Scholar]
- Yao, W.H.; Wang, Z.H.; Fan, Y.; Liu, D.Y.; Ding, Z.Y.; Zhou, Y.M.; Hu, S.Y.; Zhang, W.; Ou, J. Prediction of Potential Habitat Distributions and Climate Change Impacts on the Rare Species Woonyoungia septentrionalis (Magnoliaceae) in China Based on MaxEnt. Plants 2024, 14, 86. [Google Scholar] [CrossRef] [PubMed]
- Hu, W.; Zhang, Z.Y.; Chen, L.D.; Peng, Y.S.; Wang, X. Changes in Potential Geographical Distribution of Tsoongiodendron odorum Since the Last Glacial Maximum. Chin. J. Plant Ecol. 2020, 44, 44–55. [Google Scholar] [CrossRef]
- Yan, H.Y.; Feng, L.; Zhao, Y.F.; Feng, L.; Wu, D.; Zhu, C.P. Prediction of the Spatial Distribution of Alternanthera philoxeroides in China Based on ArcGIS and MaxEnt. Glob. Ecol. Conserv. 2020, 21, e00856. [Google Scholar] [CrossRef]
- Xu, W.B.; Svenning, J.C.; Chen, G.K.; Zhang, M.G.; Huang, J.H.; Cheng, B.; Ordonez, A.; Ma, K.P. Human Activities Have Opposing Effects on Distributions of Narrow-Ranged and Widespread Plant Species in China. Proc. Natl. Acad. Sci. USA 2019, 116, 26674–26681. [Google Scholar] [CrossRef] [PubMed]
- Staude, I.R.; Navarro, L.M.; Pereira, H.M. Range Size Predicts the Risk of Local Extinction from Habitat Loss. Glob. Ecol. Biogeogr. 2020, 29, 16–25. [Google Scholar] [CrossRef]
- Sanczuk, P.; De Lombaerde, E.; Haesen, S.; Van Meerbeek, K.; Van der Veken, B.; Hermy, M.; Verheyen, K.; Vangansbeke, P.; De Frenne, P. Species Distribution Models and a 60-Year-Old Transplant Experiment Reveal Inhibited Forest Plant Range Shifts Under Climate Change. J. Biogeogr. 2022, 49, 537–550. [Google Scholar] [CrossRef]
- Gan, X.L.; Chang, Y.P.; Jiang, Y.; Cao, F.F.; Zhao, C.Y.; Li, W.B. Impact of Climate Change on Potential Distribution of Amygdalus mongolica in the Qilian Mountains. Acta Ecol. Sin. 2023, 43, 768–776. [Google Scholar] [CrossRef]
- Yang, S.Y.; An, M.T.; Liu, F.; Zhang, Y.; Tian, L.; Chen, C.Y. Prediction of Potential Suitable Area of Phoebe zhennan in Guizhou Province Based on MaxEnt Model. Guihaia 2023, 43, 846–857. [Google Scholar]
- Zhou, R.; Ci, X.Q.; Xiao, J.H.; Cao, G.L.; Li, J. Effects and Conservation Assessment of Climate Change on the Dominant Group—The Genus Cinnamomum of Subtropical Evergreen Broad-Leaved Forests. Biodivers. Sci. 2021, 29, 697–711. [Google Scholar] [CrossRef]
- Zhang, S.F. Prediction of Potential Distribution Area of Cassytha (Lauraceae) Based on MaxEnt Model. J. Sichuan For. Sci. Technol. 2024, 45, 21–32. [Google Scholar]
- Li, W.Q.; Xu, Z.F.; Shi, M.M.; Chen, J.H. Prediction of Potential Geographical Distribution Patterns of Salix tetrasperma Roxb. in Asia Under Different Climate Scenarios. Acta Ecol. Sin. 2019, 39, 3224–3234. [Google Scholar] [CrossRef]
- Liao, Z.Y.; Nobis, M.P.; Xiong, Q.L.; Tian, X.L.; Wu, X.G.; Pan, K.W.; Zhang, A.; Wang, Y.; Zhang, L. Potential Distributions of Seven Sympatric Sclerophyllous Oak Species in Southwest China Depend on Climatic, Non-Climatic, and Independent Spatial Drivers. Ann. For. Sci. 2021, 78, 5. [Google Scholar] [CrossRef]
- Yang, Q.S.; Chen, W.Y.; Xia, K.; Zhou, Z.K. Climatic Envelope of Evergreen Sclerophyllous Oaks and Their Present Distribution in the Eastern Himalaya and Hengduan Mountains. J. Syst. Evol. 2009, 47, 183–190. [Google Scholar] [CrossRef]
- Liu, X.Q.; Bai, M.; He, D.H.; Wang, X.P. Simulating Potential Distribution of Carabus Beetle in the Steppe Based on MaxEnt Model. Acta Ecol. Sin. 2022, 42, 4217–4224. [Google Scholar] [CrossRef]
- Wu, R.R.; Liu, M.Z.; Gu, X.; Chang, X.Y.; Guo, L.Y.; Jiang, G.M.; Qi, R.Y. Prediction of Suitable Habitat Distribution and Potential Impact of Climate Change on Distribution Patterns of Cupressus gigantea. Chin. J. Plant Ecol. 2024, 48, 445–458. [Google Scholar]
- Heinrich, B. Flowering Phenologies: Bog, Woodland, and Disturbed Habitats. Ecology 1976, 57, 890–899. [Google Scholar] [CrossRef]
- Feng, X.P.; Liu, J.F.; He, Z.S.; Zheng, S.Q.; Li, W.Z.; Chen, W.W. Effects of Climatic Factors on Phenological Phases of Flowers and Fruits of the Main Woody Plants in Daiyun Mountain. J. Northwest For. Univ. 2017, 32, 56–61. [Google Scholar]
- Liu, Y.; Wang, H.; Yang, J.; Dao, Z.; Sun, W. Conservation Genetics and Potential Geographic Distribution Modeling of Corybas taliensis, a Small ‘Sky Island’ Orchid Species in China. BMC Plant Biol. 2024, 24, 11. [Google Scholar] [CrossRef] [PubMed]
- Sheldon, K.S.; Yang, S.; Tewksbury, J.J. Climate Change and Community Disassembly: Impacts of Warming on Tropical and Temperate Montane Community Structure. Ecol. Lett. 2011, 14, 1191–1200. [Google Scholar] [CrossRef] [PubMed]
- Fang, J.Y.; Zhu, J.L.; Shi, Y. The Responses of Ecosystems to Global Warming. Chin. Sci. Bull. 2018, 63, 136–140. [Google Scholar] [CrossRef]
- Shen, Y.; Tu, Z.; Zhang, Y.; Zhong, W.; Xia, H.; Hao, Z.; Zhang, C.; Li, H. Predicting the Impact of Climate Change on the Distribution of Two Relict Liriodendron Species by Coupling the MaxEnt Model and Actual Physiological Indicators in Relation to Stress Tolerance. J. Environ. Manag. 2022, 322, 116024. [Google Scholar] [CrossRef] [PubMed]
- Fick, S.E.; Hijmans, R.J. WorldClim 2: New 1-km Spatial Resolution Climate Surfaces for Global Land Areas. Int. J. Climatol. 2017, 37, 4302–4315. [Google Scholar] [CrossRef]
- Morales, N.S.; Fernández, I.C.; Baca-González, V. MaxEnt’s Parameter Configuration and Small Samples: Are We Paying Attention to Recommendations? A Systematic Review. PeerJ 2017, 5, e3093. [Google Scholar] [CrossRef] [PubMed]
- Phillips, S.J.; Anderson, R.P.; Schapire, R.E. Maximum Entropy Modeling of Species Geographic Distributions. Ecol. Model. 2006, 190, 231–259. [Google Scholar] [CrossRef]
- Kumar, D.; Rawat, S. Modeling the Effect of Climate Change on the Distribution of Threatened Medicinal Orchid Satyrium nepalense D.Don in India. Environ. Sci. Pollut. Res. 2022, 29, 72431–72444. [Google Scholar] [CrossRef] [PubMed]
- Yackulic, C.B.; Chandler, R.; Zipkin, E.F.; Royle, J.A.; Nichols, J.D.; Grant, E.H.C.; Veran, S. Presence-Only Modelling Using MaxEnt: When Can We Trust the Inferences? Methods Ecol. Evol. 2013, 4, 236–243. [Google Scholar] [CrossRef]
- Zhou, B.J.; Wang, Y.J.; Ma, C.L.; Fan, Z.F.; Zheng, J.X. Analysis of Potential Habitat of Torreya yunnanensis Based on MaxEnt and ArcGIS. Acta Ecol. Sin. 2022, 42, 4485–4493. [Google Scholar] [CrossRef]
- Chen, B.R.; Zou, H.; Meng, X.H.; Wang, L.X.; Hao, X.L.; Kang, X.; Wang, C.; Zhang, X.X. Prediction of Distribution Pattern and Change of Suitable Areas of Bupleurum chinense and Bupleurum scorzonerifolium Under Climate Change in China. Acta Ecol. Sin. 2022, 42, 8471–8482. [Google Scholar] [CrossRef]
- Guga, S.; Xu, J.; Riao, D.; Li, K.W.; Han, A.R.; Zhang, J.Q. Combining MaxEnt Model and Landscape Pattern Theory for Analyzing Interdecadal Variation of Sugarcane Climate Suitability in Guangxi, China. Ecol. Indic. 2021, 131, 108152. [Google Scholar] [CrossRef]
- Zhao, G.; Cui, X.; Sun, J.; Li, T.; Wang, Q.; Ye, X.; Fan, B. Analysis of the Distribution Pattern of Chinese Ziziphus jujuba Under Climate Change Based on Optimized biomod2 and MaxEnt Models. Ecol. Indic. 2021, 132, 108256. [Google Scholar] [CrossRef]
- Cong, M.; Xu, Y.; Tang, L.; Yang, W.; Jian, M. Predicting the Dynamic Distribution of Sphagnum Bogs in China Under Climate Change Since the Last Interglacial Period. PLoS ONE 2020, 15, e0230969. [Google Scholar] [CrossRef] [PubMed]
Disclaimer/Publisher’s Note: The statements, opinions and data contained in all publications are solely those of the individual author(s) and contributor(s) and not of MDPI and/or the editor(s). MDPI and/or the editor(s) disclaim responsibility for any injury to people or property resulting from any ideas, methods, instructions or products referred to in the content. |
© 2025 by the authors. Licensee MDPI, Basel, Switzerland. This article is an open access article distributed under the terms and conditions of the Creative Commons Attribution (CC BY) license (https://creativecommons.org/licenses/by/4.0/).