Abstract
Crataegus monogyna, commonly known as hawthorn, is a valuable plant in pharmaceutical production. Its flowers, leaves, and fruits are rich in antioxidants. This study explores the application of pulsed electric field (PEF) for enhanced extraction of bioactive compounds from C. monogyna leaves. The liquid-to-solid ratio, solvent composition (ethanol, water, and 50% v/v aqueous ethanol), and key PEF parameters—including pulse duration, pulse period, electric field intensity, and treatment duration—were investigated during the optimization process. To determine the optimal extraction conditions and their impact on antioxidant activity, response surface methodology (RSM) with a six-factor design was employed. The total polyphenol content in the optimized extract was 244 mg gallic acid equivalents/g dry weight, while individual polyphenols were analyzed using high-performance liquid chromatography coupled with a diode array detector (HPLC-DAD). Furthermore, antioxidant activity was assessed using ferric-reducing antioxidant power (FRAP) and DPPH radical scavenging assays, yielding values of 3235 and 1850 μmol ascorbic acid equivalents/g dry weight, respectively. Additionally, correlation analyses were conducted to evaluate the interactions between bioactive compounds and antioxidant capacity. Compared to other extraction techniques, PEF stands out as an eco-friendly, non-thermal standalone method, offering a sustainable approach for the rapid production of health-promoting extracts from C. monogyna leaves.
1. Introduction
Polyphenols constitute a class of plant secondary metabolites characterized by great structural and functional diversity [1]. They are found in various plant-derived sources, such as fruits (berries, watermelon, apples, grapes, etc.), vegetables (soybeans, onions, etc.), and cereals, as well as in beverages like coffee, red wine, and juices [1,2]. Polyphenolic compounds encompass phenols, flavonoids, phenolic acids, proanthocyanidins, tannins, lignans, coumarins, and stilbenes, which occur in different parts of plants, such as leaves, flowers, roots, and shoots [3,4]. They have attracted considerable scientific interest for their potent antioxidant activity, primarily because they can reduce oxidative stress and neutralize free radicals [5], effects which, in turn, contribute to the prevention of chronic diseases such as cardiovascular disorders, neurodegenerative conditions, and certain types of cancer [1,6]. The food, pharmaceutical, and cosmetic industries have begun to utilize phenolic compounds more frequently in recent years because of their antibacterial, anti-inflammatory, and antioxidant characteristics [3,7]. The development and improvement of technologies for extracting and purifying these compounds from plant materials, foods, and food-industry by-products reflect the increasing interest in these compounds and their potential uses [3].
Among plants rich in polyphenols is C. monogyna (CM) Jacq., commonly known as the hawthorn [8,9]. Its scientific name derives from the Greek word “kràtaigos,” meaning “strength and robustness,” in reference to its hard, durable wood [10]. Hawthorn is a deciduous shrub with distinctive white flowers and red berries [8]. It is endemic to temperate regions of the Northern Hemisphere, including Europe, Asia, and North Africa, and has a long history of use in folk medicine for its cardioprotective and neuroprotective properties [8,9]. The fruits, leaves, and flowers of CM are rich in phenolic compounds, including flavonoids such as rutin, quercetin 3-D-galactoside (hyperoside), and vitexin, as well as other constituents such as vitamin C, saponins, tannins, cardiotonic amines (e.g., phenylethylamine, tyramine), procyanidins, triterpenoid acids (e.g., ursolic acid), and purine derivatives (e.g., adenosine, guanine) [4,8,11,12,13]. The bioactive profile of hawthorn has been linked to antioxidant, hypolipidemic, anti-inflammatory, and neuroprotective activities, underscoring its potential for applications in food, pharmaceutical, and cosmetic formulations [8,9,14].
Extraction is a pivotal step in the chemical analysis of plant samples, necessary for sample preparation and the isolation of bioactive compounds from plant tissue [15]. Various extraction techniques for bioactive compounds are reported in the literature, with solid–liquid extraction among the most common for isolating plant antioxidants [16]. Today, extraction methods are broadly classified as conventional or non-conventional [17]. In conventional approaches, bioactive substances are removed from plant material using traditional solvents (with optional heating) [16]. The sample is first homogenized and then immersed in a single solvent or solvent mixture under continuous agitation, allowing the target compounds to diffuse and transfer into the solvent [16,18]. Traditional methods—including percolation, maceration, and Soxhlet extraction—rely on straightforward procedures to isolate specific constituents and produce crude extracts [15]. These extracts may be used directly or formulated into herbal medicines, dietary supplements, and cosmetic ingredients [15,19,20,21]. However, conventional techniques suffer from drawbacks such as long extraction times, low yield, loss of nutrients, high solvent and energy consumption, and often require multiple extraction steps [22,23]. Moreover, heating can degrade or alter heat-sensitive phytochemicals [22].
By contrast, modern extraction methods achieve higher yields and greater selectivity [15]. These methods encompass ultrasound-assisted extraction, microwave-assisted extraction, pressurized liquid extraction, supercritical fluid extraction, pulsed electric field extraction, and enzymatic extraction [15,23]. The use of “green” solvents further transforms these approaches into environmentally friendly extraction techniques [24]. In recent years, numerous laboratory-scale studies employing such green methods have yielded high-value extracts from plant materials [25].
To overcome the limitations of both conventional and current green methods, advanced non-thermal technologies have been developed, among which PEF extraction stands out as a promising and efficient alternative. PEF applies short electric pulses that permeabilize cell membranes by creating pores [26]. Its advantages over other techniques include ultrashort processing times (nanoseconds to milliseconds), enhanced extraction efficiency (greater membrane permeability), reduced energy consumption, preservation of cellular structure, and higher quality of the final extracts [26].
Optimization of extraction parameters is essential to maximize yield while preserving the integrity of bioactive compounds. Response surface methodology (RSM)—a combined statistical and mathematical approach—provides an effective framework for modeling and optimizing extraction processes [27]. RSM enables simultaneous evaluation of multiple independent variables to identify optimal conditions with fewer experimental runs than traditional methods.
The objective of this study is to identify optimal conditions for PEF-assisted polyphenol extraction from CM leaves utilizing RSM. Key extraction parameters, such as electric field intensity, pulse duration, solvent concentration, and extraction time, will be tuned by RSM. The Folin–Ciocalteu assay will quantify total polyphenol content (TPC), high-performance liquid chromatography coupled with a diode array detector (HPLC-DAD) will identify individual phenolic compounds, and DPPH radical scavenging activity and ferric-reducing antioxidant power (FRAP) assays will evaluate antioxidant activity.
2. Results and Discussion
2.1. Extraction Parameters Optimization
Regarding sustainability, extraction methods such as PEF treatment require lower energy use compared to conventional processes [28]. The distinctive brevity of the PEF-based extraction method aids in energy conservation. Furthermore, many processing parameters in conjunction with the extraction procedure may considerably influence both the extract yield and antioxidant efficacy [29]. The essential PEF parameters include electric field strength, pulse width, pulse duration, and treatment duration. Furthermore, all extractions are influenced by the solvent composition, owing to the varying polarity of bioactive compounds and the liquid-to-solid ratio. Consequently, all these parameters merit examination. Table 1 illustrates the impact of the investigated variables on the analyzed responses, whereas Table 2 displays the ANOVA results applied to the RSM quadratic polynomial model.

Table 1.
The experimental results elucidate the links between the six independent factors analyzed and the associated responses of the dependent variables.

Table 2.
The variance analysis (ANOVA) for the quadratic polynomial model used in the response surface methodology.
2.2. Model Analysis
Regression models relevant to the extraction process are shown in Equations (1)–(3), which predict the following critical response variables: TPC, FRAP, and DPPH radical scavenging activity. The complex interplay between the various experimental variables is highlighted by the fact that each equation contains both linear and quadratic components, as well as an interaction component. Only important terms are included in the models. Extraction efficiency is emphasized by the regression models as being affected by solvent composition, extraction temperature, and time. Optimal conditions for optimum antioxidant output are suggested by the linear and quadratic components, which show nonlinear correlations among elements. An important element that affects the FRAP and DPPH equations is the extraction duration (X4). There needs to be careful parameter optimization because the presence of interaction terms shows that antioxidant potential is affected by the cumulative impact of multiple variables. Bioactive compounds, such as antioxidants, can be dissolved into the solvent in greater amounts when the extraction time is prolonged. An ideal range for extraction time is indicated by the presence of quadratic terms (X12, X42, X52, and X62) and interactions (X1X4, X1X6 and X1X3, X4X6, etc.); a shorter duration may limit compound release, while a longer duration may cause degradation or reduced efficiency.
TPC = 337.87 − 654.38X1 − 0.02X2 + 5.28X3 + 2.21X4 − 4.06X5 − 13.14X6 + 371.55X12 − 0.04X32 − 0.01X42 + 0.04X52 + 0.19X62 − 2.74X1X4 + 2.73X1X5 + 5.68X1X6 − 0.0003X2X4 + 0.004X2X6 − 0.053X3X6 + 0.007X4X5 + 0.034X4X6
FRAP = 6095.75 − 7218.12X1 − 0.96X2 − 18.06X3 − 3.17X4 − 17.22X5 + 3.43X6 + 3485.51X12 − 0.21X42 + 0.10X52 + 22.20X1X3 + 12.17X1X5 + 0.008X2X3 − 0.0037X2X4 + 0.019X2X5 + 0.016X2X6 + 0.039X3X4 − 0.057X3X5 − 0.387X3X6 + 0.057X4X5 + 0.434X4X6 − 0.339X5X6
DPPH = 6223.05 − 9594.53X1 − 0.86X2 − 21.94X3 − 4.95X4 − 13.75X5 + 5.77X6 + 5302.51X12 − 0.15X42 + 0.08X52 + 0.46X1X2 + 16.22X1X3 + 0.007X2X3 − 0.0015X2X4 + 0.011X2X5 + 0.068X3X4 + 0.054X3X5 − 0.10X3X6 + 0.116X4X5 + 0.250X4X6 − 0.352X5X6
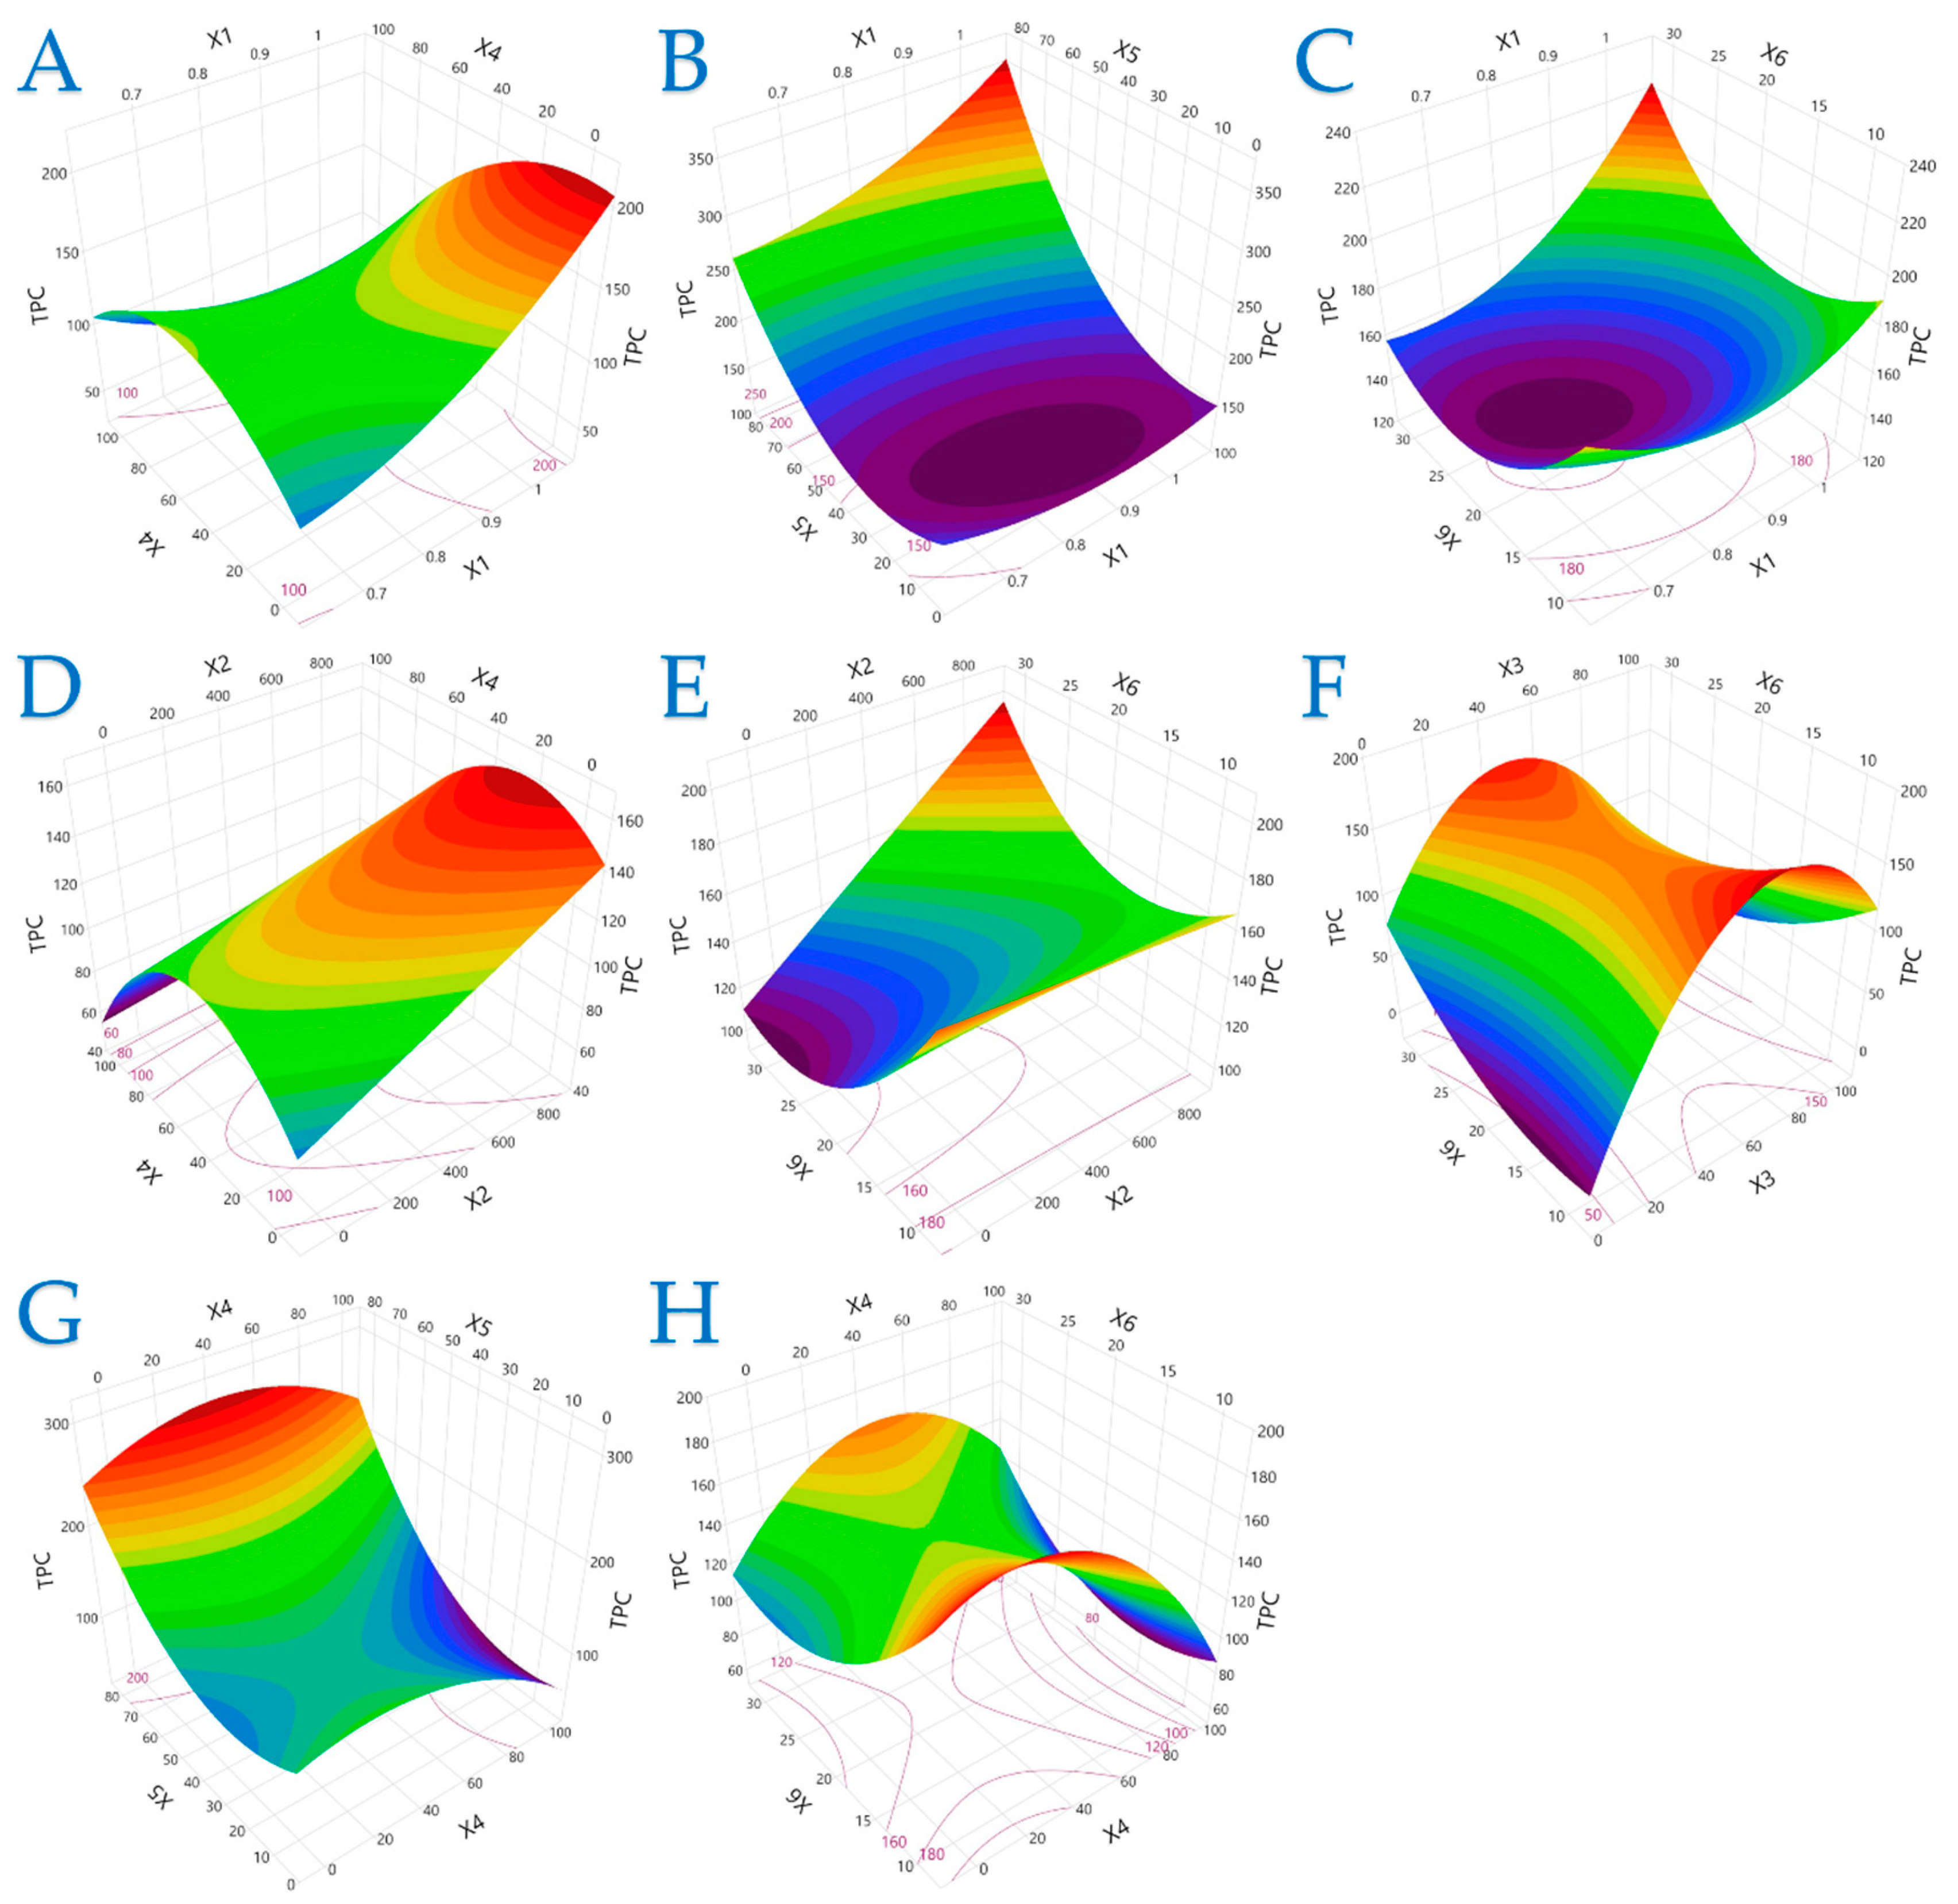
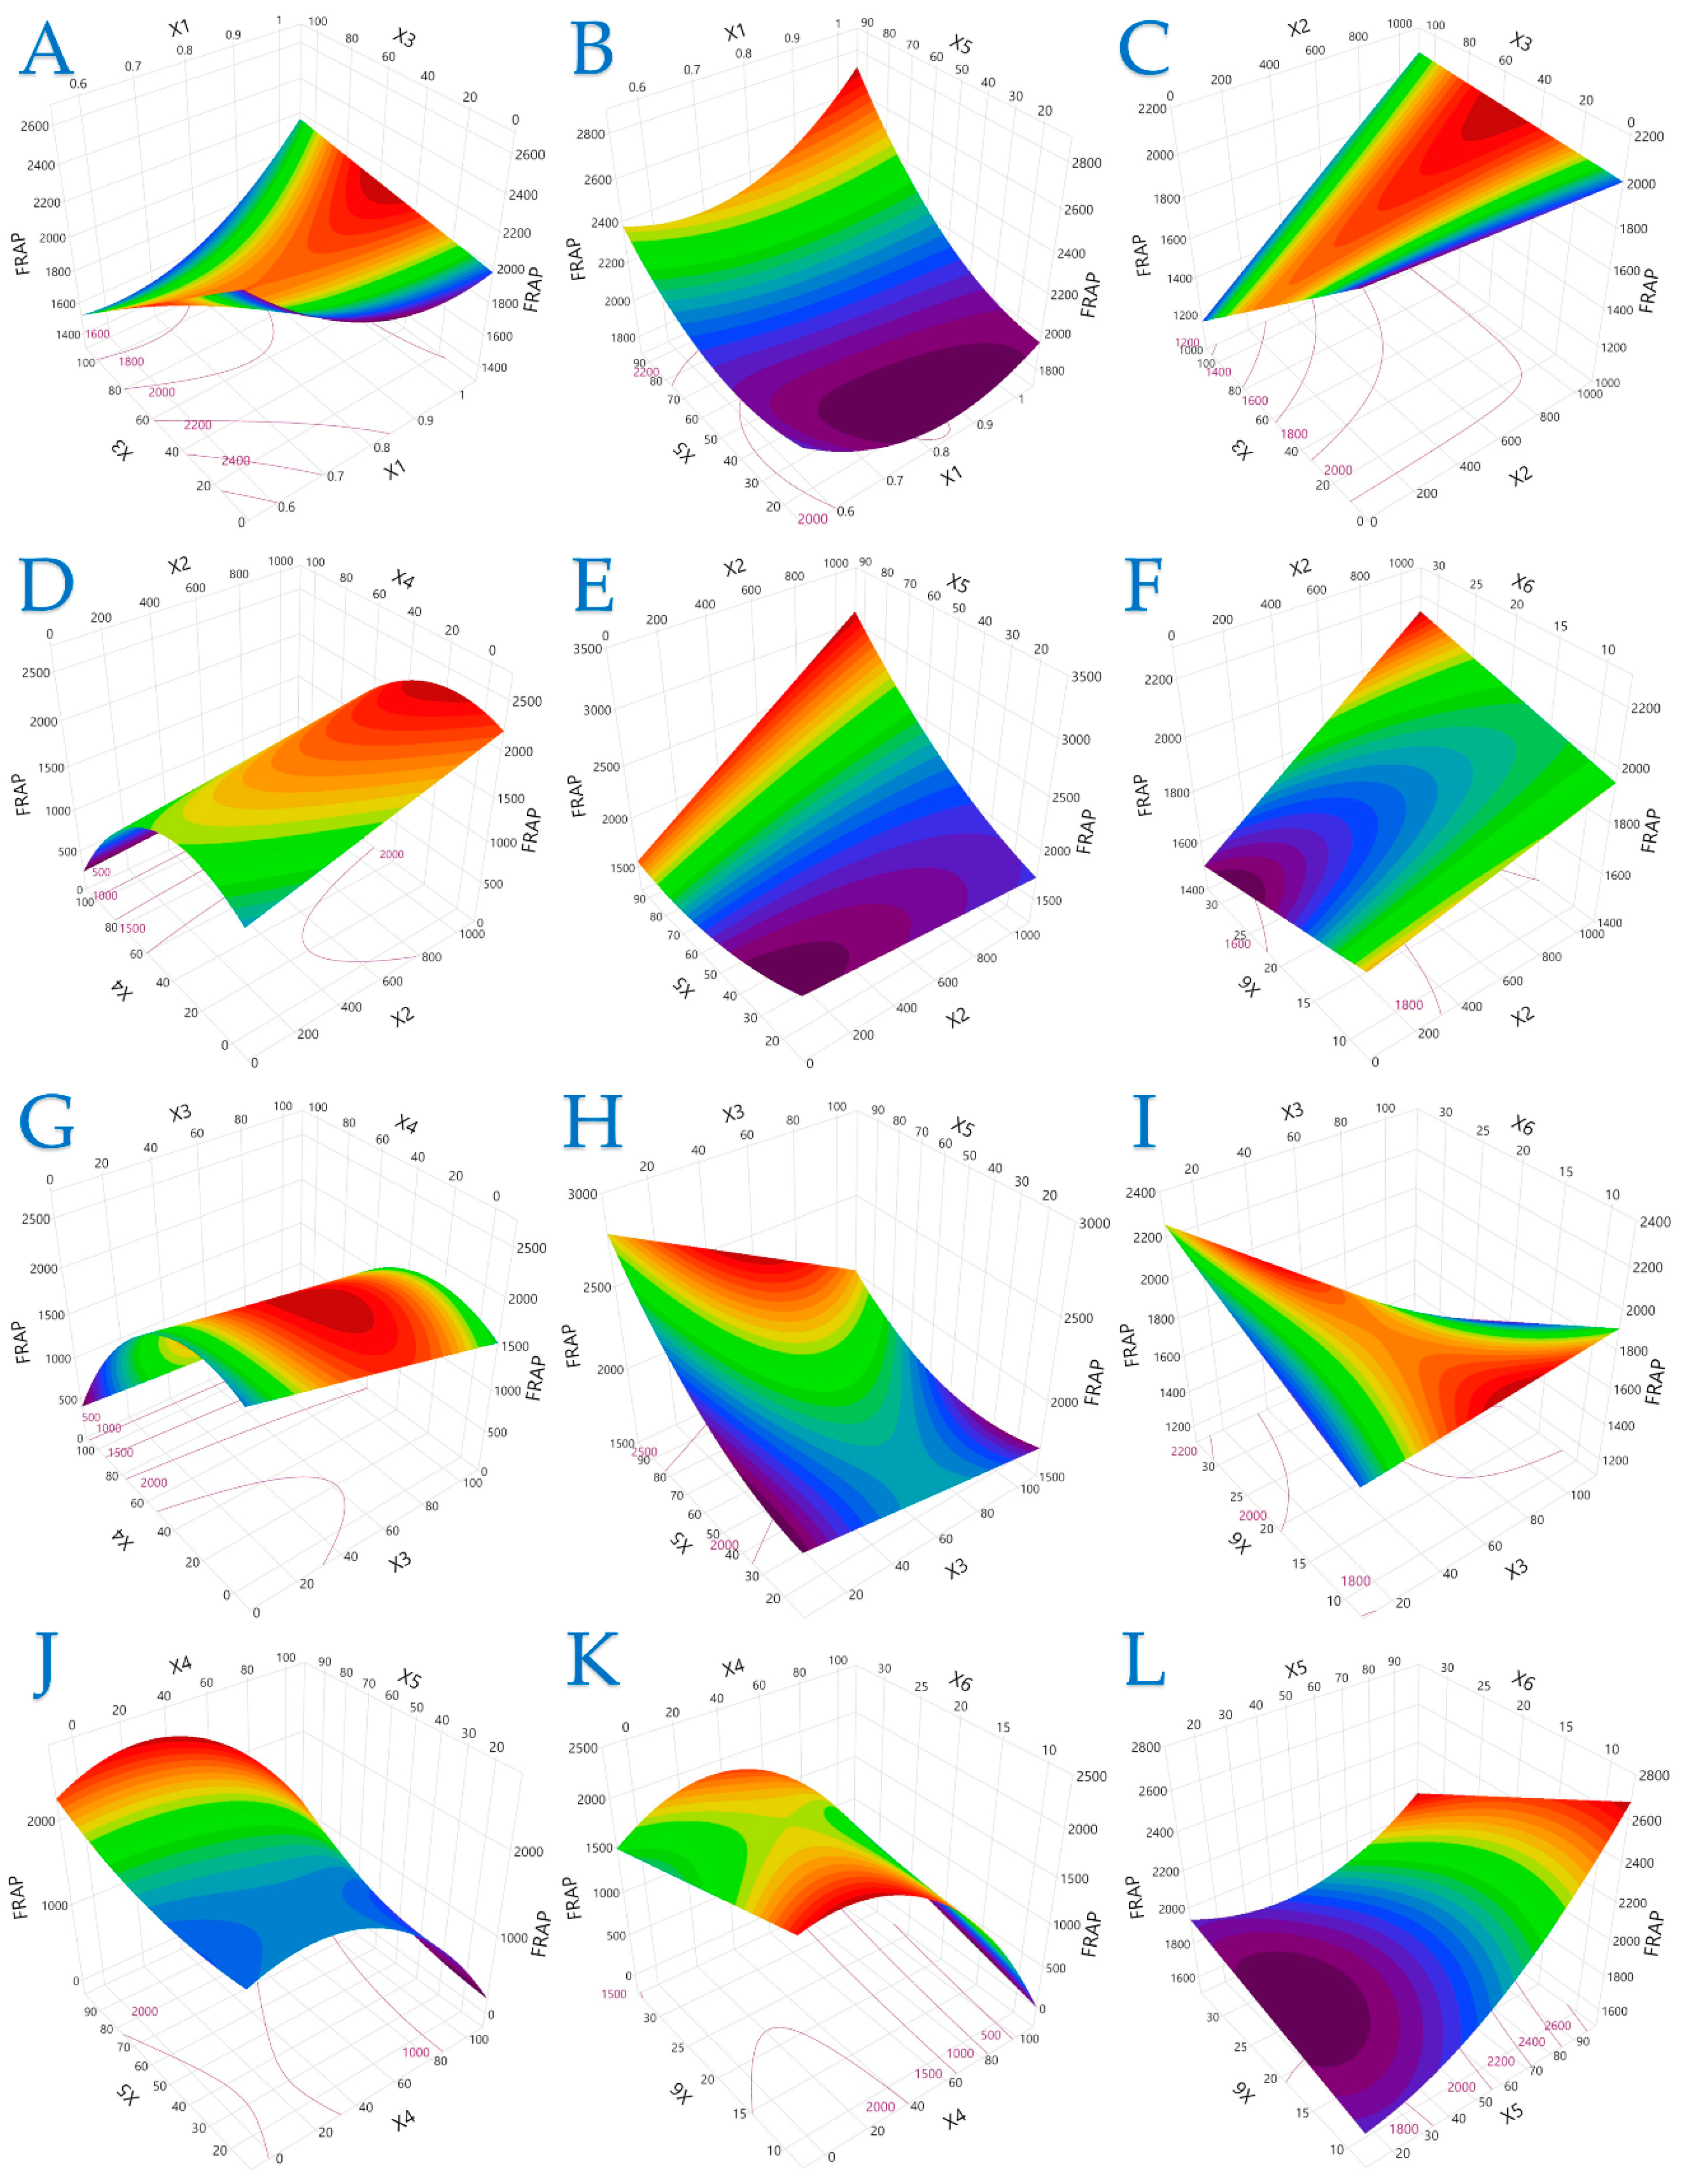
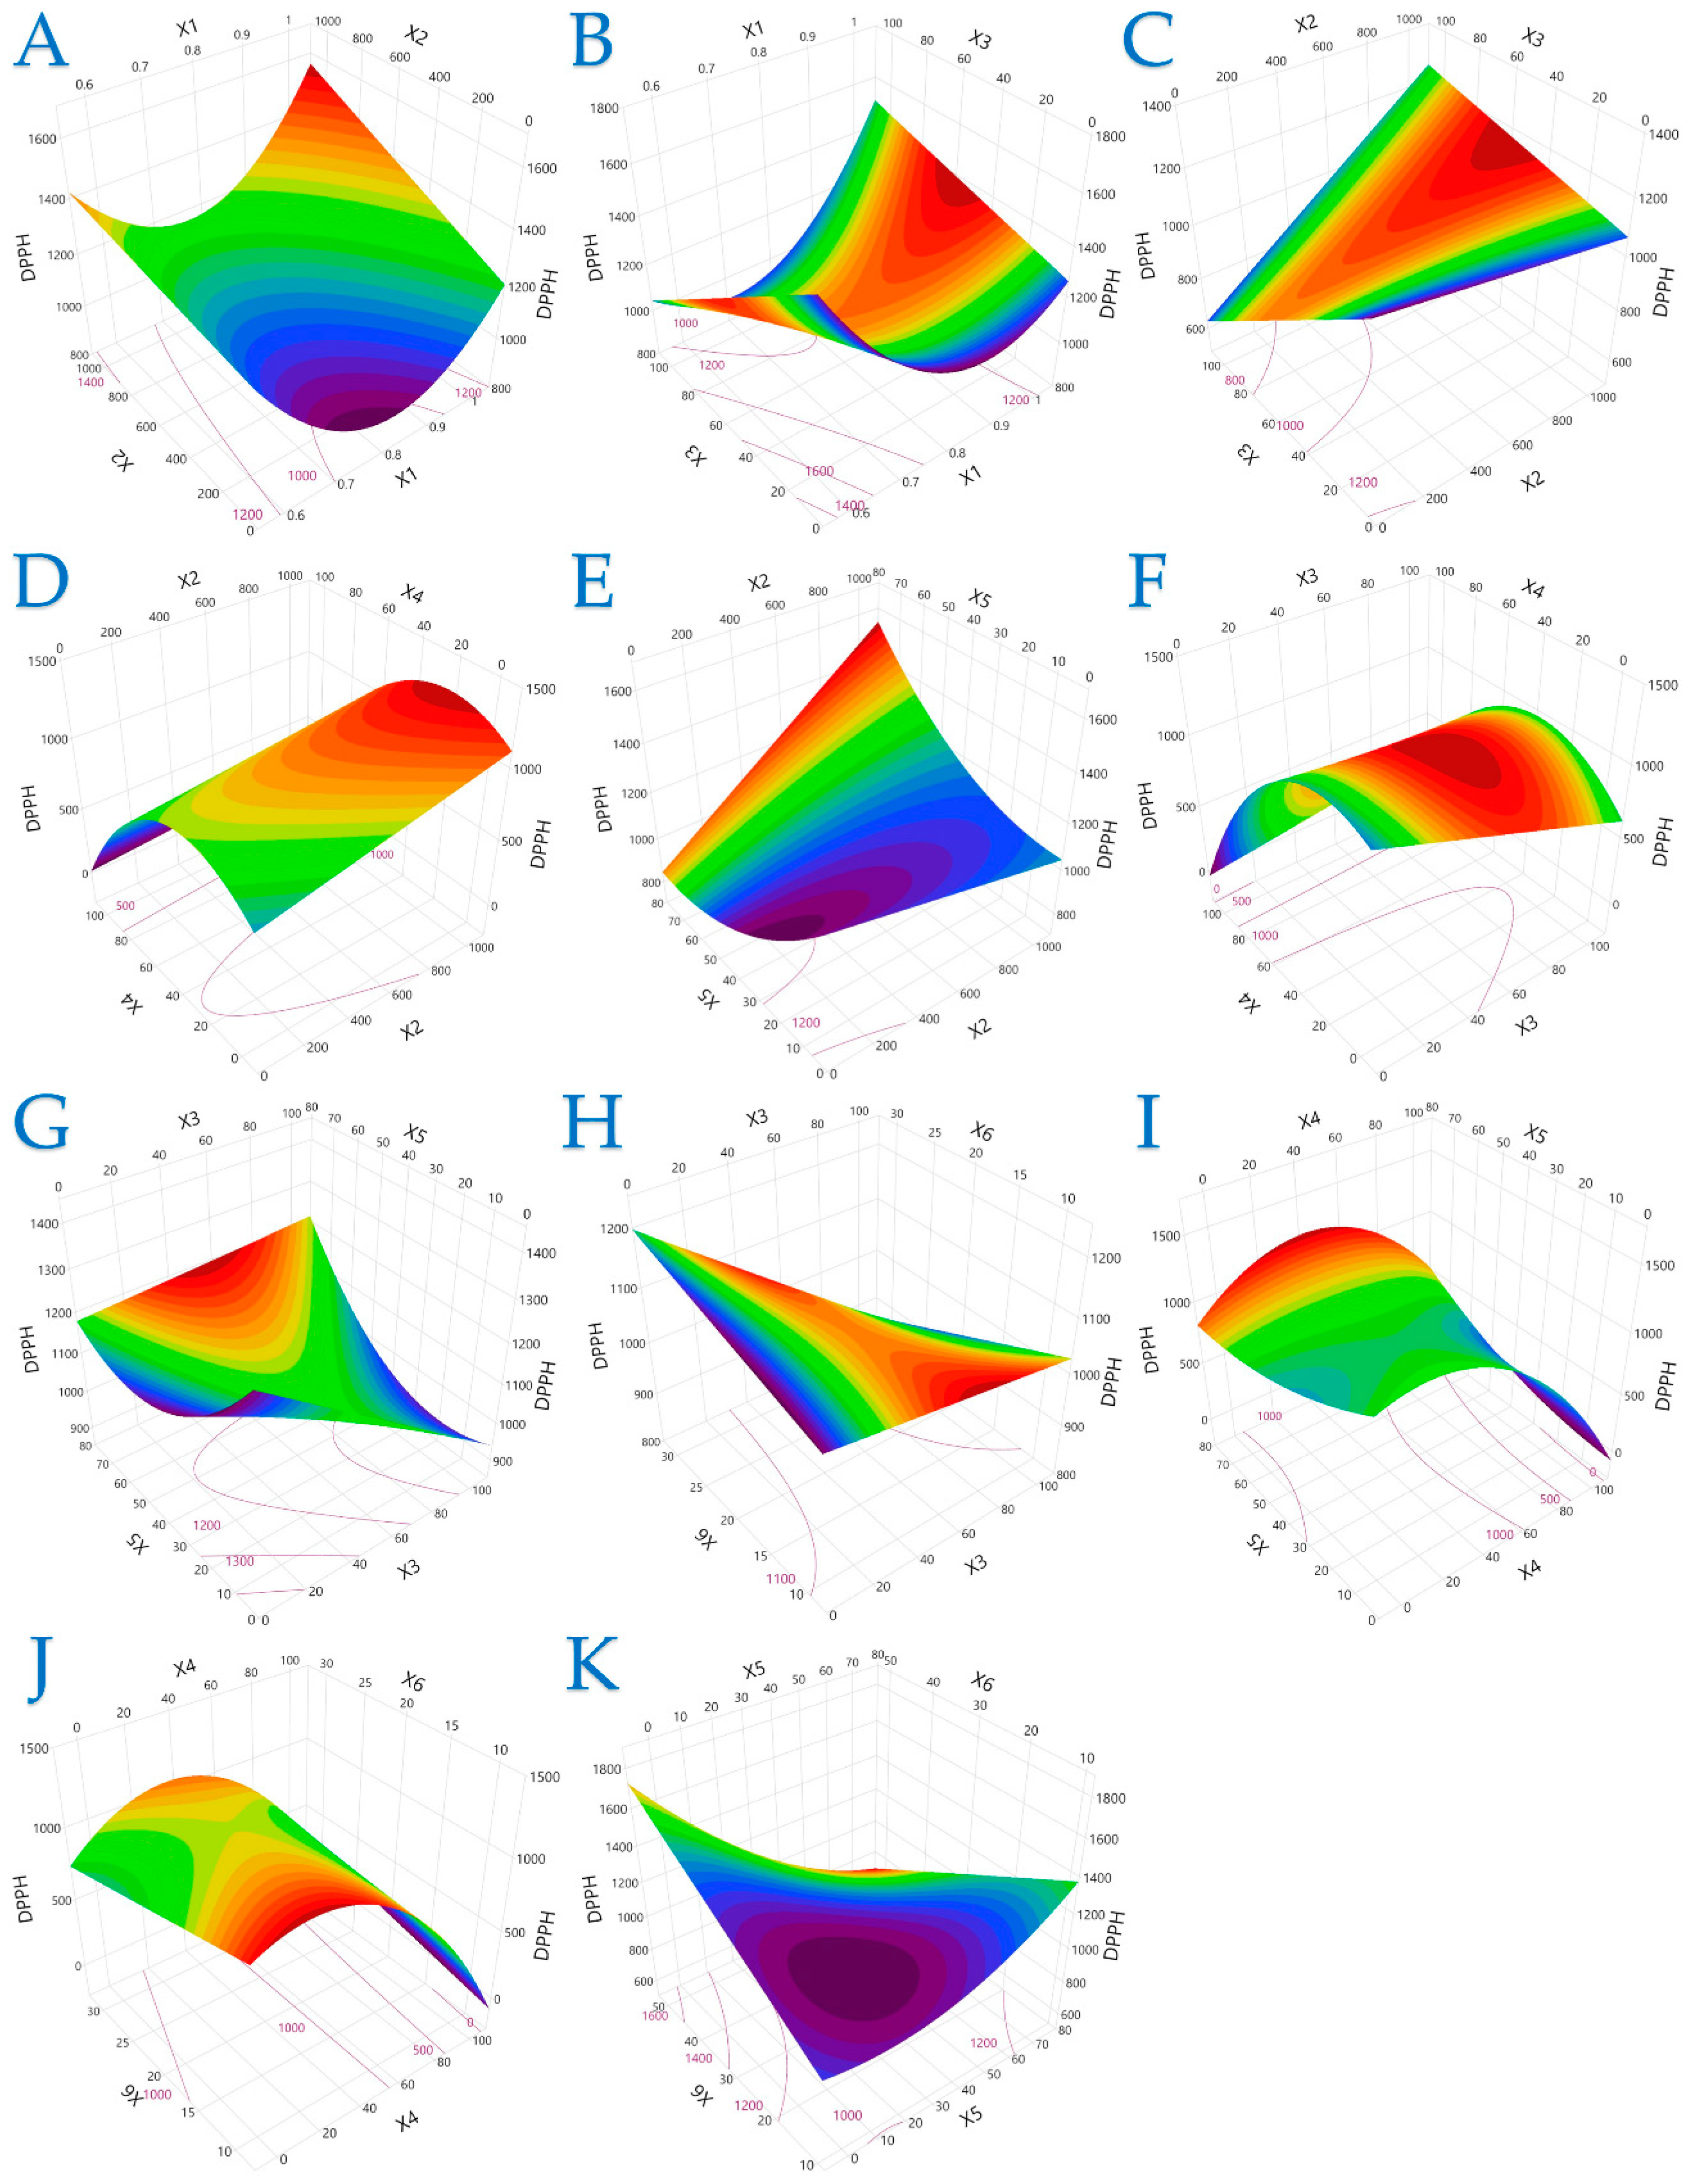
The 3D plots in Figure 1, Figure 2 and Figure 3 elucidate the combined influence of extraction parameters on three key antioxidant metrics: TPC, FRAP, and DPPH. Overall, these visualizations highlight the nonlinear behavior of bioactive compound recovery and underscore the importance of parameter optimization in PEF-assisted extraction.
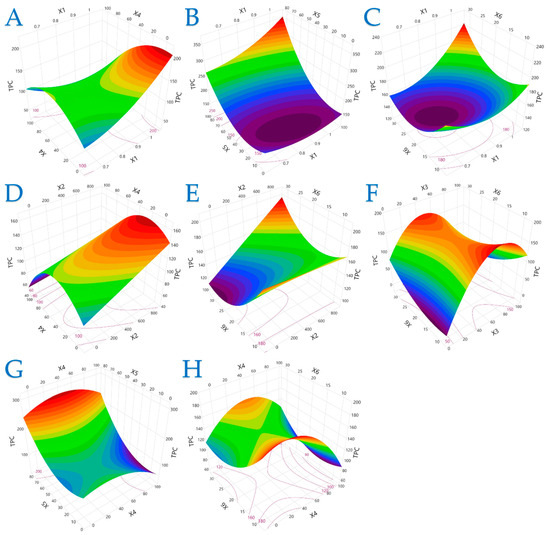
Figure 1.
For TPC (mg GAE/g dw), plot (A) represents the interaction of X1 (electric field strength) and X4 (solvent concentration); plot (B) shows the interaction of X1 and X5 (liquid-to-solid ratio); plot (C) illustrates the interaction of X1 and X6 (extraction time); plot (D) shows the interaction of X2 (pulse period) and X4; plot (E) presents the interaction of X2 and X6; plot (F) illustrates the interaction of X3 (pulse duration) and X6; plot (G) represents the interaction of X4 and X5; and plot (H) depicts the interaction of X4 and X6.
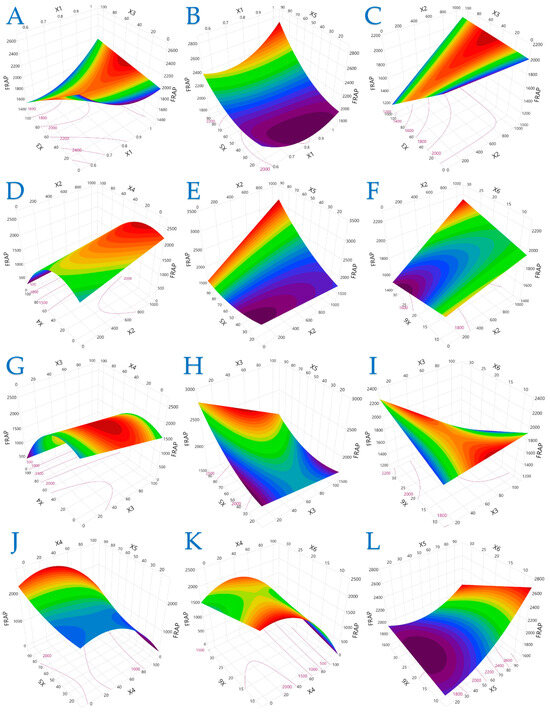
Figure 2.
For FRAP (μmol AAE/g dw), plot (A) represents the interaction of X1 (electric field strength) and X3 (pulse duration); plot (B) shows the interaction of X1 and X5 (liquid-to-solid ratio); plot (C) illustrates the interaction of X2 (pulse period) and X3; plot (D) shows the interaction of X2 and X4 (solvent concentration); plot (E) presents the interaction of X2 and X5; plot (F) illustrates the interaction of X2 and X6 (extraction time); plot (G) represents the interaction of X3 and X4; plot (H) depicts the interaction of X3 and X5; plot (I) illustrates the interaction of X3 and X6; plot (J) represents the interaction of X4 and X5; plot (K) illustrates the interaction of X4 and X6; and plot (L) illustrates the interaction of X5 and X6.
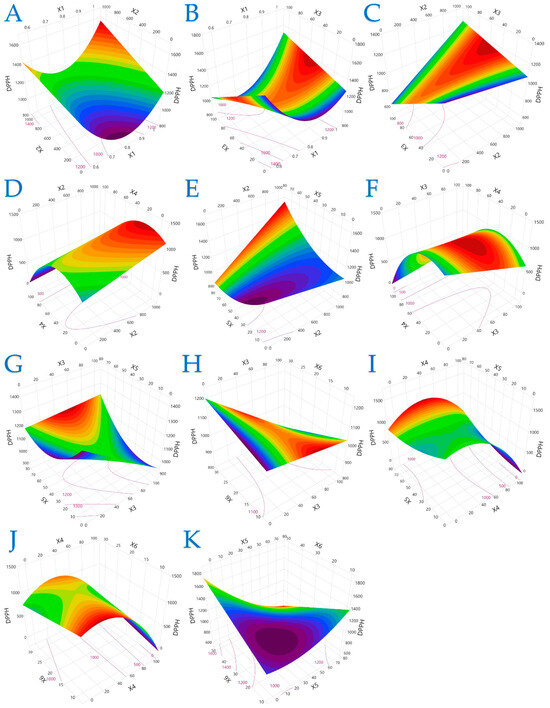
Figure 3.
For DPPH (μmol AAE/g dw), plot (A) represents the interaction of X1 (electric field strength) and X2 (pulse period); plot (B) shows the interaction of X1 and X3 (pulse duration); plot (C) illustrates the interaction of X2 and X3; plot (D) shows the interaction of X2 and X4 (solvent concentration); plot (E) presents the interaction of X2 and X5 (liquid-to-solid ratio); plot (F) illustrates the interaction of X3 and X4; plot (G) represents the interaction of X3 and X5; plot (H) depicts the interaction of X3 and X6 (extraction time); plot (I) illustrates the interaction of X4 and X5; plot (J) represents the interaction of X4 and X6; and plot (K) illustrates the interaction of X5 and X6.
Figure 1 demonstrates that TPC is most responsive to moderate electric field strength and mid-range ethanol concentrations. Excessive ethanol (100%) notably suppressed TPC yield, reinforcing that solvent polarity must match the compound profile to ensure efficient extraction. Additionally, high liquid-to-solid ratios and shorter extraction times under optimal PEF conditions significantly enhanced polyphenol release, likely due to improved cell disruption and diffusion kinetics.
Figure 2 extends these observations to FRAP values, revealing that longer pulse periods combined with moderate solvent concentrations amplify antioxidant power. Interactions between pulse parameters (duration and period) and physical conditions (extraction time and solvent composition) play a pivotal role in maximizing FRAP. The data suggest that electron-donating phenolics may be more susceptible to variations in time and electrical input, supporting the need for precise control during process scale-up.
Figure 3 offers a more complex picture of DPPH radical scavenging activity, where the response was less predictable across variable combinations. While longer pulse periods and intermediate ethanol levels often led to enhanced radical scavenging performance, the model also identified parameter regions where lower or higher values had better outcomes. This complexity may stem from the diverse structural properties of antioxidant compounds and their varying sensitivity to treatment conditions.
Table 3 consolidates the predictive modeling results, presenting the optimal conditions for each response with corresponding desirability values—0.9978 for TPC, 0.9930 for FRAP, and 0.9980 for DPPH—indicating robust statistical fit. However, a key observation is the divergence in parameter settings required to optimize each assay: for instance, FRAP peaked under lower ethanol concentration and shorter extraction time, whereas TPC favored higher field strength and prolonged pulse duration. This divergence highlights the trade-offs inherent in multi-response optimization and justifies the use of statistical tools like RSM and stepwise regression to navigate the multidimensional design space.

Table 3.
Optimal extraction conditions and maximum anticipated responses for the dependent variables.
2.3. Influence of Extraction Parameters on Assays via Pareto Plot Analysis
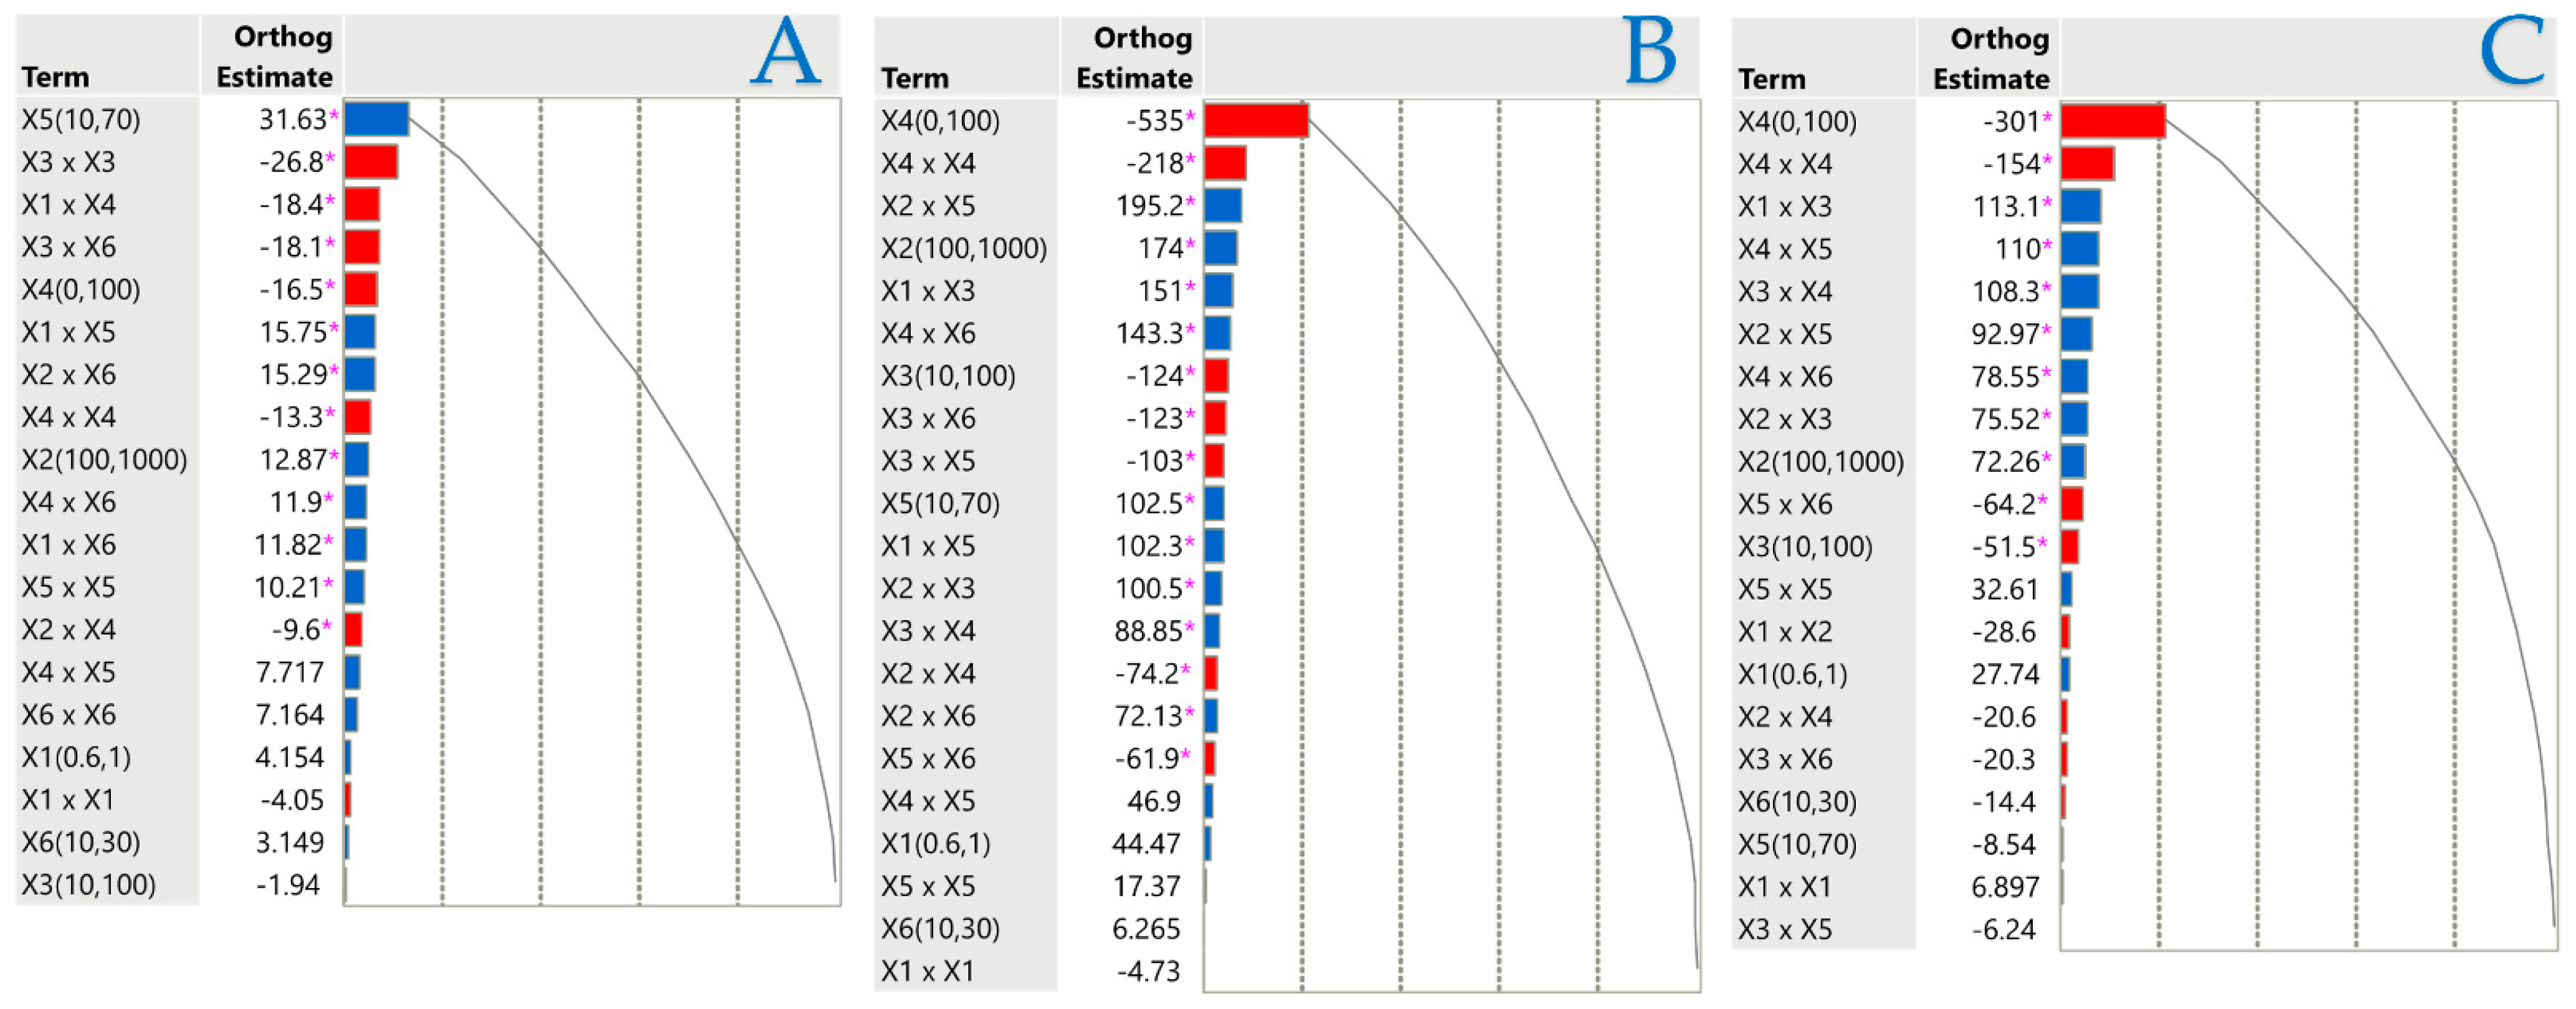
Orthogonal estimates serve as a prevalent statistical instrument for assessing the relative significance of many components in a Pareto plot, aiming to diminish intercorrelation. This strategy facilitates the identification of which factors exerted the most significant influence on a specific outcome by maintaining the separation of estimates. Regression analysis and experimental design often utilize orthogonal estimates to improve the accuracy of parameter estimation. They are effective in reducing the probability of bias and ensuring that inter-variable interactions do not influence the calculated effects. A normalized Pareto plot was utilized to evaluate the principal effects and their interactions based on statistical significance (p < 0.05). Figure 4 illustrates the independent variables and their interactions that influenced the results under investigation. According to Pareto plot analysis, the liquid–solid ratio (X5) had a positive effect on TPC, while most other factors had a minimal effect on extraction efficiency. The concentration of the solvent adversely impacted both FRAP and DPPH, reaffirming the significance of the polarity of the target compounds and the composition of the solvent in their recovery efficiency. Regarding PEF parameters, electric field strength (X1) had no significant effect on any response, pulse period (X2) significantly affected only FRAP and DPPH, and pulse duration (X3) negatively affected only DPPH.
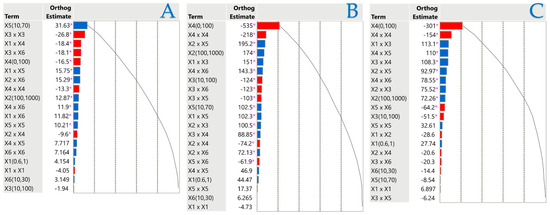
Figure 4.
Pareto graphs reveal the importance of each parameter estimate in the stirring extraction method for TPC (A), FRAP (B), and DPPH tests (C). The graphs denote statistical significance with a pink asterisk (p < 0.05), with positive values illustrated by blue bars and negative values by red bars.
2.4. Principal Component Analysis (PCA) and Multivariate Component Analysis (MCA)
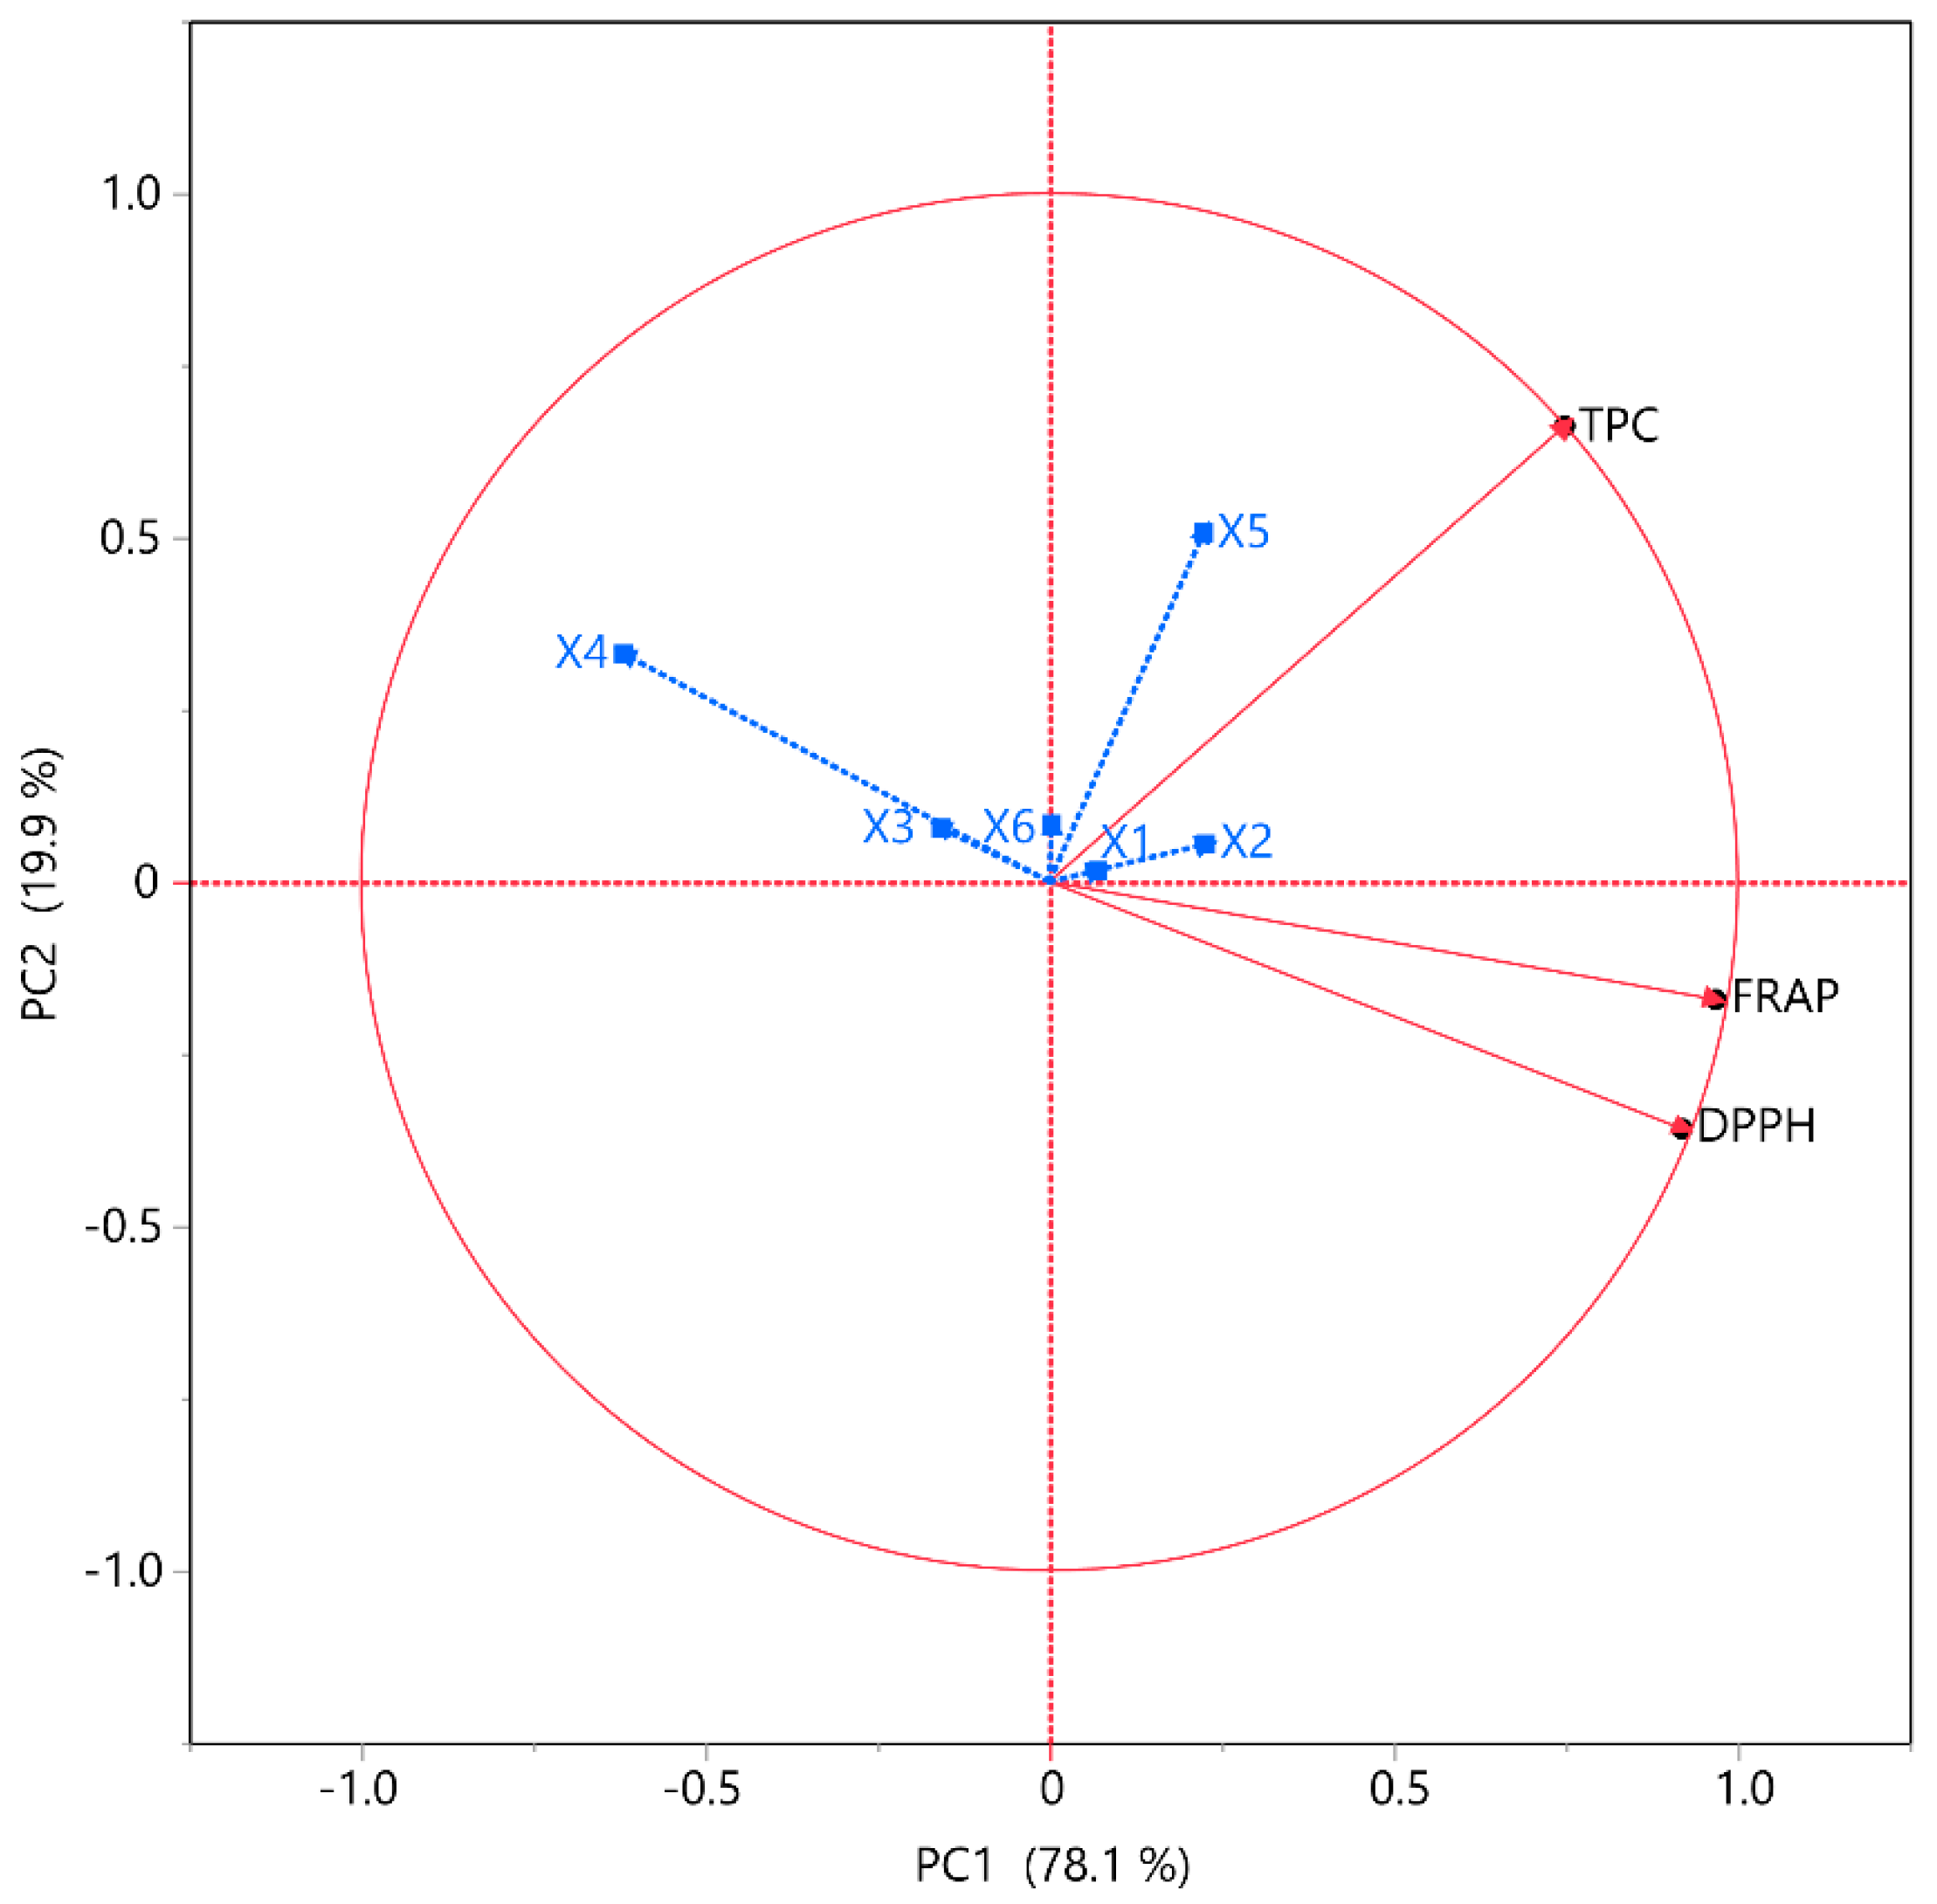
The associations between the tests and extraction conditions were further analyzed through correlation analyses, including PCA and MCA, as depicted in Figure 5 and detailed in Table 4, respectively. The objective of PCA, a dimensionality reduction technique, is to condense a dataset with numerous interrelated factors into a smaller collection of uncorrelated variables. These pieces are meticulously selected to represent the data’s most significant variations. Numerous fields utilize PCA for data preprocessing, visualization, and investigation. The MCA further clarifies the interdependence among variables. The primary advantage of this method is determining the strength of the positive or negative correlation between the examined variables. Correlation studies were performed to determine the correlations between the variables and TPC, FRAP, and DPPH within the framework of PCA. The data indicated that PC1 and PC2 contributed 78.1% and 19.9%, respectively, accounting for 98% of the total variance. The analysis was found to be substantially affected by the independent variables. According to PCA, X3, X4, and X6 exhibited a negative correlation with all the other responses, while X1, X2, and X5 showed a positive correlation with TPC but a negative one with both antioxidant assays. Previous studies also demonstrated that an increase in ethanol concentration restricted high recoveries on TPC, FRAP, and DPPH [30]. The results of MCA also reinforced the claim that TPC opposes FRAP, and DPPH. More specifically, TPC demonstrated a moderate correlation (~0.60) with FRAP but a particularly low correlation with DPPH (~0.46), while FRAP and DPPH had a strong correlation with each other (~0.92).
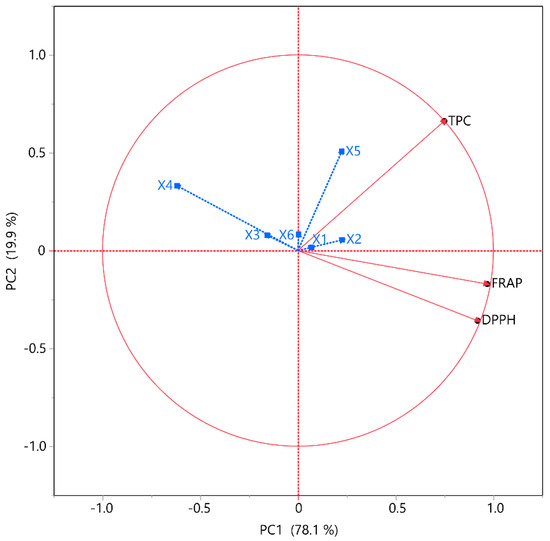
Figure 5.
PCA for the assessed variables. Each X variable is depicted in blue.

Table 4.
Multivariate correlation analysis of assessed variables.
2.5. Partial Least Squares (PLS) Analysis
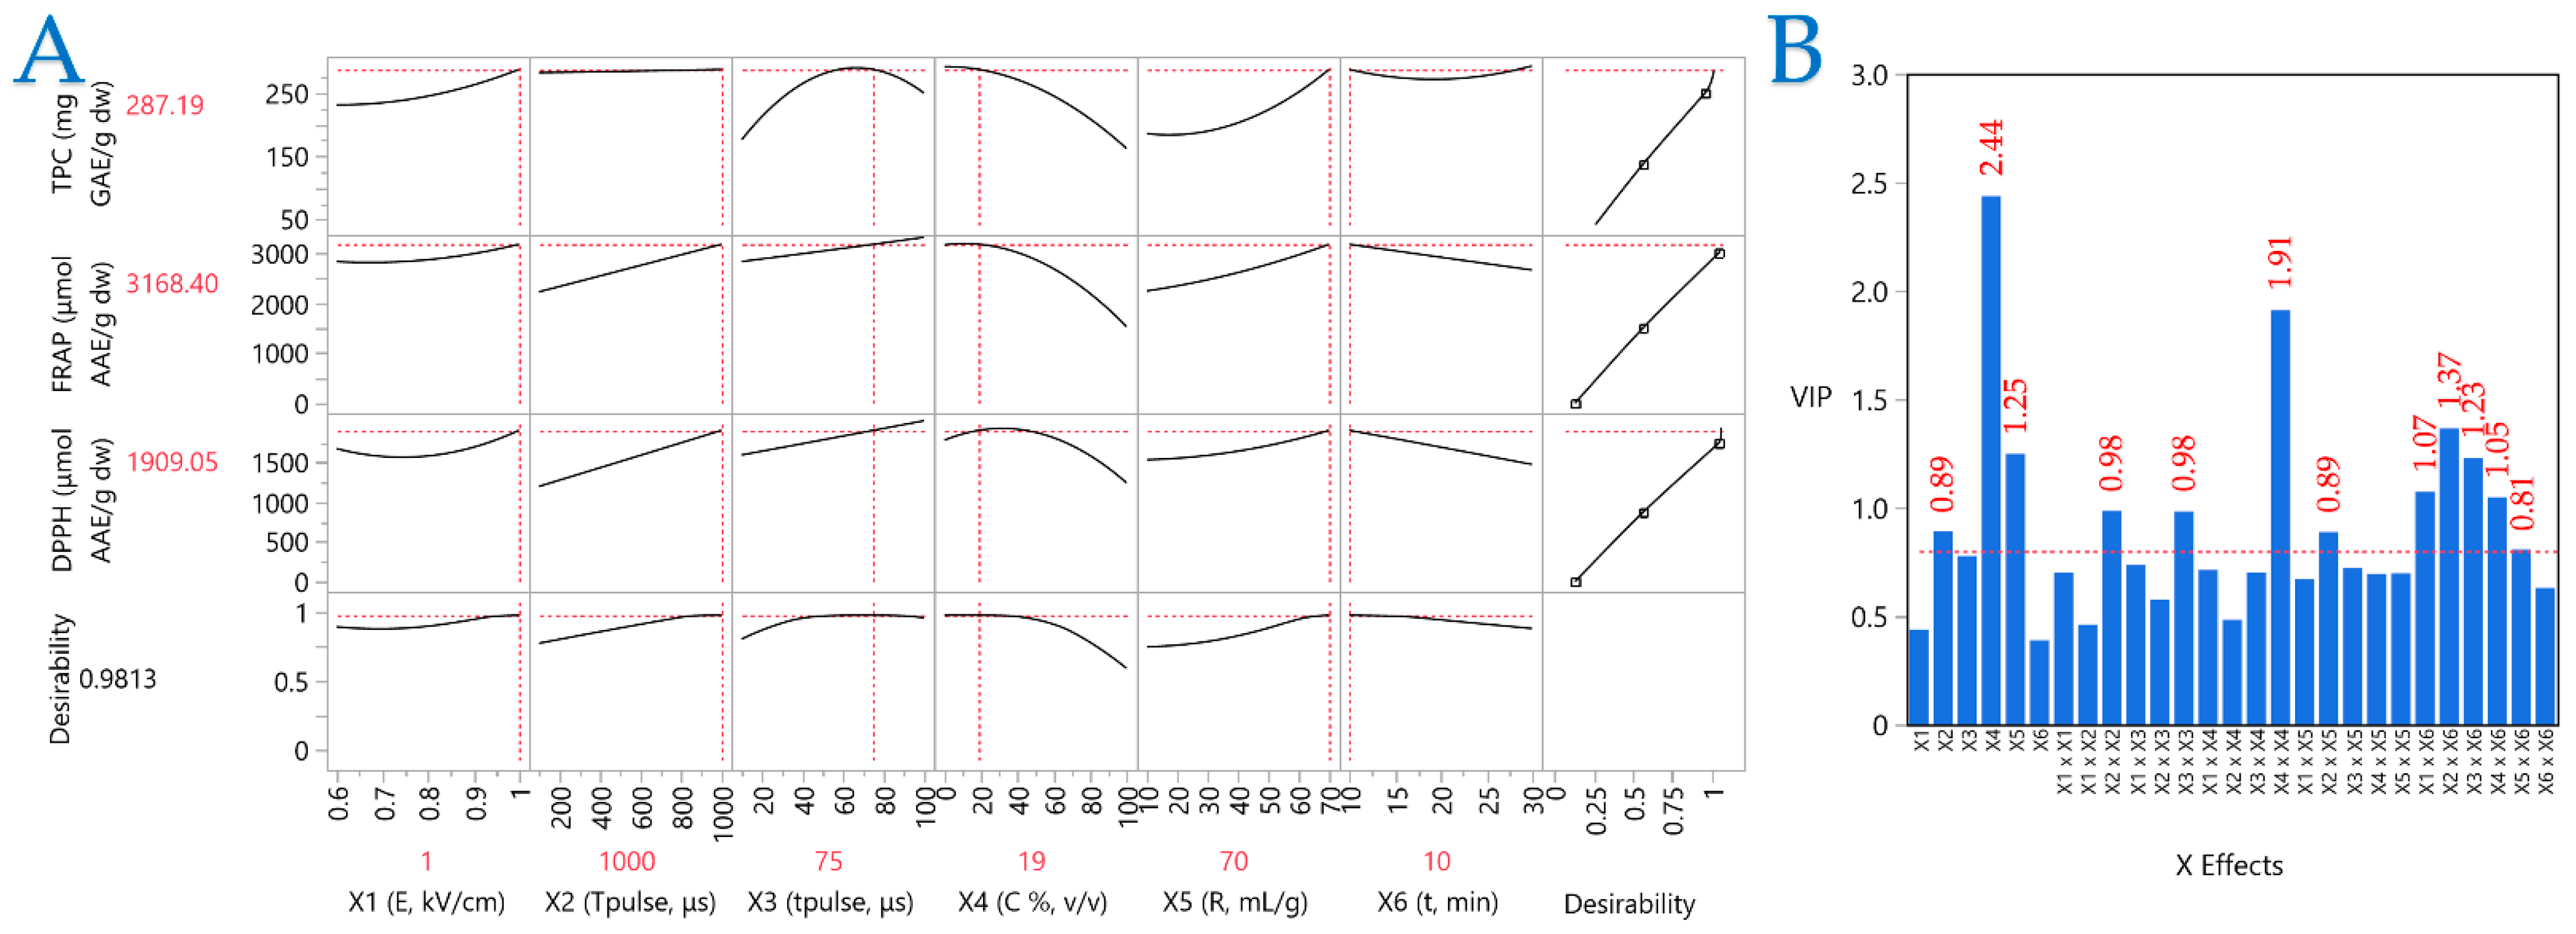
A PLS model was utilized to ascertain the importance of the extraction parameters and identify the optimal ones. PLS analysis (Figure 6A) was employed to generate a correlation loading map that clearly illustrates the extraction conditions of CM leaves. Meanwhile, plot (B) illustrates the Variable Importance Plot (VIP), which underscores the significance of each predictor variable in the PEF extraction approach. The red dashed line serves as a reference for the 0.8 significance threshold, emphasizing the relative impact of each variable within the model. The VIP plot shows that the parameters most affecting performance are pulse period, solvent composition, and extraction time. Solvent composition had the highest score, followed by the squared term (X42). In PLS, the influences of the parameters on the extraction efficiency are clearly shown, thereby enabling the formulation of optimal conditions. These were formulated as follows: 1 kV/cm electric field strength, a pulse period of 1000 μs, a pulse duration of 75 μs, and an extraction time of 10 min, while the optimal extraction solvent was 19% v/v aqueous ethanol and the liquid-to-solid ratio was 70 mL/g.
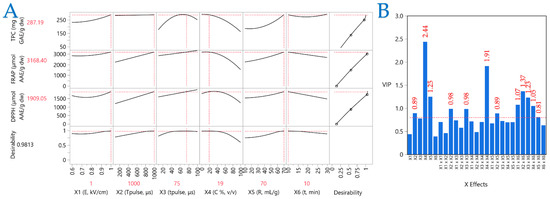
Figure 6.
Plot (A) shows a Partial Least Squares (PLS) prediction profiler and a desirability function and plot (B) illustrates the Variable Importance Plot (VIP).
The robust association between the experimental findings and PLS model predictions is evidenced by a high correlation value of 0.997 and a significant coefficient of determination (R2) of 0.994. Furthermore, the minimal p-value (<0.0001) confirms that the differences between observed and predicted values are statistically insignificant.
2.6. Comparative Analysis of Extraction Techniques
To validate the efficiency of PEF extraction under optimal conditions, three additional extraction protocols were performed: a control extraction (No-PEF), a conventional stirring extraction (STE), and a green ultrasound-assisted extraction (UAE). All methods applied identical liquid–solid ratios, solvent concentration, and extraction time to ensure consistency.
The No-PEF control involved passive solvent exposure, where the CM leaf powder was immersed in solvent for 10 min without electric stimulation, serving as a baseline for solvent–solid interaction. STE offered a conventional mechanical alternative, while the UAE method introduced a green approach using ultrasound waves at 37 kHz in pulse mode—selected to balance effective cavitation and sample integrity.
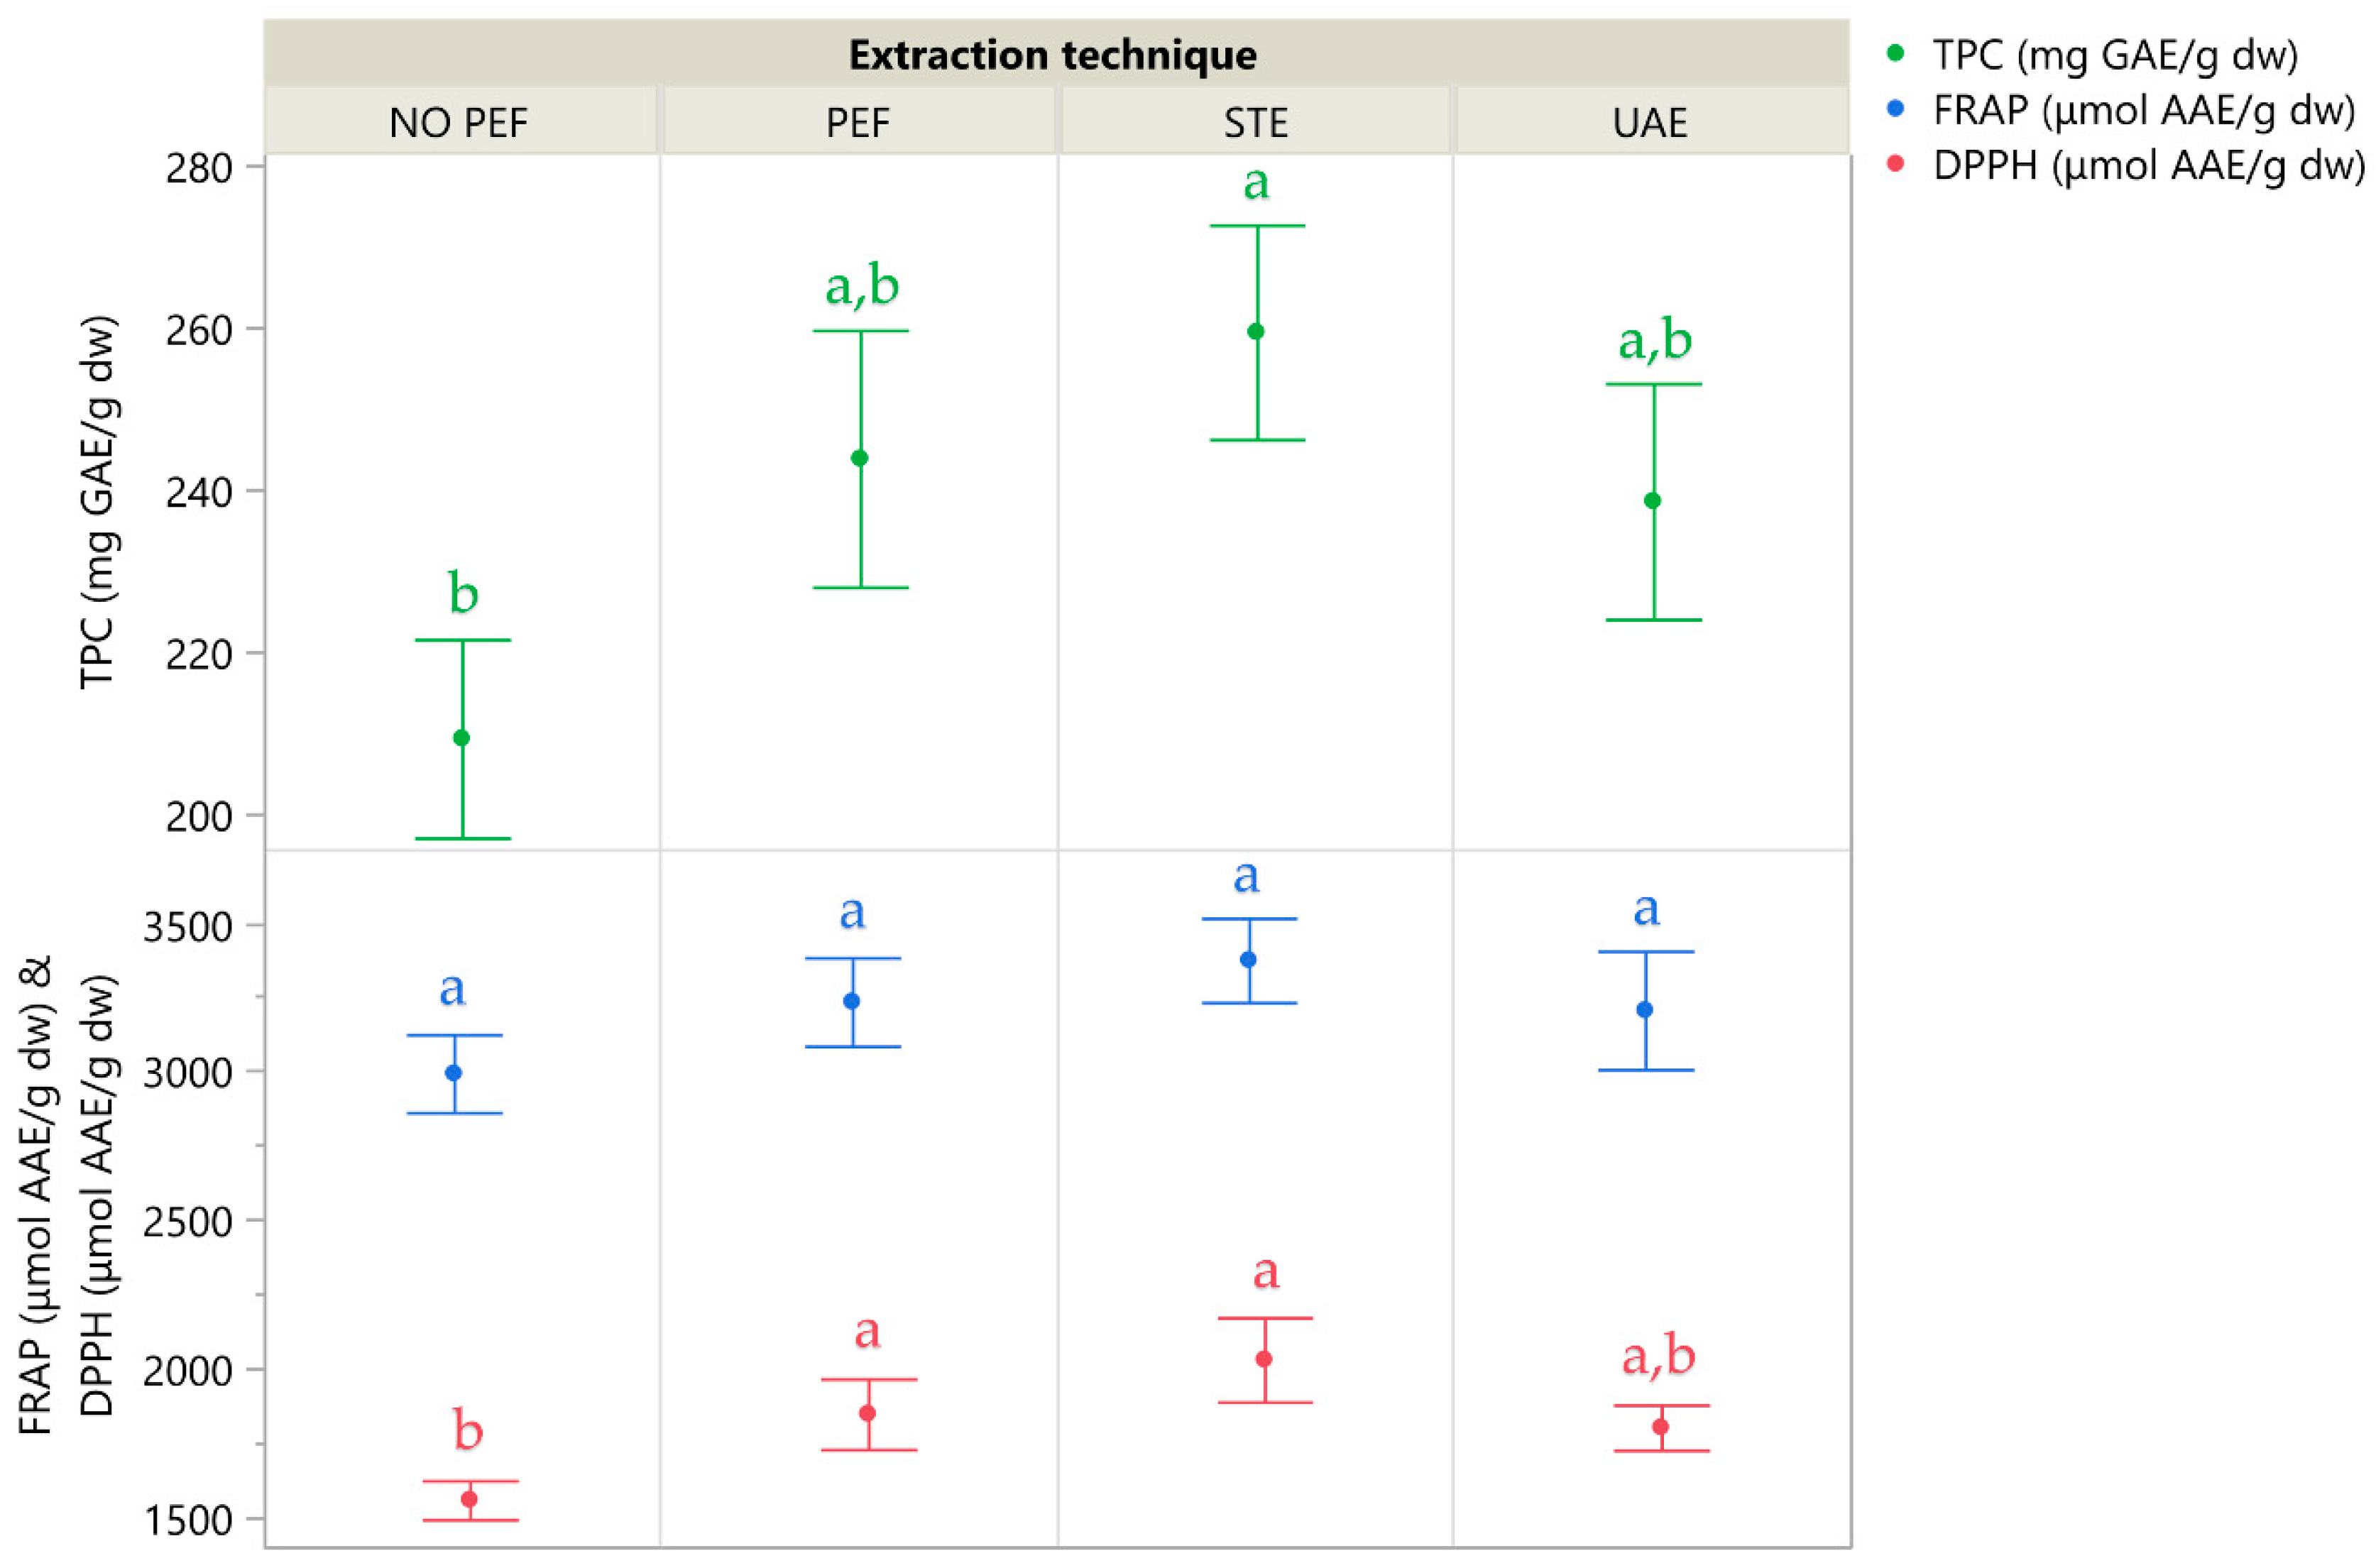
Figure 7 illustrates the extraction yields of the four extraction techniques, and Table 5 details the individual compounds identified in the corresponding extracts using high-performance liquid chromatography coupled with a diode array detector (HPLC-DAD). While PEF extraction demonstrated strong performance and clearly outperformed the No-PEF control—highlighting the role of electric stimulation in enhancing compound release—STE yielded the highest overall recovery of both polyphenols and antioxidant activity. UAE ranked third, whereas the No-PEF passive extraction consistently produced the lowest values, reinforcing that mere solvent interaction is insufficient for optimal recovery. These results confirm that mechanical agitation in STE and electrical disruption in PEF both significantly improve polyphenol accessibility from CM leaves.
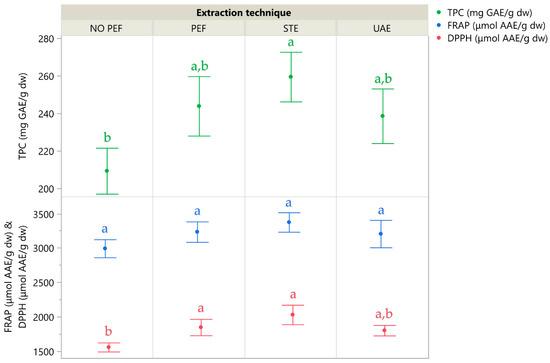
Figure 7.
A comparative graph illustrating various extraction techniques, where the mean values are presented alongside error bars that represent standard deviations derived from three independent replicates (n = 3). Additionally, lowercase letters (e.g., a, b) indicate statistically significant differences between means (p < 0.05).

Table 5.
Optimal extraction conditions for polyphenolic compounds obtained through different extraction techniques, applied to the dry plant CM extracts.
The optimal TPC obtained by PEF was 244 mg GAE/g dw, which represents a notably high yield for CM leaves, exceeding those reported for CM fruits by a factor of 5.5 in a previous study [8], while Bahorun et al. [31] determined a TPC 5.1 times lower for CM fruit than that observed in the current study. Furthermore, antioxidant activity as measured via FRAP and DPPH assays reached 3235 and 1850 μmol AAE/g dw, respectively, indicating a strong radical scavenging potential in the leaf extracts compared to previously reported values.
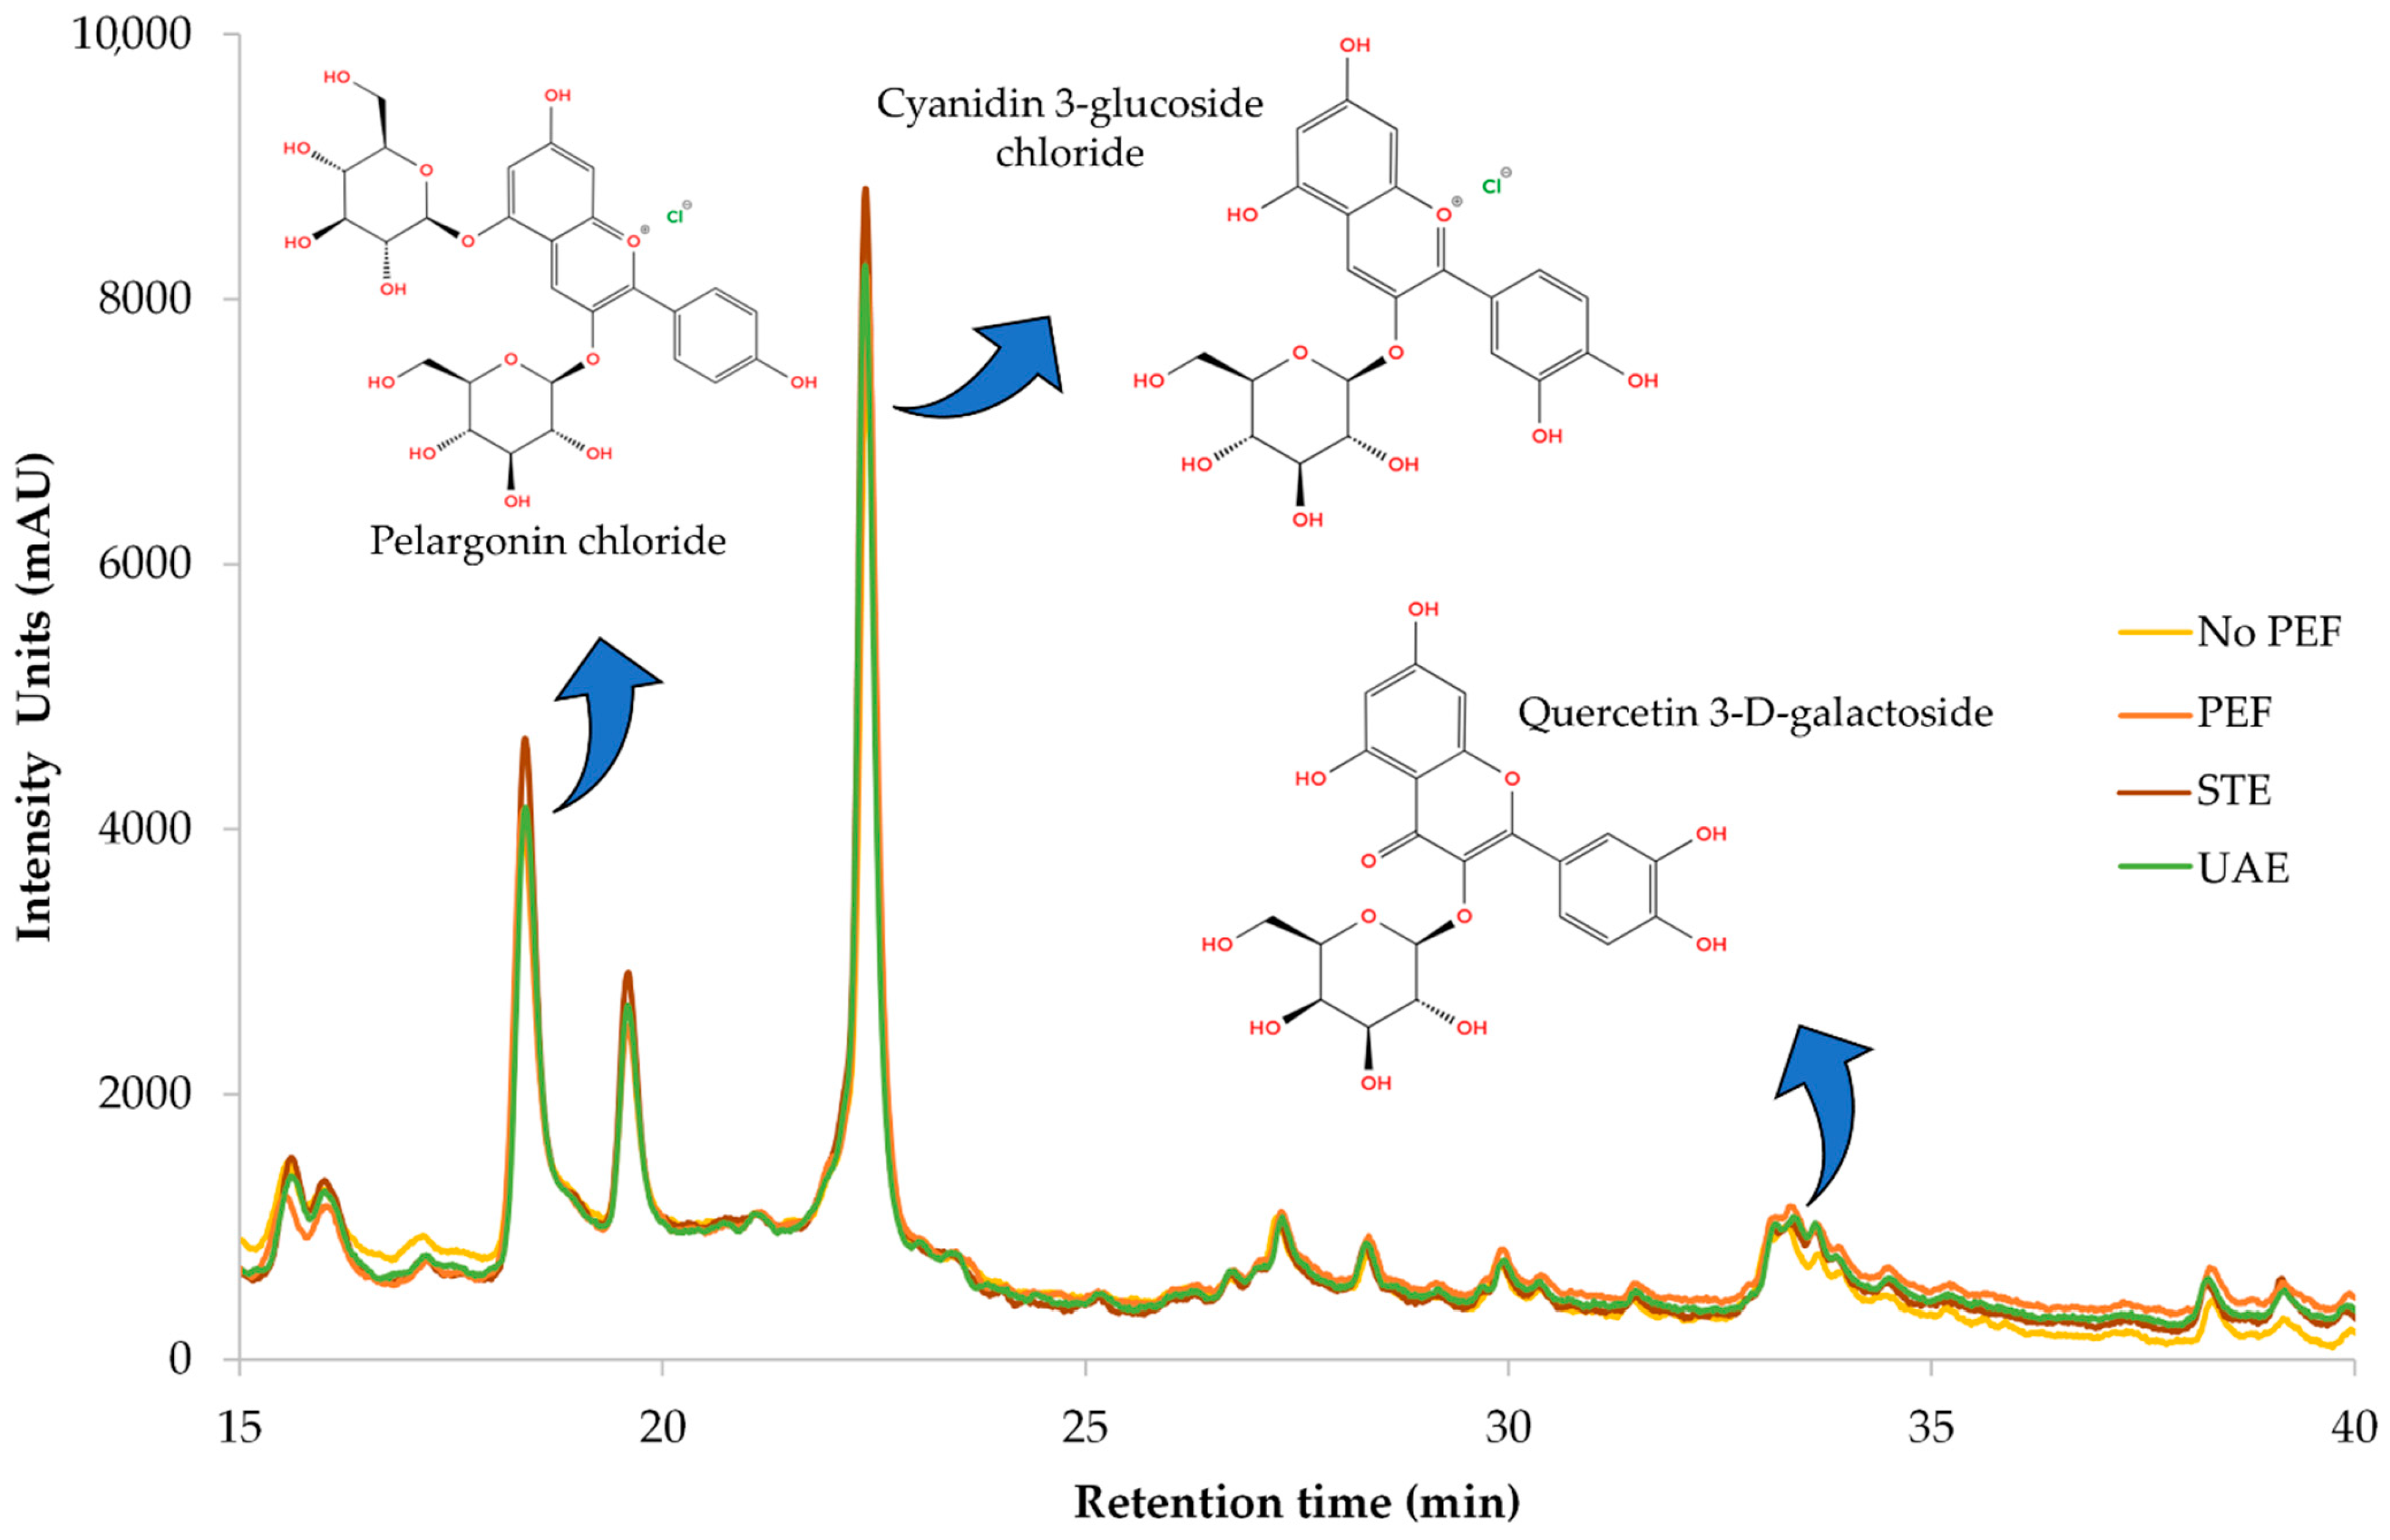
Figure 8 illustrates a representative chromatograph of all four extracts, while Table 6 provides the equations used for quantification, along with R-squared (R2) values, retention time (RT), UVmax of each compound, limit of detection (LOD), and limit of quantification (LOQ). Separation and retention times confirm the identification of compounds via reference standards. Pelargonin chloride, cyanidin 3-glucoside chloride, and quercetin 3-D-galactoside (hyperoside) were conclusively identified through comparison with authenticated standards, and their corresponding UV-Vis spectra are presented in Figure A1 as supplementary validation. The spectral profiles exhibit strong alignment with the expected absorbance maxima: pelargonin chloride showed peaks ranging from 265 to 645 nm, cyanidin 3-glucoside displayed its characteristic λmax at 516 nm, and quercetin 3-D-galactoside registered a prominent peak at 352 nm. Minor spectral shifts between standards and extracts—attributable to matrix interactions—did not affect compound identification, as core spectral features remained intact. These results confirm the chemical integrity and structural identity of key polyphenols within CM leaf extracts and reinforce the accuracy and reliability of HPLC-DAD quantification at their respective UVmax wavelengths.
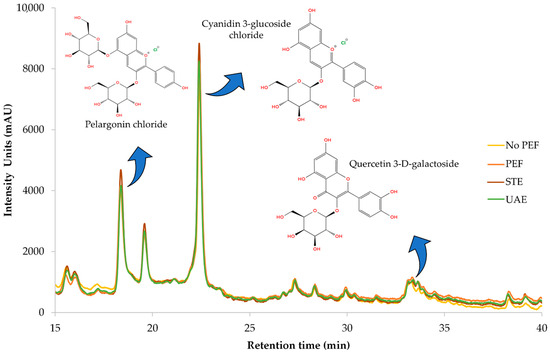
Figure 8.
Representative HPLC chromatograms at 280 nm of the optimized dry CM leaves obtained through different extraction techniques, illustrating the identified polyphenolic compounds.

Table 6.
Calibration curve equations for each compound detected via HPLC-DAD.
The main compound found in the extracts of CM leaves is pelargonin chloride. This compound is very prevalent in berry fruits and possesses antioxidant and anti-inflammatory activities [32]. The amount found in CM leaves is remarkable, considering that only up to 0.01 mg/g pelargonin chloride has been found in strawberry fruits [33]. Cyanidin 3-glucoside, which is typically used as a food colorant, also displays health benefits, such as antioxidant, anticancer, and anti-inflammatory effects [34]. Cyanidin 3-glucoside is a typical anthocyanin found in berry fruits like mulberries and strawberries [33,35]. Zannou et al. [36] determined approximately 1.2 mg/g of this particular anthocyanin is found in blackberry fruit, an amount significantly lower than the one determined in the current study. The third compound identified through HPLC-DAD was quercetin 3-D-galactoside, a flavonoid with strong antioxidant activity that is also common in berry fruits [37]. Quercetin 3-D-galactoside was also found in CM leaves by Kirakosyan et al. [38], in a quantity of 0.387 mg/g dw. Researchers from another study [39] identified this flavonoid in Moringa oleifera leaves at a quantity almost three times lower than that in CM leaves. These findings indicate that CM leaves are carriers of potent antioxidant compounds of pharmacological interest that could be isolated and utilized in various applications.
3. Materials and Methods
3.1. Chemicals and Reagents
Ethanol (99.8%), Folin–Ciocalteu’s reagent, and gallic acid (97%) were obtained from Panreac Co. (Barcelona, Spain). Acetonitrile (99.9%) was purchased from Labkem (Barcelona, Spain). Hydrochloric acid (37%), 2,2-diphenyl-1-picrylhydrazyl (DPPH), 2,4,6-tris(2-pyridyl)-s-triazine (TPTZ) (≥98%), and all polyphenolic standards for the HPLC determination (at least 97% purity or higher) were obtained from Sigma-Aldrich (Darmstadt, Germany). Formic acid (99.8%), sodium carbonate (anhydrous, 99.5%), and rutin (≥94%) were from Penta (Prague, Czech Republic). Iron (III) chloride hexahydrate (97%) was obtained from Merck (Darmstadt, Germany). A deionizing column that contains mixed-bed ion exchange resin, ensuring conductivity below 1 µS/cm, with a standard flow rate and operating pressure, was used to produce deionized water for all the experiments.
3.2. Plant Material
Dried CM leaves were purchased from a local market in Karditsa, Greece. Then, the CM leaves were sieved using an Analysette 3 PRO (Fritsch GmbH, Oberstein, Germany), and the average resulting particle size was 355 μm. Powder with a particle size below 400 μm was chosen for the experiments and stored in a freezer at −40 °C until further processing.
3.3. Experimental Design
The study employed the RSM with a custom design to optimize extraction conditions for TPC, FRAP, and DPPH antiradical activity. This approach was applied to the PEF extraction process for the dry leaves of CM. Six key independent variables were examined: electric field strength (E, kV/cm) as X1, pulse period (Tpulse, μs) as X2, pulse duration (tpulse, μs) as X3, ethanol concentration in water (C, % v/v) as X4, liquid-to-solid ratio (R, mL/g) as X5, and extraction time (t, min) as X6, each tested at three levels—low (−1), medium (0), and high (+1)—as shown in Table 7. To ensure reliability, 30 experimental runs were conducted, including two central points, with each experiment repeated three times and the average values recorded.

Table 7.
Optimal process parameters, including both the actual and coded values of the independent variables.
To improve the model’s predictive accuracy, stepwise regression was employed to eliminate unnecessary terms, thereby minimizing variance and refining the estimation process. This optimization resulted in a second-order polynomial equation (4) that defines the interactions among the six independent variables:
where the independent variables are denoted by Xi and Xj, and the predicted response variable is defined by Yk. In the model, the intercept and regression coefficients β0, βi, βii, and βij represent the linear, quadratic, and interaction terms, respectively.
Two stainless steel chambers made by Val-Electronic of Athens, Greece, a mode/arbitrary waveform generator by UPG100 of ELV Elektronik AG of Leer, Germany, a digital oscilloscope by Rigol of Beaverton, Oregon, USA, and a high-voltage power generator by Leybold of LD Didactic GmbH (Hürth, Germany) were used to process the samples utilizing PEF. The stirring extraction (STE) technique was carried out using a stirring hotplate manufactured by Heidolph Instruments GmbH & Co. KG of Schwabach, Germany. The UAE treatment was conducted using an Elmasonic P70H ultrasonication bath, which was manufactured by Elma Schmidbauer GmbH of Singen, Germany. Upon completion of each extraction, samples were subjected to centrifugation for 10 min at 10,000× g using a NEYA 16R centrifuge (Remi Elektrotechnik Ltd., Palghar, India). Ultimately, supernatants were gathered and preserved at −40 °C.
3.4. Determinations
3.4.1. Total Polyphenol Content (TPC)
The TPC was evaluated through a photometric assay described in a previous study [40]. The results were represented as milligrams of gallic acid equivalents (GAE) per gram of dry weight (dw), calculated using a calibration curve (10–100 mg/L of gallic acid; R2 = 0.9996) in water. The samples’ absorbances were measured using a Shimadzu UV-1900i UV/Vis spectrophotometer, which is made in Kyoto, Japan. All analyses were carried out three times, and the average was taken to determine the outcomes.
3.4.2. Ferric-Reducing Antioxidant Power (FRAP) Assay
The procedure for determining the extracts’ antioxidant capacity using the widely-used electron-transfer method is detailed in a prior work [40]. Finding out when the iron oxidation state went from +3 to +2 at 620 nm was the key to this technique. The data were presented as μmol of ascorbic acid equivalents (AAE) per gram of dry weight, and a calibration curve of ascorbic acid (50–500 μM in 0.05 M HCl, R2 = 0.9997) was used. All analyses were carried out three times, and the average was taken to determine the outcomes.
3.4.3. DPPH Radical Scavenging Assay
A previously described assay [30] for DPPH scavenging was employed. After mixing 25 μL of adequately diluted sample extract with 975 μL of DPPH solution (100 μmol/L in methanol), the absorbance at 515 nm was measured both immediately and 30 min later. The anti-radical activity of ascorbic acid (100–1000 μmol/L in methanol, R2 = 0.9926) was measured using a calibration curve, and the results were presented as μmol of AAE per gram of dry weight. All analyses were carried out three times, and the average was taken to determine the outcomes.
3.4.4. Individual Polyphenols by HPLC-DAD
Based on our earlier research, we identified specific polyphenols from the CM leaves’ extracts using high-performance liquid chromatography coupled with a diode array detector (HPLC-DAD) [30]. Shimadzu Europa GmbH, Duisburg, Germany, supplied the liquid chromatograph (type CBM-20A) and diode array detector (model SPD-M20A) used in this work. Between 200 and 800 nm is the detecting wavelength. Using a Phenomenex Luna C18(2) column (100 Å, 5 μm, 4.6 mm × 250 mm) from Phenomenex Inc. in Torrance, CA, USA, the compounds were injected with a volume of 20 μL and then separated at 40 °C. Both the acetonitrile (B) and water (A) mobile phases contained 0.5 percent formic acid. The gradient program began with a constant value of 10 min, progressed to 40% B after 10 min, 70% B after another 10 min, and finally 40% B. A steady 1 mL/min flow rate for the mobile phase was maintained. The chemicals were identified and then quantified using calibration curves (0–50 μg/mL) by comparing the absorbance spectra and retention times to those of purified standards.
3.5. Statistical Analysis
All statistical evaluations were conducted using JMP® Pro 16 software (SAS Institute Inc., Cary, NC, USA) supporting response surface methodology (RSM), regression modeling, and distribution analysis. Normality of data was assessed using the Kolmogorov–Smirnov test. To determine statistically significant differences among treatments, analysis of variance (ANOVA) was performed, followed by Tukey’s HSD multiple comparison test at a significance level of p < 0.05. Each extraction protocol was repeated at least twice, and all quantitative analyses were conducted in triplicate. Results are reported as mean ± standard deviation. Additionally, PLS, PCA, MCA, and Pareto plot analysis were applied to evaluate multivariate relationships and identify the most influential extraction parameters.
4. Conclusions
This study investigated the extraction of high levels of bioactive compounds from CM leaves using eco-friendly solvents such as ethanol and water, in conjunction with the environmentally sustainable PEF technique. A variety of significant extraction parameters that influence yield were examined to identify those that result in an extract abundant in bioactive compounds. The optimal conditions were found to be 19% v/v aqueous ethanol, a liquid-to-solid ratio of 70 mL/g, and the following PEF-related parameters: 1 kV/cm electric field strength, a pulse period of 1000 μs, a pulse duration of 75 μs, and a treatment time of 10 min. Compared to other techniques, such as UAE, the application of PEF appears to be more efficient. PEF may also be applied as a pretreatment to conventional techniques like STE, offering a pathway toward enhanced extraction yields and compound recovery. The results of this experimental study emphasize the significance of optimized extraction methods and reveal numerous beneficial compounds in CM leaves. The significant increase in bioactive content allows for the production of powerful CM leaf extracts that could be utilized in cosmetic formulations, functional meals, and medicinal remedies. Further investigation into the scalability and commercial integration of PEF extraction will support the valorization of CM leaves in functional and pharmaceutical products.
Author Contributions
Conceptualization, V.A. and S.I.L.; methodology, V.A., software, V.A.; validation, V.A.; formal analysis, M.M., E.B., and V.A.; investigation, M.M., I.M., and V.P.; resources, S.I.L.; data curation, V.P., M.M., and I.M.; writing—original draft preparation, V.P., E.B., and M.M.; writing—review and editing, V.A., M.M., and S.I.L.; visualization, M.M. and V.P.; supervision, V.A. and S.I.L.; project administration, S.I.L.; funding acquisition, S.I.L. All authors have read and agreed to the published version of the manuscript.
Funding
This research received no external funding.
Data Availability Statement
The original contributions presented in this study are included in the article. Further inquiries can be directed to the corresponding author.
Conflicts of Interest
The authors declare no conflicts of interest.
Appendix A
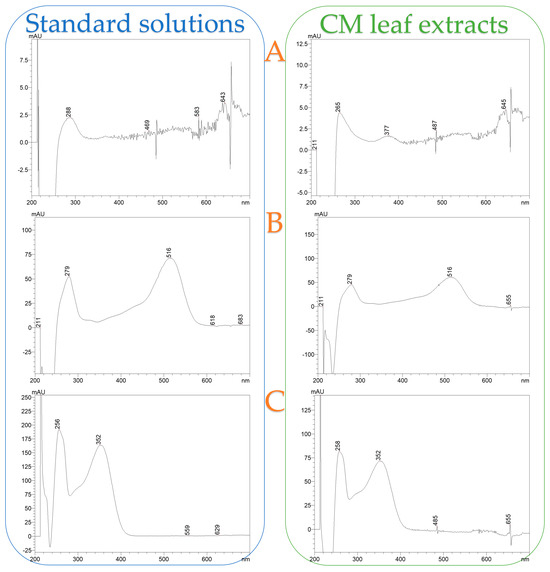
Figure A1.
UV-Vis absorbance spectra of standard solutions and corresponding CM leaf extracts for (A) Pelargonin chloride, (B) Cyanidin 3-glucoside chloride, and (C) Quercetin 3-D-galactoside (Hyperoside).
Figure A1.
UV-Vis absorbance spectra of standard solutions and corresponding CM leaf extracts for (A) Pelargonin chloride, (B) Cyanidin 3-glucoside chloride, and (C) Quercetin 3-D-galactoside (Hyperoside).
References
- Lang, Y.; Gao, N.; Zang, Z.; Meng, X.; Lin, Y.; Yang, S.; Yang, Y.; Jin, Z.; Li, B. Classification and Antioxidant Assays of Polyphenols: A Review. J. Future Foods 2024, 4, 193–204. [Google Scholar] [CrossRef]
- Maniglia, B.C.; Rebelatto, E.A.; Andrade, K.S.; Zielinski, A.; de Andrade, C.J. Polyphenols. In Food Bioactives and Health; Galanakis, C.M., Ed.; Springer International Publishing: Cham, Switzerland, 2021; pp. 1–39. ISBN 978-3-030-57469-7. [Google Scholar]
- Palos-Hernández, A.; González-Paramás, A.M.; Santos-Buelga, C. Latest Advances in Green Extraction of Polyphenols from Plants, Foods and Food By-Products. Molecules 2024, 30, 55. [Google Scholar] [CrossRef]
- Żurek, N.; Karatsai, O.; Rędowicz, M.J.; Kapusta, I.T. Polyphenolic Compounds of Crataegus Berry, Leaf, and Flower Extracts Affect Viability and Invasive Potential of Human Glioblastoma Cells. Molecules 2021, 26, 2656. [Google Scholar] [CrossRef]
- Shahrajabian, M.H.; Sun, W. Medicinal Plants, Economical and Natural Agents with Antioxidant Activity. Curr. Nutr. Food Sci. 2023, 19, 763–784. [Google Scholar] [CrossRef]
- Yahfoufi, N.; Alsadi, N.; Jambi, M.; Matar, C. The Immunomodulatory and Anti-Inflammatory Role of Polyphenols. Nutrients 2018, 10, 1618. [Google Scholar] [CrossRef]
- Shafie, M.H.; Kamal, M.L.; Abdul Razak, N.A.; Hasan, S.; Uyup, N.H.; Abdul Rashid, N.F.; Zafarina, Z. Antioxidant and Antimicrobial Activity of Plant Hydrosol and Its Potential Application in Cosmeceutical Products. Jundishapur J. Nat. Pharm. Prod. 2022, 17, e124018. [Google Scholar] [CrossRef]
- Kotsou, K.; Magopoulou, D.; Chatzimitakos, T.; Athanasiadis, V.; Bozinou, E.; Sfougaris, A.; Lalas, S. Enhancing the Nutritional Profile of Crataegus monogyna Fruits by Optimizing the Extraction Conditions. Horticulturae 2024, 10, 564. [Google Scholar] [CrossRef]
- Wang, J.; Xiong, X.; Feng, B. Effect of Crataegus Usage in Cardiovascular Disease Prevention: An Evidence-Based Approach. Evid. Based Complement. Alternat. Med. 2013, 2013, 149363. [Google Scholar] [CrossRef] [PubMed]
- Furey, A.; Tassell, M.; Kingston, R.; Gilroy, D.; Lehane, M. Hawthorn (Crataegus Spp.) in the Treatment of Cardiovascular Disease. Pharmacogn. Rev. 2010, 4, 32. [Google Scholar] [CrossRef] [PubMed]
- Kumar, D.; Arya, V.; Bhat, Z.A.; Khan, N.A.; Prasad, D.N. The Genus Crataegus: Chemical and Pharmacological Perspectives. Rev. Bras. Farmacogn. 2012, 22, 1187–1200. [Google Scholar] [CrossRef]
- Żurek, N.; Kapsuta, I.; Cebulak, T. Content of Polyphenolic Compounds and Biological Activity of Berries, Leaves and Flowers of Crataegus L. Acta Univ. Cibiniensis Ser. E Food Technol. 2023, 27, 35–52. [Google Scholar] [CrossRef]
- Ez-Zahra Amrati, F.; Mssillou, I.; Boukhira, S.; Djiddi Bichara, M.; El Abdali, Y.; Galvão De Azevedo, R.; Mohamed, C.; Slighoua, M.; Conte, R.; Kiokias, S.; et al. Phenolic Composition of Crataegus monogyna Jacq. Extract and Its Anti-Inflammatory, Hepatoprotective, and Antileukemia Effects. Pharmaceuticals 2024, 17, 786. [Google Scholar] [CrossRef] [PubMed]
- Nabavi, S.F.; Habtemariam, S.; Ahmed, T.; Sureda, A.; Daglia, M.; Sobarzo-Sánchez, E.; Nabavi, S.M. Polyphenolic Composition of Crataegus monogyna Jacq.: From Chemistry to Medical Applications. Nutrients 2015, 7, 7708–7728. [Google Scholar] [CrossRef] [PubMed]
- Belwal, T.; Chemat, F.; Venskutonis, P.R.; Cravotto, G.; Jaiswal, D.K.; Bhatt, I.D.; Devkota, H.P.; Luo, Z. Recent Advances in Scaling-up of Non-Conventional Extraction Techniques: Learning from Successes and Failures. TrAC Trends Anal. Chem. 2020, 127, 115895. [Google Scholar] [CrossRef]
- Rocchetti, G.; Blasi, F.; Montesano, D.; Ghisoni, S.; Marcotullio, M.C.; Sabatini, S.; Cossignani, L.; Lucini, L. Impact of Conventional/Non-Conventional Extraction Methods on the Untargeted Phenolic Profile of Moringa oleifera Leaves. Food Res. Int. 2019, 115, 319–327. [Google Scholar] [CrossRef]
- Athanasiadis, V.; Chatzimitakos, T.; Kalompatsios, D.; Kotsou, K.; Mantiniotou, M.; Bozinou, E.; Lalas, S.I. Recent Advances in the Antibacterial Activities of Citrullus lanatus (Watermelon) By-Products. Appl. Sci. 2023, 13, 11063. [Google Scholar] [CrossRef]
- Wieczorek, M.N.; Zhou, W.; Pawliszyn, J. Perspective on Sample Preparation Fundamentals. Adv. Sample Prep. 2024, 10, 100114. [Google Scholar] [CrossRef]
- Dini, I.; Laneri, S. The New Challenge of Green Cosmetics: Natural Food Ingredients for Cosmetic Formulations. Molecules 2021, 26, 3921. [Google Scholar] [CrossRef]
- López-Rodríguez, R.; Domínguez, L.; Fernández-Ruiz, V.; Cámara, M. Extracts Rich in Nutrients as Novel Food Ingredients to Be Used in Food Supplements: A Proposal Classification. Nutrients 2022, 14, 3194. [Google Scholar] [CrossRef]
- Hoang, H.T.; Moon, J.-Y.; Lee, Y.-C. Natural Antioxidants from Plant Extracts in Skincare Cosmetics: Recent Applications, Challenges and Perspectives. Cosmetics 2021, 8, 106. [Google Scholar] [CrossRef]
- Bitwell, C.; Indra, S.S.; Luke, C.; Kakoma, M.K. A Review of Modern and Conventional Extraction Techniques and Their Applications for Extracting Phytochemicals from Plants. Sci. Afr. 2023, 19, e01585. [Google Scholar] [CrossRef]
- Usman, I.; Hussain, M.; Imran, A.; Afzaal, M.; Saeed, F.; Javed, M.; Afzal, A.; Ashfaq, I.; Al Jbawi, E.A.; Saewan, S. Traditional and Innovative Approaches for the Extraction of Bioactive Compounds. Int. J. Food Prop. 2022, 25, 1215–1233. [Google Scholar] [CrossRef]
- More, P.R.; Jambrak, A.R.; Arya, S.S. Green, Environment-Friendly and Sustainable Techniques for Extraction of Food Bioactive Compounds and Waste Valorization. Trends Food Sci. Technol. 2022, 128, 296–315. [Google Scholar] [CrossRef]
- Bouizgma, K.; Rabbah, N.; Abbas, Z.; Abourriche, A. Unlocking Sustainable Extraction of Natural Antioxidants: Green Solvents, Smart Technologies, Scalability and Future Directions. Sep. Sci. Technol. 2025, 60, 657–683. [Google Scholar] [CrossRef]
- Naliyadhara, N.; Kumar, A.; Girisa, S.; Daimary, U.D.; Hegde, M.; Kunnumakkara, A.B. Pulsed Electric Field (PEF): Avant-Garde Extraction Escalation Technology in Food Industry. Trends Food Sci. Technol. 2022, 122, 238–255. [Google Scholar] [CrossRef]
- Chelladurai, S.J.S.; Murugan, K.; Ray, A.P.; Upadhyaya, M.; Narasimharaj, V.; Gnanasekaran, S. Optimization of Process Parameters Using Response Surface Methodology: A Review. Mater. Today Proc. 2021, 37, 1301–1304. [Google Scholar] [CrossRef]
- Chatzimitakos, T.; Athanasiadis, V.; Kalompatsios, D.; Mantiniotou, M.; Bozinou, E.; Lalas, S.I. Pulsed Electric Field Applications for the Extraction of Bioactive Compounds from Food Waste and By-Products: A Critical Review. Biomass 2023, 3, 367–401. [Google Scholar] [CrossRef]
- Bocker, R.; Silva, E.K. Pulsed Electric Field Technology as a Promising Pre-Treatment for Enhancing Orange Agro-Industrial Waste Biorefinery. RSC Adv. 2024, 14, 2116–2133. [Google Scholar] [CrossRef]
- Mantiniotou, M.; Athanasiadis, V.; Liakos, K.G.; Bozinou, E.; Lalas, S.I. Artificial Intelligence and Extraction of Bioactive Compounds: The Case of Rosemary and Pressurized Liquid Extraction. Processes 2025, 13, 1879. [Google Scholar] [CrossRef]
- Bahorun, T.; Aumjaud, E.; Ramphul, H.; Rycha, M.; Luximon-Ramma, A.; Trotin, F.; Aruoma, O.I. Phenolic Constituents and Antioxidant Capacities of Crataegus monogyna (Hawthorn) Callus Extracts. Food Nahr. 2003, 47, 191–198. [Google Scholar] [CrossRef]
- Wan, Y.; Yang, H.; Zhang, G. Pelargonidin Alleviates Acrolein-Induced Inflammation in Human Umbilical Vein Endothelial Cells by Reducing COX-2 Expression through the NF-κB Pathway. Naunyn. Schmiedebergs Arch. Pharmacol. 2024, 397, 1737–1748. [Google Scholar] [CrossRef]
- Mazon, S.; Prasniewski, A.; Woyann, L.G.; Lise, C.C.; Oldoni, T.L.C.; Mitterer-Daltoé, M.L.; Finatto, T.; de Oliveira Vargas, T. Production and Quality Aspects of Strawberries Cultivated under Organic Management. Org. Agric. 2023, 13, 43–54. [Google Scholar] [CrossRef]
- Zannou, O.; Oussou, K.F.; Chabi, I.B.; Awad, N.M.H.; Aïssi, M.V.; Goksen, G.; Mortas, M.; Oz, F.; Proestos, C.; Kayodé, A.P.P. Nanoencapsulation of Cyanidin 3-O-Glucoside: Purpose, Technique, Bioavailability, and Stability. Nanomaterials 2023, 13, 617. [Google Scholar] [CrossRef] [PubMed]
- Liu, S.; Zhang, Y. Antioxidant Properties and Electrochemical Activity of Anthocyanins and Anthocyanidins in Mulberries. J. Food Meas. Charact. 2024, 18, 3569–3576. [Google Scholar] [CrossRef]
- Zannou, O.; Koca, I.; Ibrahim, S.A. Acidic Deep Eutectic Solvent as a Greener Medium for Highly Efficient Extraction of Anthocyanins from Blackberry Fruit: Optimization, Stability and Purification with Two-Aqueous Phase Method. Microchem. J. 2024, 205, 111291. [Google Scholar] [CrossRef]
- Saavedra-Leos, M.Z.; Leyva-Porras, C.; López-Martínez, L.A.; González-García, R.; Martínez, J.O.; Compeán Martínez, I.; Toxqui-Terán, A. Evaluation of the Spray Drying Conditions of Blueberry Juice-Maltodextrin on the Yield, Content, and Retention of Quercetin 3-d-Galactoside. Polymers 2019, 11, 312. [Google Scholar] [CrossRef] [PubMed]
- Kirakosyan, A.; Seymour, E.; Kaufman, P.B.; Warber, S.; Bolling, S.; Chang, S.C. Antioxidant Capacity of Polyphenolic Extracts from Leaves of Crataegus laevigata and Crataegus monogyna (Hawthorn) Subjected to Drought and Cold Stress. J. Agric. Food Chem. 2003, 51, 3973–3976. [Google Scholar] [CrossRef]
- Quan, N.V.; Hossen, M.A.; Xuan, T.D. Effect of in Vitro Simulated Poultry Digestion on Bioaccessibility of Quercetin 3-D-Galactoside and Antioxidants from Moringa oleifera Leaf Extracts. J. Biol. Act. Prod. Nat. 2023, 13, 238–255. [Google Scholar] [CrossRef]
- Kalompatsios, D.; Athanasiadis, V.; Mantiniotou, M.; Lalas, S.I. Optimization of Ultrasonication Probe-Assisted Extraction Parameters for Bioactive Compounds from Opuntia macrorhiza Using Taguchi Design and Assessment of Antioxidant Properties. Appl. Sci. 2024, 14, 10460. [Google Scholar] [CrossRef]
Disclaimer/Publisher’s Note: The statements, opinions and data contained in all publications are solely those of the individual author(s) and contributor(s) and not of MDPI and/or the editor(s). MDPI and/or the editor(s) disclaim responsibility for any injury to people or property resulting from any ideas, methods, instructions or products referred to in the content. |
© 2025 by the authors. Licensee MDPI, Basel, Switzerland. This article is an open access article distributed under the terms and conditions of the Creative Commons Attribution (CC BY) license (https://creativecommons.org/licenses/by/4.0/).

