Article

Genome-Wide Identification and Expression Analysis of Auxin-Responsive GH3 Gene Family in Pepper (Capsicum annuum L.)

Shanxi Key Laboratory of Germplasm Resources Innovation and Utilization of Vegetable and Flower, College of Horticulture, Shanxi Agricultural University, Taigu, Jinzhong 030801, China
*
Author to whom correspondence should be addressed.
These authors contributed equally to this work.
Plants 2025, 14(14), 2231; https://doi.org/10.3390/plants14142231
Submission received: 28 May 2025 / Revised: 10 July 2025 / Accepted: 16 July 2025 / Published: 18 July 2025

Abstract

As an auxin-responsive gene, Gretchen Hagen 3 (GH3) maintains hormonal homeostasis by conjugating excess auxin with amino acids in plant stress-related signaling pathways. GH3 genes have been characterized in many plant species, but the characteristics of pepper (Capsicum annuum L.) GH3 (CaGH3) gene family members in response to multiple stimulants are largely unknown. In this study, we systematically identified the CaGH3 gene family at the genome level and identified eight members on four chromosomes in pepper. CaGH3s were divided into two groups (I and III) and shared conserved motifs, domains, and gene structures. Moreover, CaGH3s had close evolutionary relationships with tomato (Solanum lycopersicum L.), and the promoters of most CaGH3 genes contained hormone and abiotic stress response elements. A protein interaction prediction analysis demonstrated that the CaGH3-3/3-6/3-7/3-8 proteins were possibly core members of the CaGH3 family interaction. In addition, qRT-PCR results showed that CaGH3 genes were differentially expressed in pepper tissues and could be induced by phytohormones (IAA, ABA, and MeJA) and abiotic stresses (salt, low temperature, and drought) with different patterns. In addition, CaGH3-5 and CaGH3-7 were cloned, and the sequences showed a high degree of conservation. Moreover, the results of subcellular localization indicated that they were located in the membrane and chloroplast. Notably, after overexpressing CaGH3-7 in tomato, RNA-seq was performed on wild-type and transgenic lines, and the differentially expressed genes were mainly enriched in response to external stimuli. This study not only lays the foundation for a comprehensive understanding of the function of the CaGH3 gene family during plant growth and stress responses but also provides potential genetic resources for pepper resistance breeding.

1. Introduction

Auxins play important roles in plant growth and development and in responses to biotic and abiotic stress [1,2]. Auxin homeostasis is regulated by several auxin-responsive genes, including auxin/indoleacetic acid (Aux/IAA), Gretchen Hagen 3 (GH3), and small auxin up RNA (SAUR), which are considered to be early auxin-responsive gene families [3]. The GH3 protein can combine amino acid with the free form of salicylic acid (SA), jasmonic acid (JA), or indole-3-acetic acid (IAA) to maintain phytohormone homeostasis [4] and then regulate plant growth and development [5,6]. A GH3 mutant, ydk1-D, is involved in hypocotyl elongation through the regulation of auxin activity [7]. In Capsicum chinense L., CcGH3 is involved in fruit ripening through the ethylene pathway [8]. The AtGH3.9 mutation promotes primary root growth and influences the auxin and jasmonate signaling pathways [9]. Moreover, some AtGH3 genes can affect the development of lateral roots by modulating the response of auxin and meristem activities [10]. In addition, lines overexpressing AtGH3.15 have longer roots and lower lateral root density under indolebutyric acid (IBA) treatment, showing resistance to IBA [11]. All in all, GH3 genes can regulate the growth process of plants through hormones.
In addition to their roles in plant growth, GH3 family genes also play crucial roles in plant resistance to biotic and abiotic stresses [4,6,12]. Rice (Oryza sativa L.) with OsGH3-8 overexpression enhances resistance to Xanthomonas oryzae pv oryzae via suppressed auxin signaling [13]. In an experiment where maize (Zea mays L.) was treated with Colletotrichum graminicolum, most GH3 genes were down-regulated, but ZmGH3-2 and ZmGH3-8 were highly up-regulated [14]. In addition, the activation of OsGH3.13 enhanced drought tolerance by affecting the concentration of IAA [15], overexpressing OsGH3-2 reduced the ABA and free IAA level and increased cold tolerance [16], and silencing the GH3.5 gene in cotton reduced drought and salt tolerance [17]. Moreover, AtGH3.10 contributes to JA-amino acid biosynthesis and functions in wound stress response [18]. Overall, GH3s can also enhance resistance to various stresses by regulating hormones.
Pepper (Capsicum annuum L.), which belongs to the Solanaceae family, is an important vegetable crop with high economic benefits [19]. However, the growth of pepper is negatively affected by biotic and abiotic stresses, such as cold, heat, drought, salt, osmotic stress, and disease [20,21,22,23,24]. Endogenous IAA affects the growth and development of pepper plants [25]. Meanwhile, genes related to the auxin signaling pathway can alleviate the damage caused by stress to peppers [26]. GH3s, as auxin response genes, play significant roles in the auxin signaling pathway; thus, the study of CaGH3 of pepper is necessary to determine the biological processes involved in multiple stresses. In this study, we identified the CaGH3 members in pepper and determined their physicochemical properties, phylogenetic relationships, and expression patterns. The present study not only establishes a foundation for further studies on the pepper GH3 gene but also provides certain candidate genes with potential applications in molecular breeding to improve pepper stress resistance.

2. Results

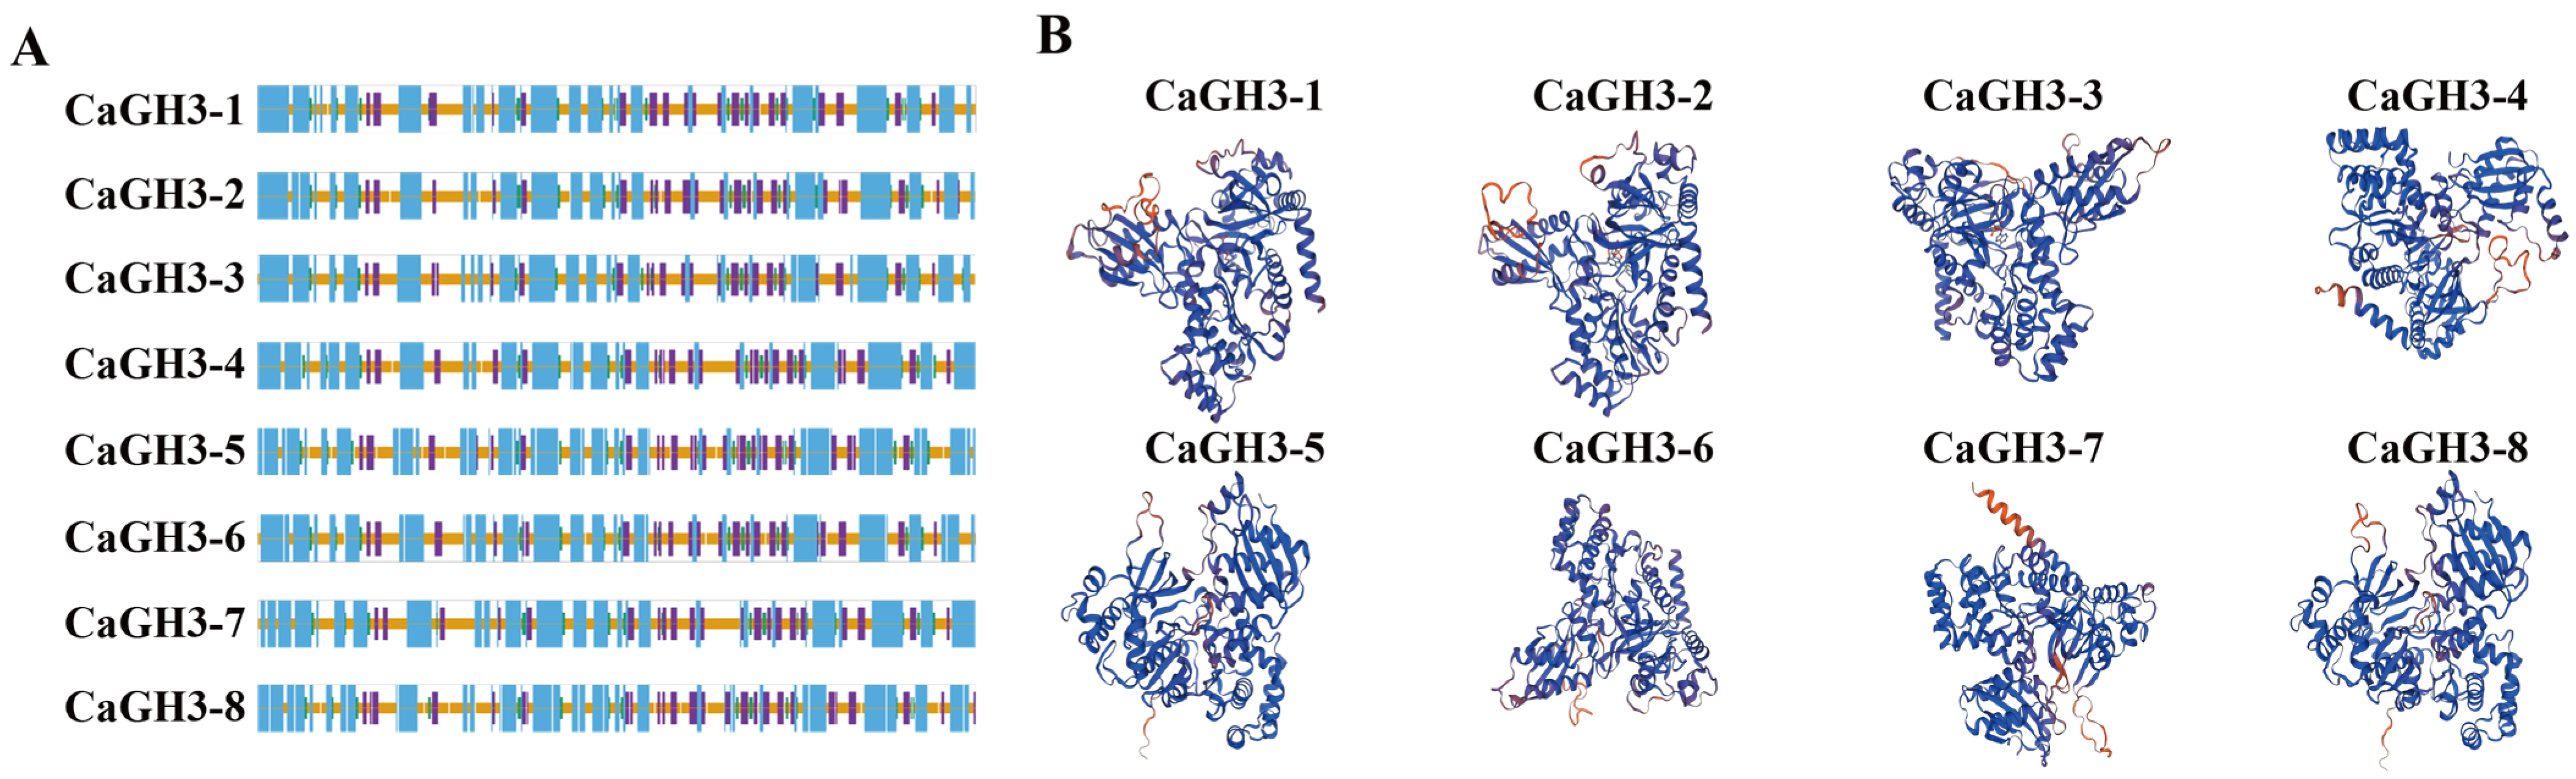
2.1. Identification and Characterization of CaGH3 Gene Family in Pepper

Based on the known GH3 protein domain, a total of eight CaGH3 gene family members were identified in the pepper genome (Table 1). These CaGH3 genes were named CaGH3-1 to CaGH3-8 based on their chromosome location and were separately located at 4 of the 12 pepper chromosomes—Chr2, Chr7, Chr8, and Chr10, where each chromosome contains two genes (Table 1). Subsequently, the physical and chemical properties of the CaGH3 genes were predicted, as shown in Table 1. The lengths of these proteins ranged from 575 (CaGH3-5) to 609 (CaGH3-7) amino acids (aa). Their molecular weights (MWs) ranged from 64.28 KDa (CaGH3-5) to 69.42 KDa (CaGH3-7). The lowest isoelectric point (pI) was 5.39 (CaGH3-3) and the highest pI was 7.26 (CaGH3-7). The protein instability coefficients of the CaGH3 proteins ranged from 31.81 (CaGH3-5) to 47.34 (CaGH3-7), and most were unstable, except for two, namely the CaGH3-5 and CaGH3-8 proteins, as their instability indexes were below 40. The lowest predicted hydrophilicity was -0.34 (CaGH3-4) and the highest was −0.11 (CaGH3-8), suggesting that all members of the family were characterized by hydrophilic properties. In addition, the predicted subcellular localization results indicated that eight CaGH3 proteins were located in the chloroplast. The differences in the physical and chemical properties of these members indicated that they might play roles in different biological processes.
The secondary structure of the CaGH3 proteins consisted of α-helix (41.62–44.35%), β-turn (4.20–5.15%), extended strand (13.06–15.54%), and random coil (36.52–40.83%), among which α-helix and random coil were the main components (Table 1 and Figure 1A). A three-dimensional structural analysis showed that the CaGH3 gene family members had different structures and indicated their functional diversity (Figure 1B).

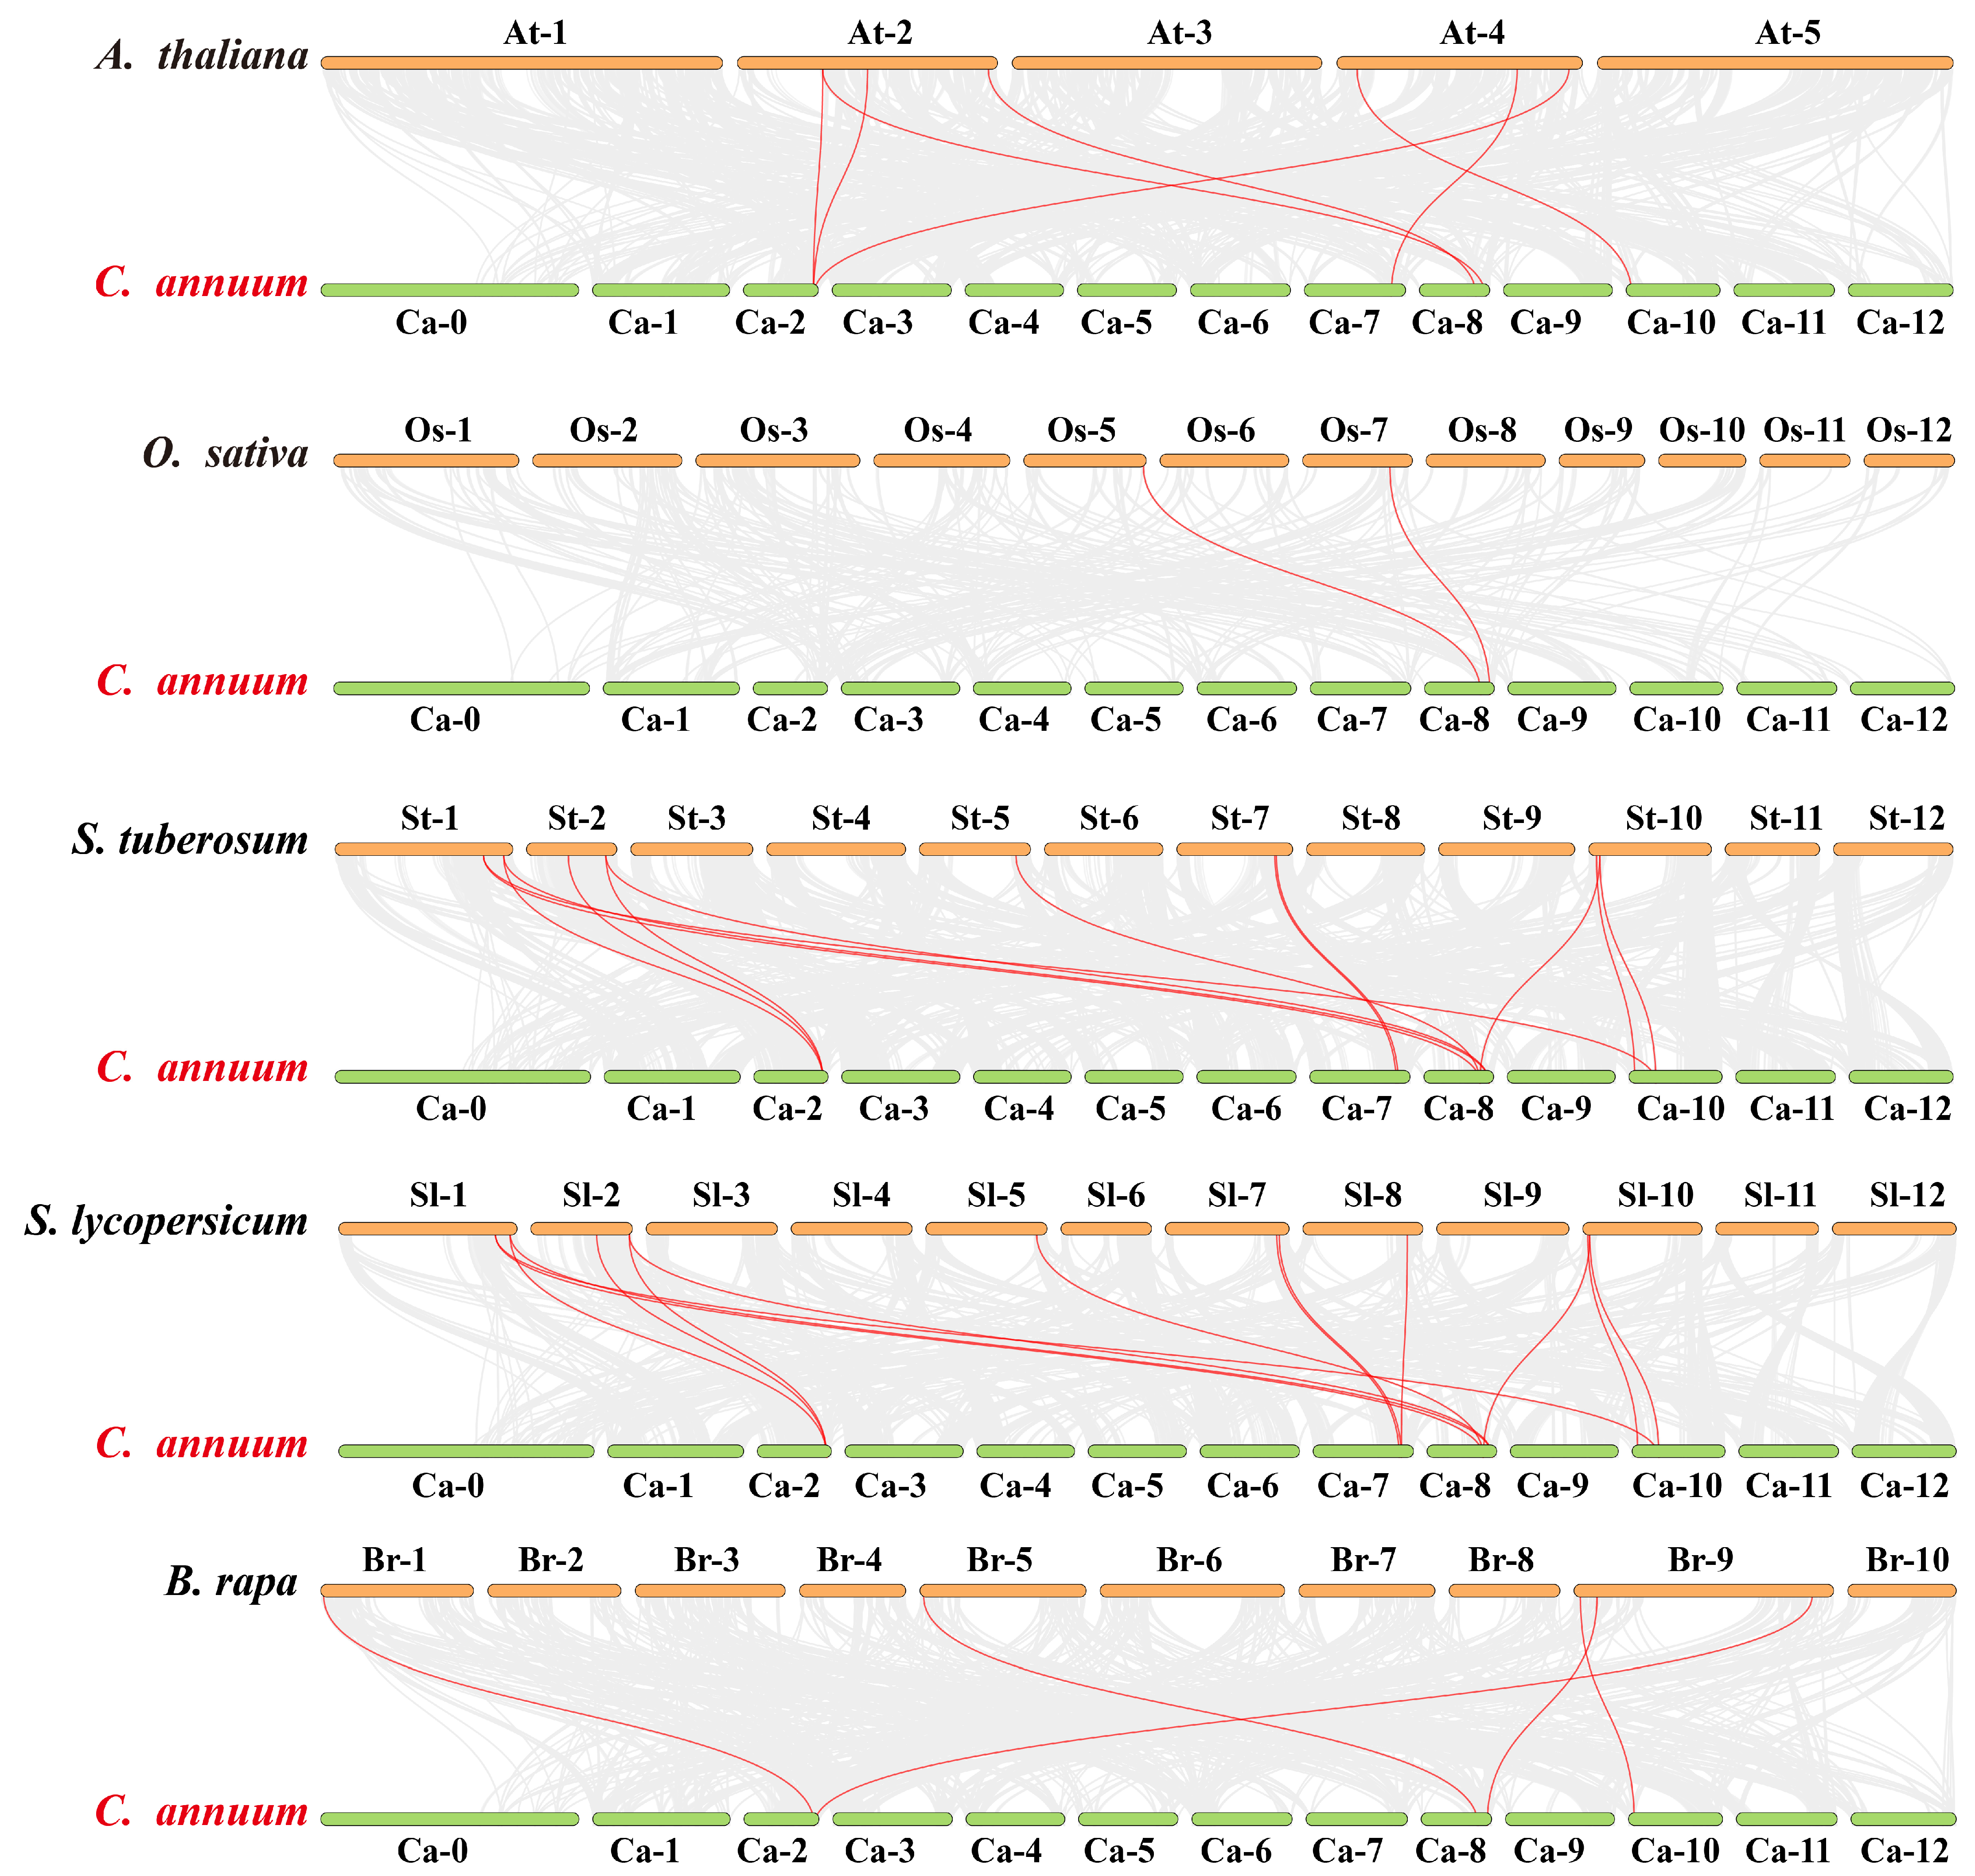
2.2. Prediction of Collinear Analysis of CaGH3 Family Genes

The collinearity relationships of the GH3 genes between pepper and five other species (Arabidopsis thaliana, Oryza sativa, Solanum tuberosum, S. lycopersicum, and Brassica rapa) were analyzed (Figure 2). The numbers of homologous pairs in these five species were 7, 2, 13, 14, and 5, respectively, indicating that there were more GH3 homologous genes between Solanaceae crops and pepper. The CaGH3 genes had the most gene pairs with S. lycopersicum. CaGH3-2 and CaGH3-5 had three syntenic gene pairs with S. lycopersicum; CaGH3-4, CaGH3-6, and CaGH3-8 had two pairs; and CaGH3-3 and CaGH3-7 had only one pair. Furthermore, we found that CaGH3-2 had the most syntenic gene pairs: three gene pairs with S. lycopersicum, S. tuberosum, and A. thaliana, respectively, and two gene pairs with B. rapa. This suggests that CaGH3-2 might play a key role in the evolution of the CaGH3 family. Notably, no homologous genes of CaGH3-1 were found in these species, indicating that the CaGH3 genes in different species might have been copied, retained, or lost to different degrees during evolution.

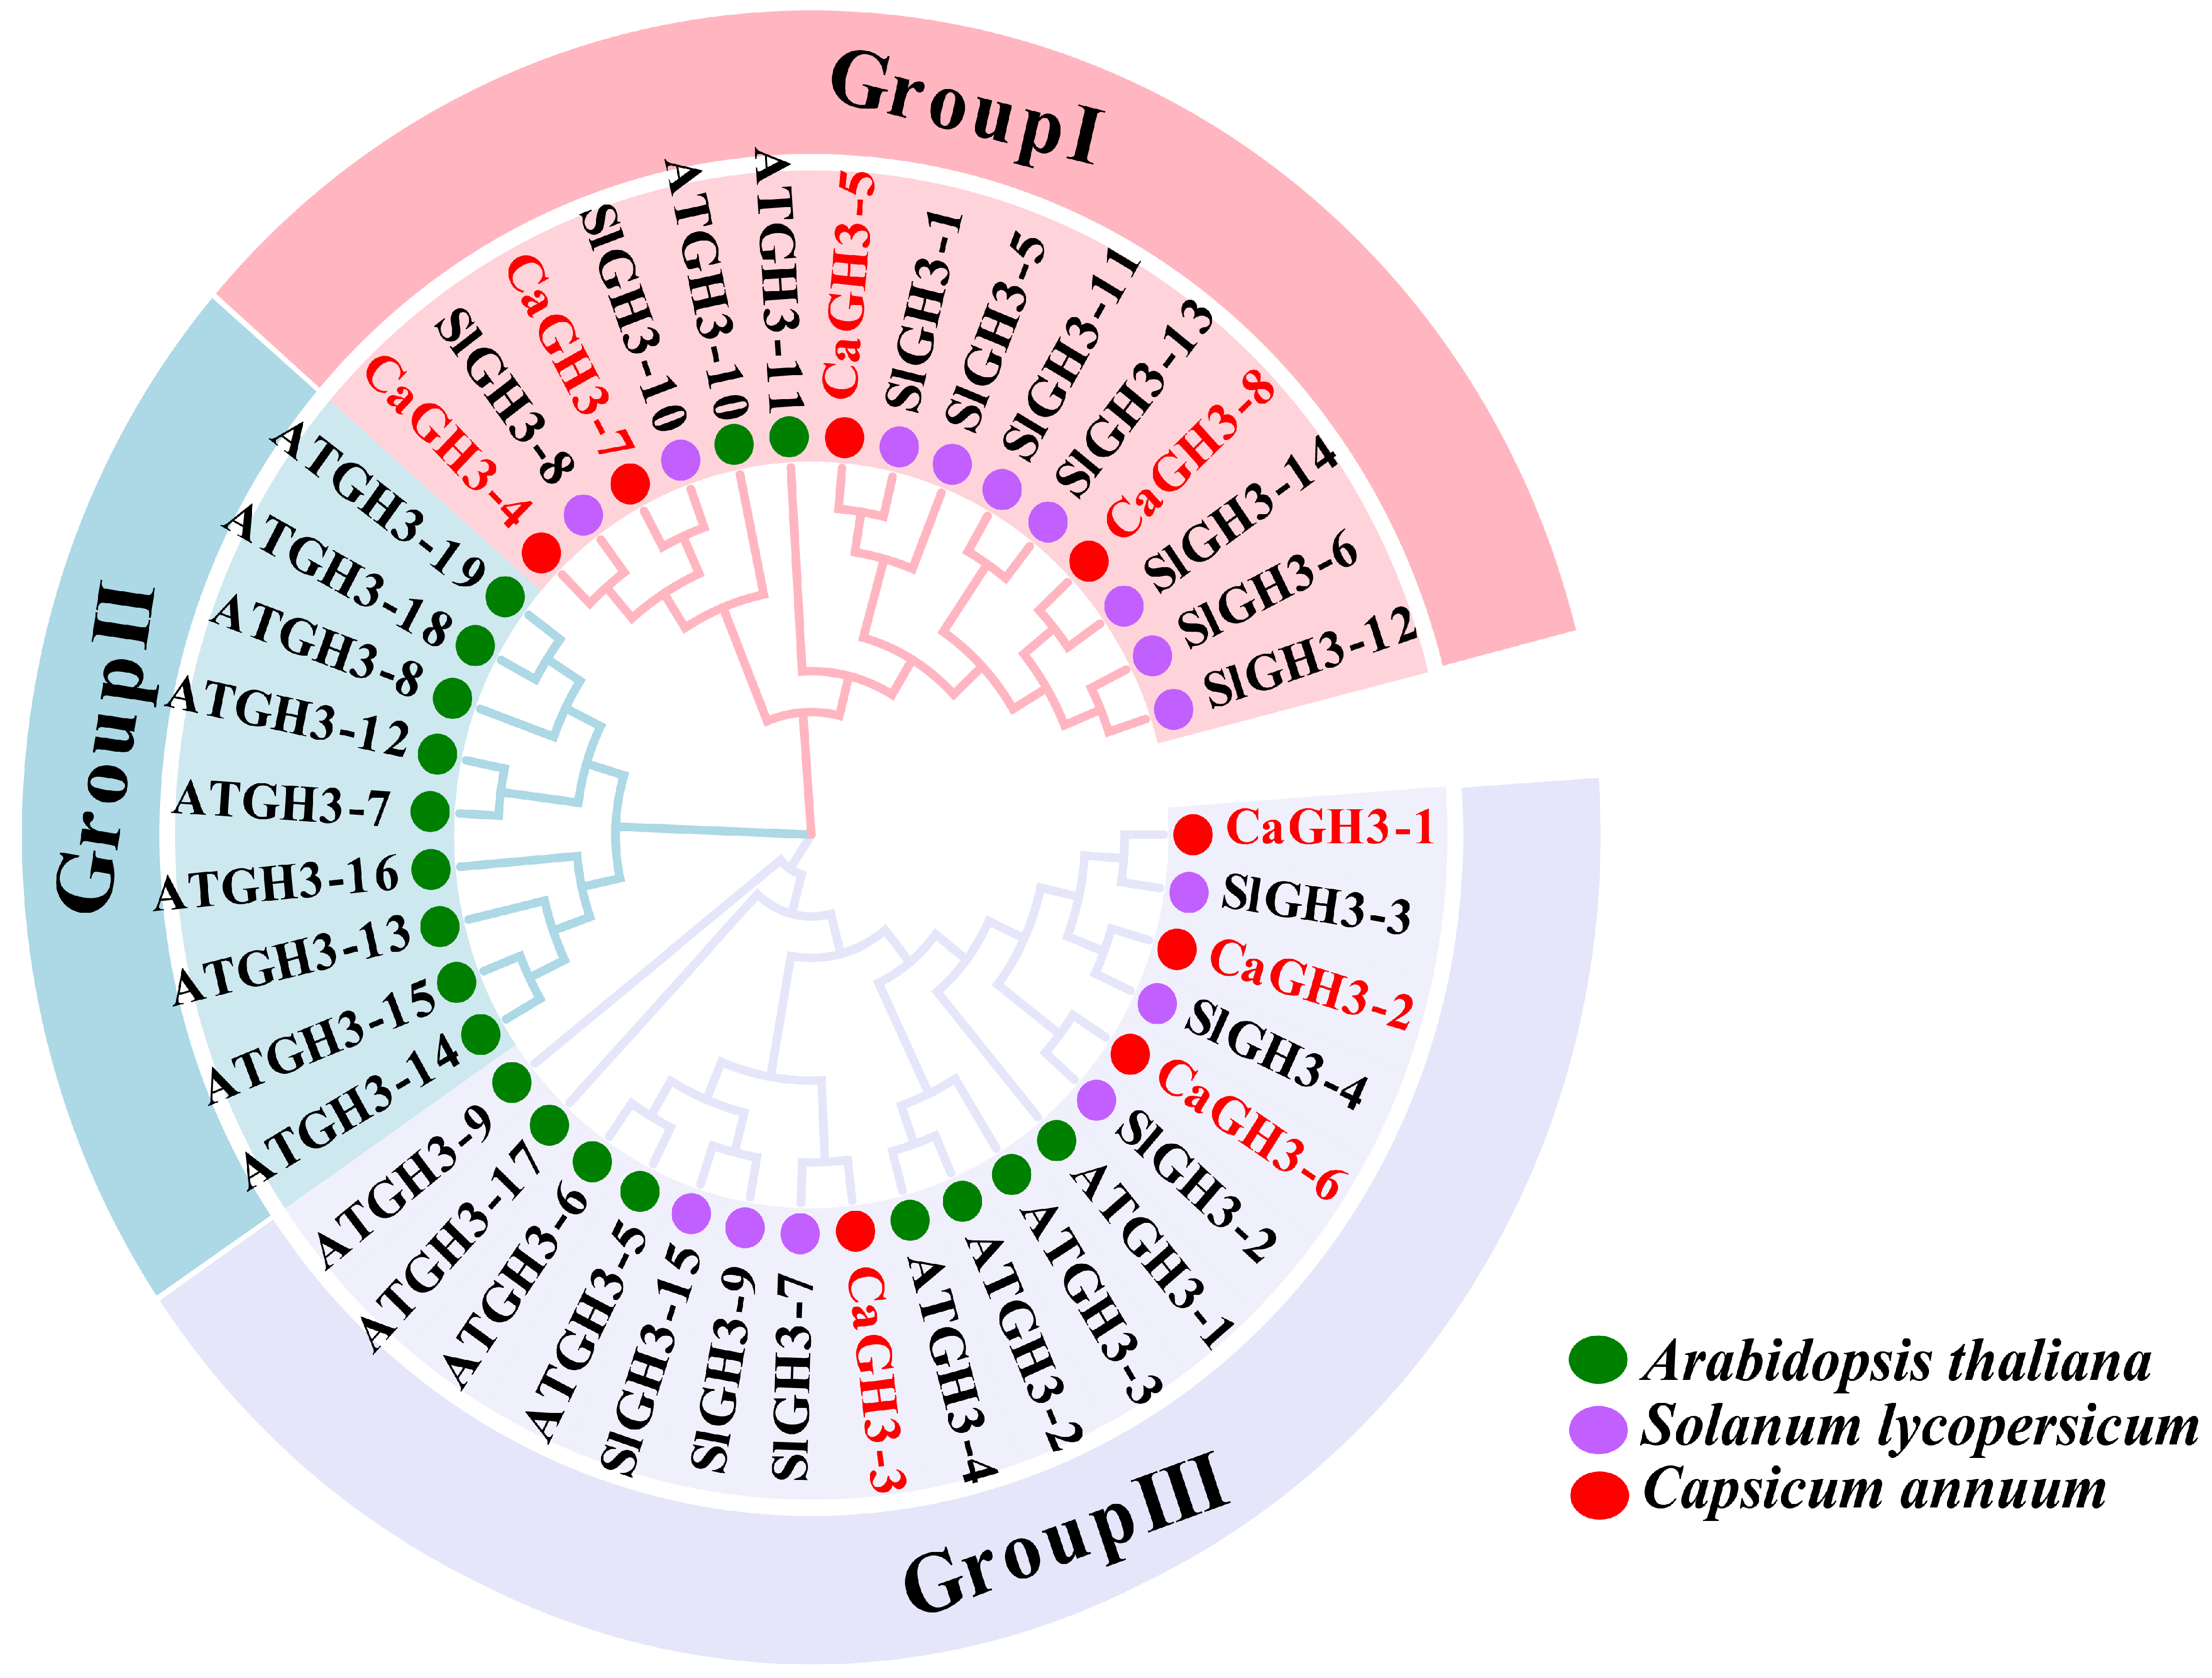
2.3. Evolutionary Analysis of CaGH3 Genes Among Multiple Species

A phylogenetic tree of GH3 proteins from pepper and other two species (A. thaliana and S. lycopersicum) was constructed (Figure 3). The tree shows that all CaGH3 proteins were divided into two groups (I and III). A total of four CaGH3s (CaGH3-4, CaGH3-5, CaGH3-7, and CaGH3-8) were classified into group I and four CaGH3s (CaGH3-1, CaGH3-2, CaGH3-3, and CaGH3-6) were classified into group III. Interestingly, there were no CaGH3 members clustered into group II. These results indicate that the functions of CaGH3s in pepper are diverse.

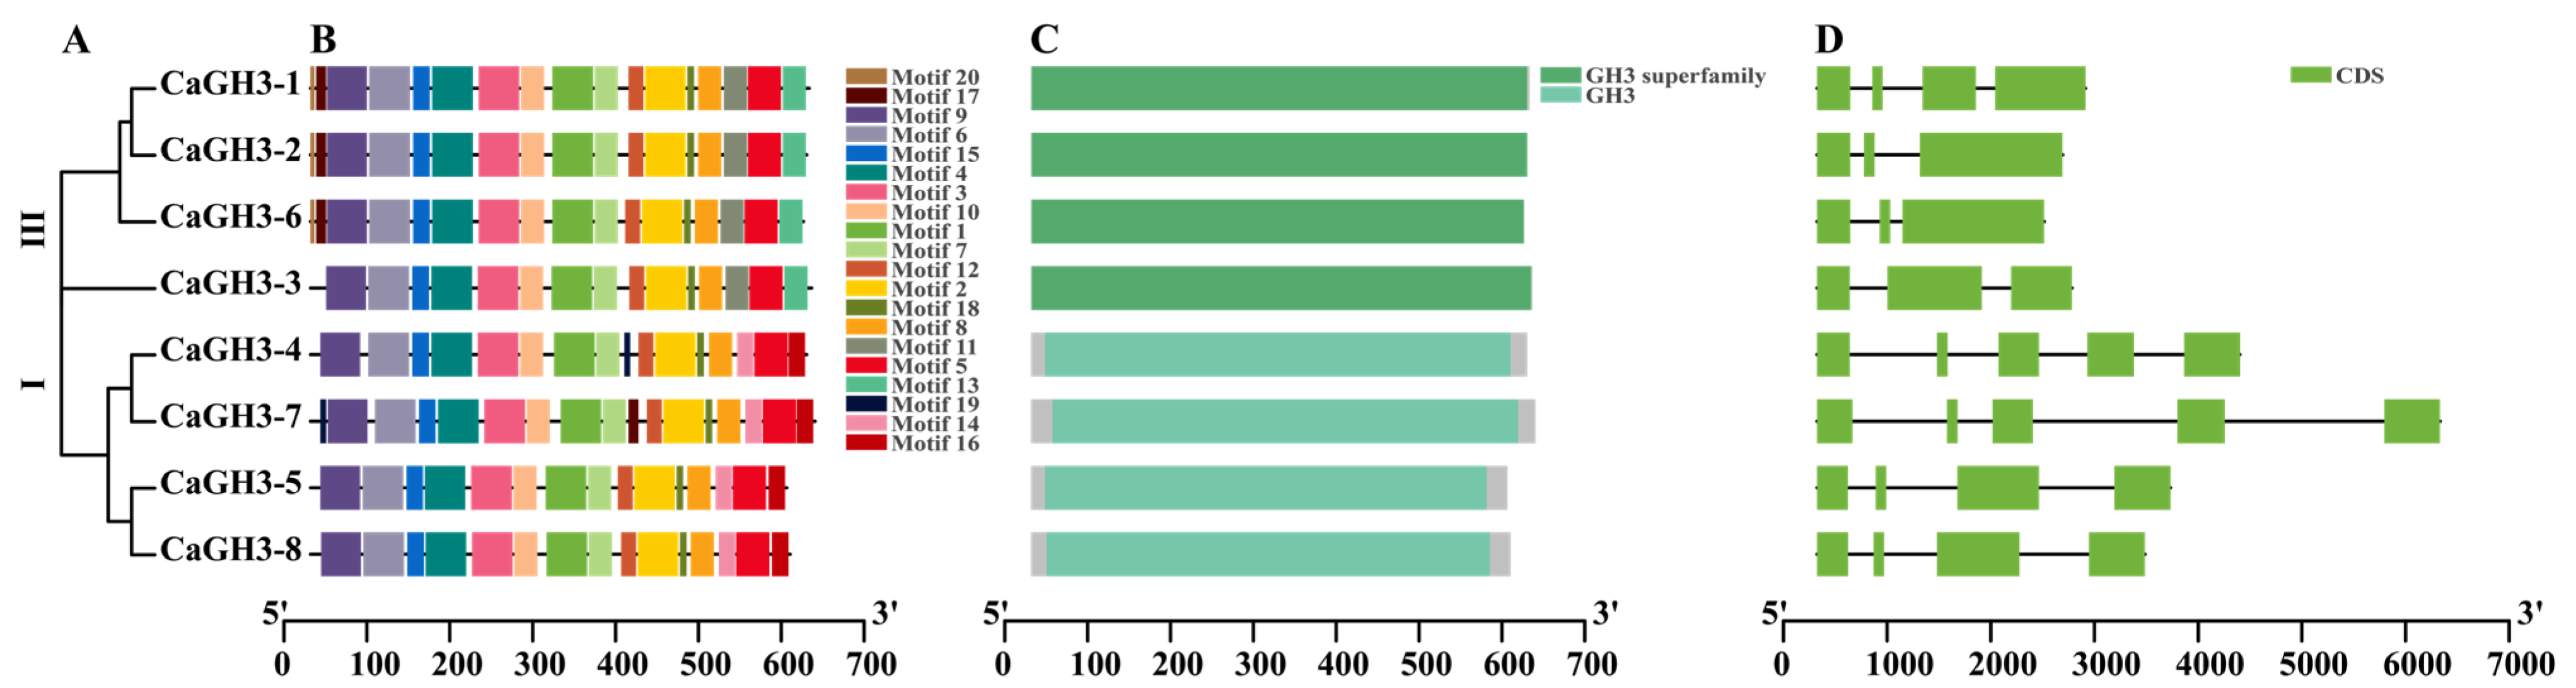
2.4. Phylogenetic, Conserved Motifs, Domains, and Gene Structures of CaGH3 Family Genes

To further predict the function of CaGH3 proteins, 20 conserved motifs were identified using MEME (Figure 4B). The number of motifs of CaGH3 proteins varied from 15 to 17, and all of them contained 13 conserved motifs. However, some conserved motifs were specific to the group classification. Motifs 14 and 16 were only presented in group I and motifs 11 and 13 were only presented in group III. Thus, these motifs might play different functions in different groups (Figure 4A,B). Furthermore, the analysis of the conserved domains showed that CaGH3 protein sequences all contain conserved GH3 domains or GH3 superfamily domains (Figure 4C). The exon/intron structures of CaGH3s were determined by comparing their genomic DNA sequences (Figure 4D). The results show that all of the coding sequences of the CaGH3 genes were disrupted by introns; the number of introns ranged from two to four and the number of exons ranged from three to five. Generally, the numbers and lengths of exons and introns were specific for each group (Figure 4D). Overall, the conserved motif, domains, and gene structures implied the similar function of the CaGH3 members.

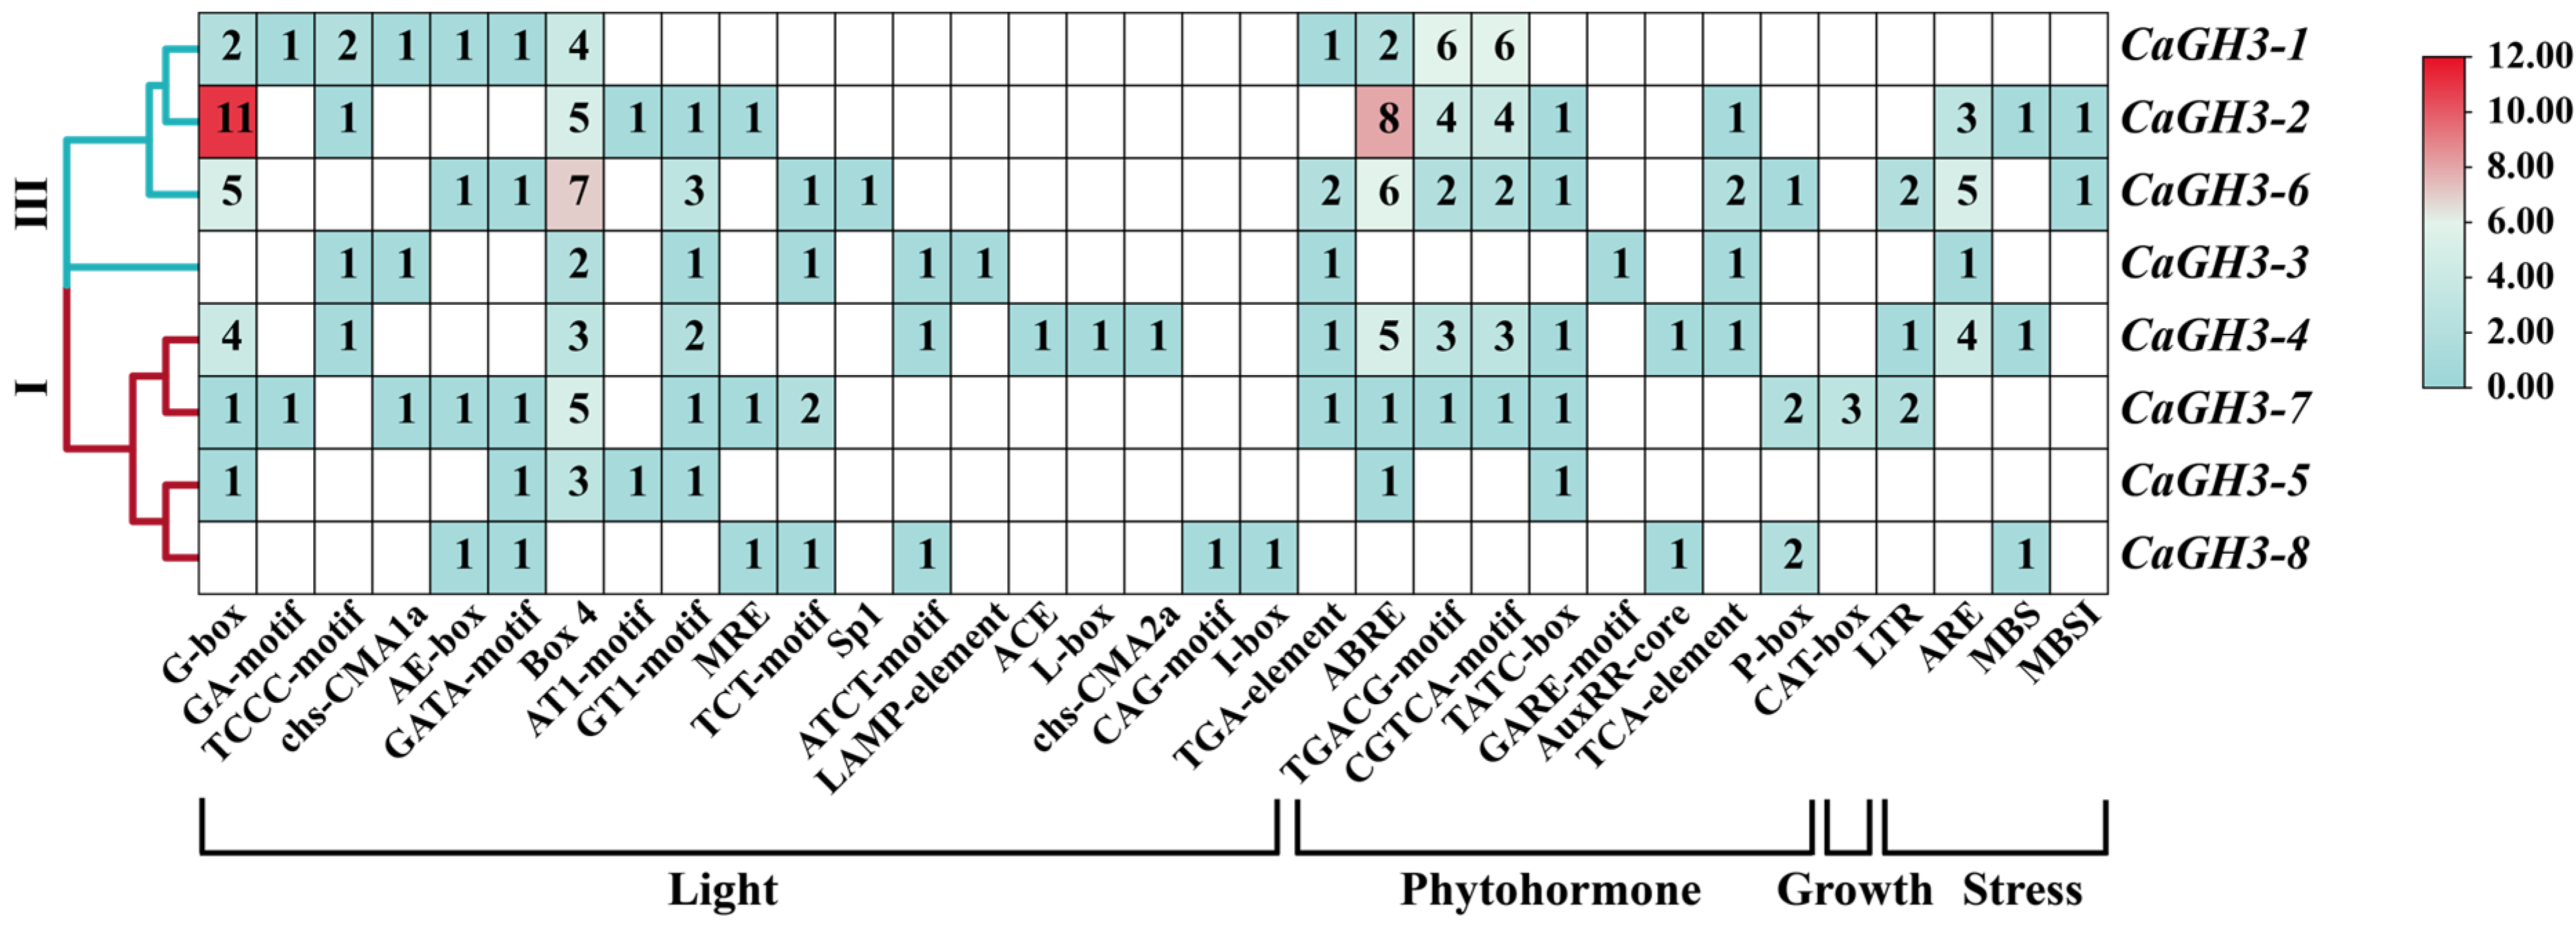
2.5. Analysis of Cis-Acting Elements of CaGH3 Promoters

The types and numbers of the cis-acting elements in the promoter sequences of CaGH3 genes were analyzed (Figure 5). In total, four kinds of cis-acting elements, including light-responsive elements, phytohormone-responsive, growth-related, and stress-related elements were randomly distributed in the promoter sequences [27,28,29]. The number of MeJA-responsive elements (TGACG motif and CGTCA motif) was the largest (32), followed by the ABA-responsive elements (ABRE, 23), auxin-responsive elements (TGA-element, AuxRR-core, 8), SA-responsive elements (TCA-element, 5), gibberellin-responsive elements (GARE-motif, P-box, TATC-box, 11), low-temperature-responsive elements (LTR, 5), and drought induction elements (MBS, 3). Notably, 50% of the promotors of CaGH3 genes contained anaerobic induction elements (AREs) and some had flavonoid biosynthesis elements (MBSI, 2). Overall, these elements were present in the promoters of the CaGH3 genes, implying that CaGH3 genes are widely involved in plant responses to various stimuli.

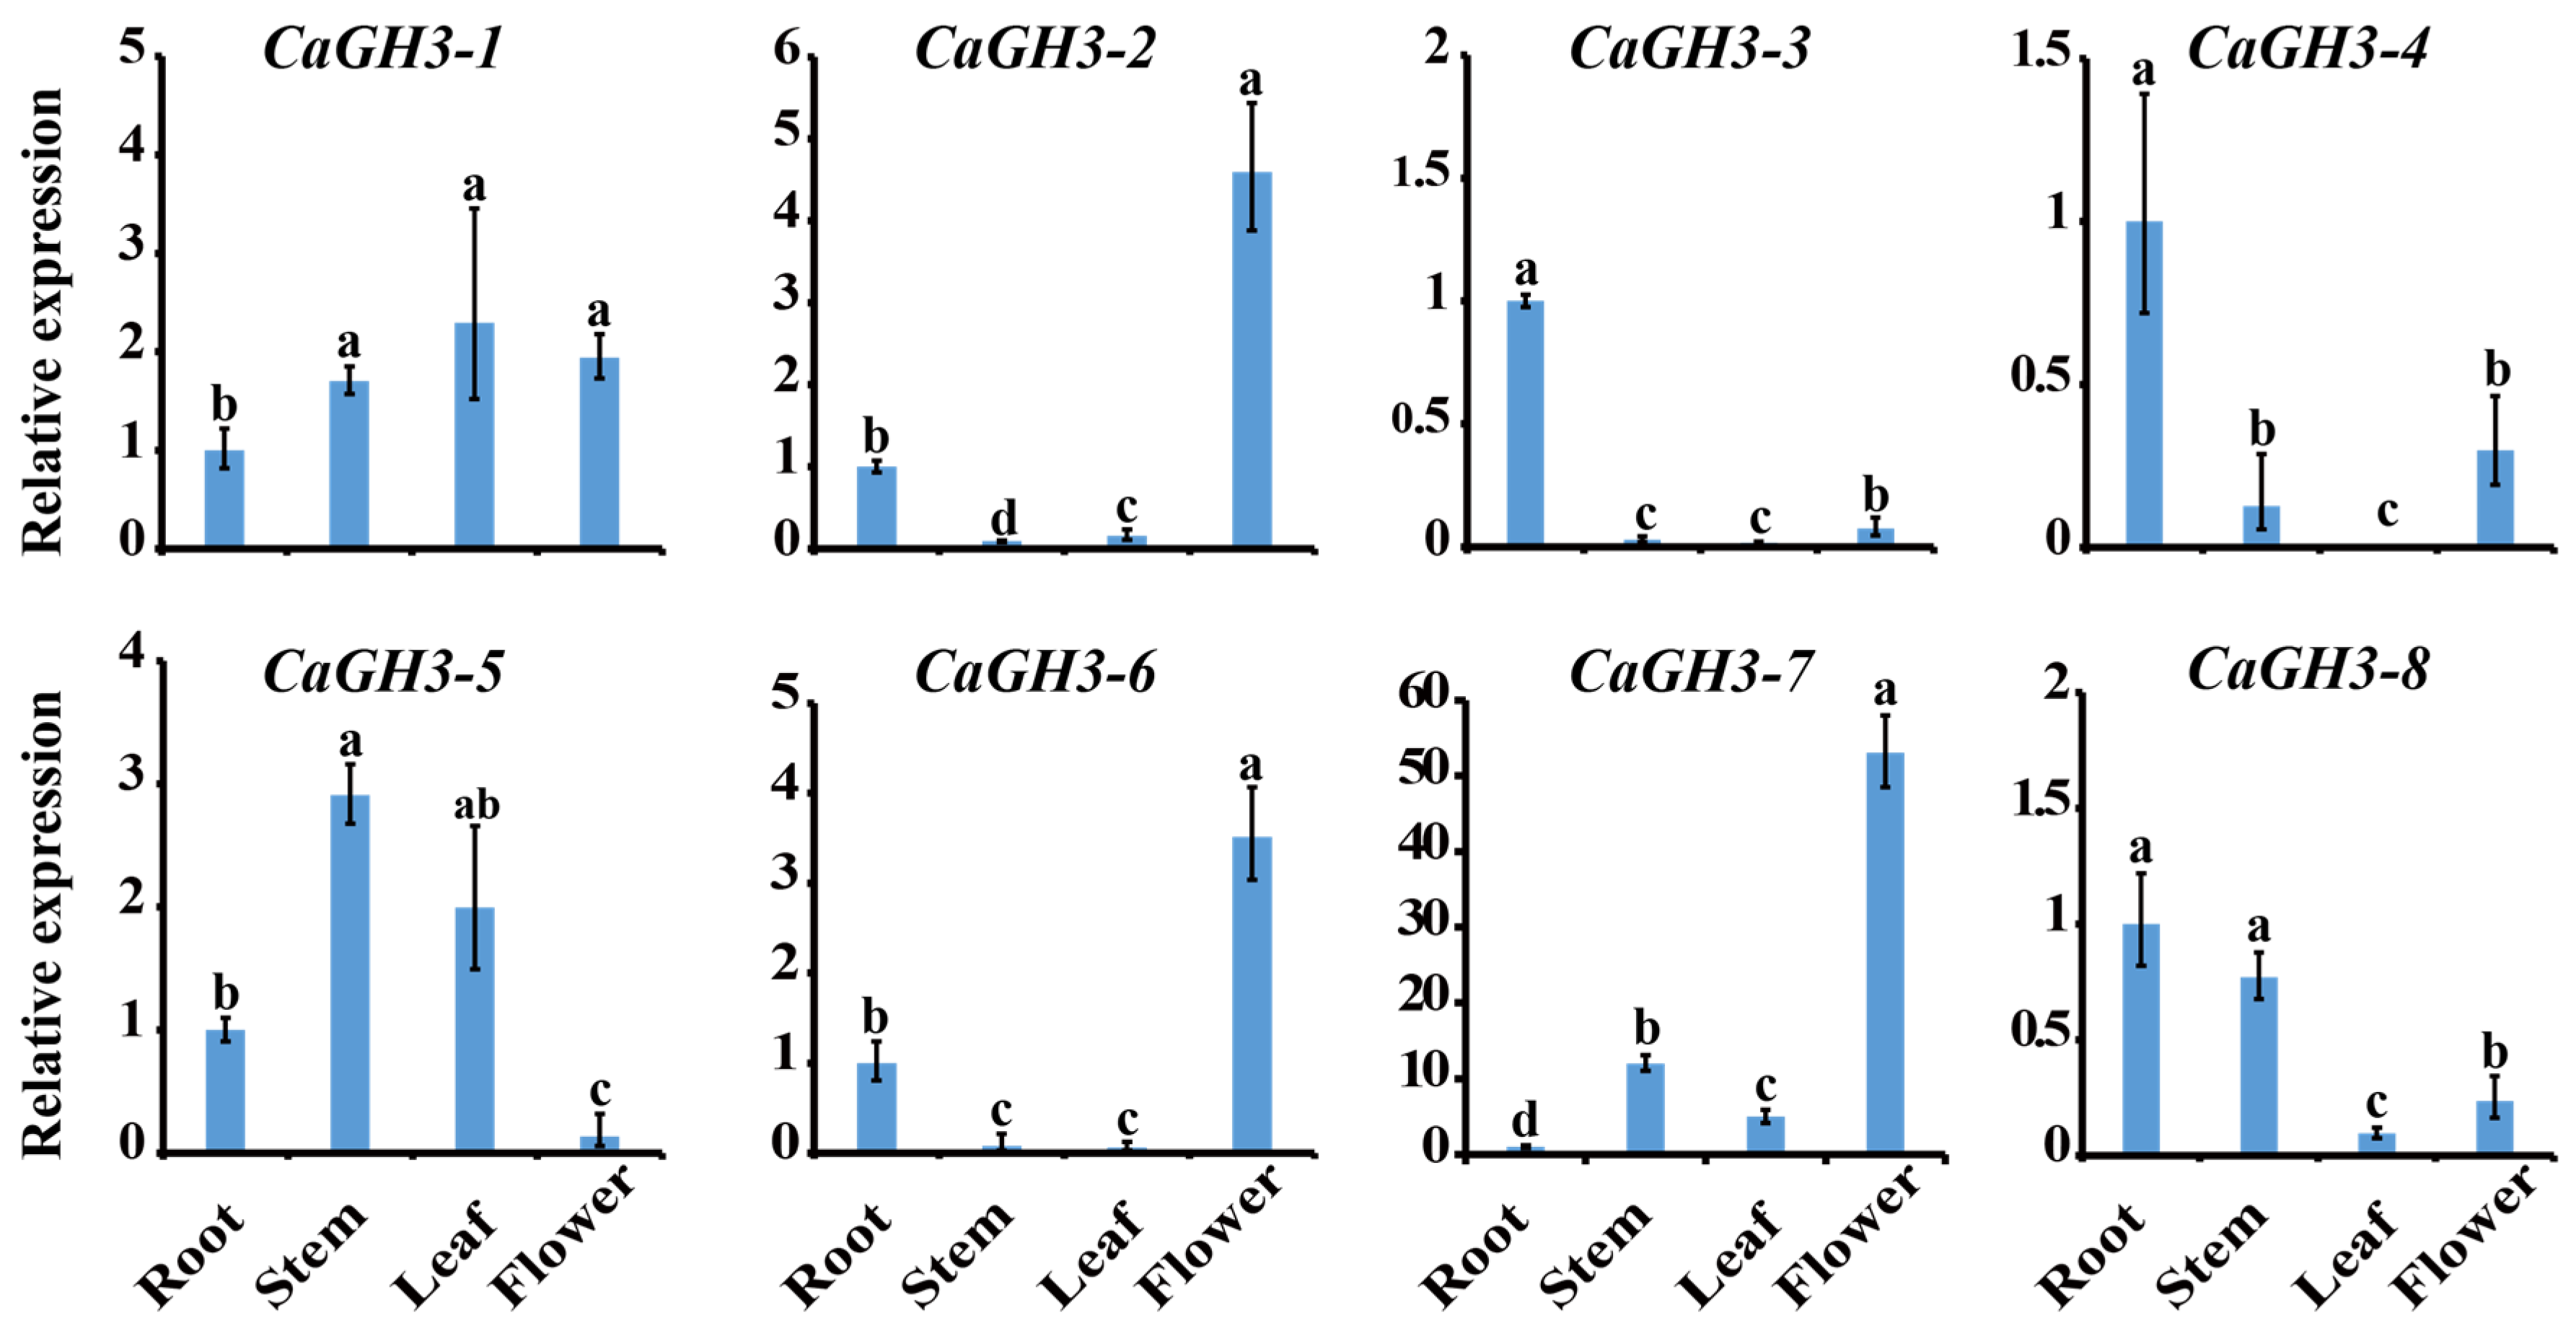
2.6. Expression Analysis of CaGH3 Genes in Different Tissues

The expressions of CaGH3 genes in different tissues (root, stem, leaf, and flower) were detected via qRT-PCR (Figure 6). The expression level of CaGH3-1 was the lowest in the root and showed no significant differences in the other tissues. The transcript levels of CaGH3-2 and CaGH3-6 were found to be hardly detectable in the stem and leaf, while they showed lower expression levels in the root and higher expression levels in the flower. The expression levels of CaGH3-3 and CaGH3-4 were high in the root, while low in the other tissues. The transcript level of CaGH3-5 was hardly detectable in the flower, but easily detectable in the other tissues, while the expression level of CaGH3-7 was highest in the flower compared to in the other tissues. The transcript level of CaGH3-8 was higher in the root and stem than in the other tissues. In short, all CaGH3 genes were differentially expressed in various tissues, indicating that their functions occurred at different stages of development.

2.7. Expression Patterns of CaGH3 Genes in Response to Different Hormone Treatments

The expression patterns of CaGH3 genes under IAA, ABA, and MeJA treatments were analyzed (Figure 7). Under the IAA treatment, the expressions of CaGH3-1 and CaGH3-8 exhibited a pattern of initial increase and subsequent decrease, and significant up-regulation after 3 h (37.84-fold) and 6 h (5.21-fold), respectively. The expression of CaGH3-2, CaGH3-3, and CaGH3-4 first declined, then rose, and finally dropped to a relatively low level. Among them, CaGH3-2 reached its peak expression at 6 h (9.65-fold) after treatment; CaGH3-3 at 3 h (5.98-fold); and CaGH3-4 at 12 h (2.88-fold). Interestingly, the expression of CaGH3-5 first declined, then rose, showing a fluctuating trend, and finally rose to the highest level at 24 h after treatment (3.95-fold). Moreover, the expression level of CaGH3-7 increased first, then remained at a relatively high level within 12 h after treatment, and finally decreased after 12 h. Notably, the expression level of CaGH3-6 was very high at 1h (62.57-fold) and 24 h (74.42-fold) after treatment but hardly detectable at other times.
Under the ABA treatment, all CaGH3 members except CaGH3-1, CaGH3-3, and CaGH3-5 exhibited a pattern of initial increase and subsequent decrease. Among them, CaGH3-2 reached its peak expression at 3 h (3.42-fold) after treatment, with CaGH3-4 (3.32-fold), CaGH3-6 (5.15-fold), CaGH3-7 (2.9-fold), and CaGH3-8 (3.69-fold) at 6 h. Moreover, the expression levels of CaGH3-1 and CaGH3-3 first increased, then showed a fluctuating trend, and finally reached their peak at 12 h (3.00-fold) and 1 h (2.33-fold), respectively. Additionally, the expression of CaGH3-5 exhibited a pattern of initial decrease and subsequent increase after treatment.
Under the MeJA treatment, the expression levels of CaGH3-1 and CaGH3-2 first increased, then showed a fluctuating trend, and finally reached their peak at 3 h (3.93-fold) and 6 h (6.69-fold), respectively. Meanwhile, the expression levels of CaGH3-3, CaGH3-4, and CaGH3-5 first decreased and then showed a fluctuating trend. Interestingly, the expression of CaGH3-6 increased sharply at 1 h (71.81-fold) after treatment and then dropped quickly to the lowest level, finally reaching its highest level at 24 h (106.79-fold). Notably, CaGH3-7 and CaGH3-8 exhibited a pattern of initial increase and subsequent decreased, and they reached the peak at 12 h (13.34-fold) and 3 h (8.24-fold), respectively.
In summary, the expression levels of CaGH3-1, CaGH3-2, and CaGH3-3 were relatively high after IAA treatment; those of CaGH3-4 and CaGH3-5 were relatively high after ABA treatment; and those of CaGH3-6, CaGH3-7, and CaGH3-8 were relatively high after MeJA treatment. These results reveal that all CaGH3 genes might play regulatory roles in these signaling pathways.

2.8. Expression Patterns of CaGH3 Genes in Response to Different Stresses

The expression patterns of CaGH3 genes under salt, low-temperature, and drought treatments were analyzed (Figure 8). Under the salt treatment, the expression level of CaGH3-1 and CaGH3-5 first decreased, then increased to a peak at 3 h (6.93-fold) and 12 h (11.26-fold), and then dropped again, while that of CaGH3-1 increased again at 24 h. Moreover, CaGH3-2 exhibited a pattern of initial decrease and then an increase to the peak at 24 h (3.39-fold). Conversely, CaGH3-7 (2.56-fold) and CaGH3-8 (17.56-fold) showed a pattern of initial increase to their peak at 3 h and then a drop to the lower level. The expression of CaGH3-3 first increased, then declined, and finally reached its peak at 24 h (16.44-fold). Notably, the expression levels of CaGH3-4 (10.53-fold) and CaGH3-6 (39.00-fold) gradually increased and reached their peak at 24 h.
Under the low-temperature treatment, all CaGH3 members except for CaGH3-1 and CaGH3-5 exhibited a pattern of initial increase and subsequent decline. Among them, CaGH3-2 (6.51-fold), CaGH3-4 (17.64-fold), CaGH3-6 (15.77-fold), CaGH3-7 (3.20-fold), and CaGH3-8 (5.27-fold) reached their peak at 6 h after treatment, with CaGH3-3 reaching it at 12 h (20.74-fold). The expression of CaGH3-5 first decreased at 1 h, then increased at 3 h (3.83-fold), and then dropped quickly at 6 h, finally reaching a high level at 24 h (3.90-fold). Notably, the expression of CaGH3-1 did not change significantly in response to low temperature.
Under the drought treatment, all CaGH3 genes except for CaGH3-1, CaGH3-2, and CaGH3-6 showed a trend of increasing at first and then decreasing. Among them, the expressions of CaGH3-4 (14.83-fold), CaGH3-7 (4.81-fold), and CaGH3-8 (12.41-fold) reached their peak at 3 h after treatment, with CaGH3-3 and CaGH3-5 reaching the peak at 1 h (15.82-fold) at 6 h (6.15-fold), respectively. In addition, the expression of CaGH3-1, CaGH3-2, and CaGH3-6 first declined, then increased, and finally dropped to a low level.
Overall, the expression levels of CaGH3-1, CaGH3-5, and CaGH3-6 were relatively high under salt treatment; those of CaGH3-2 and CaGH3-3 were relatively high under low-temperature treatment; and that of CaGH3-7 was relatively high under drought treatment. These results reveal that all CaGH3 genes might play regulatory roles in these signaling pathways.

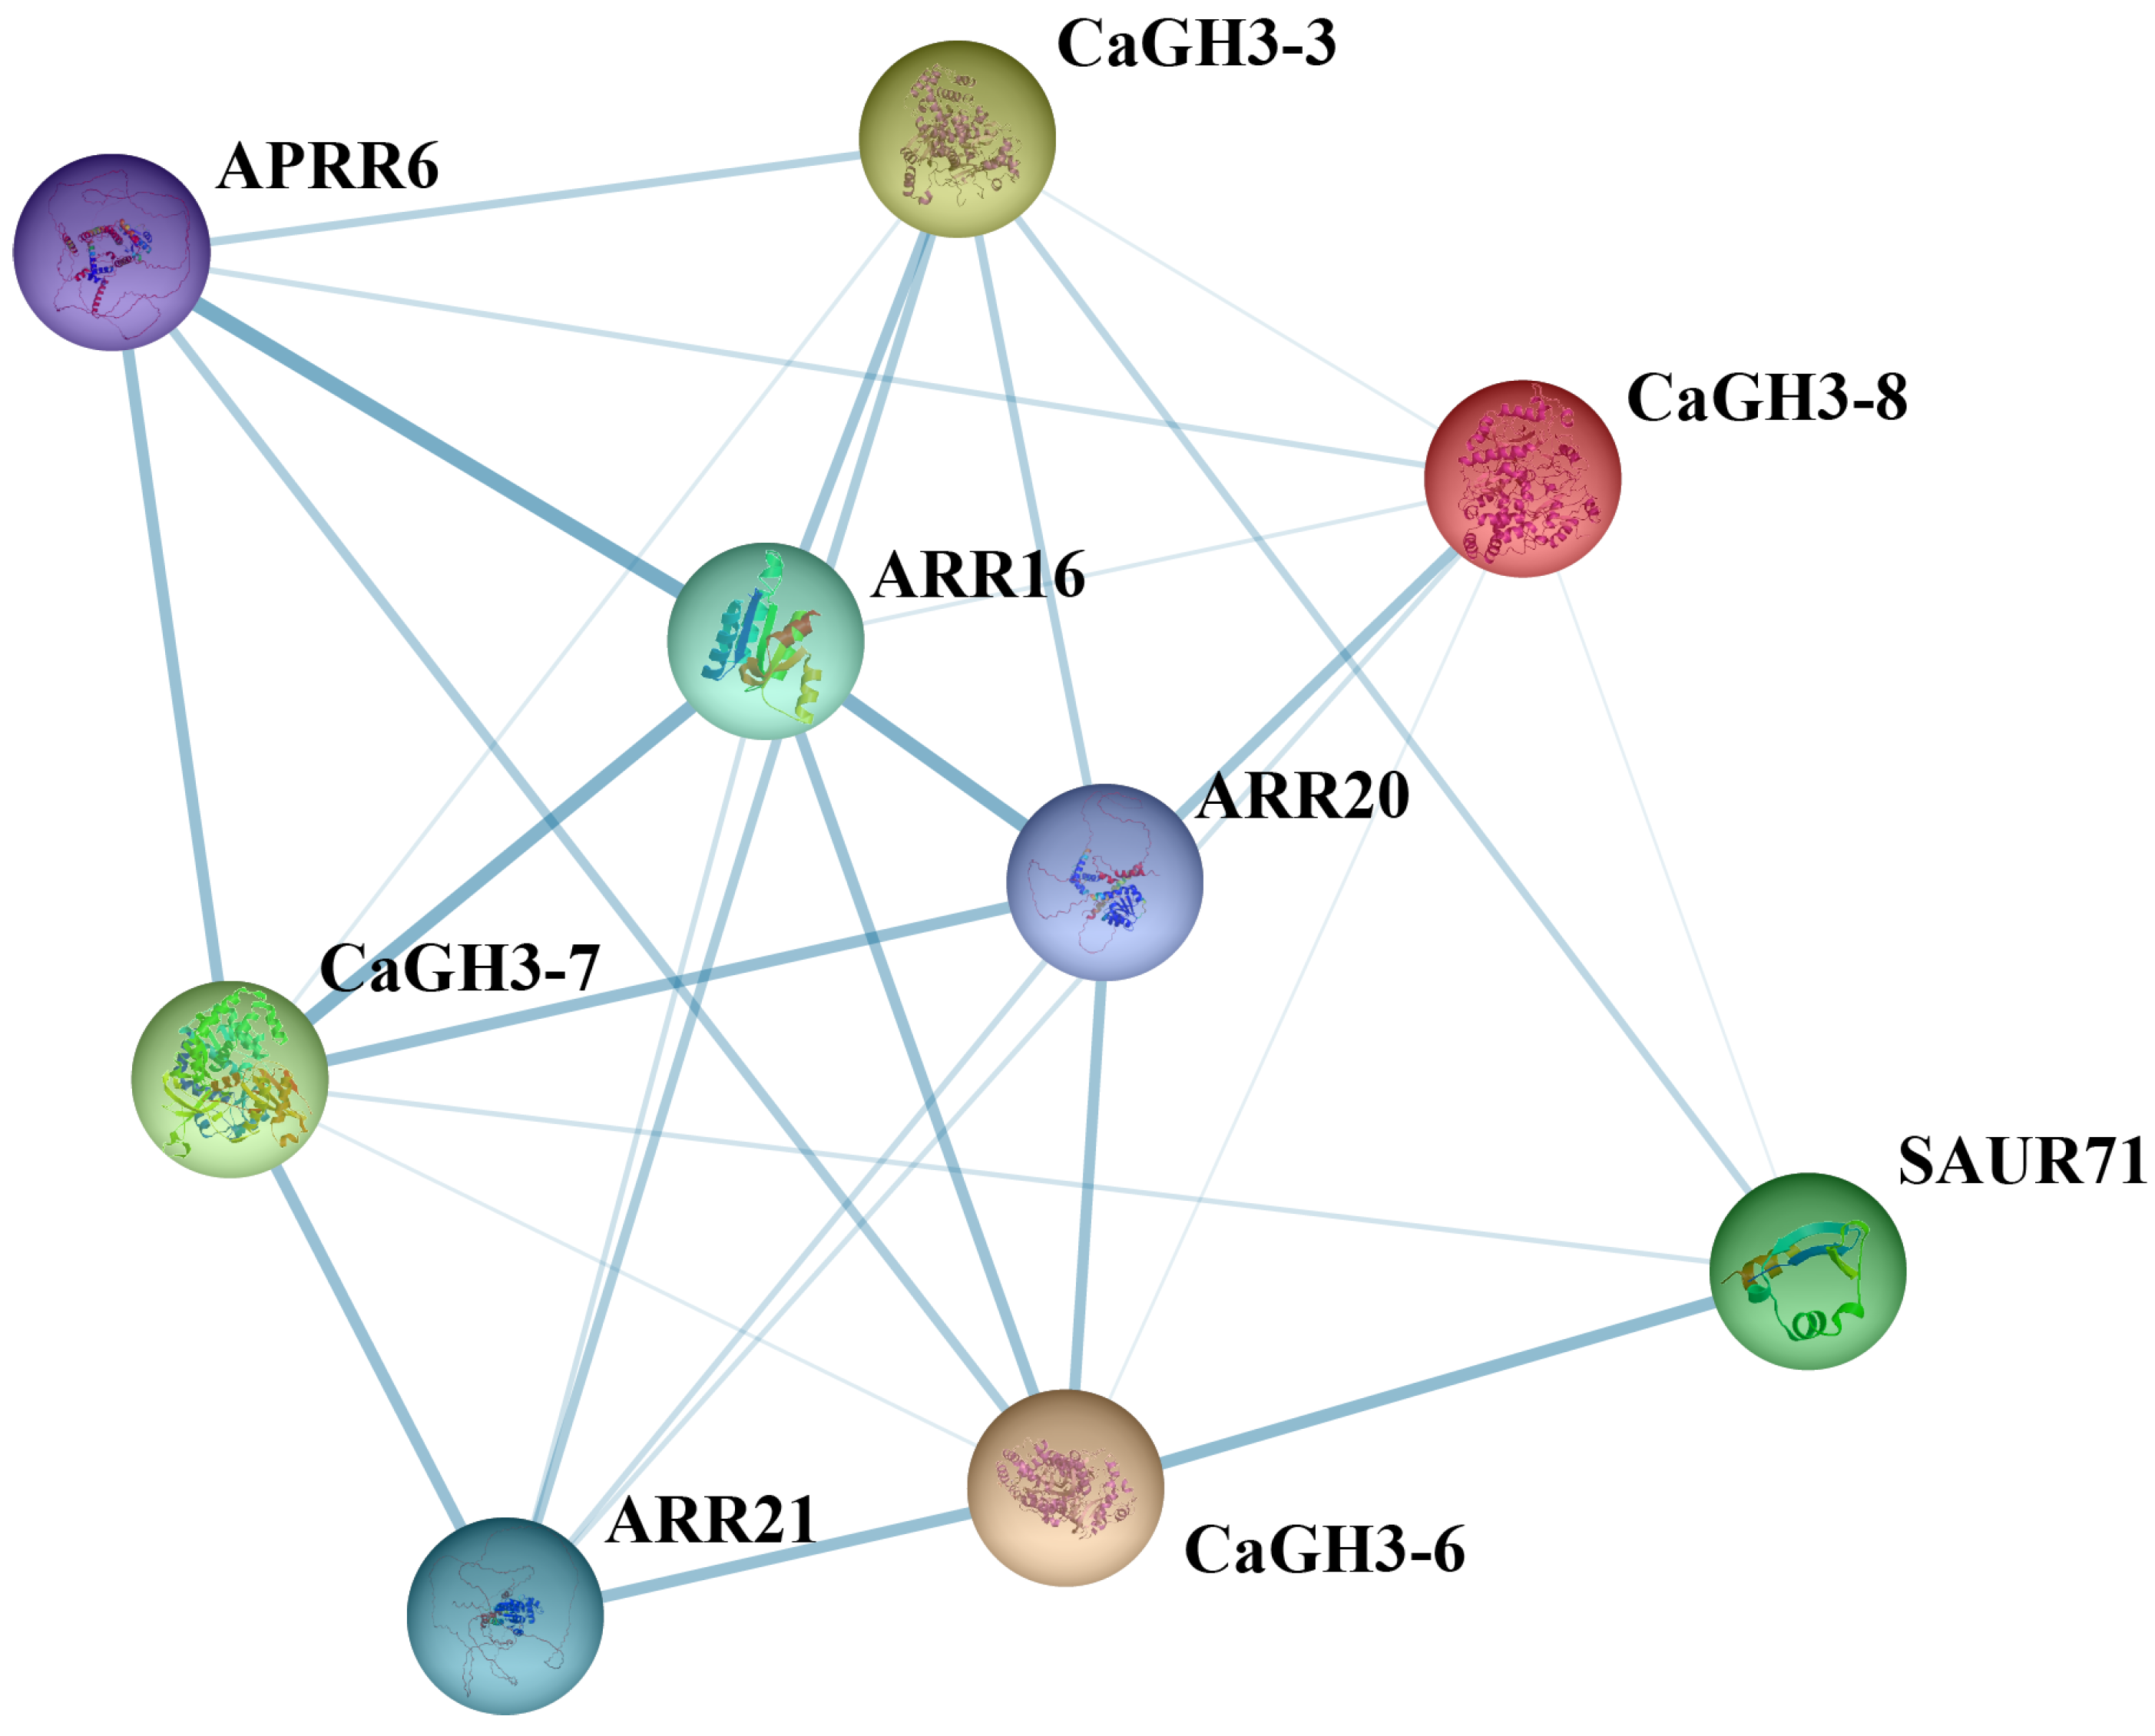
2.9. Prediction of Interacting Proteins Among CaGH3 Family Genes

To deeply comprehend the molecular mechanism of CaGH3s, the interactions among eight CaGH3 proteins were examined (Figure 9). In total, nine nodes and 28 edges were determined, indicating that nine proteins have 28 interactions, including four CaGH3 proteins. Among them, the CaGH3-3, CaGH3-6, CaGH3-7, and CaGH3-8 proteins interacted with two pepper CaGH3 members, indicating that they were possibly core members of the CaGH3 family. Furthermore, in addition to the CaGH3 family, CaGH3-3 and CaGH3-6 both had strong interaction relationships with five proteins: Small auxin up RNA 71 (SAUR71), Arabidopsis response regulator 16 (ARR16), ARR20, ARR21, and Arabidopsis putative response regulator-like 6 (APRR6); CaGH3-7 had strong interactions with four proteins: ARR16, ARR 20, ARR 21, and APRR6; and CaGH3-8 had strong interactions with two proteins: ARR 20 and APRR6. Therefore, this protein interaction network analysis offered evidence for verifying the function and mechanism of CaGH3 proteins.

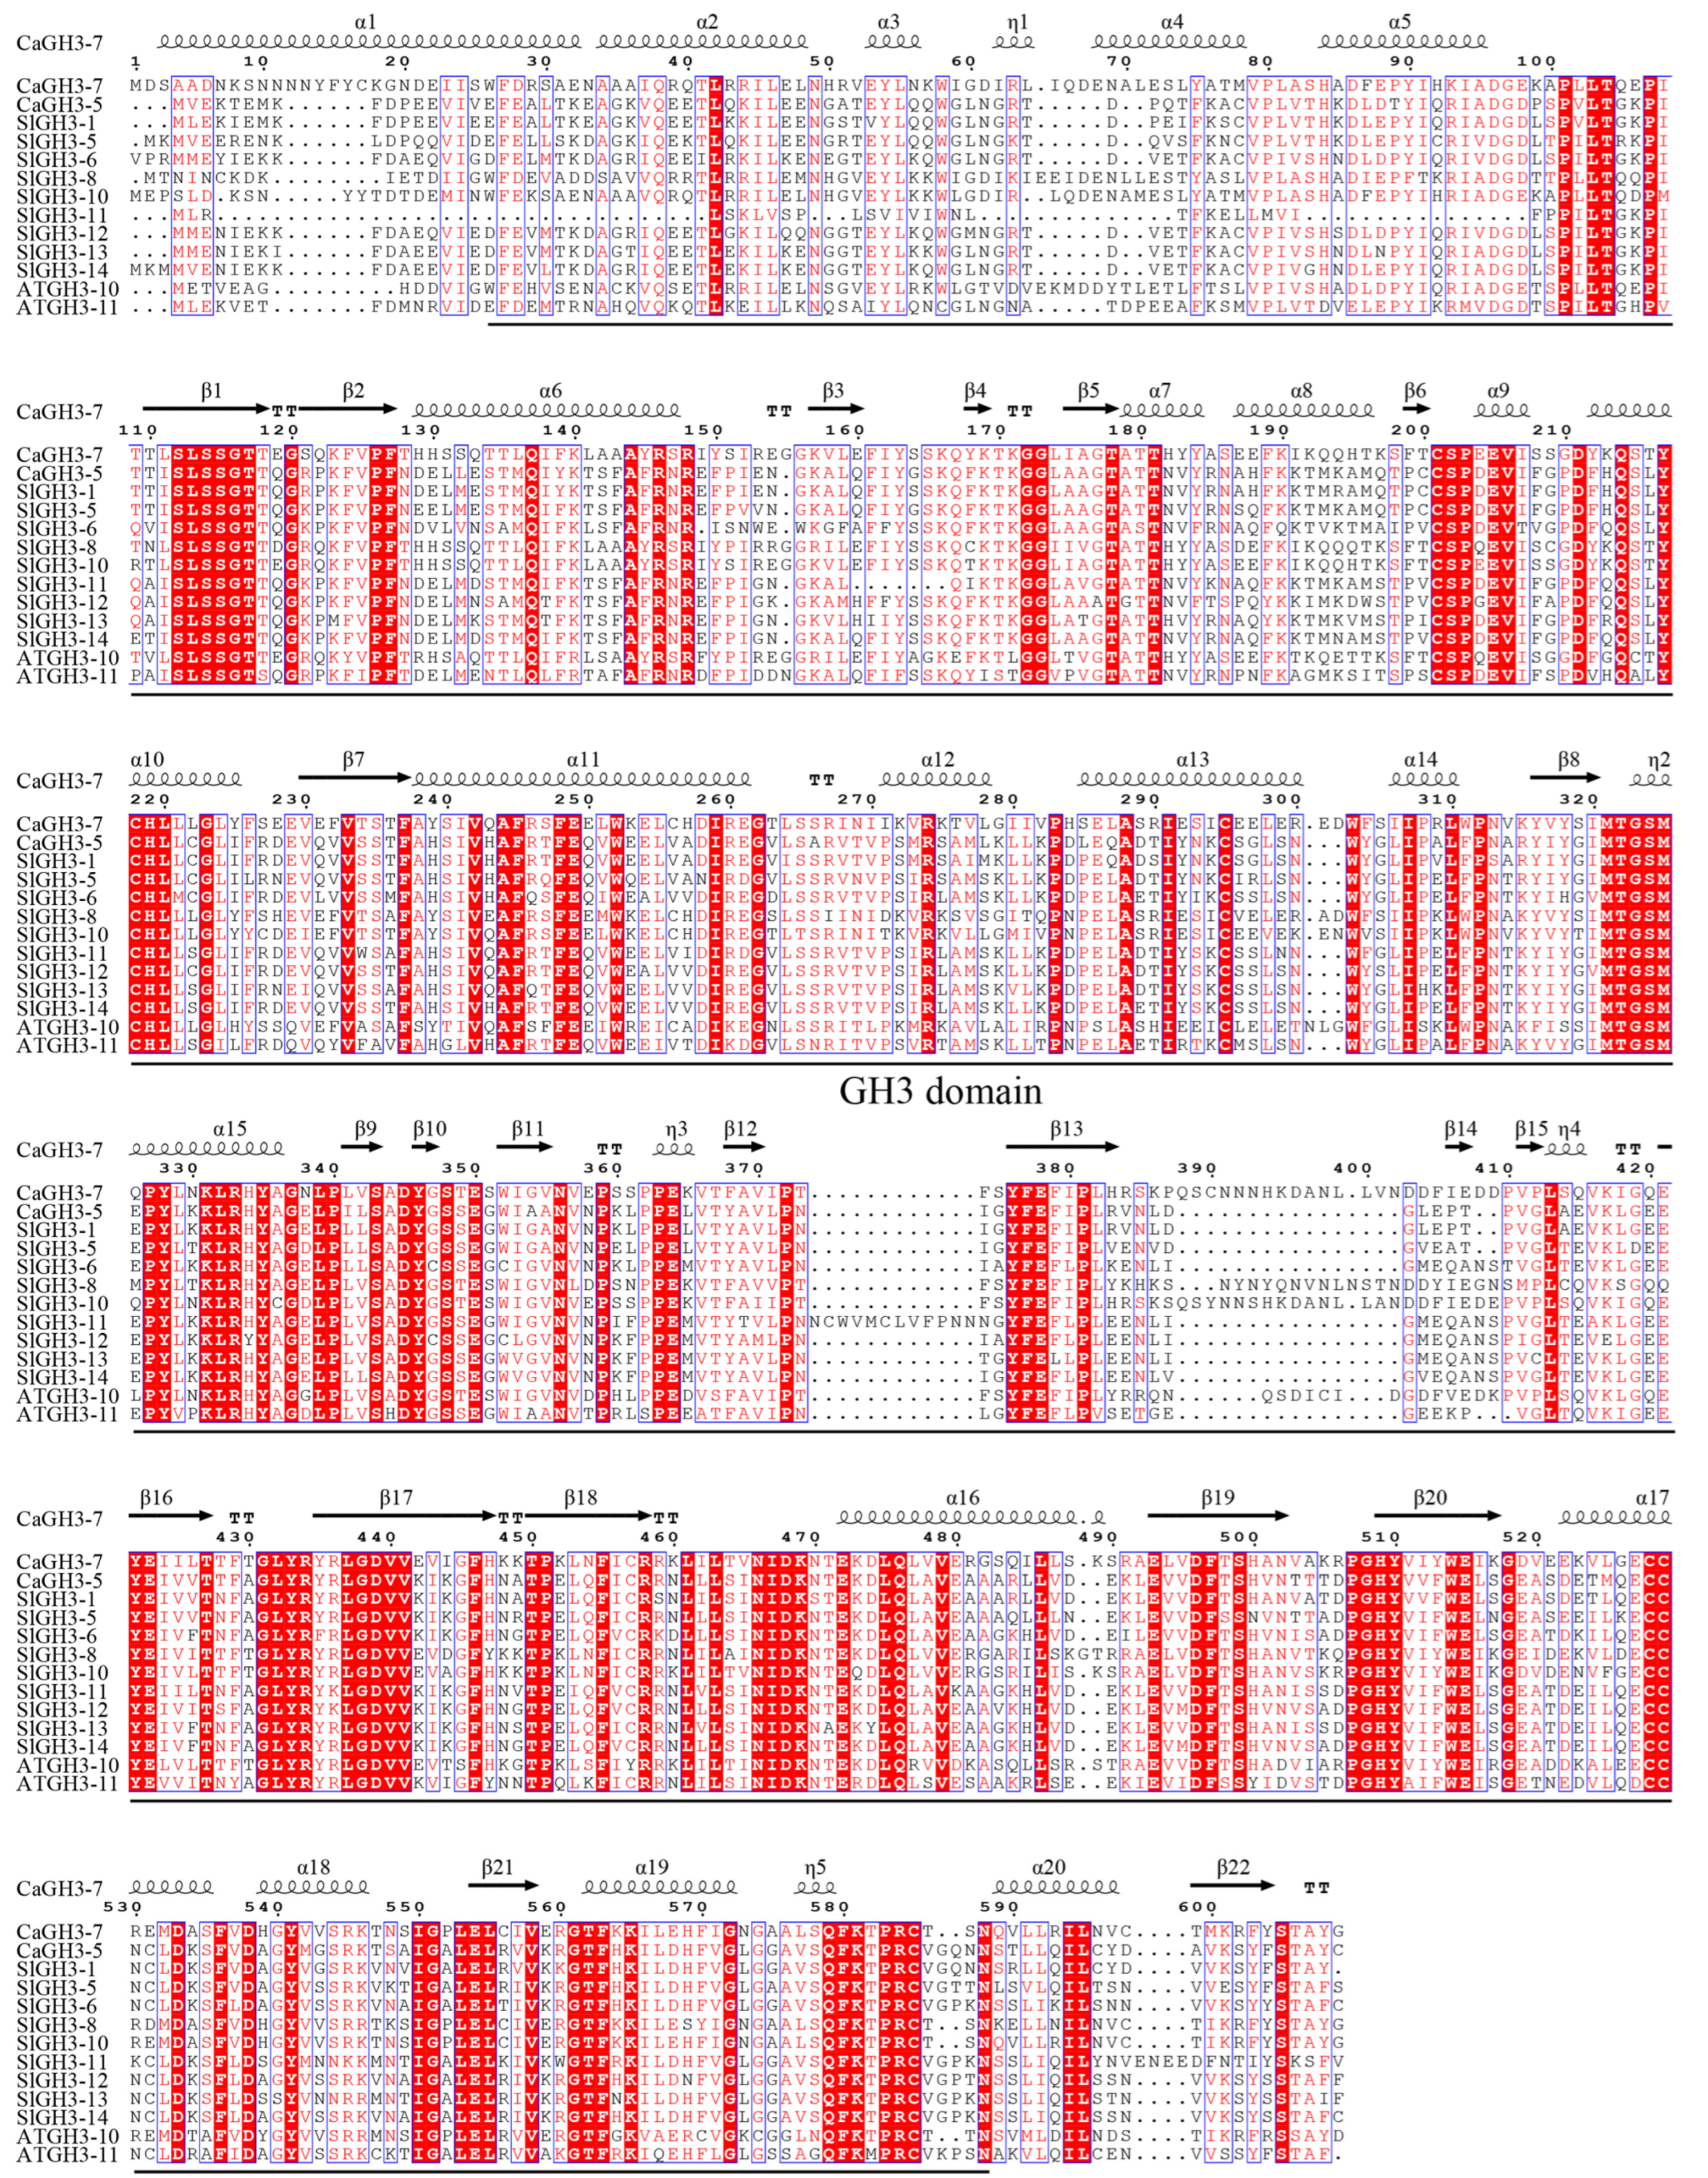
2.10. Cloning and Sequence Analysis of CaGH3-5 and CaGH3-7

In order to verify the protein structure of the GH3 gene family, CaGH3-5 and CaGH3-7, belonging to group I, were cloned. The full length of the coding sequence of CaGH3-5 (GenBank accession number, PV577549) was 1728 bp, encoding 575 amino acids, and that of CaGH3-7 (GenBank accession number, PV577548) was 1830 bp, encoding 609 amino acids. Multiple sequence alignments revealed that the amino acid sequence of CaGH3-5 and CaGH3-7 had high similarity with the members of the same group in S. lycopersicum and A. thaliana (Figure 10). In addition, these proteins all shared the conserved GH3 domain and conserved structures of β1, α9, η2, α15, β10, β20, and β21, revealing why they belong to the same group (Figure 10).

2.11. CaGH3-5 and CaGH3-7 Are Membrane and Chloroplast Localization Proteins

Sequence prediction indicated that the members of the CaGH3 gene family were located in chloroplasts. To further verify the locations of CaGH3-5 and CaGH3-7, a subcellular localization analysis was conducted in tobacco using an Agrobacterium-mediated method. As shown in Figure 11, CaGH3-5 and CaGH3-7 were both located in the membrane and chloroplast, indicating their potential functions.

2.12. Transcriptome Analysis of Tomato with Overexpression of CaGH3-7

To further investigate the mechanisms underlying the regulation of CaGH3 by hormones and stress, CaGH3-7 was overexpressed in tomato (Solanum lycopersicum L.). Then, transcriptome sequencing and differential gene expression analysis were carried out. In transgenic plants, a total of 915 genes were down-regulated and 611 were up-regulated (Supplementary Table S1), which were used to perform Gene Ontology (GO) and Kyoto Encyclopedia of Genes and Genomes (KEGG) pathway analysis.
For the GO classification analysis of DEGs, 50 sub-categories from three main GO functional categories were selected (Figure 12, Supplementary Table S2). In biological processes, a maximum of 32 genes responded to mitotic cell cycle, followed by DNA replication (30 genes), the regulation of the response to external stimulus (29 genes), the phenylpropanoid biosynthetic process (28 genes), and the regulation of the response to biotic stimulus (28 genes). In terms of cellular components, the top three were apoplast, cell wall, and plant-type cell wall, with 42, 29, and 29 genes, respectively. In addition, at the molecular level, the top three were monooxygenase activity, tubulin binding, and microtubule binding, with 40, 23, and 23 genes, respectively.
Through KEGG analysis (Figure 12, Supplementary Table S3), the top 50 most significantly enriched pathways could be classified into five categories: cellular processes, environmental information processing, genetic information processing, metabolism, and organismal systems. In environmental information processing, two pathways were enriched: plant hormone signal transduction (55 genes) and mitogen-activated protein kinase (MAPK) signaling pathway—plant (33 genes). In terms of metabolism, the top two pathways were metabolic pathways (226 genes) and the biosynthesis of secondary metabolites (139 genes). In addition, regarding organismal systems, plant–pathogen interaction (71 genes) and circadian rhythm—plant (13 genes) were enriched.

3. Discussion

When pepper plants are exposed to unsuitable environments such as those with high salt, drought, and extreme temperature, they will stop growing and developing, and may even die [20,21,23]. Therefore, it is particularly important to explore the molecular mechanisms that can alleviate stress injury. Auxin plays a very important role in the growth and development of plants as well as their resistance to stress [30]. GH3 genes, as early response genes of auxin, can alleviate the damage of stress to plants by regulating hormone homeostasis [31,32]. The identification of GH3 members is of great significance for the study of pepper stress resistance.
In the present study, eight CaGH3 members in pepper were identified through bioinformatics. The number of CaGH3 members was lower than that of Arabidopsis (19 members) and tomato (15 members), which might be due to the quality of genome assembly, the loss of genes during evolution, etc. [33]. CaGH3 proteins were classified into two categories (I and III) (Figure 3), and it was the same with SlGH3 and StGH3 proteins, which might be because they all belong to the Solanaceae family [29,33]. Meanwhile, in Arabidopsis, GH3 proteins were classified into three groups (I, II, and III) [6]. The differences in the grouping of GH3 proteins might be related to gene retention and loss and functional redistribution among different species during evolution [34]. The genes in groups I and II were reported to be related to the JA signaling pathway [35,36] and growth hormone regulation [16], respectively. In addition, the group III GH3 gene, AtPBS3, regulated SA-dependent defense responses [37]. Thus, we speculated that pepper CaGH3 members might play a more significant role in resisting stress.
The differences in protein and gene structures also affect the diversity of functions [38,39]. All CaGH3 proteins contained conserved GH3 domains or GH3 superfamily domains, but they had different types of motifs and gene structures (Figure 4). All CaGH3 proteins contained 13 conserved motifs; however, the motifs varied among members of different groups. Motifs 14 and 16 were only present in group I and motifs 11 and 13 were only present in group III. In addition, the numbers of exons and introns were different and specific within each group. Notably, the length of introns in group I was longer than that in group III. These results were consistent with those of potato (Solanum tuberosum L.) GH3 members [29] in that the different groups of CaGH3 members indicate the different biological functions they may have.
The elements in the promoter can indirectly reflect the potential regulatory patterns of genes [39]. The existence of auxin-responsive elements in GH3 members was important for their response to auxin [40]. Auxin-related elements (TGA-element, AuxRR-core) were found in 75% (six out of eight) of the CaGH3 gene family members. This suggests that CaGH3s could play important roles in auxin regulation [29,40]. Moreover, the promoters of CaGH3 members contained lots of GA-related elements (GARE-motif, P-box, TATC-box, six out of eight) and ABA-related elements (ABRE, six out of eight), which were reported to be related to growth and stress [28,41]. In addition to response to hormones, GH3 members were also involved in biotic and abiotic stress responses [6,29]. Likewise, in the pepper, many stress-related regulatory elements were found in the promoters of CaGH3 genes, such as MeJA-responsive (TGACG-motif, CGTCA-motif, five out of eight), SA-responsive (TCA elements, four out of eight), low-temperature-responsive (LTR, three out of eight), drought-responsive (MBS, three out of eight), and flavonoid biosynthesis elements (MBSI, two out of eight), indicating CaGH3 members might be sensitive to multiple stresses.
The location of gene expression is very important for the prediction of its function. In potato, StGH3.2, StGH3.3, and StGH3.7 showed high levels in the roots, tubers, and flowers, respectively [29]. In tomato, most GH3 genes had high expression levels in the leaves and cotyledons [33]. In wheat (Triticum aestivum L.), GH3 genes had high expression levels in the leaves and roots [38], while in apple (Malus × domestica), the expression levels of most MdGH3 genes in the leaves were much lower than those in the roots [42]. Likewise, in alfalfa (Medicago sativa L.), most GH3 members showed lower levels in leaves than in other organs [43]. Notably, GH3 genes in maize showed higher levels in the stem [44], while GH3 genes in rice showed higher levels in flowers [45]. In the present study, CaGH3-2, CaGH3-6, and CaGH3-7 were mainly expressed in the flowers, and CaGH3-3, CaGH3-4, and CaGH3-8 were mainly expressed in the roots (Figure 6), indicating that they may perform different functions during pepper growth and development.
The cis-acting elements in the promoter predict that the GH3 genes can respond to lots of hormones [14,15]. In pepper, hormone-responsive elements also occurred in the promoter of CaGH3 genes, indicating that their expression was regulated by these factors. Under IAA treatment, the expression of CaGH3-1, CaGH3-6, CaGH3-7, and CaGH3-8 increased first, while that of CaGH3-2, CaGH3-3, CaGH3-4, and CaGH3-5 decreased first. Under ABA treatment, the expression of CaGH3-5 decreased first, while that of other members increased first. Under MeJA treatment, the expression of CaGH3-3, CaGH3-4, and CaGH3-5 decreased first, while that of other members increased first. Taken together, when the pepper was treated with IAA, ABA, and MeJA, CaGH3-6, CaGH3-7, and CaGH3-8 were up-regulated, while CaGH3-5 was down-regulated. This indicates that these genes mediated the crosstalk between auxin and other hormones. As reported in maize, some GH3 members were up-regulated, while some were down-regulated when treated with IAA [44]. Most StGH3 members were up-regulated under ABA and MeJA treatment [29]. Notably, CaGH3-1, CaGH3-2, and CaGH3-3 might be more sensitive to IAA; CaGH3-4 and CaGH3-5, to ABA; and CaGH3-6, CaGH3-7, and CaGH3-8, to MeJA. Therefore, different groups of GH3 genes, and even different members in the same group, could show various expression patterns under hormone treatment, exhibiting the diversity of functions.
More importantly, GH3 members were also reported to play important roles in response to stress [6,13]. Likewise, the promoter of CaGH3 genes contained lots of stress-responsive elements, indicating these genes were regulated by stress. Under salt treatment, the expression of CaGH3-1, CaGH3-2, and CaGH3-5 decreased first, while that of other members increased first. Under low temperature treatment, the expression of CaGH3-5 decreased first, while that of other members increased first. Under drought treatment, the expression of CaGH3-1, CaGH3-2, and CaGH3-6 decreased first, while that of other members increased first. Taken together, when the pepper was treated with salt, low temperature, and drought, CaGH3-3, CaGH3-4, CaGH3-7, and CaGH3-8 were all up-regulated, indicating that these genes might play important roles in alleviating abiotic stress in pepper. These results also indicate that some genes could be induced by multiple stresses, but some genes exhibited different expression patterns under different stresses. Interestingly, the expression patterns of CaGH3 genes within the same group were either the same or different. In maize, ZmGH3-1 was up-regulated under cold; ZmGH3-9, under heat; and ZmGH3-2, under salt [14]. In rice, OsGH3.13 was induced by drought [15], and OsGH3-2 was induced by drought but suppressed by cold; seedlings with overexpression of OsGH3-2 showed reduced ABA, free IAA levels, and sensitivity to drought [16]. In cotton, the expression levels of most GH3 genes were enhanced under drought and salt [17]. In potato, StGH3.2 and StGH3.6 responded quickly to low temperatures, and StGH3.3 was more sensitive to salt treatment [29]. Notably, CaGH3-1, CaGH3-5, and CaGH3-6 might be more sensitive to salt; CaGH3-2 and CaGH3-3 to low temperature; and CaGH3-7 to drought. In brief, different CaGH3 genes responded differently to stress, indicating that the functions of genes in specific biological processes should be further identified.
To further identify the structure and function of CaGH3s, CaGH3-5 and CaGH3-7 were cloned and subjected to sequence analysis, which revealed that they contained a conserved GH3 domain and exhibited high sequence homology with tomato protein sequences. The expression location of the genes is crucial for the study of its functions. In Saccharum, ScGH3-1 is located in the cell membrane and nucleus [6], while in rice, OsGH3-5 is located in the endoplasmic reticulum, matching the reduction in the free auxin contents in OsGH3-5 overexpressing plants [46]. In this study, CaGH3-5 and CaGH3-7 were both expressed in the membrane and chloroplast. They were located on the cell membrane, which might make them receive hormone signal molecules, thereby participating in the growth and development process of plants [6]. In addition, by regulating chloroplast movements, auxin is involved in lots of physiological processes, such as phototropic bending and stomatal movement [47]. The CaGH3 proteins, as auxin response proteins, were located in chloroplasts, indicating that they might regulate plant physiological responses by influencing chloroplast movements. In short, the homologous genes in different species showed various characteristics, suggesting the diversity of their functions.
In addition, after overexpressing CaGH3-7 in tomato and performing transcriptome sequencing, an enrichment analysis of differentially expressed genes was conducted. GO annotation revealed that it participated in the following major biological processes: regulating the response to external stimulus, the phenylpropanoid biosynthetic process, and regulating the response to biotic stimulus. KEGG pathway analysis revealed that the major pathways it was involved in included plant hormone signal transduction, MAPK signaling pathway—plant, the biosynthesis of secondary metabolites, and plant–pathogen interaction. These results explain that the CaGH3 gene family could indeed respond to exogenous hormone and stress stimuli, which is consistent with previous results [13,17,29].
Considering that CaGH3 members play important roles in alleviating stress, the exploration of its genetic mechanism is helpful for further molecular breeding. The probable interacting proteins of CaGH3 members were predicted, and the results showed that some of the members would interact with proteins SAUR71, ARR16, ARR20, ARR21, and APRR6, which play important roles in the auxin and cytokinin transduction pathways. The Arabidopsis SAUR41 subfamily genes, containing SAUR40, SAUR41, SAUR71, and SAUR72, can be induced with ABA to modulate cell expansion and salt tolerance [48]. The inducible expression of Arabidopsis ARR22 in transgenic plants enhanced drought and freezing tolerance by enhancing cell membrane integrity [49]. Taken together, these results indicate that the CaGH3s might alleviate stress injury by participating in the hormone regulation pathway. Notably, based on the results, we can screen out genes related to the biological processes of concern, obtain the plants with overexpression and silenced expression, and identify their functions by observing the phenotypes. Furthermore, the pepper genetic transformation system could be utilized to obtain novel pepper germplasm resources, and comprehensive evaluations of transgenetic plants would be conducted, thereby achieving pepper resistance breeding.

4. Materials and Methods

4.1. Identification of the CaGH3 Gene Family

The genome data of the Capsicum annuum Zunla database (v2.0) were downloaded from the Plant GARDEN (https://plantgarden.jp/en/list/t4072/genome/t4072.G002, accessed on 25 August 2023). The Hidden Markov Model (HMM) profiles of the GH3 domain (PF 03321) were downloaded from the InterPro database (https://www.ebi.ac.uk/interpro/, accessed on 23 July 2024) [50]. Then, the CaGH3s were searched in the pepper database using HMMER3.0 (E < 1 × 10⁻¹⁰) [51]. Meanwhile, based on the genome data of the Capsicum annuum, blastp was conducted with 19 A. thaliana GH3s (AtGH3s) from the Arabidopsis Information Resource (TAIR10) database (https://www.arabidopsis.org/index.jsp, accessed on 3 March 2022) to screen the CaGH3 proteins (E < 1 × 10⁻¹⁰) [52]. Based on the above two methods, the candidate proteins were identified using the InterPro and SMART (http://smart.embl-heidelberg.de/, accessed on 20 July 2024) databases to determine whether they contained the GH3 domain.

4.2. Sequence Features and Structures of CaGH3 Gene Family

The physicochemical properties of pepper CaGH3 proteins were analyzed using the ExPASy server 10 (https://prosite.expasy.org/, accessed on 21 July 2024) [53]. Plant-mPLoc (http://www.csbio.sjtu.edu.cn/bioinf/plant-multi/, accessed on 23 July 2024) was used to predict the subcellular localization of the CaGH3 proteins. In addition, SPOMA (https://npsa.lyon.inserm.fr/cgi-bin/npsa_automat.pl?page=/NPSA/npsa_sopma.html, accessed on 18 April 2024) and SWISS-MODEL (https://swissmodel.expasy.org/, accessed on 21 July 2024) were used to predict their secondary and tertiary structures.

4.3. Chromosomal Location and Collinearity Analysis of the CaGH3 Gene Family

The chromosome locations of the CaGH3s were obtained from the pepper database. Mappings of the physical locations of the CaGH3s on pepper chromosomes were drawn with TBtools [54]. The genomic sequence and GFF annotation files of five species (A. thaliana, O. sativa, S. tuberosum, S. lycopersicum, and B. rapa) were downloaded from EnsemblPlants (http://plants.ensembl.org/index.html, accessed on 9 July 2022). The collinearity of the pepper CaGH3 genes and the five species was analyzed using TBtools (v. 2.104) [54].

4.4. Phylogenetic Analysis of the CaGH3 Gene Family

A total of 19 A. thaliana GH3s (AtGH3s) from the Arabidopsis data and 15 S. lycopersicum GH3s (SlGH3s) from their genomic data were downloaded, respectively (Supplementary Table S4). Then, phylogenetic analysis was performed by aligning all GH3 protein sequences using the ClustalX 1.83 program and an un-rooted neighbor-joining phylogenetic tree [55,56].

4.5. Conserved Motifs, Domains, and Gene Structures of the CaGH3 Gene Family

The conserved motifs of the CaGH3 proteins were analyzed using MEME5.2.0 software (https://meme-suite.org/meme/doc/download.html, accessed on 24 July 2024). The number of different motifs was 20 and the motif length ranged from 6 to 50 amino acids [57] (Supplementary Table S5). Their conserved domains were analyzed in NCBI CDD (https://www.ncbi.nlm.nih.gov/Structure/cdd/wrpsb.cgi, accessed on 20 July 2024). GSDS2.0 software (https://gsds.gao-lab.org/Gsds_about.php, accessed on 3 June 2022) was used to analyze the gene structures of the CaGH3 genes [58].

4.6. Cis-Acting Regulatory Element Analysis of CaGH3 Gene Promoters

The 2000 bp sequences upstream of the start codon of the CaGH3 genes were considered promoters, and the cis-acting elements of CaGH3s were predicted using the PlantCARE server (http://bioinformatics.psb.ugent.be/webtools/plantcare/html/, accessed on 24 July 2024) [27]. Then, the results were visualized with TBtools [54].

4.7. Plant Materials, Growth Conditions, and Hormone and Stress Treatments

Pepper seeds were germinated in a light incubator at 28 °C. Five days later, the germinated seeds were transplanted into pots containing soil/vermiculite/perlite (2:1:1) and placed in a growth chamber under long-day conditions (16 h−1 light/8 h−1 dark, 23/20 °C day/light, 150 µmol·m−2·s−1). Six-leaf seedlings were treated with 100 μM abscisic acid (ABA), 100 μM methyl jasmonate (MeJA), 100 μM indoleacetic acid (IAA), 20% polyethylene glycol-6000 (PEG-6000), and 200 mM NaCl. A low temperature was applied by placing the seedlings in a 4 °C growth chamber. The leaf tissues were harvested at 0, 1, 3, 6, 12, and 24 h after various treatments. Additionally, samples of the root, stem, leaf, and flower were harvested to investigate the tissue-specific expressions. All these samples were collected in triplicate, directly frozen in liquid nitrogen, and stored at −80 °C until RNA extraction and qRT-PCR.

4.8. RNA Extraction, qRT PCR, and Statistical Analysis

Total RNA was extracted using the RNAiso Plus reagent kit (TaKaRa, Shiga, Japan) according to the manufacturer’s instructions. The quality of the RNA samples was verified using agarose gel electrophoresis. A total of 2 μg of RNA of each sample was used for first-strand cDNA synthesis using M-MLV reverse transcriptase according to the manufacturer’s protocols (TransGen, Beijing, China). The specific primers of CaGH3s and the internal reference gene (CaUBI3; GenBank accession number, AY486137.1) are shown in Supplementary Table S6.
qRT-PCR was carried out using TB Green® Premix Ex Taq™ II (TaKaRa, Shiga, Japan) according to the manufacturer’s instructions. Triplicate qRT-PCR experiments were performed for all samples, and the data were shown as the means ± SDs. Statistical analysis was performed with SPSS 21.0 using analysis of variance.

4.9. Protein Interaction Prediction Analysis of the CaGH3 Gene Family

To investigate the CaGH3 protein interaction network, based on the homologous proteins of Arabidopsis, the interacting proteins of CaGH3 were predicted using the STRING database (http://string-db.org/cgi, accessed on 28 July 2024).

4.10. Gene Cloning and Sequence Analysis of CaGH3-5 and CaGH3-7

CaGH3-5 and CaGH3-7 were chosen, and the full lengths of their coding sequences were cloned from the pepper leaves with primers (Supplementary Table S6) using 2X Xerox PCR Master Mix (Biomed, Beijing, China). The PCR products were purified with a gel extraction kit (Tiangen, Beijing, China), ligated into the pEASY®- T1 simple cloning vector (TransGen, Beijing, China), and sequenced. The ClustalX 1.83 and ESPrit3.0 online software (http://espript.ibcp.fr/ESPript/cgi-bin/ESPript.cgi, accessed on 13 May 2022) were used for multiple alignments of the amino acid sequences of proteins in group I of the phylogenetic tree.

4.11. Subcellular Localization of CaGH3-5 and CaGH3-7

The full-length coding sequences of CaGH3-5 and CaGH3-7 were separately amplified and inserted at the N-terminal of GFP of pCAMBIA1300 with the primers (Supplementary Table S6). Then, the GV3101 strains harboring CaGH3-5/CaGH3-7-YFP or 35S::YFP were transformed into 5-week-old Nicotiana benthamiana leaves [59]. GFP signals were analyzed 72 h after infiltration via confocal microscopy. PIP2-mCherry was used as a membrane localization marker [60].

4.12. Vector Construction, Plant Transformation, and Transcriptome Analysis

The full coding sequence of CaGH3-7 was cloned into the plant expression vector PHG using BamH I and Pst I restriction sites to generate 35S::CaGH3-7 with the primers (Supplementary Table S6). The vector was transformed into the Agrobacterium tumefaciens strain GV3101 and then transformed into Micro-Tom [61]. Fifty-day-old seedlings from three independent lines of the wild type and 35S:: CaGH3-7 were used for RNA-Seq analysis.
A total of six mRNA libraries were prepared according to the Illumina RNA sequencing protocols and sequenced using paired-end sequencing with 150 bp lengths on the NovaSeq X plus platform (Illumina, San Diego, CA, USA). The RNA-Seq data have been uploaded onto the China National Center for Bioinformation database under designation number PRJCA034753. Genes with |log2 fold change| ≥ 1 and a false discovery rate <0.05 were termed differentially expressed genes (DEGs) according to the following comparison: 35S::CaGH3-7 vs. WT. DEGs were classified and grouped using Gene Ontology (GO, http://geneontology.org/, accessed on 6 February 2025) and Kyoto Encyclopedia of Genes and Genomes (KEGG, http://www.genome.jp/kegg/, accessed on 1 January 2025) analyses to identify the associated biological pathways. The significance threshold was set at p < 0.05.

5. Conclusions

This study conducted a genome-wide analysis of the GH3 gene family in pepper, and a total of eight CaGH3 genes, distributed on four chromosomes and classified into two groups (I and III), were identified based on bioinformatic analysis. They all had a conserved domain and close evolutionary relationships with S. lycopersicum. Many cis-elements related to plant hormones and stress were distributed in the promoter regions of the CaGH3 genes. Furthermore, the CaGH3 genes were differentially expressed among pepper tissues and could be induced by phytohormones (IAA, ABA, and MeJA) and abiotic stresses (salt, low temperature, and drought). This indicates that they participated in various phytohormones and stress-signaling pathways. CaGH3-5 and CaGH3-7 were cloned and both located in the membrane and chloroplast. Notably, after overexpressing CaGH3-7 in tomato, differential expressed genes were mainly enriched in response to external stimuli. Our data may help in screening genes for further functional identification and genetic improvement, which is beneficial to accelerating the process of pepper resistance breeding.

Supplementary Materials

The following supporting information can be downloaded at: https://www.mdpi.com/article/10.3390/plants14142231/s1, Supplementary Table S1. Total differentially expressed genes in the comparison of WT vs. CaGH3-7 overexpression in Solanum lycopersicum. Supplementary Table S2. GO enrichment analysis of differentially expressed genes. Supplementary Table S3. KEGG pathway enrichment analysis of differentially expressed genes. Supplementary Table S4. Information about the GH3 genes in various plants. Supplementary Table S5. Predicted conserved motifs of CaGH3 proteins. Supplementary Table S6. Primers used in this study.

Author Contributions

Q.-L.Z. designed the study, performed some experiments, and wrote the manuscript. M.W. carried out the study and analyzed the data. L.L. and X.-M.Z. helped analyze the data. Y.C. revised the manuscript and provided suggestions on the experimental design and analyses. All authors have read and agreed to the published version of the manuscript..

Funding

This work was supported by the Special Project for Guiding Local Science and Technology Development by the Central Government (No. YDZJSX2024D048); the Shanxi Key Laboratory of Germplasm Resources Innovation and Utilization of Vegetable and Flower (No. SCHHZDSYS2024-14); the Key Research and Development Program of Shanxi Province (No. 202202140601006); the PhD Start-up Fund of Shanxi Agricultural University (No. 2022BQ13); and the Shanxi Provincial Basic Research Program-Free Exploration Category (No. 202203021212454).

Data Availability Statement

All data are available within the manuscript. The RNA-Seq data have been uploaded onto the China National Center for Bioinformation database under designation number PRJCA034753.

Conflicts of Interest

The authors declare no conflicts of interest.

Abbreviations

The following abbreviations are used in this manuscript:
GH3Gretchen Hagen 3
AuxAuxin
IAAIndole-3-acetic acid
SAURSmall auxin up RNA
SASalicylic acid
JAJasmonic acid
ABAAbscisic acid
HMMHidden Markov Model
MeJAMethyl jasmonate
PEG-6000Polyethylene glycol-6000
MWMolecular weight
pIIsoelectric point
ARRArabidopsis response regulator
APRRArabidopsis putative response regulator-like
GOGene Ontology
KEGGKyoto Encyclopedia of Genes and Genomes
MAPKMitogen-activated protein kinase

References

  1. Gomes, G.L.B.; Scortecci, K.C. Auxin and its role in plant development: Structure, signalling, regulation and response mechanisms. Plant Biol. 2021, 23, 894–904. [Google Scholar] [CrossRef] [PubMed]
  2. Smolko, A.; Bauer, N.; Pavlović, I.; Pěnčík, A.; Novák, O.; Salopek-Sondi, B. Altered Root Growth, Auxin Metabolism and Distribution in Arabidopsis thaliana Exposed to Salt and Osmotic Stress. Int. J. Mol. Sci. 2021, 22, 7993. [Google Scholar] [CrossRef] [PubMed]
  3. Luo, J.; Zhou, J.J.; Zhang, J.Z. Aux/IAA Gene Family in Plants: Molecular Structure, Regulation, and Function. Int. J. Mol. Sci. 2018, 19, 259. [Google Scholar] [CrossRef] [PubMed]
  4. Guo, R.; Hu, Y.; Aoi, Y.; Hira, H.; Ge, C.; Dai, X.; Kasahara, H.; Zhao, Y. Local conjugation of auxin by the GH3 amido synthetases is required for normal development of roots and flowers in Arabidopsis. Biochem. Biophys. Res. Commun. 2022, 589, 16–22. [Google Scholar] [CrossRef] [PubMed]
  5. Chen, X.; Chen, J.; Liao, D.; Ye, H.; Li, C.; Luo, Z.; Yan, A.; Zhao, Q.; Xie, K.; Li, Y. Auxin-mediated regulation of arbuscular mycorrhizal symbiosis: A role of SlGH3.4 in tomato. Plant Cell Environ. 2022, 45, 955–968. [Google Scholar] [CrossRef] [PubMed]
  6. Zou, W.; Lin, P.; Zhao, Z.; Wang, D.; Qin, L.; Xu, F.; Su, Y.; Wu, Q.; Que, Y. Genome-Wide Identification of Auxin-Responsive GH3 Gene Family in Saccharum and the Expression of ScGH3-1 in Stress Response. Int. J. Mol. Sci. 2022, 23, 12750. [Google Scholar] [CrossRef] [PubMed]
  7. Takase, T.; Nakazawa, M.; Ishikawa, A.; Kawashima, M.; Ichikawa, T.; Takahashi, N.; Shimada, H.; Manabe, K.; Matsui, M. Ydk1-D, an auxin-responsive GH3 mutant that is involved in hypocotyl and root elongation. Plant J. 2004, 37, 471–483. [Google Scholar] [CrossRef] [PubMed]
  8. Liu, K.; Kang, B.C.; Jiang, H.; Moore, S.L.; Li, H.; Watkins, C.B.; Setter, T.L.; Jahn, M.M. A GH3-like gene, CcGH3, isolated from Capsicum chinense L. fruit is regulated by auxin and ethylene. Plant Mol. Biol. 2005, 58, 447–464. [Google Scholar] [CrossRef] [PubMed]
  9. Khan, S.; Stone, J. Arabidopsis thaliana GH3.9 in Auxin and Jasmonate Cross Talk. Plant Signal. Behav. 2007, 2, 483–485. [Google Scholar] [CrossRef] [PubMed]
  10. Wang, Q.; De-Gernier, H.; Duan, X.; Xie, Y.; Geelen, D.; Hayashi, K.I.; Xuan, W.; Geisler, M.; Ten-Tusscher, K.; Beeckman, T.; et al. GH3-Mediated Auxin Inactivation Attenuates Multiple Stages of Lateral Root Development. New Phytol. 2023, 240, 1900–1912. [Google Scholar] [CrossRef] [PubMed]
  11. Sherp, A.M.; Westfall, C.S.; Alvarez, S.; Jez, J.M. Arabidopsis thaliana GH3.15 acyl acid amido synthetase has a highly specific substrate preference for the auxin precursor indole-3-butyric acid. J. Biol. Chem. 2018, 293, 4277–4288. [Google Scholar] [CrossRef] [PubMed]
  12. Jez, J.M. Connecting primary and specialized metabolism: Amino acid conjugation of phytohormones by GRETCHEN HAGEN 3 (GH3) acyl acid amido synthetases. Curr. Opin. Plant Biol. 2022, 66, 102194. [Google Scholar] [CrossRef] [PubMed]
  13. Ding, X.; Cao, Y.; Huang, L.; Zhao, J.; Xu, C.; Li, X.; Wang, S. Activation of the Indole-3-Acetic Acid–Amido Synthetase GH3-8 Suppresses Expansin Expression and Promotes Salicylate- and Jasmonate-Independent Basal Immunity in Rice. Plant Cell 2008, 20, 228–240. [Google Scholar] [CrossRef] [PubMed]
  14. Kong, W.; Zhang, Y.; Deng, X.; Li, S.; Zhang, C.; Li, Y. Comparative Genomic and Transcriptomic Analysis Suggests the Evolutionary Dynamic of GH3 Genes in Gramineae Crops. Front. Plant Sci. 2019, 10, 1297. [Google Scholar] [CrossRef] [PubMed]
  15. Zhang, S.W.; Li, C.H.; Cao, J.; Zhang, Y.C.; Zhang, S.Q.; Xia, Y.F.; Sun, D.Y.; Sun, Y. Altered architecture and enhanced drought tolerance in rice via the down-regulation of indole-3-acetic acid by TLD1/OsGH3.13 activation. Plant Physiol. 2009, 151, 1889–1901. [Google Scholar] [CrossRef] [PubMed]
  16. Du, H.; Wu, N.; Fu, J.; Wang, S.; Li, X.; Xiao, J.; Xiong, L. A GH3 family member, OsGH3-2, modulates auxin and abscisic acid levels and differentially affects drought and cold tolerance in rice. J. Exp. Bot. 2012, 63, 6467–6480. [Google Scholar] [CrossRef] [PubMed]
  17. Kirungu, J.N.; Magwanga, R.O.; Lu, P.; Cai, X.; Zhou, Z.; Wang, X.; Peng, R.; Wang, K.; Liu, F. Functional characterization of Gh_A08G1120 (GH3.5) gene reveal their significant role in enhancing drought and salt stress tolerance in cotton. BMC Genet. 2019, 20, 62. [Google Scholar] [CrossRef] [PubMed]
  18. Delfin, J.C.; Kanno, Y.; Seo, M.; Kitaoka, N.; Matsuura, H.; Tohge, T.; Shimizu, T. AtGH3.10 is another jasmonic acid-amido synthetase in Arabidopsis thaliana. Plant J. 2022, 110, 1082–1096. [Google Scholar] [CrossRef] [PubMed]
  19. Kim, S.; Park, M.; Yeom, S.I.; Kim, Y.M.; Lee, J.M.; Lee, H.A.; Seo, E.; Choi, J.; Cheong, K.; Kim, K.T.; et al. Genome sequence of the hot pepper provides insights into the evolution of pungency in Capsicum species. Nat. Genet. 2014, 46, 270–278. [Google Scholar] [CrossRef] [PubMed]
  20. Altaf, M.A.; Shu, H.; Hao, Y.; Mumtaz, M.A.; Lu, X.; Wang, Z. Melatonin Affects the Photosynthetic Performance of Pepper (Capsicum annuum L.) Seedlings under Cold Stress. Antioxidants 2022, 11, 2414. [Google Scholar] [CrossRef] [PubMed]
  21. Kim, M.K.; Jeong, H.B.; Yu, N.; Park, B.M.; Chae, W.B.; Lee, O.J.; Lee, H.E.; Kim, S. Comparative heat stress responses of three hot pepper (Capsicum annuum L.) genotypes differing temperature sensitivity. Sci. Rep. 2023, 13, 14203. [Google Scholar] [CrossRef] [PubMed]
  22. Lu, X.; Wu, Q.; Nie, K.; Wu, H.; Chen, G.; Wang, J.; Ma, Z. Exogenous phthalanilic acid induces resistance to drought stress in pepper seedlings (Capsicum annuum L.). Front. Plant Sci. 2023, 14, 1156276. [Google Scholar] [CrossRef] [PubMed]
  23. Zhou, L.; Yang, S.; Chen, C.; Li, M.; Du, Q.; Wang, J.; Yin, Y.; Xiao, H. CaCP15 Gene Negatively Regulates Salt and Osmotic Stress Responses in Capsicum annuum L. Genes 2023, 14, 1409. Genes 2023, 14, 1409. [Google Scholar] [CrossRef] [PubMed]
  24. Zhou, Y.; Li, Y.; Yu, T.; Li, J.; Qiu, X.; Zhu, C.; Liu, J.; Dang, F.; Yang, Y. Characterization of the B-BOX gene family in pepper and the role of CaBBX14 in defense response against Phytophthora capsici infection. Int. J. Biol. Macromol. 2023, 237, 124071. [Google Scholar] [CrossRef] [PubMed]
  25. Wang, H.; Liu, S.; Ma, S.; Wang, Y.; Yang, H.; Liu, J.; Li, M.; Cui, X.; Liang, S.; Cheng, Q.; et al. Characterization of the Molecular Events Underlying the Establishment of Axillary Meristem Region in Pepper. Int. J. Mol. Sci. 2023, 24, 12718. [Google Scholar] [CrossRef] [PubMed]
  26. Zhao, L.; Zhang, L.; Hu, Z.; Li, B.; Zheng, X.; Qiu, R.; Chen, Y.; Li, J.; Dong, J.; Zhang, Z. Tomato zonate spot virus induced hypersensitive resistance via an auxin-related pathway in pepper. Gene 2022, 823, 146320. [Google Scholar] [CrossRef] [PubMed]
  27. Lescot, M.; Déhais, P.; Thijs, G.; Marchal, K.; Moreau, Y.; Van de Peer, Y.; Rouzé, P.; Rombauts, S. PlantCARE, a database of plant cis-acting regulatory elements and a portal to tools for in silico analysis of promoter sequences. Nucleic Acids Res. 2002, 30, 325–327. [Google Scholar] [CrossRef] [PubMed]
  28. Nakashima, K.; Yamaguchi-Shinozaki, K. ABA signaling in stress-response and seed development. Plant Cell Rep. 2013, 32, 959–970. [Google Scholar] [CrossRef] [PubMed]
  29. Yao, P.; Zhang, C.; Qin, T.; Liu, Y.; Liu, Z.; Xie, X.; Bai, J.; Sun, C.; Bi, Z. Comprehensive Analysis of GH3 Gene Family in Potato and Functional Characterization of StGH3.3 under Drought Stress. Int. J. Mol. Sci. 2023, 24, 15122. [Google Scholar] [CrossRef] [PubMed]
  30. Kazan, K. Auxin and the integration of environmental signals into plant root development. Ann. Bot. 2013, 112, 1655–1665. [Google Scholar] [CrossRef] [PubMed]
  31. Luo, P.; Li, T.T.; Shi, W.M.; Ma, Q.; Di, D.W. The Roles of GRETCHEN HAGEN3 (GH3)-Dependent Auxin Conjugation in the Regulation of Plant Development and Stress Adaptation. Plants 2023, 12, 4111. [Google Scholar] [CrossRef] [PubMed]
  32. Staswick, P.E.; Serban, B.; Rowe, M.; Tiryaki, I.; Maldonado, M.T.; Maldonado, M.C.; Suza, W. Characterization of an Arabidopsis enzyme family that conjugates amino acids to indole-3-acetic acid. Plant Cell 2005, 17, 616–627. [Google Scholar] [CrossRef] [PubMed]
  33. Kumar, R.; Agarwal, P.; Tyagi, A.K.; Sharma, A.K. Genome-wide investigation and expression analysis suggest diverse roles of auxin-responsive GH3 genes during development and response to different stimuli in tomato (Solanum lycopersicum). Mol. Genet. Genomics 2012, 287, 221–235. [Google Scholar] [CrossRef] [PubMed]
  34. Cheng, F.; Wu, J.; Cai, X.; Liang, J.; Freeling, M.; Wang, X. Gene retention, fractionation and subgenome differences in polyploid plants. Nat. Plants 2018, 4, 258–268. [Google Scholar] [CrossRef] [PubMed]
  35. Hui, S.; Hao, M.; Liu, H.; Xiao, J.; Li, X.; Yuan, M.; Wang, S. The group I GH3 family genes encoding JA-Ile synthetase act as positive regulator in the resistance of rice to Xanthomonas oryzae pv. oryzae. Biochem. Biophys. Res. Commun. 2019, 508, 1062–1066. [Google Scholar] [CrossRef] [PubMed]
  36. Ni, B.; Klein, M.; Hossbach, B.; Feussner, K.; Hornung, E.; Herrfurth, C.; Hamberg, M.; Feussner, I. Arabidopsis GH3.10 conjugates jasmonates. Plant Biol. 2025, 27, 476–491. [Google Scholar] [CrossRef] [PubMed]
  37. Nobuta, K.; Okrent, R.A.; Stoutemyer, M.; Rodibaugh, N.; Kempema, L.; Wildermuth, M.C.; Innes, R.W. The GH3 acyl adenylase family member PBS3 regulates salicylic acid-dependent defense responses in Arabidopsis. Plant Physiol. 2007, 144, 1144–1156. [Google Scholar] [CrossRef] [PubMed]
  38. Jiang, W.; Yin, J.; Zhang, H.; He, Y.; Shuai, S.; Chen, S.; Cao, S.; Li, W.; Ma, D.; Chen, H. Genome-wide identification, characterization analysis and expression profiling of auxin-responsive GH3 family genes in wheat (Triticum aestivum L.). Mol. Biol. Rep. 2020, 47, 3885–3907. [Google Scholar] [CrossRef] [PubMed]
  39. Ali, M.; Luo, D.X.; Khan, A.; Haq, S.U.; Gai, W.X.; Zhang, H.X.; Cheng, G.X.; Muhammad, I.; Gong, Z.H. Classification and Genome-Wide Analysis of Chitin-Binding Proteins Gene Family in Pepper (Capsicum annuum L.) and Transcriptional Regulation to Phytophthora capsici, Abiotic Stresses and Hormonal Applications. Int. J. Mol. Sci. 2018, 19, 2216. [Google Scholar] [CrossRef] [PubMed]
  40. Wang, H.; Tian, C.E.; Duan, J.; Wu, K. Research progresses on GH3s, one family of primary auxin-responsive genes. Plant Growth Regul. 2008, 56, 225–232. [Google Scholar] [CrossRef]
  41. Verma, V.; Ravindran, P.; Kumar, P.P. Plant hormone-mediated regulation of stress responses. BMC Plant Biol. 2016, 16, 86. [Google Scholar] [CrossRef] [PubMed]
  42. Yuan, H.Z.; Zhao, K.; Lei, H.; Shen, X.; Liu, Y.; Liao, X.; Li, T. Genome-wide analysis of the GH3 family in apple (Malus × domestica). BMC Genomics 2013, 14, 297. [Google Scholar] [CrossRef] [PubMed]
  43. Li, J.; Min, X.; Luo, K.; Hamidou Abdoulaye, A.; Zhang, X.; Huang, W.; Zhang, R.; Chen, Y. Molecular characterization of the GH3 family in alfalfa under abiotic stress. Gene 2023, 851, 146982. [Google Scholar] [CrossRef] [PubMed]
  44. Feng, S.; Yue, R.; Tao, S.; Yang, Y.; Zhang, L.; Xu, M.; Wang, H.; Shen, C. Genome-wide identification, expression analysis of auxin-responsive GH3 family genes in maize (Zea mays L.) under abiotic stresses. J. Integr. Plant Biol. 2015, 57, 783–795. [Google Scholar] [CrossRef] [PubMed]
  45. Jain, M.; Kaur, N.; Tyagi, A.K.; Khurana, J.P. The auxin-responsive GH3 gene family in rice (Oryza sativa). Funct. Integr. Genomics 2006, 6, 36–46. [Google Scholar] [CrossRef] [PubMed]
  46. Zhang, S.N.; Wang, S.K.; Xu, Y.X.; Yu, C.J.; Shen, C.J.; Qian, Q.; Geisler, M.; Jiang, D.A.; Qi, Y.H. The auxin response factor, OsARF 19, controls rice leaf angles through positively regulating OsGH3-5 and OsBRI1. Plant Cell Environ. 2015, 38, 638–654. [Google Scholar] [CrossRef] [PubMed]
  47. Eckstein, A.; Krzeszowiec, W.; Waligórski, P.; Gabryś, H. Auxin and chloroplast movements. Physiol. Plant 2016, 156, 351–366. [Google Scholar] [CrossRef] [PubMed]
  48. Qiu, T.; Qi, M.; Ding, X.; Zheng, Y.; Zhou, T.; Chen, Y.; Han, N.; Zhu, M.; Bian, H.; Wang, J. The SAUR41 subfamily of SMALL AUXIN UP RNA genes is abscisic acid inducible to modulate cell expansion and salt tolerance in Arabidopsis thaliana seedlings. Ann. Bot. 2020, 125, 805–819. [Google Scholar] [CrossRef] [PubMed]
  49. Kang, N.Y.; Cho, C.; Kim, J. Inducible expression of Arabidopsis response regulator 22 (ARR22), a type-C ARR, in transgenic Arabidopsis enhances drought and freezing tolerance. PLoS ONE 2013, 8, 79248. [Google Scholar] [CrossRef] [PubMed]
  50. El-Gebali, S.; Mistry, J.; Bateman, A.; Eddy, S.R.; Luciani, A.; Potter, S.C.; Qureshi, M.; Richardson, L.J.; Salazar, G.A.; Smart, A.; et al. The Pfam protein families database in 2019. Nucleic Acids Res. 2019, 47, D427–D432. [Google Scholar] [CrossRef] [PubMed]
  51. Finn, R.D.; Clements, J.; Eddy, S.R. HMMER web server: Interactive sequence similarity searching. Nucleic Acids Res. 2011, 39, W29–W37. [Google Scholar] [CrossRef] [PubMed]
  52. Hagen, G.; Guilfoyle, T. Auxin-responsive gene expression: Genes, promoters and regulatory factors. Plant Mol. Biol. 2002, 49, 373–385. [Google Scholar] [CrossRef] [PubMed]
  53. Artimo, P.; Jonnalagedda, M.; Arnold, K.; Baratin, D.; Csardi, G.; de Castro, E.; Duvaud, S.; Flegel, V.; Fortier, A.; Gasteiger, E.; et al. ExPASy: SIB bioinformatics resource portal. Nucleic Acids Res. 2012, 40, W597–W603. [Google Scholar] [CrossRef] [PubMed]
  54. Chen, C.; Chen, H.; Zhang, Y.; Thomas, H.R.; Frank, M.H.; He, Y.; Xia, R. TBtools: An Integrative Toolkit Developed for Interactive Analyses of Big Biological Data. Mol. Plant 2020, 13, 1194–1202. [Google Scholar] [CrossRef] [PubMed]
  55. Thompson, J.D.; Gibson, T.J.; Higgins, D.G. Multiple sequence alignment using ClustalW and ClustalX. Curr. Protoc. Bioinform. 2002, 2, 2–3. [Google Scholar] [CrossRef] [PubMed]
  56. Saitou, N.; Nei, M. The neighbor-joining method: A new method for reconstructing phylogenetic trees. Mol. Biol. Evol. 1987, 4, 406–425. [Google Scholar] [CrossRef] [PubMed]
  57. Bailey, T.L.; Boden, M.; Buske, F.A.; Frith, M.; Grant, C.E.; Clementi, L.; Ren, J.; Li, W.W.; Noble, W.S. MEME SUITE: Tools for motif discovery and searching. Nucleic Acids Res. 2009, 37, W202–W208. [Google Scholar] [CrossRef] [PubMed]
  58. Hu, B.; Jin, J.; Guo, A.Y.; Zhang, H.; Luo, J.; Gao, G. GSDS 2.0: An upgraded gene feature visualization server. Bioinformatics 2015, 31, 1296–1297. [Google Scholar] [CrossRef] [PubMed]
  59. Tang, H.; Yu, Q.; Li, Z.; Liu, F.; Su, W.; Zhang, C.; Ling, H.; Luo, J.; Su, Y.; Que, Y. A PIP-mediated osmotic stress signaling cascade plays a positive role in the salt tolerance of sugarcane. BMC Plant Biol. 2021, 21, 589. [Google Scholar] [CrossRef] [PubMed]
  60. Wang, M.; Geng, J.; Zhang, Z.H.; Wang, W.; Ma, T.; Ni, P.; Zhang, Z.; Li, X.; Xing, J.; Sun, Q.; et al. The sucrose transporter TaSWEET11 is critical for grain filling and yield potential in wheat (Triticum aestivum L.). Plant J. 2025, 122, e70133. [Google Scholar] [CrossRef] [PubMed]
  61. Cao, H.; Chen, J.; Yue, M.; Xu, C.; Jian, W.; Liu, Y.; Song, B.; Gao, Y.; Cheng, Y.; Li, Z. Tomato transcriptional repressor MYB70 directly regulates ethylene-dependent fruit ripening. Plant J. 2020, 104, 1568–1581. [Google Scholar] [CrossRef] [PubMed]
Figure 1. Structural analysis of GH3 family proteins of Capsicum annuum. (A) Secondary structure analysis of CaGH3 proteins. Blue line, α-helix; green line, β-turn; purple line, extended strand; orange line, random coil. (B) Tertiary structure analysis of CaGH3 proteins.
Plants 14 02231 g001
Figure 2. Collinear analysis of Capsicum annuum and five other plants (Arabidopsis thaliana, Oryza sativa, Solanum tuberosum, Solanum lycopersicum, and Brassica rapa). The gray line represents the collinear blocks of the pepper genome and other plant genomes, and the red curve represents the CaGH3 gene collinearity.
Plants 14 02231 g002
Figure 3. Phylogenetic analysis of GH3 homolog proteins from Capsicum annuum (Ca), Arabidopsis thaliana (At), and Solanum lycopersicum (Sl).
Plants 14 02231 g003
Figure 4. Phylogenetic relationships (A), conserved motifs (B), conserved domains (C), and gene structures (D) of CaGH3s.
Plants 14 02231 g004
Figure 5. Cis-regulatory element analysis of CaGH3 family genes. The number of each cis-acting element is shown in the heatmap box, ranging from blue to red, with white boxes indicating that there are no corresponding cis-acting elements.
Plants 14 02231 g005
Figure 6. Expression patterns of CaGH3 gene family in different tissues. All data points are means ± standard errors. Different lowercase superscripts indicate significant differences, as determined using Duncan’s new multiple range test (p-value < 0.05).
Plants 14 02231 g006
Figure 7. Expression patterns of CaGH3 gene family under different hormone treatments. All data points are means ± standard errors. Different lowercase superscripts indicate significant differences, as determined using Duncan’s new multiple range test (p-value < 0.05).
Plants 14 02231 g007
Figure 8. Expression patterns of CaGH3 gene family under different abiotic stresses. All data points are means ± standard errors. Different lowercase superscripts indicate significant differences, as determined using Duncan’s new multiple range test (p-value < 0.05).
Plants 14 02231 g008
Figure 9. The protein interaction network of pepper CaGH3 family members. The nodes in the protein interaction network indicate all proteins produced by a protein-coding locus, and different colors indicate different degrees of interaction. The deeper the color of the lines between the nodes, the higher the intensity of the interaction. The thinner lines indicate weaker interactions between the proteins.
Plants 14 02231 g009
Figure 10. Multiple alignments of GH3 proteins for C. annuum (Ca), S. lycopersicum (Sl), and A. thaliana (At). Conserved residues are highlighted with red boxes, with similar residues shown in a lighter color. The underlying amino acid sequence indicates the GH3 domain.
Plants 14 02231 g010
Figure 11. Subcellular localization of CaGH3-5 and CaGH3-7 in Nicotiana benthamiana. GFP fluorescence was observed with a fluorescence microscope. PIP2-mCherry was used for membrane localization. Images were taken in a dark field for green fluorescence, while the cell outlines were photographed in a bright field. Bars = 25 µm.
Plants 14 02231 g011
Figure 12. Transcriptome-based enrichment analysis of differentially expressed genes. (A) Gene Ontology (GO) classification. (B) Kyoto Encyclopedia of Genes and Genomes (KEGG) classification. The numbers after the bars indicate the number and percentage of genes annotated.
Plants 14 02231 g012
Table 1. Basic characteristics of 8 CaGH3 genes in Capsicum annuum.
Gene NameGene IDProtein Length (aa)Molecular Weights (KDa)Isoelectric Point (pI)Instability IndexHydrophilic CoefficientChromosomeSubcellular Localizationα-Helix (%)β-Turn (%)Extended Strand (%)Random Coil (%)
CaGH3-1Capana02g00067660268.046.0740.99−0.242Chloroplast42.865.1514.4537.54
CaGH3-2Capana02g00302159967.715.4843.18−0.232Chloroplast41.745.0113.6939.57
CaGH3-3Capana07g00157360568.585.3940.33−0.277Chloroplast41.654.4613.0640.83
CaGH3-4Capana07g00166259968.346.2140.53−0.347Chloroplast43.574.5114.6937.23
CaGH3-5Capana08g00103657564.285.6731.81−0.148Chloroplast44.354.7014.4336.52
CaGH3-6Capana08g00227859567.476.2743.75−0.288Chloroplast41.854.2013.9540.00
CaGH3-7Capana10g00040560969.427.2647.34−0.2910Chloroplast43.194.9313.3038.59
CaGH3-8Capana10g00085457964.735.5435.22−0.1110Chloroplast41.624.4915.5438.34
Disclaimer/Publisher’s Note: The statements, opinions and data contained in all publications are solely those of the individual author(s) and contributor(s) and not of MDPI and/or the editor(s). MDPI and/or the editor(s) disclaim responsibility for any injury to people or property resulting from any ideas, methods, instructions or products referred to in the content.

