1. Introduction
Lignin is an important phenolic polymer that can be found in the secondary cell walls of plants and plays a crucial role in maintaining plants’ mechanical strength, water transport, and growth and development [
1]. Structurally, the composition of lignin monomers can be divided into three main types: (1) butylated lignans (S-lignans), which are derived from the polymerization of butylated propane structural monomers, (2) guaiacylated lignans (G-lignans), which are formed by the polymerization of guaiacylated propane structural monomers, and (3) guaiacylated lignans (G-Lignans), which are formed by the polymerization of p-hydroxyphenylpropane structural monomers [
2]. Lignin is polymerized from p-hydroxyphenylpropane monomers to p-hydroxyphenyl lignin (p-hydroxyphenyl lignin, H-lignin) [
3]. In gymnosperms, the lignin is predominantly guaiacyl lignin (G), dicotyledons contain predominantly guaiacyl-seryl lignin (G-S), and monocotyledons contain mostly guaiacyl-seryl-p-hydroxyphenyl lignin (G-S-H) [
4]. The synthesis of lignin monomers can be divided into three pathways: the phenylpropane universal metabolic pathway, the lignin-specific synthetic pathway, and the glycosylated transport and polymerization process of lignin monomers [
5]. Among them, caffeic acid O-methyltransferase (COMT) plays multiple roles in lignin synthesis. It catalyzes the methylation of caffeic acid to form ferulic acid, converts 5-hydroxyphenylaldehyde to sinapaldehyde, and also catalyzes the transfer of a methyl group from S-adenosyl-L-methionine (SAM) to form ferulic acid, which generates S-adenosyl-L-homocysteine (SAH) as a byproduct [
6,
7]. Therefore, COMT is considered a key enzyme in the biosynthesis of lignin monomers.
The cell wall serves as a barrier for plants against biotic and abiotic stresses, and caffeic acid O-methyltransferase (COMT) is involved in lignin synthesis. Therefore, COMT plays an important regulatory role in plants’ response to biotic and abiotic stresses. The expression of the maize
ZmCOMT gene results in decreased lignin content, a reduced S/G ratio, and improved lignin digestibility [
8], whereas, the
ZmCOMT1 knockout mutants exhibit reduced drought tolerance, increased leaf ROS (reactive oxygen species) accumulation, the exogenous application of the COMT substrate caffeic acid, restored drought tolerance [
9]. Under low-temperature stress, the expression level of
TaCOMT-3 in wheat (
Triticum aestivum L.) was upregulated, and
TaCOMT-3 methylated hydroxycinnamic acid to produce cinnamic acid, which enhanced the cell membrane’s stability and activated the CBF (C-repeat binding factor) pathway, and thereby improved the cold tolerance of wheat [
10]. The overexpression of
PtCOMT in poplar (
Populus L.) led to an increase in the S/G (syringyl/guaiacyl) ratio of lignin monomers and improved its drought tolerance and cell wall mechanical strength [
11]. In addition, COMT has been found to be involved in the regulation of melatonin biosynthesis in some plants. Yan et al. [
12] found that overexpressing
SlCOMT1 increased the melatonin content in transgenic tomato leaves and significantly enhanced the salt and drought tolerance of transgenic tomato plants compared to the wild type. The melatonin content was elevated in transgenic
Arabidopsis thaliana plants overexpressing
ClCOMT1, and the plants’ tolerance to drought, low temperature, and salt stress was enhanced [
13]. In Rice (
Oryza sativa L.),
OsCOMT1 regulated the synthesis of lignin and melatonin by catalyzing the methylation of 5-hydroxyferulic acid and 5-hydroxypineal, thereby playing a role in the growth, development, and stress response of plants [
14]. In summary, COMT can improve plants’ resistance to abiotic stress by regulating the synthesis and accumulation of lignin and melatonin.
Currently,
COMT gene families have been reported in many plants, with 17
COMT genes having been identified in
A. thaliana [
15], 21 in melon (
Cucumis melo) [
16], 33 in rice [
14], 25 in camellia (
Camellia sinensis) [
17], 31 in maize(
Zea mays) [
18], 33 in walnut [
19], and 16 in watermelon (
Citrullus lanatus) [
13]. However, the characterization and functional elucidation of the
COMT gene family in grapevine remain largely unexplored. Therefore, we systematically identified
COMT family members in Pinot noir (
Vitis vinifera L.),
Vitis amurensis (
Va), and
Vitis riparia (
Vr) using their genomic information, and conducted protein physicochemical property analyses, chromosomal localization, cis-acting element analyses, conserved motif analyses, phylogenetic tree analysis, covariance analysis, codon preference analysis, and evolutionary pressure selection. Meanwhile, we analyzed the expression profiles of
VvCOMT genes in different tissues and organs at various growth and developmental stages, as well as their expression patterns under different abiotic stresses, using transcriptome data from NCBI. Finally, we validated the relative expression levels of selected
VvCOMT members under drought, low-temperature, and salt stress using qRT-PCR, providing a theoretical basis for further exploring the function of grape
COMT genes and innovating germplasm resources.
2. Results
2.1. Identification of COMT Genes in the Grapevine Genome and Analysis of Their Physicochemical Properties
In this study, we identified the members of the grape
COMT gene family using the hidden Markov model (HMM) combined with BlastP search. A total of 61
VaCOMT, 45
VvCOMT, and 36
VrCOMT genes were identified in
Va, Pinot noir, and
Vr, respectively. These genes were named based on their chromosomal positions, namely,
VaCOMT1–
VaCOMT54,
VvCOMT1–
VvCOMT36, and
VrCOMT1–
VrCOMT34 (
Table S1). The physicochemical properties of these genes were analyzed using the Expasy online software (
https://web.expasy.org/protparam/), which showed that the lengths of the VaCOMT amino acids ranged from 108 to 848 aa, that their relative molecular weights ranged from 11,542.45 to 94,273.35 Da, that their isoelectric points ranged from 4.81 to 9.27, and that their protein instability index ranged from 28.67 to 45.52. Among them, 9 VaCOMT members were stable proteins (protein instability index < 40), while the remaining 45 members of the VaCOMT group were unstable proteins (protein instability index > 40). For the VvCOMTs in Pinot noir, the amino acid length ranged from 55 to 1422 aa, the relative molecular weight from 6640.82 to 1,622,260.96 Da, the isoelectric point from 4.84 to 9.21, and the protein instability index from 26.9 to 46.21. Regarding the VrCOMTs in
Vr, the amino acid length ranged from 251 to 669 aa, the relative molecular mass from 27,469.82 to 77,034.43 Da, the isoelectric point from 5.29 to 8.61, and the protein instability index from 28.42 to 49.51. Among the VrCOMT members, 5 were stable proteins, and the remaining 29 members were unstable proteins. The predicted subcellular localization results indicated that the COMT family members in three
Vitis species were primarily localized in the plasma membrane and cytoplasm.
The prediction results of the secondary structure indicate that the COMT proteins from the three Vitis species lack a β-turn and are primarily composed of α-helix, extension strands, and random coil. In the VaCOMTs, the proportion of the α-helix structure ranged from 25.11% to 55.5%, that of the random coil structure from 34.47% to 53.29%, and that of the extended strands structure from 9.92% to 18.72%. In the VvCOMTs, the α-helix ranged from 33.76% to 54.14%, the random coils from 34.08% to 46.92%, and the extended strands from 7.67% to 15.2%. In the VrCOMTs, the α-helix structure ranged from 35.43% to 51.69%, random coils ranged from 36.2% to 55.61%, and the extended strands ranged from 8.97% to 14.29%. Overall, the random coil structure constituted the largest proportion, while the extended strand structure constituted the smallest proportion of the secondary structure of these COMT proteins. This distribution pattern may represent a unique feature of the secondary structure of the COMT family in grapevine.
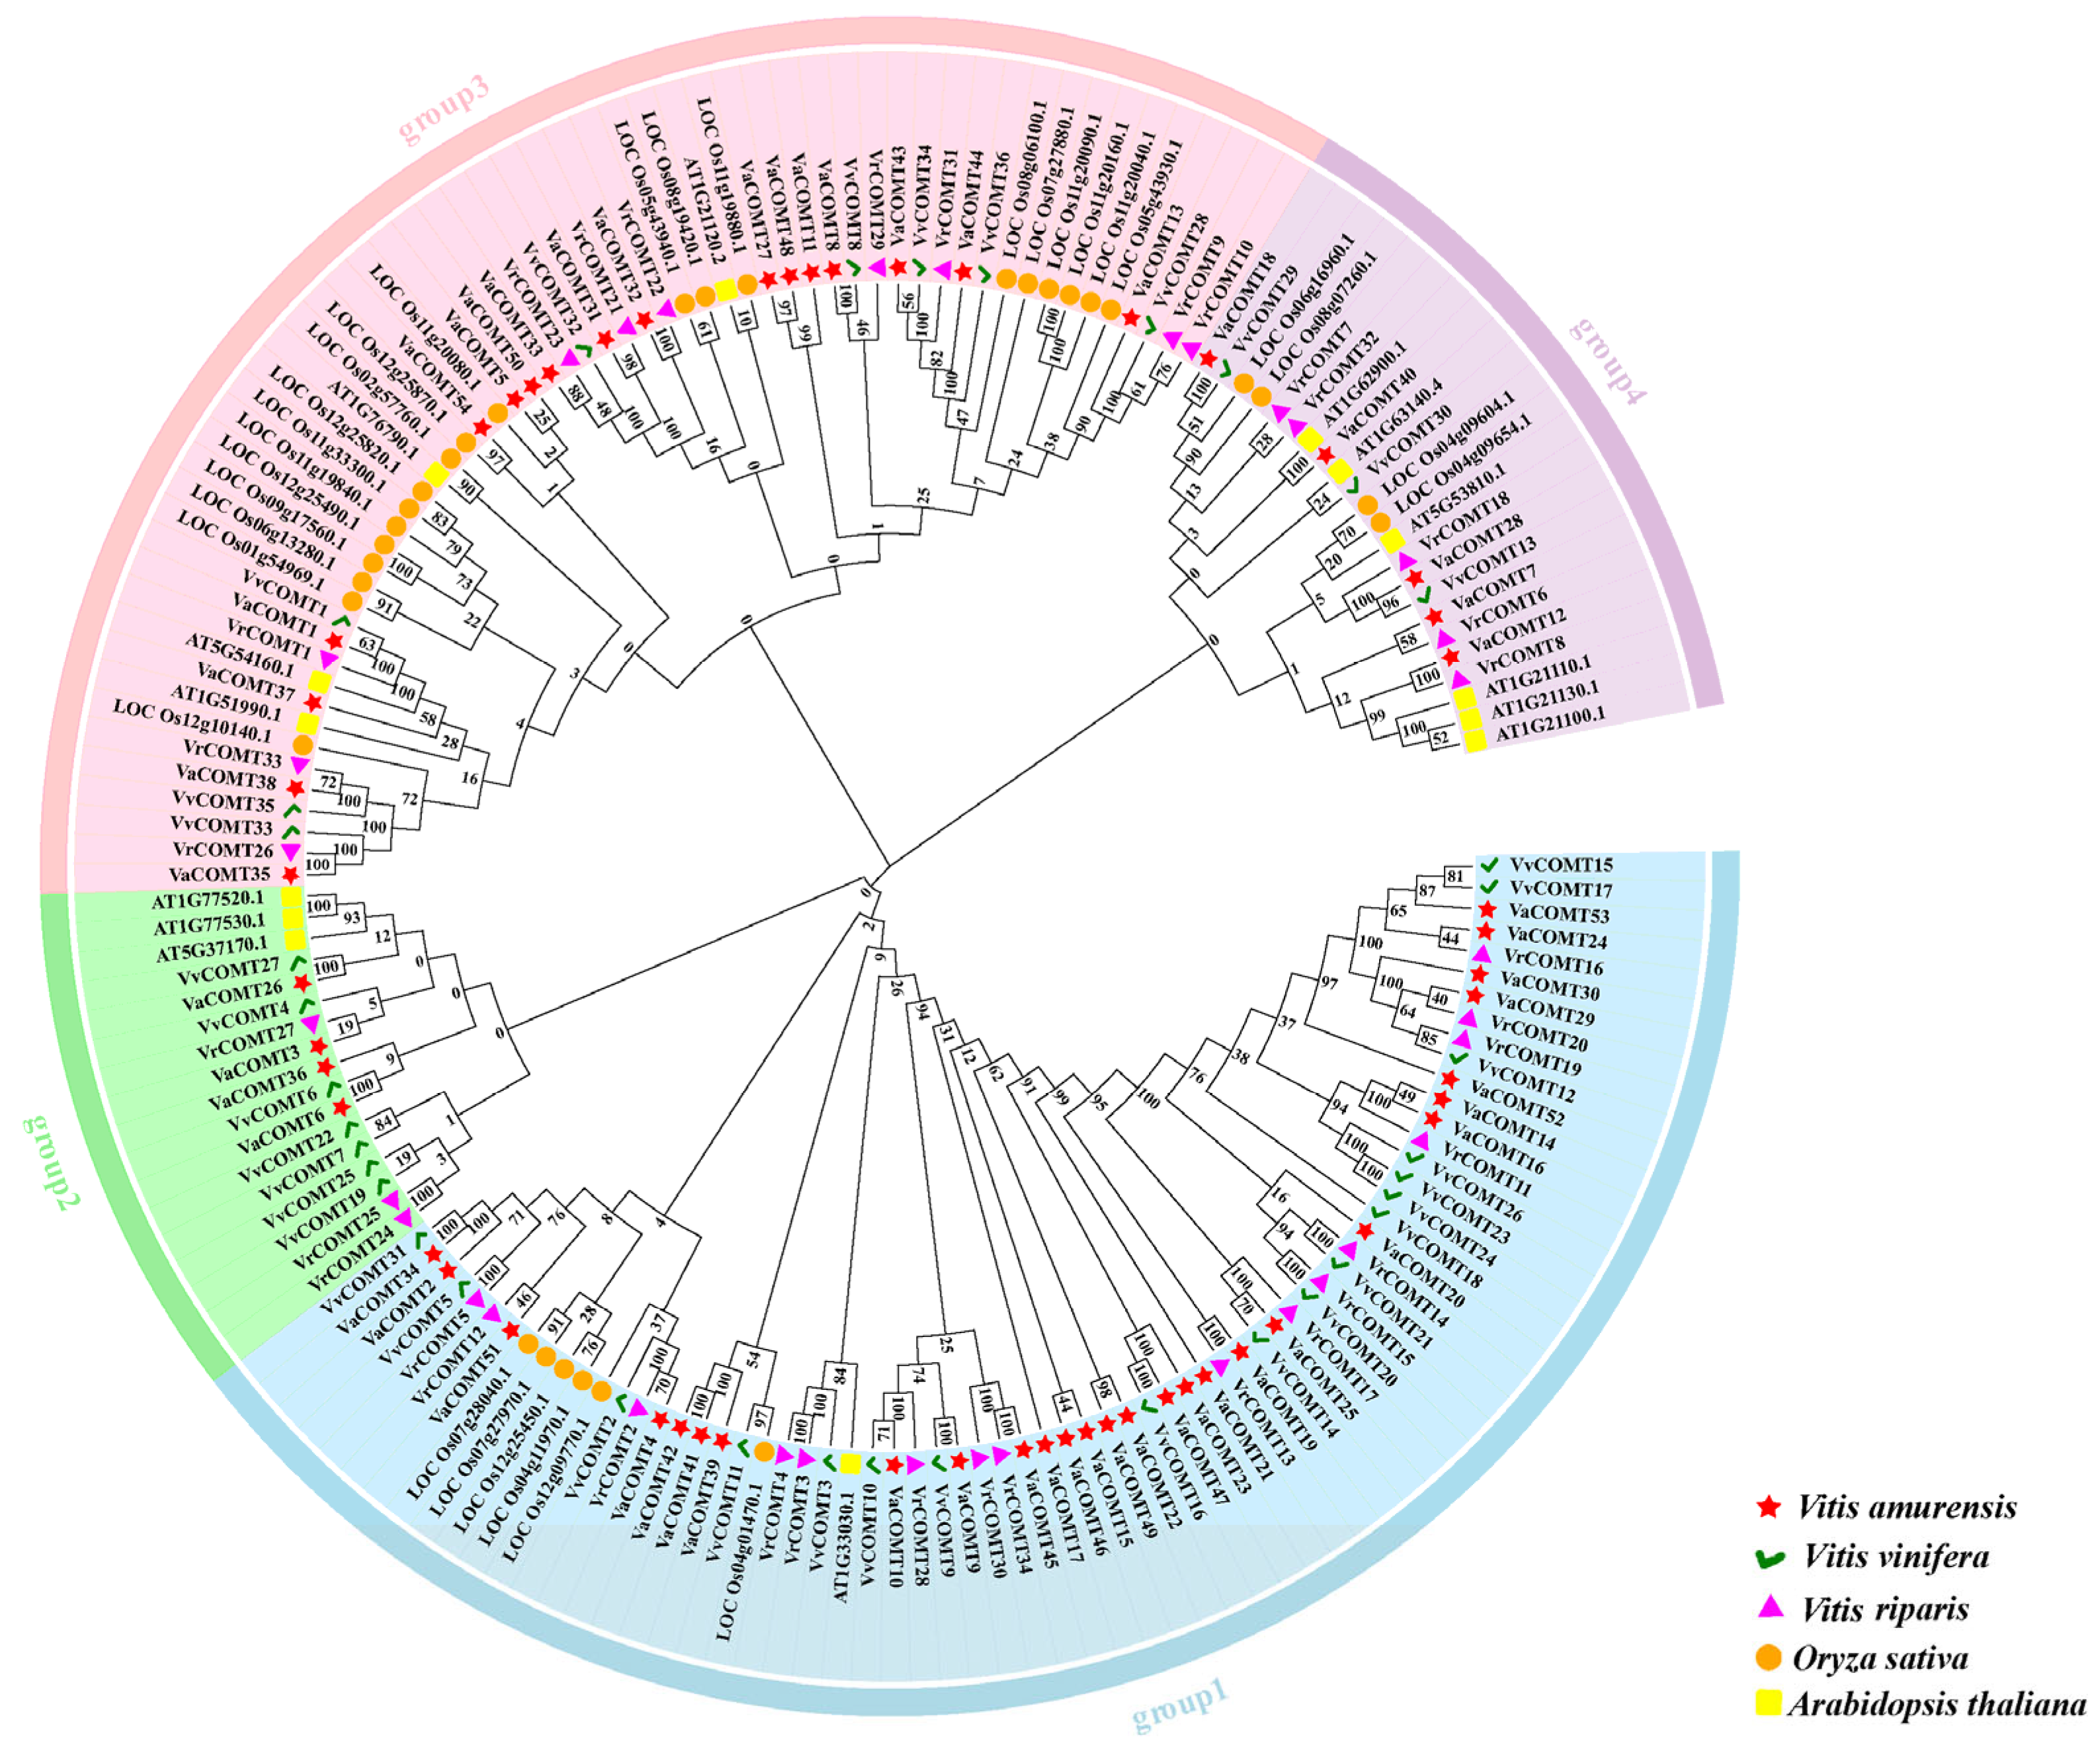
2.2. Phylogenetic Tree of COMT Gene Family in Different Species
The protein sequences of 171 COMT genes from
Va, Pinot noir, and
Vr, rice, as well as
Arabidopsis, were subjected to multi-sequence alignment using Clustal Muscle, and the phylogenetic tree was constructed using MEGA7.0 [
20]. Based on the phylogenetic analysis of the COMTs, we classified them into four groups (
Figure 1). Specifically, Group 1 was comprised of 69 members, including 25 VaCOMTs, 17 VvCOMTs, 16 VrCOMTs, 6 OsCOMTs, and 1 AtCOMTs. Group 2 included 17 members, consisting of 4 VaCOMTs, 7 VVCOMTs, 3 VRCOMTs, and 3 ATCOMTs. Group 3 consisted of 59 members, including 17 VaCOMTs, 8 VvCOMTs, 10 VrCOMTs, 20 OsCOMTs, and 4 AtCOMTs. There are 23 members in Group 4, which comprises 5 VaCOMTs, 3 VvCOMTs, 5 VrCOMTs, 4 OsCOMTs, and 6 AtCOMTs. Overall, the COMT genes of the three
Vitis species are closely related to those of rice and
Arabidopsis. It is implied that the
COMT genes of these three species may share certain functional similarities with those of rice and
Arabidopsis.
2.3. Chromosomal Localization of the Grape COMT Gene Family
The chromosomal distribution of the
COMT gene families in three
Vitis species was visualized using TBtools-II v2.313. In
Va, 44
COMT genes were unevenly distributed across 10 chromosomes (
Figure 2), namely Chr2, Chr3, Chr8, Chr10, Chr12, Chr15, Chr16, Chr18, Chr19, and ChrUn. Additionally, there were 10 genes located on various scaffolds. Specifically, only one gene was found on each of Chr8, Chr9, Chr19, and ChrUn. The chromosome with the highest number of genes (19) was Chr12, which accounted for 43.18% of the total genes (
Figure 2A). Notably, 16 genes were clustered on Chr12. The gene pairs
VaCOMT1/
VaCOMT2,
VaCOMT3/
VaCOMT4,
VaCOMT7/
VaCOMT8,
VaCOMT9/
VaCOMT10,
VaCOMT31/
VaCOMT32,
VaCOMT35/
VaCOMT36,
VaCOMT36/
VaCOMT37,
VaCOMT38/
VaCOMT39,
VaCOMT39/
VaCOMT40, and
VaCOMT41/
VaCOMT42 are located on Chr2, Chr3, Chr10, Chr15, Chr16, and Chr18, respectively. Based on their sequence alignment similarity (75%) and physical distance (<100 kb) [
21], we speculate that the gene pairs
VaCOMT1/
2,
3/
4,
7/
8,
9/
10,
16/
17,
18/
19,
20/
21,
22/
23,
24/
25,
26/
27,
29/
30,
31/
32,
33/
34,
35/
36,
37/
38,
39/
40, and
41/
42 are tandem repeat genes.
In Pinot noir, 36
COMT genes are unevenly distributed across 10 chromosomes, namely Chr2, Chr3, Chr8, Chr10, Chr12, Chr15, Chr16, Chr18, and Chr19. Specifically, only one gene is located on Chr2, Chr9, Chr16, and Chr19. The chromosome with the largest number of genes (17) is Chr12, which accounts for 47.22% of the total genes (
Figure 2B). Notably, 17 genes are clustered on Chr12. The gene pairs
VvCOMT2/
VvCOMT3,
VvCOMT9/
VvCOMT10,
VvCOMT30/
VvCOMT31 are located on Chr3, Chr10, and Chr15, respectively. Based on the similarity of the sequence alignment and physical distance,
VvCOMT2/
3,
9/
10,
14/
15,
16/
17,
18/
19,
24/
25,
27/
28, and
30/
31 are tandem repeat genes.
In
Vr, 34
COMT genes are unevenly distributed across 10 chromosomes, namely Chr3, Chr4, Chr8, Chr10, Chr12, Chr15, and Chr19. Specifically, only one gene is located on each of Chr3, Chr4, and Chr19. The highest number of genes (13) is located on Chr12, which accounts for 38.23% of the total genes (
Figure 2C). Notably, 13 genes are clustered on Chr12. The gene pairs
VrCOMT3/
VrCOMT4,
VrCOMT21/
VrCOMT22,
VrCOMT22/
VrCOMT23,
VrCOMT23/
VrCOMT24,
VrCOMT24/
VrCOMT25,
VrCOMT26/
VrCOMT27,
VrCOMT28/
VrCOMT29,
VrCOMT29/
VrCOMT30,
VvCOMT32/
VrCOMT33 are located on Chr3, Chr15, Chr16, Chr17, and Chr18, respectively. Based on the similarity of their sequence alignment and physical distance,
VrCOMT3/
4,
8/
9,
10/
11,
12/
13,
14/
15,
16/
17,
21/
22,
22/
23,
24/
25,
26/
27,
28/
29, and
29/
30,
32/
32 are tandem repeat genes.
In conclusion, there are both similarities and differences in the chromosomal distribution of COMTs among the three grapes species. In addition to 10 VaCOMT members being distributed on 10 scaffolds, the remaining VaCOMT genes were located on chromosomes 2, 3, 8, 9, 10, 12, 15, 16, 18, and 19, which were the same as in the distribution of VvCOMTs. However, for the VrCOMTs, there were three VrCOMT genes distributed on chromosome 17, but no genes on chromosome 9, while the rest of the VrCOMT genes were distributed on the same chromosomes as in the VaCOMT and VvCOMT genes. Moreover, the tandem duplication events in the three Vitis species occurred more frequently on Chr12 and exhibited a clustered distribution. Members of the VaCOMT and VrCOMT gene families are clustered on Chr15, Chr16, and Chr18, whereas the VvCOMT genes are primarily concentrated on chromosomes Chr3, Chr10, and Chr15.
2.4. Analysis of the Structure and Conserved Motif of the COMT Gene in Grapes
The phylogenetic analysis of 124 COMT members in three
Vitis species was conducted, and the COMTs were classified into six groups (
Figure 3A,B). The Group I members shared motif 5, motif 10, motif 3, and motif 6, with 10 members additionally containing motif 8, motif 2, and motif 1. However, VaCOMT37 lacks motif 8 and motif 1. The Group II members universally possessed motif 5, motif 6, motif 10, and motif 2, while 12 members also contained motif 3, motif 1, and motif 7. Notably,
VaCOMT2,
VrCOMT1, and
VaCOMT1 additionally included motif 8. The Group III members all contained motif 5, motif 3, and motif 6, with five members also harboring motif 10, motif 2, motif 1, and motif 7. The Group IV members consistently shared motif 5, motif 8, motif 4, motif 3, motif 6, motif 2, motif 1, and motif 7, with six members additionally possessing motif 9 and motif 4. Group V included 11 members containing motif 1. VvCOMT22, VvCOMT25, VvCOMT54, VaCOMT7 and VvCOMT7 uniquely contained motif 7, whereas VaCOMT28, VvCOMT13, VaCOMT6, VvCOMT6, and VrCOMT18 were distinguished by the presence of motif 6 and motif 10. The Group VI members exhibited the highest motif diversity, containing all 10 motifs (motif 9, motif 5, motif 8, motif 10, motif 4, motif 3, motif 6, motif 2, motif 1, and motif 7). Among them, 33 members displayed highly similar motif arrangements and compositions. In summary, the COMT protein sequences across the three
Vitis species are relatively conserved, with minor variations in motif type, member, and distribution. While members within the same subgroup exhibit similar motif compositions, subtle differences exist between branches of the same subgroup.
The exon-intron structure of the
COMT genes across the three
Vitis species is presented in
Figure 3C. The number of exons presented a considerable difference, ranging from 1 (
VaCOMT27) to 16, and there were more exons within longer gene sequences. Interestingly, 70.3% of the
COMT genes harbored either two or three exons, while four genes (
VvCOMT18,
VvCOMT23,
COMT24, and
VvCOMT24) had only one exon. The remaining 26 genes contained 5–16 exons. However, a few
COMT genes exhibited significant variations in length due to alterations in intron length and quantity. For instance,
VvCOMT4 possessed the longest gene sequence, containing the highest number of exons (16).
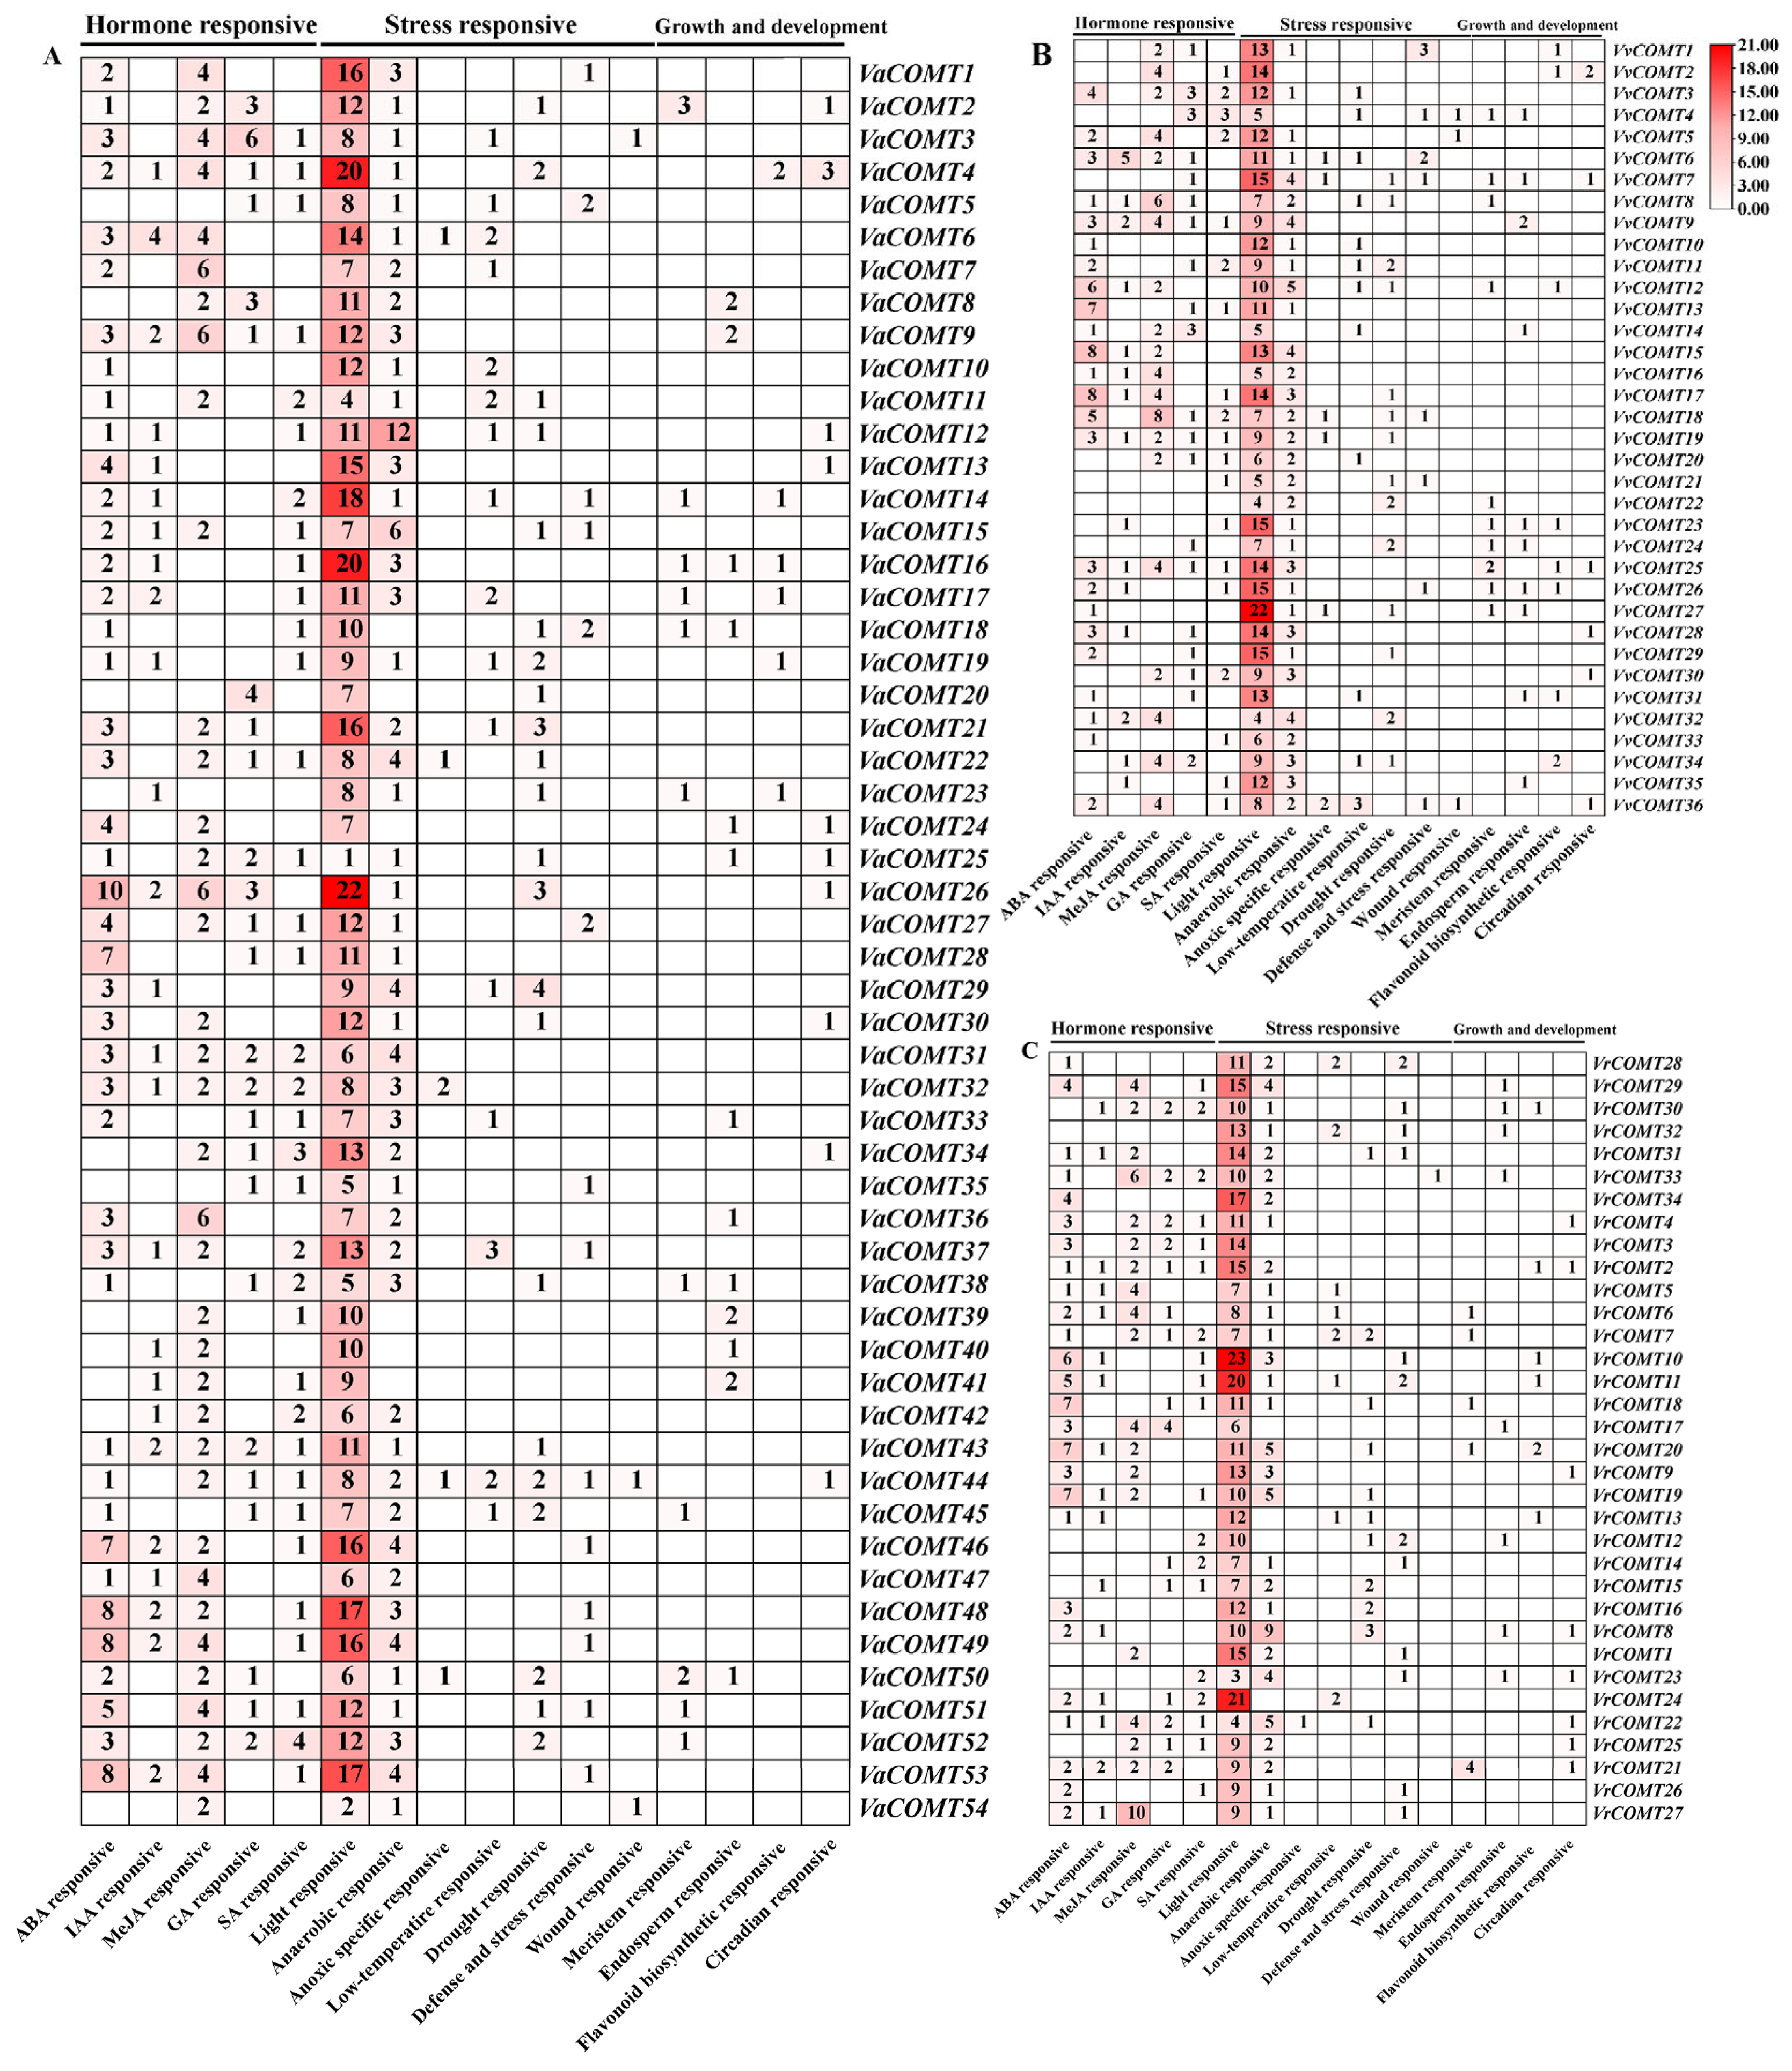
2.5. Cis-Acting Element Analysis of VaCOMT, VvCOMT and VrCOMT Genes
To investigate the potential biological functions of the
COMT genes in three
Vitis species, we analyzed the cis-regulatory elements of 2000 bp upstream sequence from the translation start site (ATG) using the PlantCARE database (
http://bioinformatics.psb.ugent.be/webtools/plantcare/html/). Our analysis revealed that all
COMT promoters contained numerous cis-acting elements (
Figure 4), which we categorized into three function groups; (1) plant hormone response, (2) stress response, and (3) plant growth and development regulation. Notably, all
COMTs contained a large proportion of light response elements in their promoters, which implies that
COMTs may play an important part in light-dependent signaling pathways.
Plant hormone-responsive elements, including ABA, MeJA, SA, GA, and IAA, were identified in the promoters of COMT genes, with each gene containing at least two distinct hormone-responsive elements. In Va, 43 VaCOMT gene promoters contained ABA-responsive elements, with the promoter of VaCOMT36 containing the highest number of elements (10), which suggests that VaCOMT36 is regulated by the ABA signaling pathway. In Pinot noir and Vr, ABA-responsive elements were widely distributed in the promoters of 24 VvCOMTs and 26 VrCOMTs, respectively. Specifically, the promoter of VvCOMT15 and VvCOMT17 contained the most ABA responsive elements (eight elements), followed by that of VrCOMT18 and VrCOMT20, which contained seven ABA-responsive elements. Auxin-responsive elements were widely present in the promoters of 25 VaCOMTs, 15 VvCOMTs, and 16 VrCOMTs. Gibberellin-response elements were distributed in the promoters of 25 VaCOMTs, 19 VvCOMTs, and 15 VrCOMTs. MeJA-responsive elements were found in the promoters of 37 VaCOMTs, 19 VvCOMTs, and 19 VrCOMTs, with VaCOMT36 containing the highest number of MeJA-responsive elements (six elements). Furthermore, the promoters of VaCOMT4, VaCOMT9, VaCOMT4, VaCOMT31, VaCOMT43, VvCOMT9, VvCOMT19, VvCOMT25, VrCOMT2, and VrCOMT22 all contained responsive elements for ABA, MeJA, SA, GA, and IAA. The promoters of 17 VaCOMTs, 5 VvCOMTs, and 9 VrCOMTs contained four different types of hormone-responsive elements.
The promoters of 17 VaCOMTs, 5 VvCOMTs, and 9 VrCOMTs, respectively, contained four different kinds of hormone response elements. The promoters of 14 VaCOMTs, 13VvCOMTs, and 9 VrCOMTs, respectively, contained three different types of hormone response elements. These results demonstrated that hormone-responsive elements were most abundant in the promoter region of VaCOMTs, followed by VvCOMTs and VrCOMTs.
The stress response elements mainly included low temperature, drought, anaerobic induction, and defense and stress response elements. All promoter sequences of the COMT genes in three Vitis species contained at least one element related to the stress response. We also found that nearly all COMT genes contained anaerobic stress response elements. Specifically, hypoxia-specific inducible elements were identified in five VaCOMTs genes, six VvCOMTs, and one VrCOMT (VrCOMT22). Furthermore, low-temperature response elements, drought response elements, and defense and stress response elements were found in 52, 33, and 28 COMT genes, respectively, across the three Vitis species. Overall, promoter analysis suggested that VaCOMTs, VvCOMTs, and VrCOMTs might be involved in growth and development, phytohormone regulation, and the stress response. Moreover, the same cis-elements were observed among different promoter of COMT genes, both within and between the Vitis species.
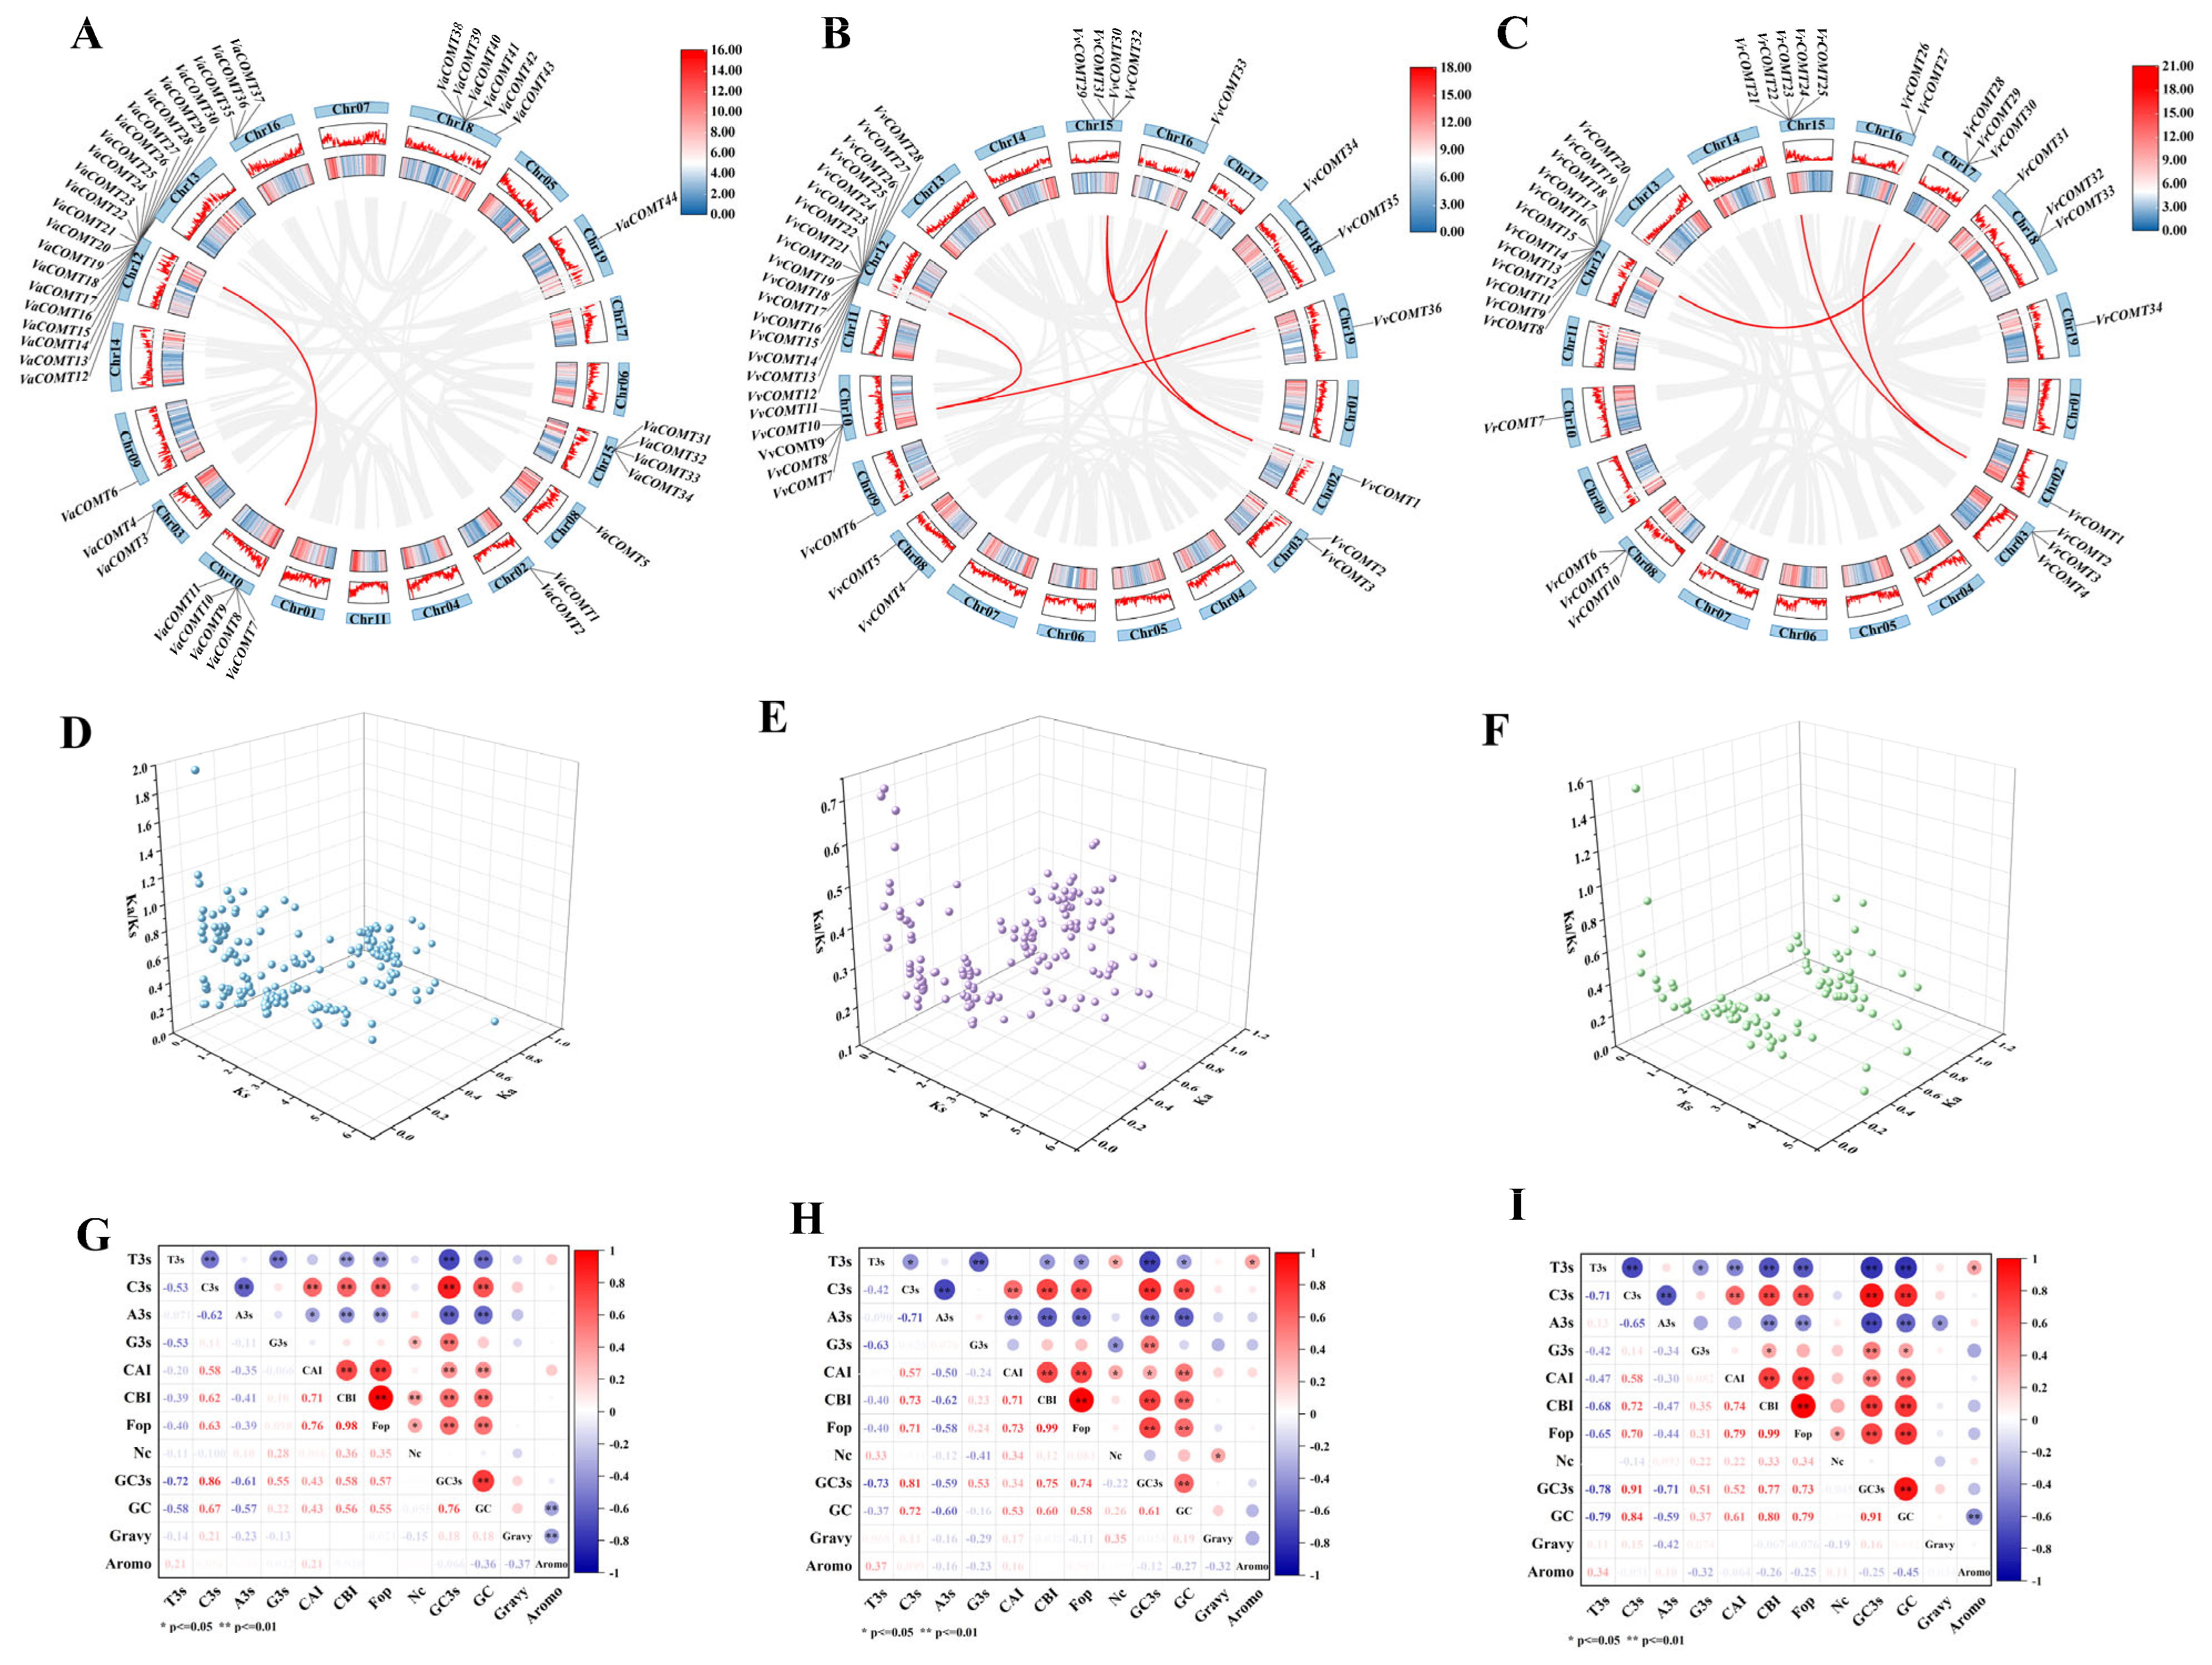
2.6. Analysis of Duplication, Ka/Ks, and Codon Usage Bias of COMT Genes in Grape Genome
To further explore the evolutionary relationships of the
COMT gene family in three
Vitis species, intraspecific collinearity analysis was performed using one-step MCScanX in TBtools-II v2.313 (
Figure 5). In
Va, only one collinear gene pair was detected, namely
VaCOMT7/
VaCOMT20, which was located on Chr10 and Chr12, respectively (
Figure 5A). In Pinot noir, six pairs of collinear
VvCOMT genes were identified, including
VvCOMT8/
VvCOMT17,
VvCOMT9/
VvCOMT14,
VvCOMT7/
VvCOMT36,
VvCOMT32/
VvCOMT33,
VvCOMT30/
VvCOMT1, and
VvCOMT38/
VvCOMT33, which were located on Chr10/12, Chr10/12, Chr10/19, Chr15/16, Chr16/02, and Chr16/Chr19, respectively (
Figure 5B). In
Vr, three pairs of collinear
VrCOMT genes were observed, including
VrCOMT1/
VrCOMT21,
VrCOMT1/
VrCOMT26, and
VrCOMT15/
VrCOMT28, which were located on Chr4/Chr15, Chr4/Chr16, and Chr12/Chr17, respectively (
Figure 5C). Interestingly, the
COMT genes in the Pinot noir genome exhibited the highest degree of collinearity. Furthermore, we speculated that these collinear genes, with their high sequence similarity, may share a common ancestral origin.
Ka and Ks represent non-synonymous substitution and the synonymous mutations rate, respectively [
22]. The Ka/Ks is employed to measure the ration of non-synonyms to synonyms mutation, providing insights into selective pressures that act on genes during evolution [
23]. In this study, we calculated the Ka/Ks ratio for 376
VaCOMT, 318
VvCOMT, and 194
VrCOMT genes pairs across three
Vitis species. In
Va, 368 gene pairs (97.9%) exhibited a Ka/Ks < 1, while 8 pairs (2.1%) showed a Ka/Ks > 1 (
Figure 5D). Similarly, in
V. vinifera cv. Pinot noir (Vv), all gene pairs displayed a Ka/Ks < 1 (
Figure 5E). In
Vr, 192 gene pairs (99.0%) had a Ka/Ks < 1, with only 2 pairs (1.0%) exceeding this threshold (
Figure 5F).
These results suggest that the COMT gene family in three Vitis species has predominantly undergone strong purifying selection, with only a few genes expressing positive selection. This indicates that COMT genes likely maintain conserved biological functions following gene family expansion, although they may still be subject to regulation by environmental factors.
Codon usage preference contributes to further elucidating the genetic and evolutionary characteristic of COMT genes in grapevine. The relative synonymous codon usage frequency of three
Vitis species was analyzed (
Figure 5G–I). In
Va, the effective number of codons (NC) of the
VaCOMT genes ranged from 48.61 (
VaCOMT37) to 61 (
VaCOMT49), and the codon adaptation index (CAI) values ranged from 0.163 (
VaCOMT28) to 0.239 (
VaCOMT39). In Pinot noir, the NC values of the
VvCOMT genes were in the range of 41.1 (
VvCOMT25) to 60.65 (
VvCOMT30), and the CAI values ranged from 0.163 (
VvCOMT13) to 0.229 (
VvCOMT1). In
Vr, the NC values ranged from 50.88 (
VrCOMT27) to 61 (
VrCOMT25), and the CAI values ranged from 0.17 (
VrCOMT30) to 0.235 (
VrCOMT33). We analyzed the RSCU values of
VvCOMT,
VrCOMT, and
VaCOMT proteins. As shown in
Table S3, the number of COMT proteins that preferentially used codons with RSCU values >1 was higher in
VaCOMT than in the
VvCOMT and
VrCOMT proteins.
Furthermore, correlation analysis of codon usage parameters revelated that T3s was positively correlated with C3s, G3s, G3s, CBI, and FOPs, while C3s was negatively correlated with CBI, FOPs, GC, and Gc3 (
Figure 5G–I). However, no significant difference in codon usage parameters was observed among the three
Vitis species.
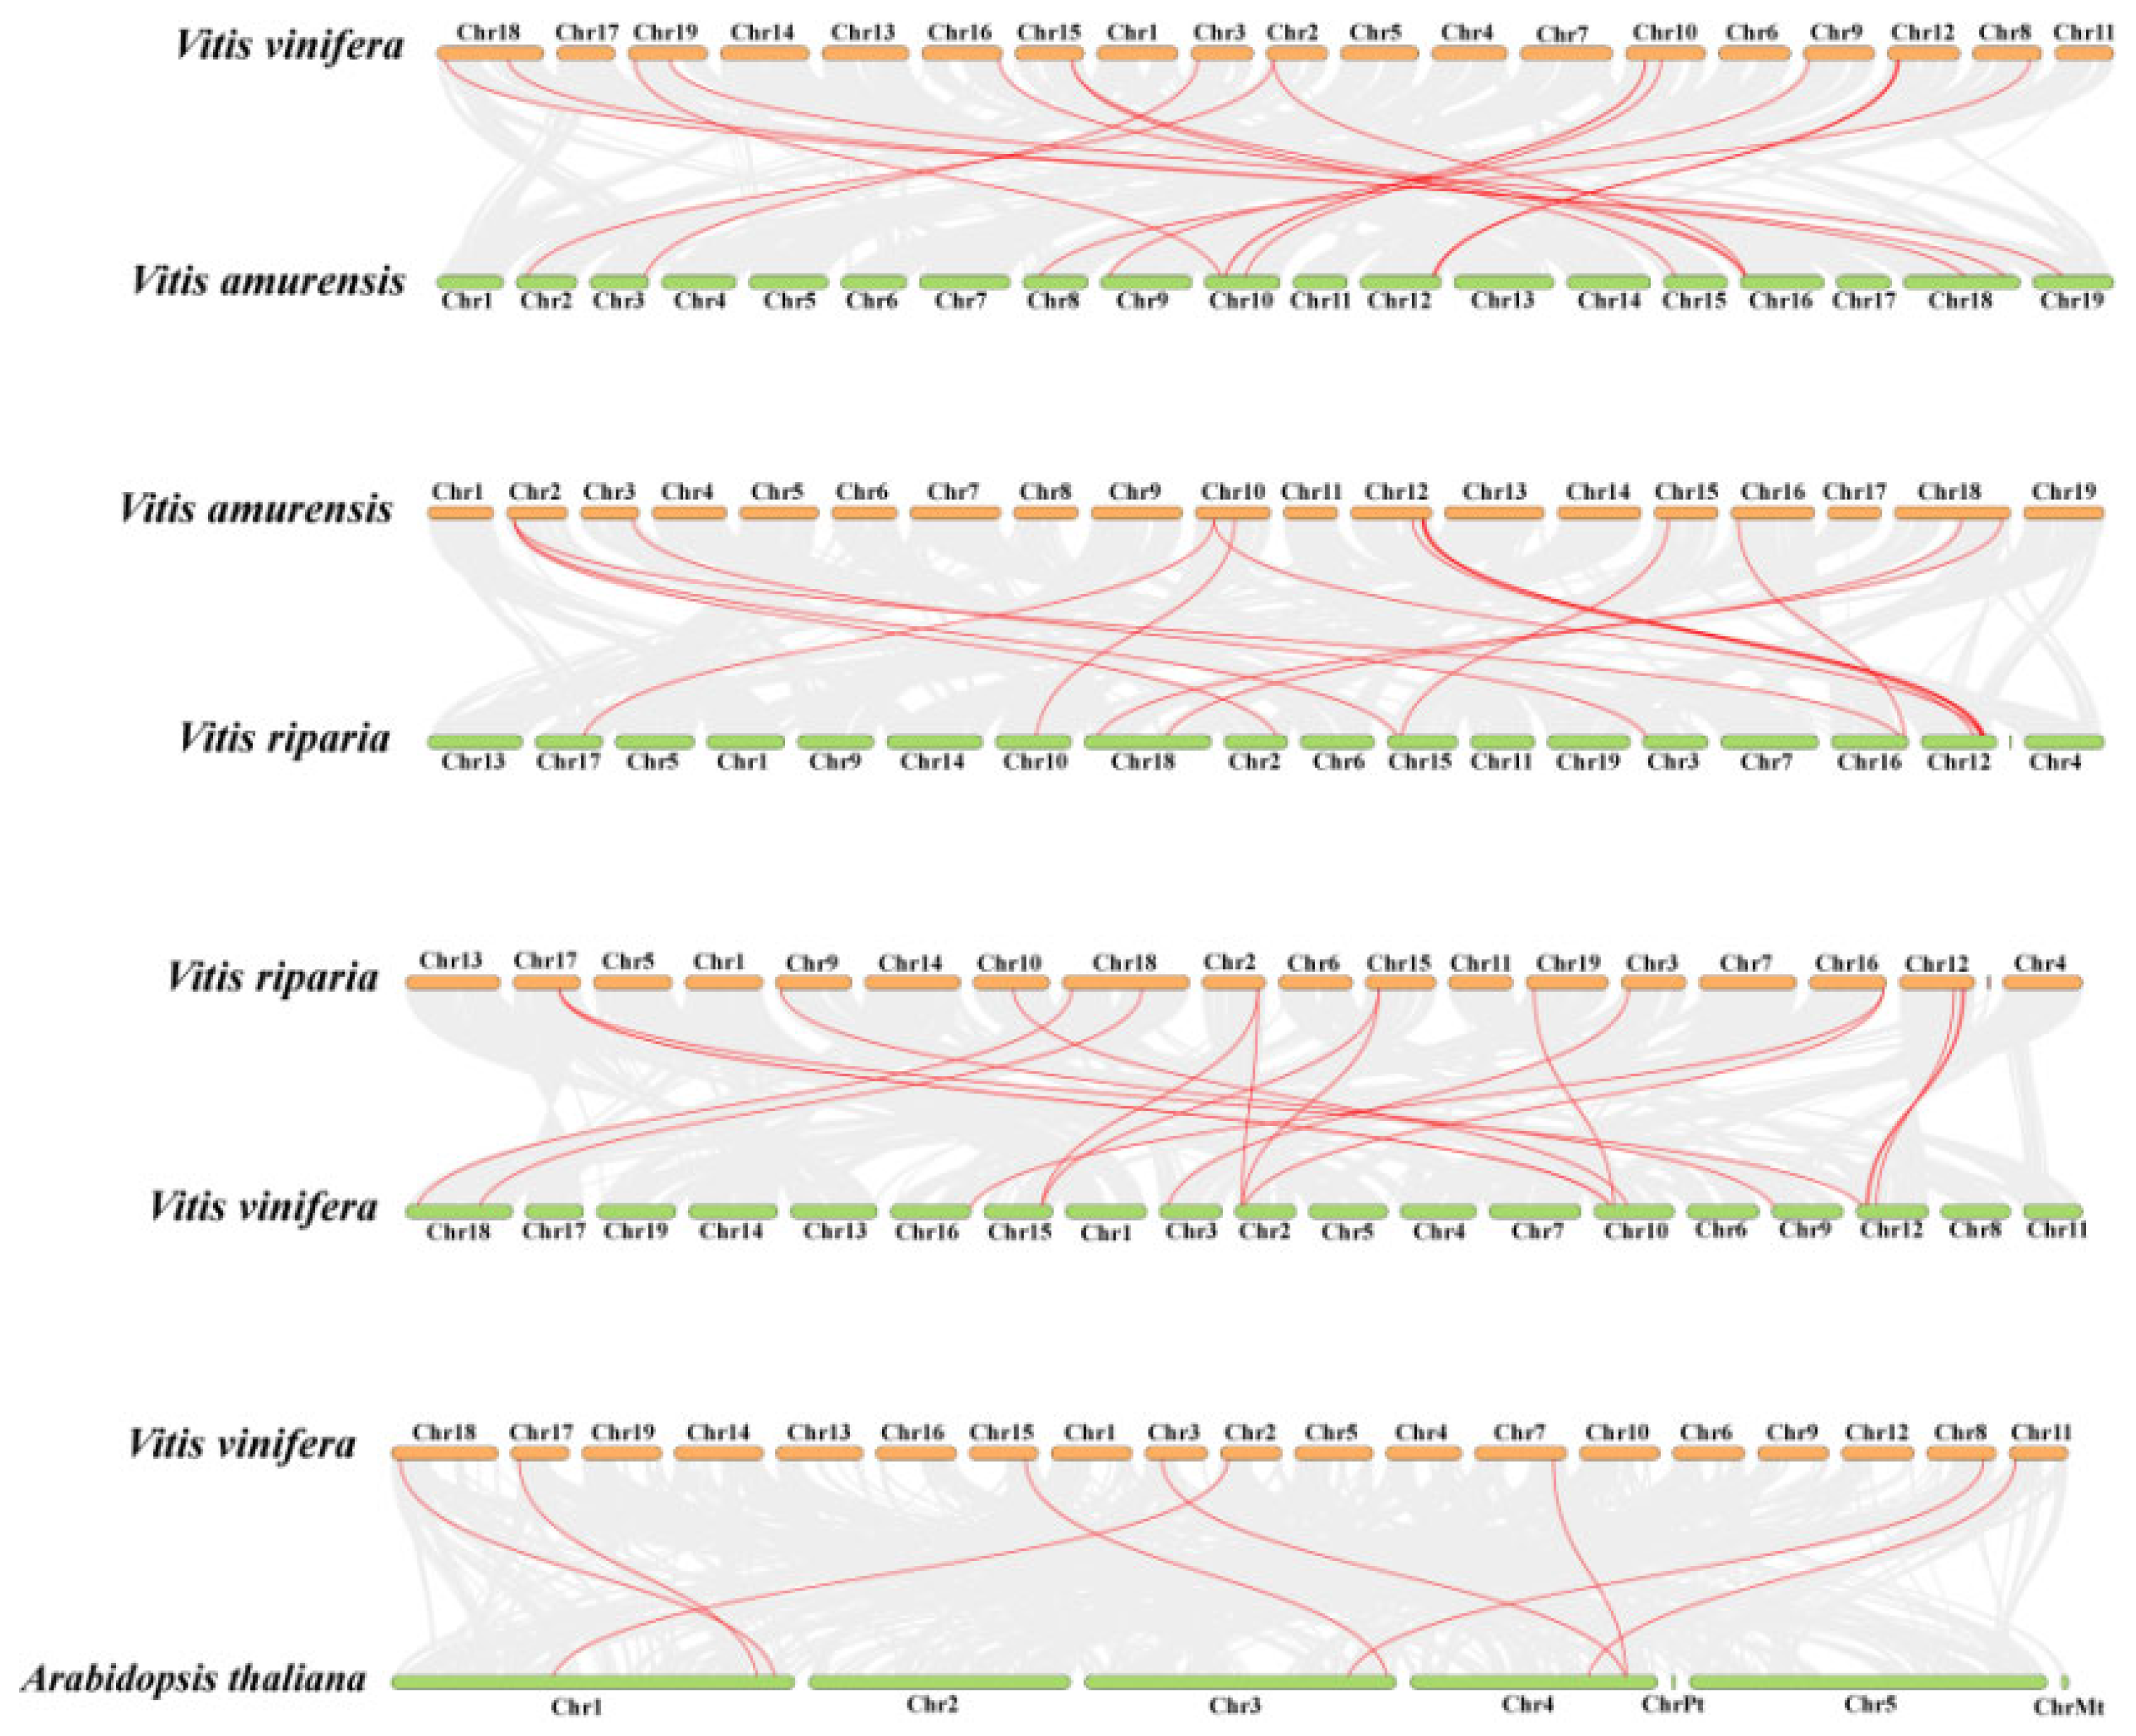
To further infer the evolutionary mechanisms of the COMT genes in three
Vitis species, interspecific collinearity analyses were conducted between Pinot noir and
Va,
Va and
Vr,
Vr and Pinot noir, and Pinot noir and
Arabidopsis (
Figure 6). A total of 20, 17, 18, and 8 pairs of homologous genes were detected, respectively. The
VvCOMT genes in Pinot noir exhibited the most collinear gene pairs with
VaCOMT in
Va, while the fewest collinear gene pairs were observed between Pinot noir and
Arabidopsis. These results indicate that the
COMT genes in the three
Vitis species are highly conserved.
2.7. Expression Analysis of the Grape COMT Gene Family
2.7.1. Expression Analysis of VvCOMT in Different Tissues
The expression profile of
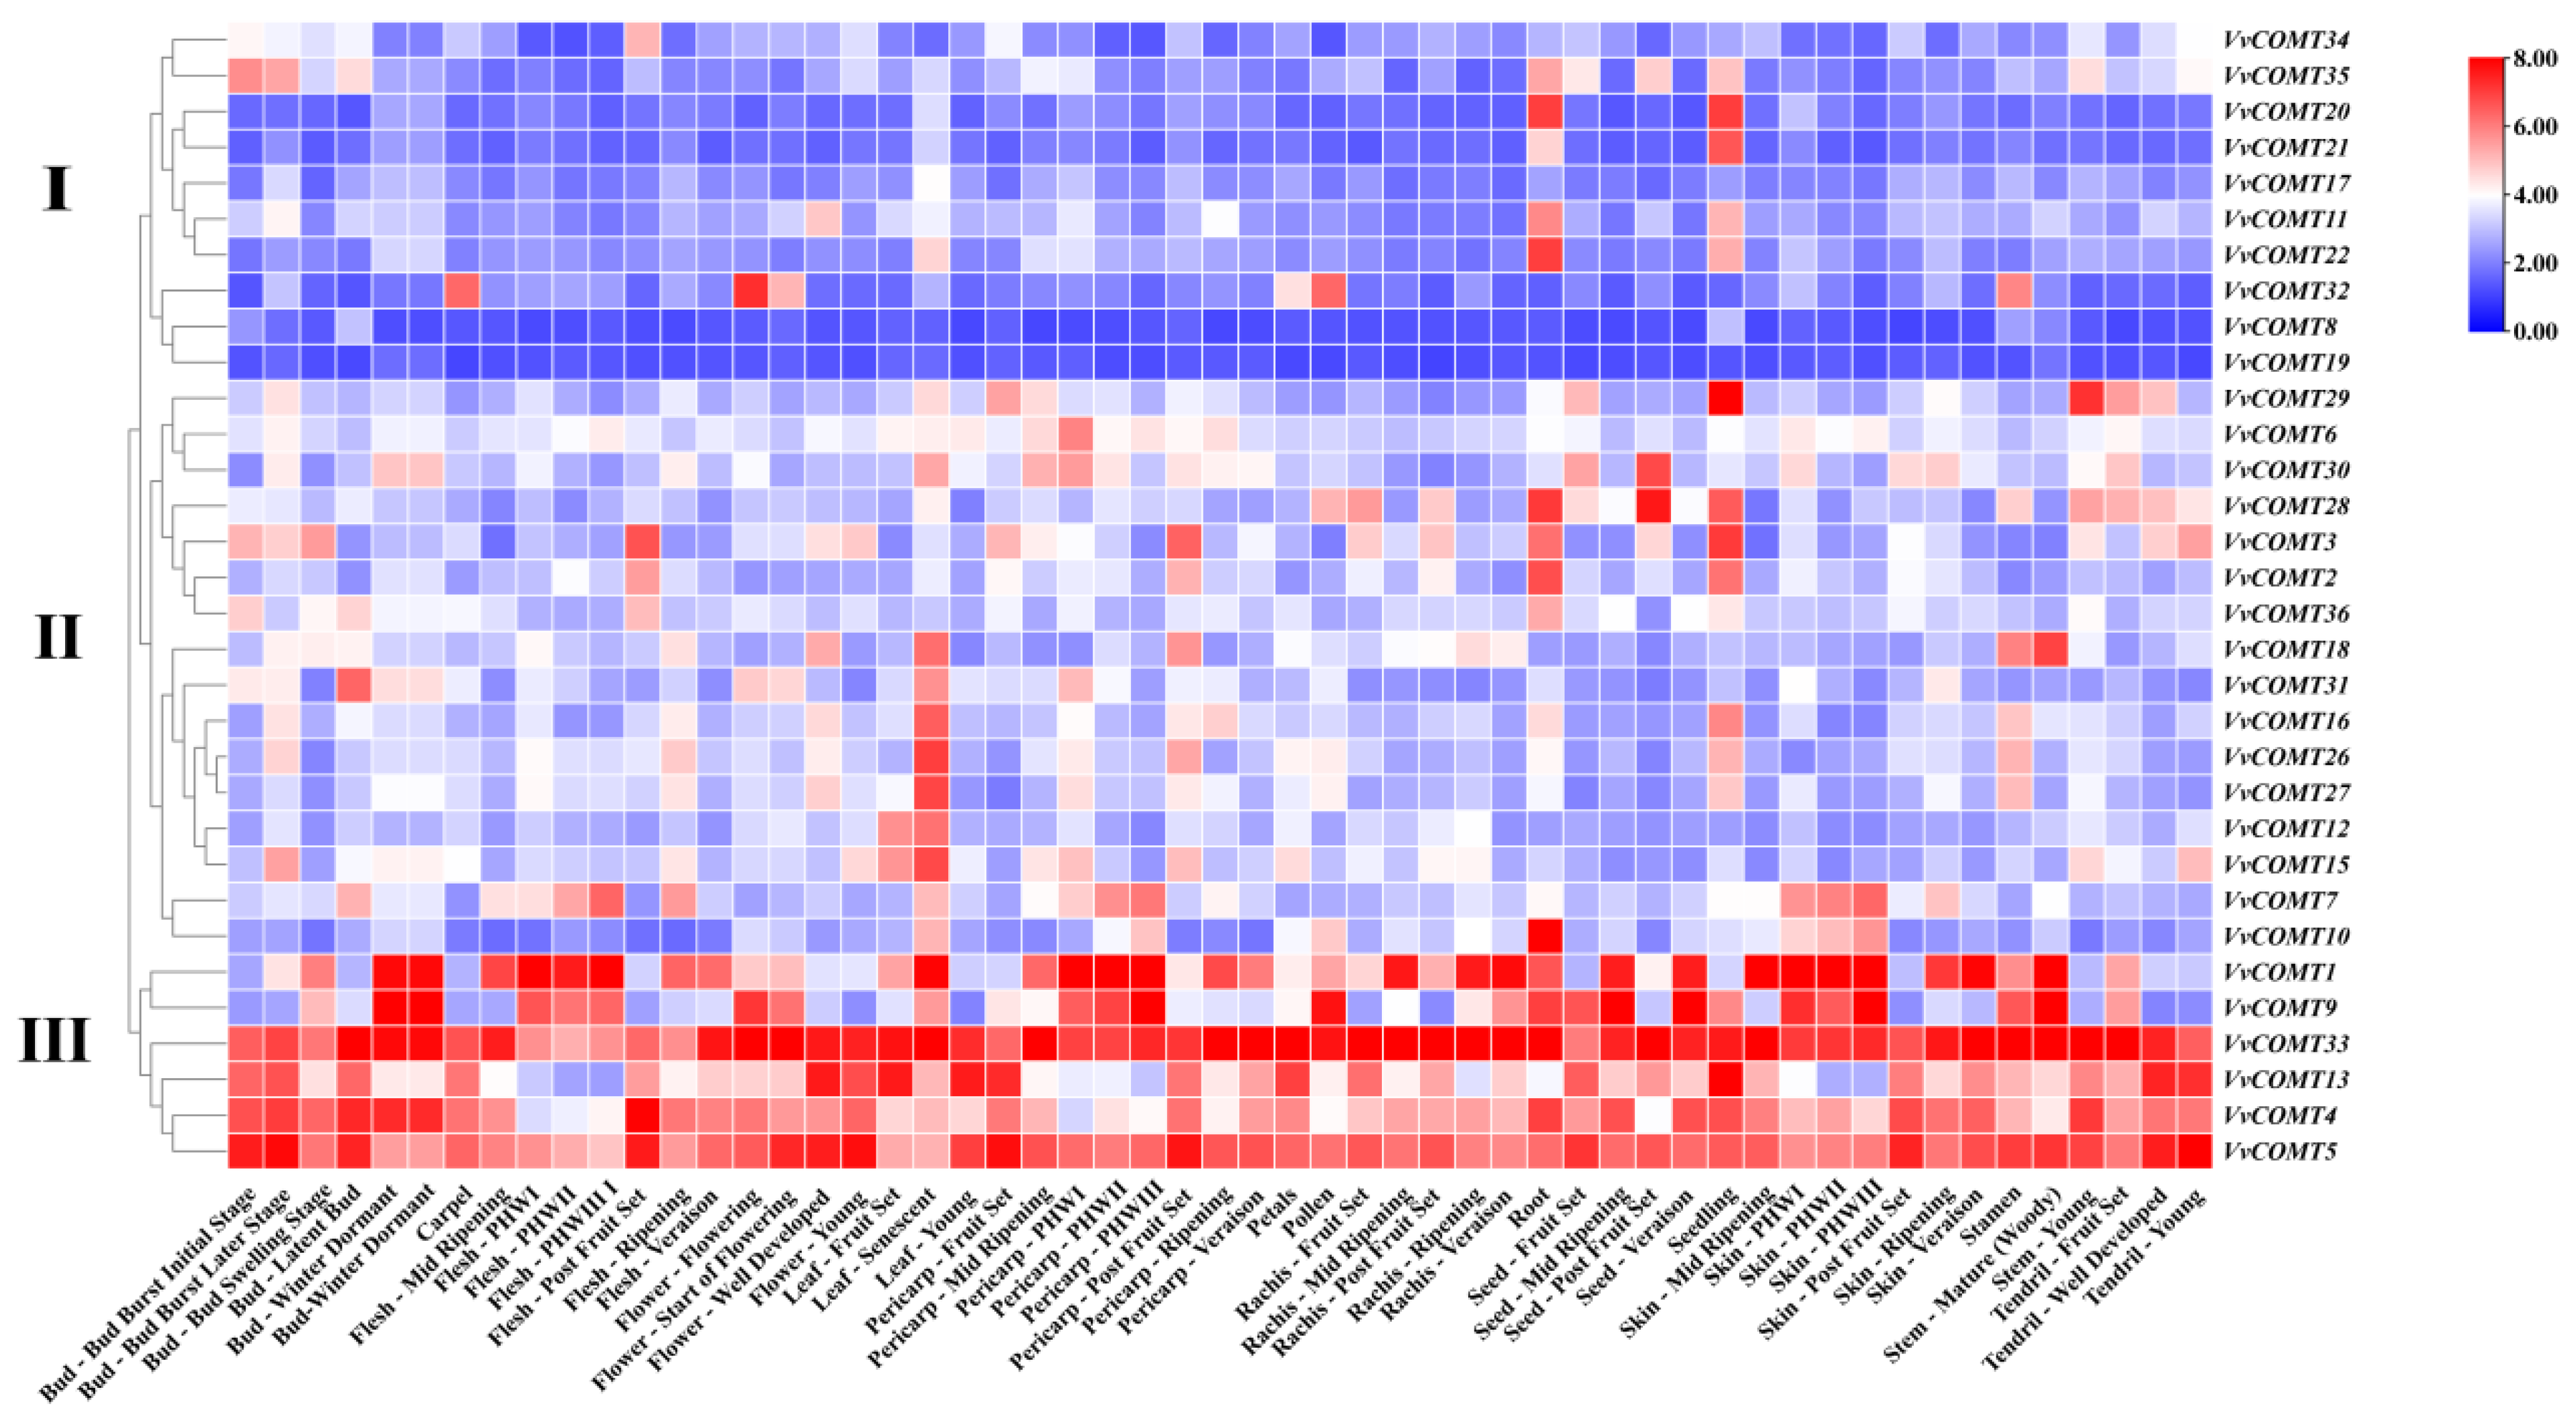
VvCOMT genes in different tissue and organs at various development stages (including roots, leaves, flowers, fruits, seeds, etc.) were obtained utilizing transcriptome data from NCBI (GSE36128). The expression of the
VvCOMTs exhibited distinct tissue specificity (
Figure 7). In general, the
VvCOMT genes were divided into three groups according to their expression patterns. Group I included 10 genes, and their expression levels were low in a majority of tissues and organs, except
VvCOMT32, which had a higher expression level in flowers, pollen, carpel, and stamens, and
VvCOMT20,
VvCOMT21,
VvCOMT11, and
VvCOMT12, which were expressed with a higher level in roots and seedlings. Group II includes
VvCOMT18,
VvCOMT31,
VvCOMT16,
VvCOMT26,
VvCOMT27,
VvCOMT12, and
VvCOMT15, which are only expressed in specific tissues, such as senescent leaves. Group III included
VvCOMT33,
VvCOMT13,
VvCOMT4, and
VvCOMT5. These genes were highly expressed in various tissues and organs across different growth and development stages. Interestingly,
VvCOMT33 was highly expressed in tendrils, leaves, pericarp, flowers, rachis, skin, seeds, stem, tendril, and buds at different development stages. Additionally,
VvCOMT28,
VvCOMT3,
VvCOMT2, and
VvCOMT10 exhibited higher expression levels in roots.
2.7.2. Expression Analysis of VvCOMT Under Abiotic Stresses
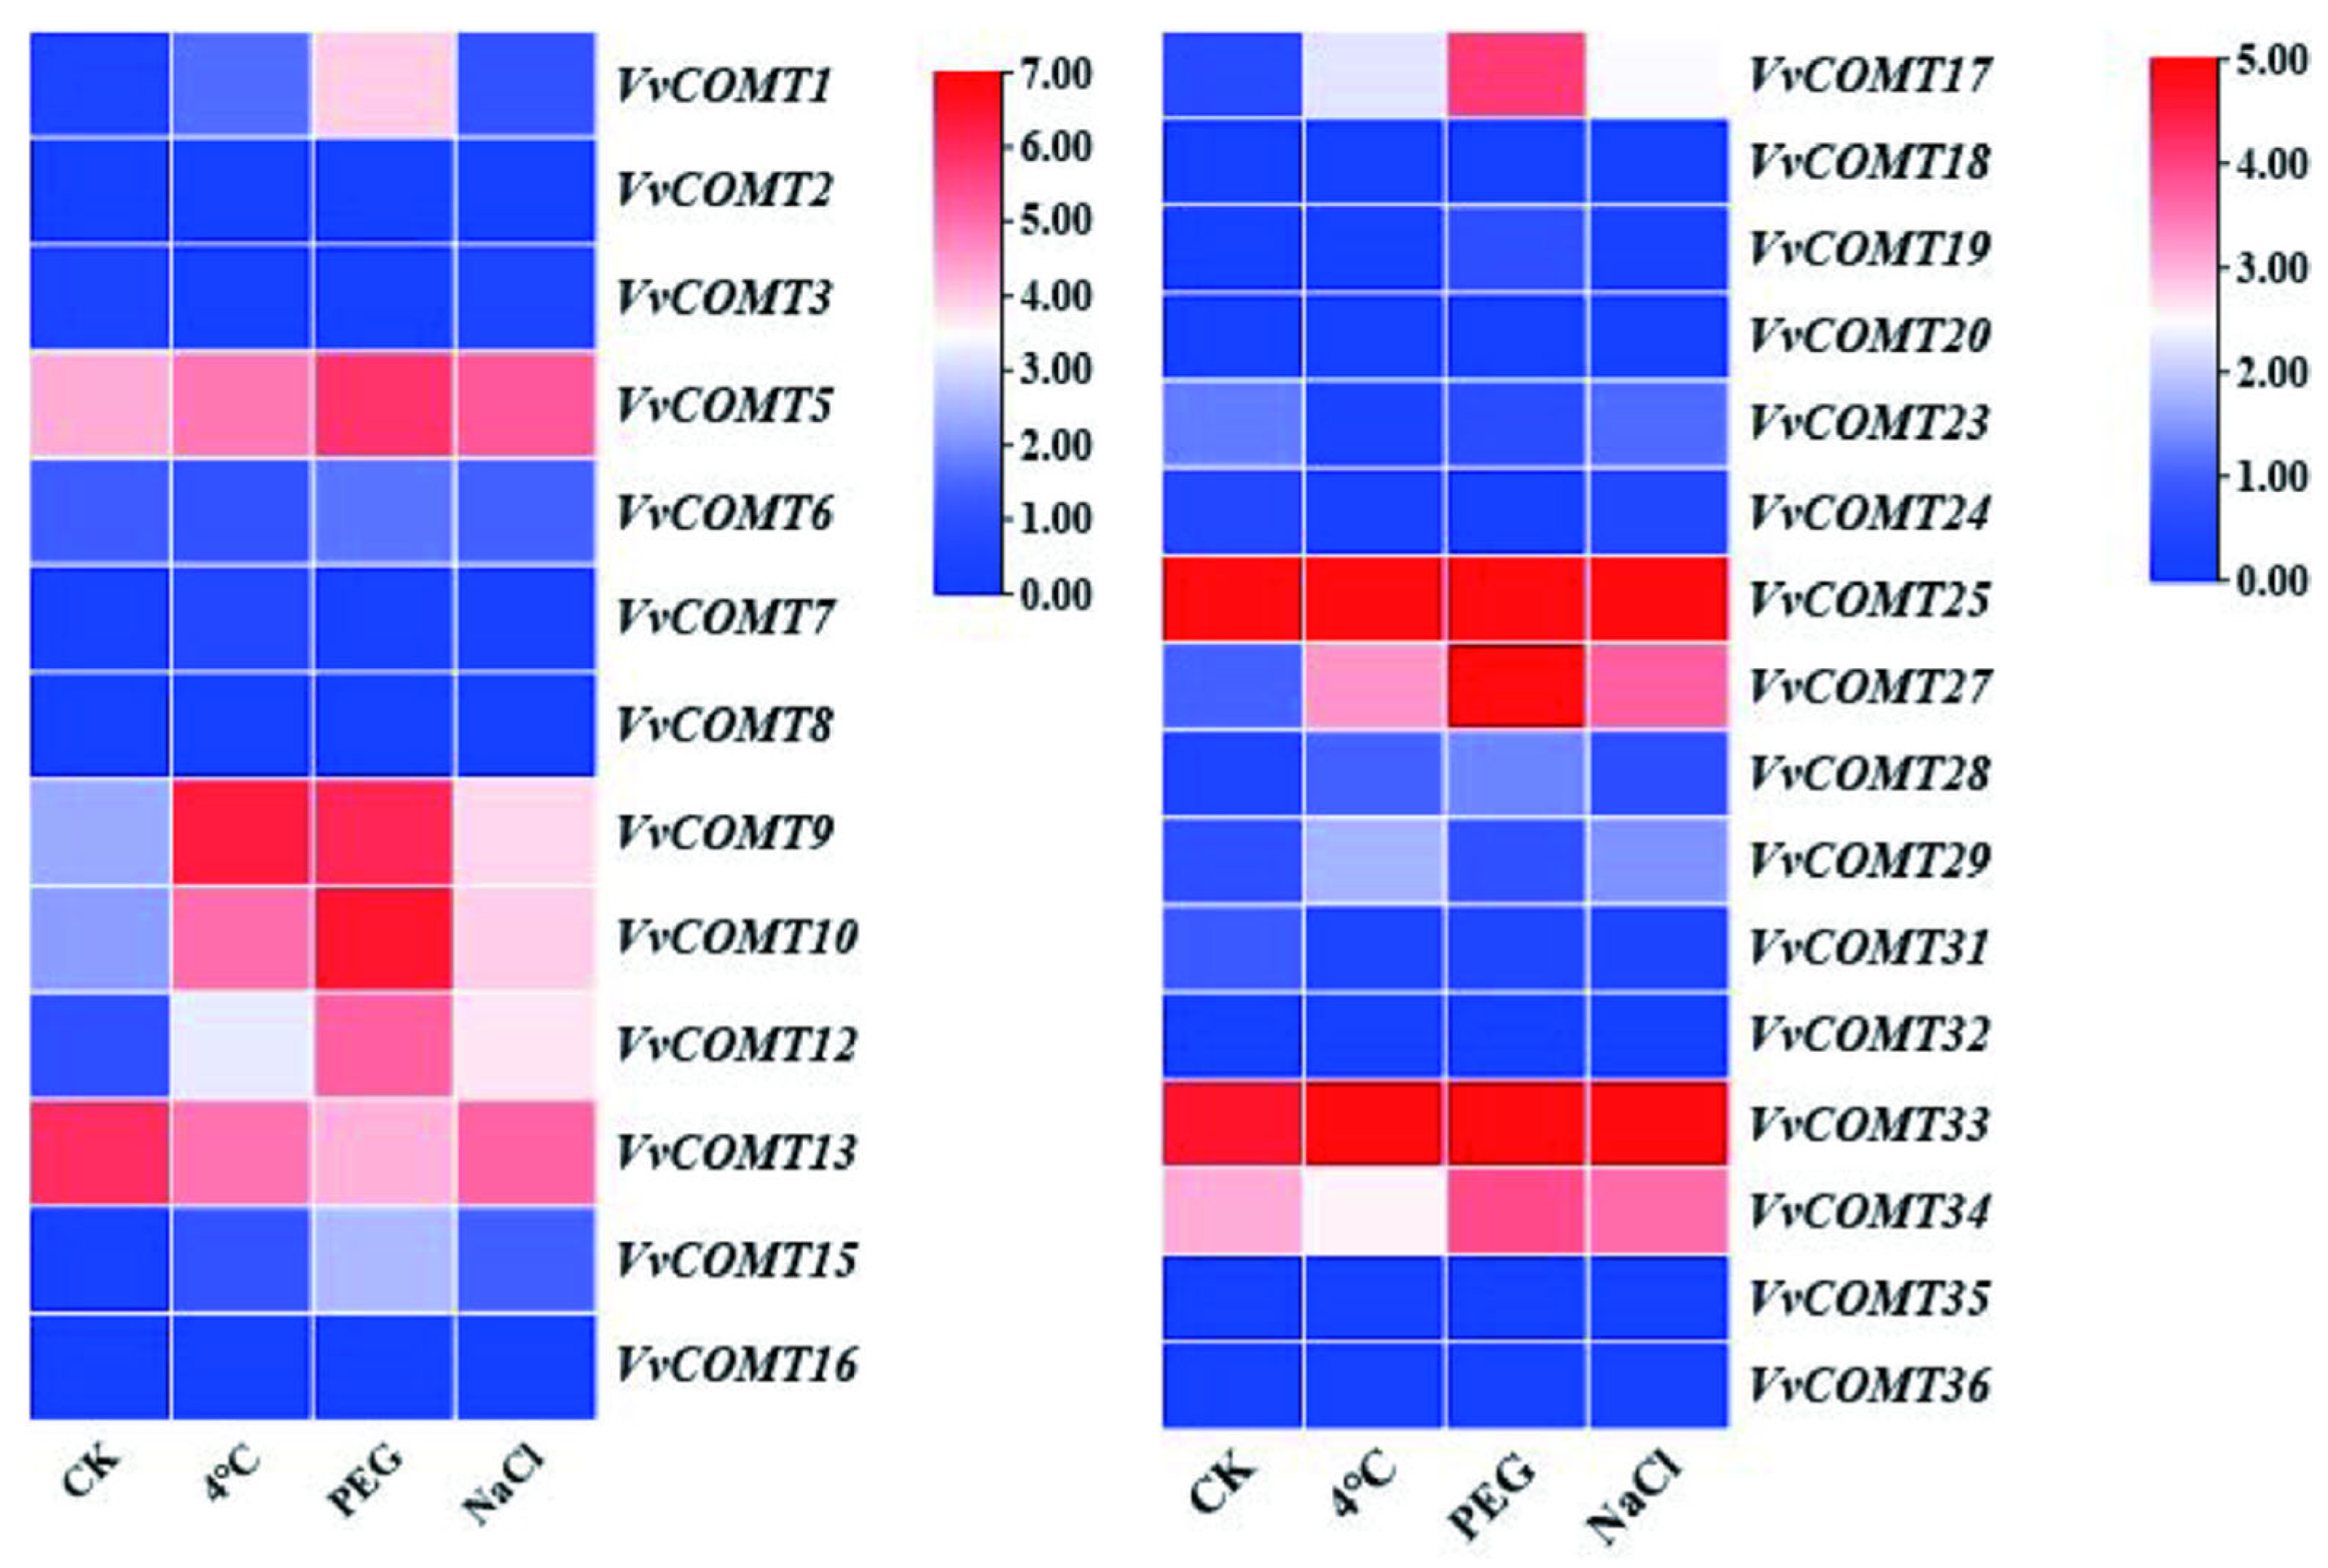
The expression levels of
VvCOMT genes under NaCl, PEG, and low-temperature stress were analyzed using transcriptome data from NCBI (GSE276430) (
Figure 8). The results indicated that the expression levels of
VvCOMT5,
VvCOMT9,
VvCOMT10,
VvCOMT13,
VvCOMT26, and
VvCOMT33 were significantly increased under cold (4 °C), PEG, and NaCl stress. The relative expression levels of some
VvCOMT genes, such as
VvCOMT12 and
VvCOMT34, were increased under PEG and NaCl stress.
VvCOMT1 and
VvCOMT17 exhibited significantly increase under PEG stress. Conversely, some genes were suppressed by one or more stresses, such as
VvCOMT3,
VvCOMT6,
VvCOMT7,
VvCOMT28,
VvCOMT29, and
VvCOMT31, which showed significantly decreased expression levels under cold (4 °C), PEG, and NaCl stress. Additionally, the relative expression levels of
VvCOMT34 and
VvCOMT12 were significantly decreased under cold stress (4 °C), while those of
VvCOMT1,
VvCOMT15, and
VvCOMT17 were significantly decreased under both cold (4 °C) and NaCl stress.
2.7.3. qRT-PCR Analysis of VvCOMT Expression Patterns Under Abiotic Stresses
Based on the transcriptome data of the
VvCOMT genes under abiotic stresses such as NaCl, PEG, and cold (4 °C) stress, 13
VvCOMT genes were screened for qRT-PCR verification (
Figure 9). The results showed that different
VvCOMT genes exhibited distinct expression patterns under various abiotic stress. Under NaCl treatment, most of the genes were significantly upregulated at all points and peaked at 24 h, whereas
VvCOMT18 was downregulated at 12 and 24 h. Among the upregulated genes, the expression of
VvCOMT12 did not change significantly. Moreover, the relative expression level of
VvCOMT13 was more than 100-fold larger than control at 24 h.
Under cold stress (4 °C), most genes exhibited weak expression at all points, except for VvCOMT12, VvCOMT13, VvCOMT15, VvCOMT17, and VvCOMT18. Among these genes, the expression levels of VvCOMT12, VvCOMT15, and VvCOMT17 were significantly upregulated at 3 h, 6 h, and 12 h, respectively, with the highest expression being observed at 3 h. The expression of VvCOMT18 initially increased and then decreased, reaching a peak that was more than 660-fold higher than that of the control. These results indicated that these significantly expressed candidate genes played important roles in the response to NaCl, PEG, and low-temperature stress. Furthermore, the expression patterns of the VvCOMT genes were generally consistent with the presence of cis-elements in their promoters.
3. Discussion
COMT is a key enzyme in the plant phenylpropanoid pathway, participating in diverse biosynthetic pathways and secondary metabolic processes, such as the methylation modification of flavonoids, alkaloids, and stilbenes. It plays an important role in plant stress resistance and environmental adaptation [
24]. The number of
COMT gene family members varies among different plants. For example, 17
AtCOMTs and 33
OsCOMTs have been identified in the annual herbaceous model plants
A. thaliana and rice, respectively. In this study, 54
VaCOMTs, 36
VvCOMTs, and 34
VrCOMTs were identified from
Va, Pinot noir, and
Vr, respectively. Compared with
A. thaliana (17) and rice (33), the number of
COMT genes in grapes is significantly higher, which indicates that this gene family has undergone substantial expression during the evolution of grapevine. Gene duplication, mainly including tandem duplication and segmental duplication, plays a significant role in biological evolution [
25]. Interestingly, the number of tandem duplication gene pairs identified was much greater than that of collinear gene pairs found through intraspecific collinearity analysis in
Va, Pinot noir, and
Vr, respectively. These findings signify that tandem and segmental duplication are the primary drivers of this gene family’s expansion, with tandem duplication playing the dominant role.
The enzyme caffeic acid O-methyltransferase (COMT) is central to lignin biosynthesis [
26]. Structure–function analyses of a caffeic acid O-methyltransferase from perennial ryegrass revealed the molecular basis for substrate preference. In this study, eight pairs of homologous genes were identified among 124 COMT genes in three
Vitis species. Among these,
VvCOMT13 exhibited the highest expression levels in transcriptome data analysis under low temperature, salt, and drought stress. Based on these findings, we speculate that
VrCOMT18/
VaCOMT28 may also exhibit high expression levels under similar stresses. The number of genes derived from the same ancestor gene varies among the three
Vitis species. This inconsistency suggests that the three grape species may belong to distinct populations. Differences in origin and growth environment may have driven the expression of the
COMT gene family to adapt to environmental pressures. Therefore, we hypothesize that tandem repetition has been a primary mechanism in the COMT gene family within the
Vitis species. Similar findings have been reported during the expansion of this gene family in rice [
27].
Although all 124
COMT genes in the three
Vitis species possessed the caffeic acid-O-methyl transferase (COMT) conserved domain (PF00891), their basic characteristics, including coding sequence length, amino acid length, molecular weight, isoelectric point, and fat coefficient, were different. These results indicated that the COMT gene family has diverged among the different
Vitis species during evolution. The secondary structure elements are predominantly composed of α-helices, extended strands, and random coils, with extended strands and random coils occupying a higher proportion. These findings are consistent with the characteristics of COMT secondary structure in maize [
28], which suggests that this may represent a unique secondary structure feature of COMT proteins. Subcellular localization prediction indicates that COMT proteins in grape may be located in the plasma membrane, cytoplasm, and extracellular space. In a transient expression assay in tobacco, ClCOMT1-GFP genes were located in the cytoplasm [
13]. This is similar to the results of our subcellular localization prediction, but there are differences, which indicates that these genes may perform different functions.
The COMT members from
A. thaliana, rice, and three
Vitis species were divided into four groups based on the phylogenetic tree. Group I, III, and IV each included members from three species, while group II only included member from rice and grapes Additionally, the protein similarity among
Va,
Vr, and Pinot Noi clustered as a distinct clade, was greater than 90%, such as VaCOMT10, VvCOMT10, and VrCOMT28. These findings indicated that the COMT genes in
Va, Pinot noir, and
Vr were highly conserved and exhibit a high degree of function similarity, with a lesser degree of differentiation during evolution. Transcriptome data analysis revealed that
VvCOMT10 was highly expressed under 4 °C and PEG stress. Similarly, we speculated that the expression of
VaCOMT10 and
VrCOMT28 may be induced by 4 °C and PEG stress. Furthermore, the cis-acting elements in the promoters of
VaCOMT10,
VvCOMT10, and
VrCOMT28 include ABA response elements and low-temperature response elements. Therefore, we hypothesize that
VaCOMT10,
VvCOMT10, and
VrCOMT28 may play an important role in low-temperature and drought resistance. Previous studies have shown that the rice
COMT gene members
OsCOMT2,
OsCOMT5,
OsCOMT16, and
OsCOMT21 are strongly induced under drought stress [
14]. Therefore, members of the grape
COMT gene family may also have similar functions.
In general, the distribution patterns (numbers and distribution position) of exons and conserved motifs for the COMT proteins in three
Vitis species were highly similar to their corresponding phylogenetic grouping, suggesting that the
COMT gene family is relatively conserved in grapevine. The number of exons of 124
COMT genes ranged from 1 to 16, with genes that had more exons generally exhibiting longer coding length sequences. This indicated that both the number and complexity of genes have increased as the number of exons has grown during the evolution. This finding is consistent with the relatively conservative sequence of the
COMT gene in eucalyptus [
29]. Addition, we also found that the type and number of cis-acting elements of
COMT members within the same subgroup were also similar. The
COMT genes clustered in the same branch of Group I and II all shared motif 5, which also contained ABA rand MeJA response elements. This indicated that strong conservation was observed between Group I and Group II, with similar cis-acting elements in their promoters, suggesting that they may play a similar functional role. Most COMT members of the three
Vitis species located in the same branch of Group VI contained motif 1. Among the 18
COMT genes from three
Vitis species, there are 18 low-temperature response elements and 19 drought response elements. The analysis of cis-acting elements suggests that these genes may be involved in the low-temperature and drought signal responses. Existing research has shown that genes located in the same subgroup of a phylogenetic tree also exhibit functional similarities due to their similar gene structures and conserved motifs [
30].
The analysis of cis-acting elements revealed that the upstream promoter sequences of the
COMT genes in three
Vitis species primarily contain three categories of cis-acting elements, including hormone-responsive elements (ABA, IAA, MeJA, GA, and SA), growth and development elements, and defense stress response elements. These findings suggest that
COMT members play important roles in growth and development, hormone signal transduction, and abiotic stress resistance. In citrus,
PtCOMT has been shown to integrate ABA signals and regulate ABA synthesis to enhance root drought resistance [
31]. The overexpression of
CICOMT1 in
A. thaliana increased the melatonin content in transgenic plantlets and improved their resistance to abiotic stress [
32]. Meanwhile, qRT-PCR results indicated that
VvCOMT15/
17/
18 containing more than 5 ABA response elements was significantly up-regulated under low-temperature and salt stress, which suggests that these genes may be involved in the ABA-dependent low-temperature signaling pathway and melatonin synthesis. These results are consistent with the previous research regarding CsCOMT1 in cucumber, which demonstrated that GATA3–COMT1–Melatonin acts as an upstream signaling of ABA, participating in selenium-enhanced cold tolerance by regulating the iron uptake and distribution in
Cucumis sativus L. [
32].
VvCOMT9 and
VvCOMT10 exhibited similar sequence and expression patterns under NaCl and PEG treatment and were identified as tandem-duplication genes. This illustrates that tandemly repeated
COMT genes in grape exhibited functional redundancy, and that their homologous genes (
VaCOMT35/
VrCOMT26) are likely to participate in salt and drought resistance. Moreover,
VvCOMT33 and
VvCOMT13 were highly expressed by under NaCl and PEG induction, which suggests that they play important roles in salt and drought resistance. Thereby, it can be inferred that the homologous genes of
VvCOMT33 (
VaCOMT35/
VrCOMT18) and
VvCOMT13 (
VaCOMT28/
VrCOMT15) likely have a similar function role in salt and drought stress. Under cold stress (4 °C),
VvCOMT12/
15/
17/
18 exhibited the highest relative expression level at 3 h, which suggests that these genes play a particular role in low-temperature resistance. In brief, the
COMT genes in grapes play an important role in abiotic stress resistance. However, in this study, only Pinot noir suspension cells under abiotic stress were used as material to analyze the expression level of
VvCOMTs. Further in-depth research is required to investigate whether these genes show a similar expression pattern in grape plants, or whether their homologous genes in
Vr and
Va express similar functions.
5. Conclusions
In this study, a total of 124 COMT gene family members were identified in three Vitis species—Pinot Noir, Vr, and Va, respectively—andthe physicochemical properties, cis-acting elements, gene structures, conserved motifs, chromosomal physical location, codon preferences, and intraspecific collinearity among VrCOMTs, VvCOMTs, and VaCOMTs exhibited certain differences. Interspecific collinearity analysis showed 20 pairs, 17 pairs, 18 pairs, and 8 pairs of homologous genes between VvCOMTs and VaCOMTs, VaCOMTs and VrCOMTs, VrCOMTs and VvCOMTs, and VvCOMTs and AtCOMTs, respectively. The Ka/Ks analysis indicated that COMT genes in three Vitis were subjected to purifying selection during evolution. Finally, under PEG, NaCl, and 4 °C treatment, different members presented distinct spatial and temporal expression patterns, which provides a basis for further research on the function of the COMT genes in resistance to abiotic stress in Vitis ssp. and lays the foundation for molecular breeding in the future.

