Abstract
The plant-specific PLATZ transcription factors play crucial roles in plant growth, development, and responses to abiotic stresses. However, despite their functional significance, PLATZ genes remain poorly characterized in soybeans. In this study, we conducted a genome-wide analysis of the GmPLATZ gene family and investigated their expression profiles under salt stress. We identified a total of 29 GmPLATZ genes in the soybean genome and systematically analyzed their physicochemical properties, conserved domains, evolutionary relationships, cis-acting elements, and expression regulation patterns. Subcellular localization predictions indicated nuclear localization for most GmPLATZs, except for GmPLATZ5 and GmPLATZ14, which showed dual chloroplast–nuclear localization. A gene family expansion analysis indicated that 21 segmental duplication events were the primary driver of GmPLATZ diversification. A phylogenetic analysis classified the GmPLATZ genes into four subgroups, while gene structure and motif analyses revealed conserved zinc-binding domains and identified multiple cis-acting elements associated with light responsiveness, hormone signaling, and stress responses. Expression profiling showed tissue-specific expression patterns, with 13 GmPLATZ genes differentially expressed under salt stress, including root-preferential members (e.g., GmPLATZ1, GmPLATZ10) and leaf-preferential members (e.g., GmPLATZ8, GmPLATZ9). This study provides a theoretical basis for further investigation of GmPLATZ gene functions in soybean development and stress tolerance.
1. Introduction
Soybean is a pivotal food and oilseed crop, serving as an indispensable component of human life. However, in recent years, the expansion of saline–alkali soil has been driven by climatic and environmental changes [1]. As a salt-sensitive crop, soybean exhibits decreased emergence and germination rates under salt stress. Salinization disrupts the balance of K+ and Na+ in plants, leading to excessive reactive oxygen species (ROS) production and subsequent toxicity [2]. Excess ROS induce plasma membrane peroxidation, hinder photosynthesis, and trigger cell apoptosis, ultimately causing a 30% reduction in yield and a 23% decrease in 100-seed weight [3]. Given the profound impact of salt stress on soybean yield, extensive research on soybean salt tolerance has been progressively conducted. The SOS (Salt Overly Sensitive) pathway plays a crucial role in reducing cytosolic Na+ concentration in plants by promoting excessive Na+ efflux into the soil. The core components of the SOS pathway in Arabidopsis thaliana include SOS1, SOS2, and SOS3. SOS1, a plasma-membrane-localized Na+/H+ antiporter, facilitates Na+ extrusion from cells. The role of the Endosomal Sorting Complex Required for Transport (ESCRT) in salt tolerance has also been confirmed, as one of its components, VPS23A, enhances SOS1 activity by promoting SOS2–SOS3 interaction and their plasma membrane localization [4]. Recently, it has been reported that Sorting Nexin 1 (SNX1) contributes to salt-induced plasma membrane localization and accumulation of SOS1. Mutants of the Arabidopsis transcription factors ARF7 and ARF19 are sensitive to salt stress, with reduced SOS1 expression and elevated Na+ content observed in arf7arf19 mutants under salt stress. Notably, ARF7 and ARF19 do not significantly bind to the SOS1 promoter but activate SOS1 transcription by binding to an AuxRE element within the first exon of the SOS1-coding region. Additionally, a RING-type E3 ubiquitin ligase, CHYR1, ubiquitinates and promotes the degradation of ARF7 and ARF19 proteins, thereby inhibiting SOS1 expression and plant salt tolerance. Under high-salt conditions, CHYR1 expression is suppressed, stabilizing ARF7 and ARF19 proteins, which ultimately enhances the SOS1 expression and plant salt tolerance [5].
Transcription is regulated in large parts by transcription factors, which govern numerous biological processes, including development, signaling, and stress responses. Distinct transcription factor families, such as NF-Y, MYB, and WRKY, are critical for stress tolerance, whereas GRF regulates root, flower, and seed development, and AP2 participates in floral organogenesis and nodule formation [6]. Transcription factors contain one or more functional domains that activate or repress target gene expression by binding to their cis-acting regulatory regions. Combinatorial regulation further indicates that transcription factors cooperatively interact to orchestrate diverse cellular processes [7]. WRKY transcription factors (TFs) participate in the abscisic acid (ABA)-signaling pathway and function as cross-regulatory factors across diverse signaling networks. The overexpression of GmWRKY12 [8] and GmWRKY49 [9] has been shown to improve salt tolerance in transgenic soybean plants. bZIP transcription factors modulate soybean salt tolerance by promoting the expression of stress-responsive genes, with GmbZIP110 serving as a representative example [10]. The members of the NAC transcription factor family (NAM, ATAF1/2, and CUC1) share a conserved N-terminal DNA-binding domain. The overexpression of GmNAC11 and GmNAC20 may enhance the salt stress tolerance in soybean via the DREB/CBF-COR-signaling pathway [11]. Salt induction of NAC1 (GmSIN1) promotes its binding to promoter regions, thereby upregulating 9-cis-epoxycarotenoid dioxygenase genes involved in ABA biosynthesis and respiratory burst oxidase homolog B genes (GmRbohBs) associated with ROS production in soybean. GmSIN1, GmNCED3, and GmRbohBs form a positive feedforward system, enabling rapid accumulation of ABA and ROS to effectively amplify the initial salt stress signals. The combined regulation of ABA and ROS levels enhances the salt tolerance in soybean [12]. When exposed to salt stress, the endogenous abscisic acid (ABA) level increases rapidly, activating sucrose non-fermenting 1-related protein kinases (SnRK2s). These kinases phosphorylate ABA-responsive element-binding protein/factor (AREB/ABF) transcription factors, regulating stomatal closure to cope with osmotic stress. Additionally, ABA maintains osmotic homeostasis by regulating the decomposition of starch into sugars and sugar-derived osmolytes. ABA acts in synergy with Ca2+ signaling to promote the Na+ efflux through the SOS3-SOS2-SOS1 pathway while simultaneously activating potassium channels to facilitate a K+ influx, thereby reducing the Na+/K+ ratio. The ABA activates the NADPH oxidase RBOHF, promoting the production of H2O2. As a signaling molecule, H2O2 further activates Ca2+ channels, and there exists complex signaling crosstalk among ABA, reactive oxygen species (ROS), and Ca2+ [13]. Consequently, a systematic investigation of transcription factors will unveil plant-specific mechanisms underlying secondary metabolism, phytohormone responses, and cell-type-specific trait development [14,15,16,17].
The plant-specific PLATZ (plant A/T-rich sequence and zinc-binding) transcription factor family comprises a novel class of zinc-dependent DNA-binding proteins that specifically recognize A/T-rich sequences in plants. Multiple sequence alignments reveal that PLATZ proteins possess two distinct zinc-binding regions essential for DNA binding, characterized by the conserved motifs C-x2-H-x11-C-x2-C-x(4–5)-C-x2-C-x(3–7)-H-x2-H and C-x2-C-x(10–11)-C-x3-C [18]. These DNA-binding proteins recognize and bind to cis-acting elements in promoter regions and modulate multiple biological processes, including DNA replication and transcriptional regulation [19]. Furthermore, their critical roles in plant defense mechanisms and acclimation responses across species have been extensively documented [20,21]. Since the initial discovery of PLATZ1 in pea (Pisum sativum L.), the functional significance of PLATZ transcription factors in plant biology has garnered increasing scientific interest [18].
PLATZ transcription factors play critical roles in modulating growth and developmental processes across diverse plant species. In rice, the plant-specific PLATZ transcription factor GL6 interacts with C53 and C1 to positively regulate grain length by promoting cell proliferation in young panicles and grains [22]. SG6, which is expressed ubiquitously in cells but absent in the endosperm, enhances grain size and weight through its interaction with the DP transcription factor [23]. In maize (Zea mays L.), FL3 (ZmPLATZ12) encodes a PLATZ transcription factor that interacts with RPC53 and TFC1 to regulate endosperm development and storage reserve accumulation [24]. ZmPLATZ2, highly expressed in the endosperm, binds to the promoters of ZmSSI, ZmISA1, and ZmISA2 to upregulate their expression, thereby driving starch synthase activity in maize endosperm [25]. PacBio iso-seq and RNA-seq analyses further demonstrate that PLATZ proteins mediate secondary growth in Populus stems [26]. A comparative transcriptome study of diploid cotton (Gossypium hirsutum L.) fibers from isogenic fuzzy-lintless (Fl) and normal fuzzy-linted (FL) lines revealed a downregulation of PLATZ in Fl lines at 10 days post-flowering compared to FL, highlighting its essential role in cotton fiber development [27]. Similarly, in sugarcane, differential expression of a PLATZ gene between mature and immature tissues of high-fiber genotypes suggests its involvement in transcriptional regulation of secondary cell wall biosynthesis [28]. In Arabidopsis, the PLATZ transcription factor ORESARA15 (ORE15) enhances leaf growth and delays senescence by modulating early cell proliferation dynamics and the GRF/GIF regulatory pathway [29]. Additionally, ABA-INDUCED EXPRESSION 1 (AIN1) regulates root elongation in response to ABA signaling [30]. Recent studies further indicate that ORE15 promotes root meristem enlargement by balancing the auxin–cytokinin signaling crosstalk [31].
Beyond their roles in plant growth and development, PLATZ transcription factors have been increasingly recognized as central regulators of abiotic stress responses. In Arabidopsis, both AtPLATZ1 and AtPLATZ2 have been reported to play positive regulatory roles in the seed desiccation tolerance (DT). Specifically, AtPLATZ1 was confirmed through overexpression in a desiccation-intolerant mutant background to be crucial for seed DT [32], whereas AtPLATZ2 acts as a transcriptional repressor that modulates the Arabidopsis salt-stress response by repressing the expression of CBL4/SOS3 and CBL10/SCaBP8 [33]. PLATZ4 positively regulates plant drought tolerance and ABA sensitivity by binding to A/T-rich sequences in the promoter of PIP2;8 [34]. Additionally, the PhePLATZ1 is upregulated in response to drought treatments in moso bamboo. Heterologous overexpression of PhePLATZ1 in Arabidopsis confers enhanced drought tolerance compared to wild-type plants [35]. Furthermore, drought stress significantly increases the expression of PLATZ1 in maize, indicating that PLATZ genes play a crucial role in drought resistance [36].
Genome-wide characterization of PLATZ gene families has been investigated in multiple plant species, including rice (Oryza sativa L.) [22], maize [24], poplar (Populus L.) [26], cotton [27], sugarcane (Saccharum L.) [28], and Arabidopsis (Arabidopsis thaliana L.) [29]. Despite the global agricultural importance of soybean (Glycine max L.), comprehensive studies on its PLATZ gene family remains limited [37,38]. Nevertheless, various abiotic stresses, such as cold stress, salt stress, hormonal imbalances, and trace element toxicity, significantly impact the soybean productivity throughout its life cycle [39,40,41,42]. Thus, a genome-wide analysis of soybean PLATZ genes would therefore provide crucial insights into their functional mechanisms underlying stress responses.
2. Results
2.1. Identification and Analysis of the GmPLATZ Gene Family in Soybean
Multiple sequence alignment analyses identified 29 PLATZ genes in the soybean genome, which were designated as GmPLATZ1 to GmPLATZ29, in line with their positions on the chromosomes. The lengths of GmPLATZ proteins ranged from 127 to 300 amino acids. The isoelectric points (pI) of these proteins fell within the range of 7.92–9.70, and their theoretical molecular weights (MWs) were between 14.72 and 36.72 kDa (Table S1). Specifically, GmPLATZ13 exhibited the highest MW, whereas GmPLATZ9 had the lowest MW. The theoretical isoelectric point (pI) values of all 29 proteins exceeded 7, which indicated that every protein in the soybean PLATZ family belonged to the category of basic proteins. The predicted subcellular localization of GmPLATZ proteins was predominantly nuclear, except for GmPLATZ5 and GmPLATZ14, which showed dual localization in both chloroplasts and nuclei (Table S1). The 29 GmPLATZ proteins possess two distinct zinc-binding regions essential for DNA binding, characterized by the conserved motifs C-x2-H-x11-C-x2-C-x(4–5)-C-x2-C-x(3–7)-H-x2-H and C-x2-C-x(10–11)-C-x3-C (Figure S1) [18].
The distribution of all the GmPLATZ genes across the fifteen chromosomes of the soybean is irregular. Four GmPLATZ genes were located on chromosome 1 and 11; followed by three genes on chromosome 8 and 9; two genes on chromosome 5, 12, 13, and 15; and one gene on chromosomes 2, 3, 6, 7, 10, 17, and 19. Through a chromosomal location analysis, we determined that chromosomes 4, 14, 16, 18, and 20 do not harbor any genes belonging to the PLATZ family (Figure 1).
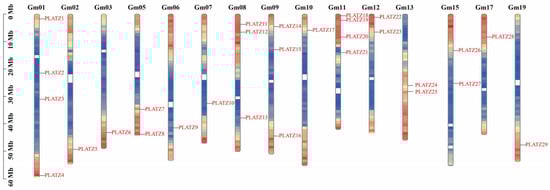
Figure 1.
The distribution of GmPLATZ genes on soybean chromosomes. The vertical bars represent chromosomes.
2.2. Gene Structure and Motif Analysis of GmPLATZ
The differences in gene structure among family members are evident from the varying counts of introns and exons within the same gene family. To examine the structural features of GmPLATZs, the corresponding gene members were identified through a search of the soybean genomic DNA sequences. The exon–intron organization of GmPLATZ genes exhibited variations across subfamilies but remained consistent within each subfamily. As shown in Figure 2B, GmPLATZ6 contains three exons and two introns, while other GmPLATZ genes typically possess four exons and three introns.
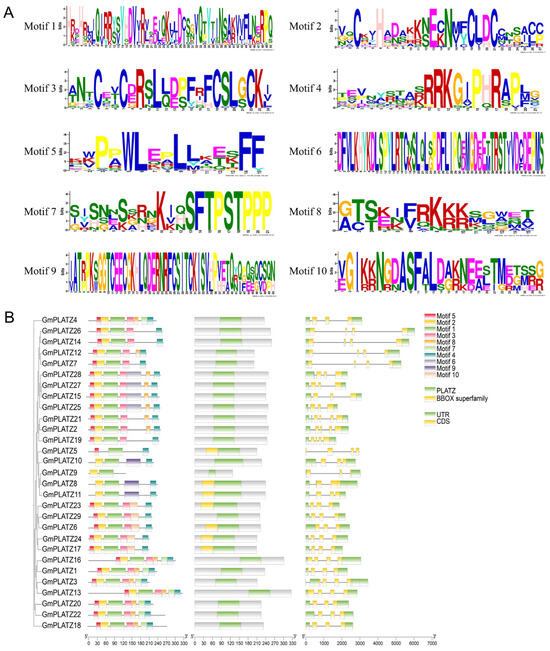
Figure 2.
The gene structures, motif distribution, and conserved domains of GmPLATZs. (A) The motif logo of GmPLATZ proteins. (B) The motif distribution, conserved domains, and gene structure of the GmPLATZ family genes.
Amino acid sequences with high conservation may serve functions similar to those exhibiting a strong sequence similarity or uniformity. An analysis of the conserved motifs in GmPLATZ proteins revealed that members within the same subfamily shared highly comparable motif patterns. Using the MEME web tool, we detected 10 conserved motifs among GmPLATZ family members, with a subsequent analysis revealing significant conservation across these motifs (Figure 2A). All GmPLATZ proteins contain the conserved motifs 1 and 4, with motif 1 serving as the zinc-finger protein-binding site. Additionally, most members possess motifs 2, 3, and 5 (Figure 2B, Table S2). Notably, GmPLATZ8-11 form a distinct subfamily characterized by the absence of a second zinc-finger protein-binding site (Figure S1). These findings indicate evolutionary conservation among GmPLATZ proteins, potentially reflecting functional similarity.
2.3. Phylogenetic Tree Analysis of PLATZ Gene Family in Soybean
To elucidate the evolutionary relationships of GmPLATZ genes, we constructed a phylogenetic tree comprising 41 PLATZ family members, including 12 from Arabidopsis thaliana (Table S3) and 29 from soybean. AtPLATZ genes can be classified into five subgroups, whereas GmPLATZ genes are grouped into four subgroups. Subfamily II is the largest in GmPLATZs, comprising 11 genes, while subfamily III exclusively contains AtPLATZ9 and lacks any GmPLATZ genes (Figure 3). The phylogenetic tree suggests that GmPLATZs in the same group share conserved features, facilitating structure–function predictions in soybean based on the characterized model plant AtPLATZs. The GmPLATZ family has a larger number of members compared to that in Arabidopsis thaliana. This difference might be attributed to multiple rounds of gene replication events that occurred during the evolutionary process.
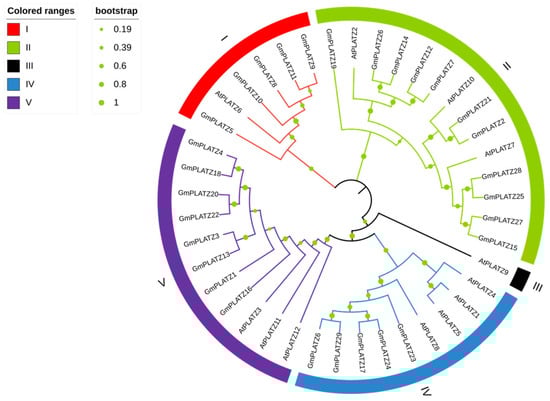
Figure 3.
Phylogenetic analysis of PLATZ proteins in Arabidopsis thaliana and Glycine max. The sequences of proteins from Arabidopsis thaliana (At) and Glycine max (Gm) were analyzed and aligned using MEGA_X_10.1.7. The labels ranging from I to V signify the five distinct subfamilies identified within the tree.
Gene duplication, which includes whole-genome duplication (WGD), tandem duplication, and segmental duplication, represents a fundamental evolutionary mechanism driving genomic diversification in plants. To investigate the expansion mechanism of the GmPLATZ gene family members in soybean, we performed an intra-genomic collinearity analysis. As shown in Figure 4A and Table S4, no tandem duplication events were detected among GmPLATZ genes. In contrast, 32 segmental duplication event pairs were identified. These results indicate that segmental duplication events, rather than tandem duplication, have been the predominant driver of the GmPLATZ family expansion. To further elucidate evolutionary relationships, we conducted a cross-species synteny analyses between soybean and two related species. A genome-wide comparison revealed 14 orthologous gene pairs between Glycine max (cultivated soybean) and Arabidopsis thaliana (Figure 4B, Table S5). Notably, this number increased substantially to 90 syntenic pairs when comparing Glycine max with its wild progenitor Glycine soja (Figure 4C, Table S6). This pronounced difference likely reflects genomic modifications occurring during soybean domestication and subsequent selection processes.
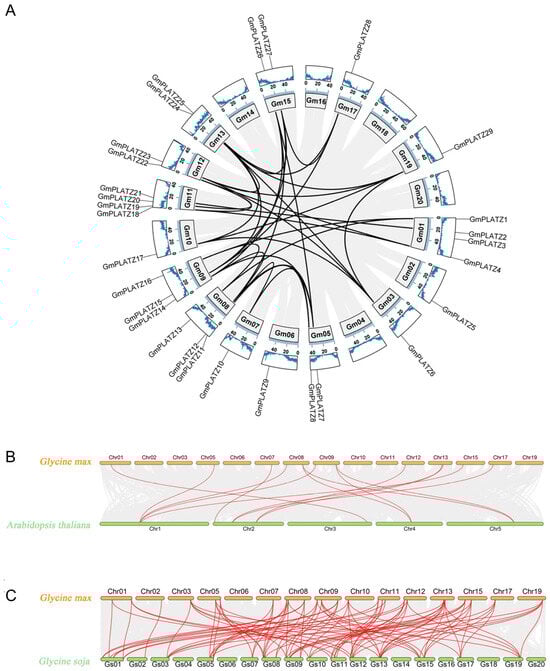
Figure 4.
Evolutionary conservation of GmPLATZ gene organization across chromosomes. (A) The chromosomal distribution and synteny of GmPLATZs show (1) GC content, (2) soybean chromosomes, and (3) syntenic bloc. (B,C) The synteny of PLATZ genes was analyzed, respectively, for the combinations of Glycine max–Arabidopsis thaliana and Glycine max–Glycine soja. Specifically, red lines were applied to mark and make prominent the syntenic PLATZ gene pairs between soybean and the other species.
Next, we employed TBtools software (version 2.225) to calculate the Ka/Ks ratios for gene pairs. The Ka/Ks ratios of Arabidopsis thaliana and Glycine max were all less than 1 (Table S5), while for Glycine max and Glycine soja, only one ratio was equal to 1, with the rest being less than 1 (Table S6). This suggests that GmPLATZ probably has undergone a purifying selection pressure through the evolution of soybean.
2.4. Cis-Acting Element Analysis of Promoters in GmPLATZs
In order to analyze diverse Cis-regulatory elements in the GmPLATZs promoter, we obtained the 2000 bp upstream sequences of each GmPLATZs gene. Subsequently, we carried out the visualization of these Cis-regulatory elements to analyze their characteristics. Within the GmPLATZs promoter regions, a total of 17 conserved elements were identified (Figure 5 and Table S7). Among the findings were responsiveness to light and hormones, stress and defense, and seed-specific regulatory elements, along with other types of elements. All GmPLATZ genes contain light-responsive elements, with most members additionally possessing drought-inducible and abscisic acid (ABA)-responsive elements, suggesting their potential functional roles in salt stress responses. Notably, the GmPLATZ family exhibits the highest abundance of light-responsive regulatory elements, along with substantial numbers of elements associated with ABA and methyl jasmonate (MeJA) responses (Figure 6). These findings suggest that the expression of GmPLATZs may be controlled by a variety of elements. Additionally, it is further indicated that GmPLATZs may play vital roles in soybean normal growth, development, and adaptation to environmental stresses.
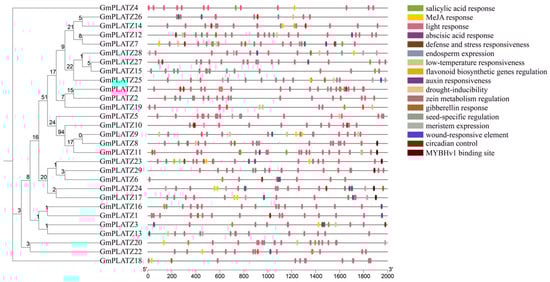
Figure 5.
Cis-element analysis of GmPLATZ family gene promoters. Left panel: the phylogenetic relationships among GmPLATZ family members. Right panel: the promoter Cis-elements of GmPLATZ genes were analyzed in their 2000 bp upstream regions, with various elements high-lighted in color.
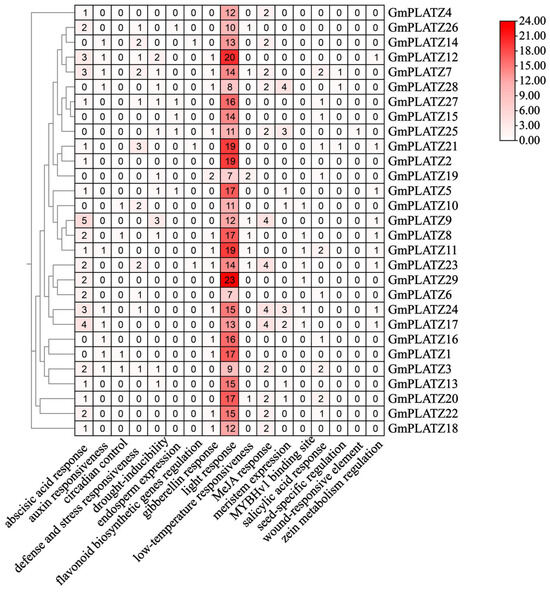
Figure 6.
The cluster heatmap displays the number of cis-elements in different genes. Darker shades represent higher counts of specific elements in GmPLATZs.
2.5. Expression Analysis of GmPLATZs in Different Tissues of Soybean
To investigate the tissue-specific expression of GmPLATZ genes in soybean, transcriptome data were collected from the Soybean Expression Atlas database (Table S8), and the expression patterns were visualized in a heatmap (Figure 7A). Among the 29 GmPLATZ genes, 28 were detected in the transcriptome datasets, while only GmPLATZ13 was not detected. The results showed that GmPLATZ6 was highly expressed in flowers, pods, shoots, and leaves. However, other individual genes exhibited a tissue-specific distinct expression pattern. For instance, among the GmPLATZ family genes, GmPLATZ1, GmPLATZ9, GmPLATZ10, GmPLATZ11, GmPLATZ15, GmPLATZ16, GmPLATZ17, GmPLATZ18, GmPLATZ19, GmPLATZ23, GmPLATZ24, GmPLATZ25, GmPLATZ27, and GmPLATZ28 showed the highest expression in roots, while GmPLATZ2, GmPLATZ8, GmPLATZ14, and GmPLATZ21 were predominantly expressed in flowers. Similarly, GmPLATZ4, GmPLATZ20, and GmPLATZ22 exhibited peak expression in shoots, whereas GmPLATZ3 and GmPLATZ2 displayed extremely high expression in seeds. Additionally, GmPLATZ7, GmPLATZ12, and GmPLATZ26 were most strongly induced in cotyledons, and GmPLATZ5 reached its maximum expression in pods. These results suggest that the functional diversification of GmPLATZ genes exist in tissue-specific biological processes across the soybean.
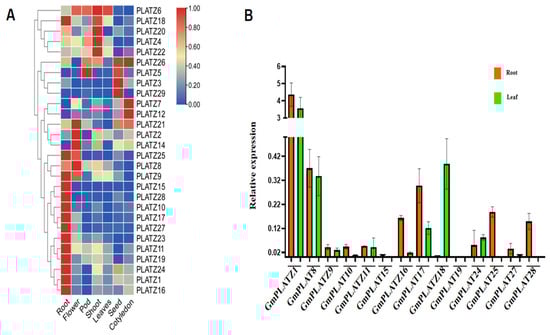
Figure 7.
The transcriptome expression levels of the GmPLATZ gene family in different organs. (A) Heatmap of GmPLATZ genes expression in the root, flower, pod, shoot, leaves, seed, and cotyledon represented by a color gradient from blue to red, indicating low to high expression levels. (B) The expression levels of GmPLATZ genes between root and leaf tissues. Statistical analyses were performed using a one-way analysis of variance (ANOVA), followed by a Duncan’s multiple range test (p < 0.05, n = 3).
To validate the GmPLATZ expression database, total RNA was extracted from both roots and leaves, followed by RT-qPCR analysis to examine the expression levels of 14 selected GmPLATZ genes (Figure 7B). The results showed that GmPLATZ1, GmPLATZ10, GmPLATZ15, GmPLATZ16, GmPLATZ17, GmPLATZ25, and GmPLATZ28 were significantly upregulated in roots compared to leaves, consistent with the database. In contrast, GmPLATZ18 exhibited the higher expression in leaves, while GmPLATZ8, GmPLATZ9, GmPLATZ11, GmPLATZ19, GmPLATZ24, and GmPLATZ27 displayed similar expression levels in both tissues.
2.6. Expression of GmPLATZ Genes Under Salt Stress
To examine the expression profiles of GmPLATZ genes under salt stress, soybean roots and leaves were harvested at selected time points (0 h, 6 h, 12 h, and 24 h) following salt treatment (200 mM NaCl), and the transcript levels of 14 GmPLATZ genes were analyzed through RT-qPCR (Figure 8). The 200 mM NaCl treatment, as a severe salt stress condition, enables faster and more intuitive observation of gene responses to salt stress [43]. The expression profiles of GmPLATZ genes exhibited distinct temporal and tissue-specific patterns under salt stress conditions. GmPLATZ8 and GmPLATZ9 demonstrated minimal basal expression in both leaves and roots at 0 h, reaching peak transcript levels at 12 h before declining to lower levels by 24 h. In contrast, GmPLATZ19 showed differential regulation between tissues, maintaining a low initial expression in both tissues at 0 h but displaying a sustained upregulation in roots that peaked at 24 h while showing a transient leaf-specific expression detectable only at 12 h. A delayed response pattern was observed for GmPLATZ25, GmPLATZ27, and GmPLATZ28 in leaf tissues, with maximal induction occurring at 12 h post-treatment followed by a significant downregulation at 24 h. Notably, five GmPLATZ family members (GmPLATZ1, GmPLATZ10, GmPLATZ16, GmPLATZ18, and GmPLATZ24) maintained constitutive expression throughout all root developmental stages examined, demonstrating significant upregulations either at 12 h or 24 h post-treatment. The salt stress induced divergent regulatory responses in leaf-expressed genes. Three members (GmPLATZ1, GmPLATZ16, and GmPLATZ17) exhibited their maximum transcript accumulation at 0 h, followed by a progressive downregulation over the treatment period. Similarly, in root tissues, GmPLATZ11 and GmPLATZ17 displayed analogous suppression patterns, with peak expression at initial time points preceding gradual transcriptional attenuation.
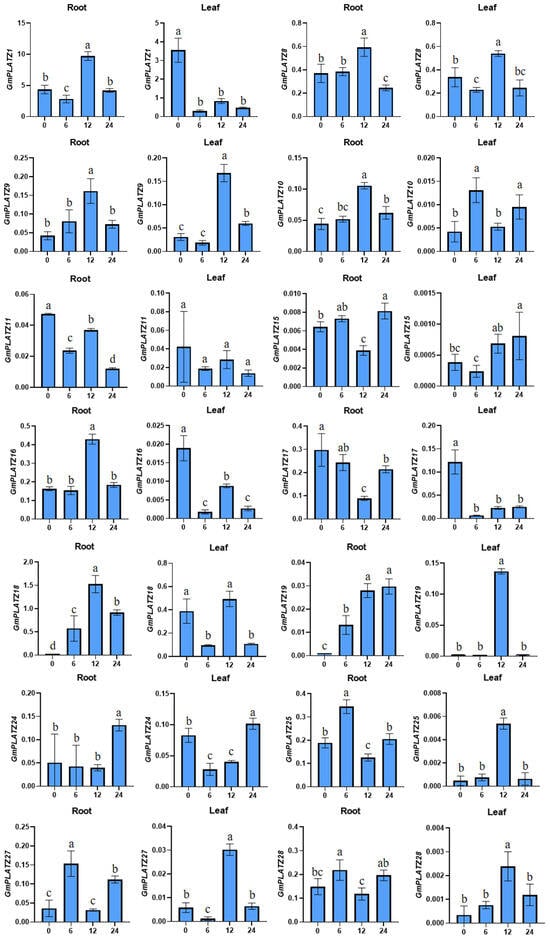
Figure 8.
The RT-qPCR analysis was performed to examine the expression of 14 GmPLATZ genes in roots and leaves under salt stress. Expression data were normalized to the Cons4 reference gene, with error bars representing standard deviations (SDs). Statistical analyses were performed using one-way analysis of variance (ANOVA), followed by the Duncan’s multiple range test (p < 0.05, n = 3). Significant differences among groups are denoted by distinct lowercase letters.
3. Discussion
In recent years, the rapid development of bioinformatics has provided the necessary tools for in-depth exploration of plant growth and development, as well as the identification of stress-resistance genes. Analyzing gene families represents an efficient research strategy to study the evolution, structure, and function of genes. For example, the PLATZ gene family has been identified in various crops and vegetables, such as tomato (Solanum lycopersicum) [44] and barley (Hordeum vulgare) [45], with studies demonstrating its association with abiotic stress responses. Previous studies have reported the phylogenetic tree analysis of the soybean PLATZ family. In one of these studies, the author employed the Glycine max Wm82.a2.v1 database and identified 31 genes belonging to the soybean PLATZ family [46]. In contrast, our current research, which involved analyzing the Glycine max Wm82.a6.v1 database, revealed 29 genes within the soybean PLATZ family. This difference from previous findings is likely due to the presence of pseudo genes among certain genes in the older database. However, systematic characterization of the PLATZ gene family in soybean (Glycine max) remains unreported. Through genome-wide identification, 29 GmPLATZ genes were systematically identified in the soybean genome. The soybean PLATZ family exhibits significant expansion compared to related species, containing approximately 2.6-fold more members than tomato [44] and 2.1-fold more than barley [45]. This expansion could be attributed to the larger genome size of soybean (1.1 Gb) versus tomato (900 Mb) and barley (5.1 Gb), suggesting potential whole-genome duplication events driving GmPLATZ diversification. Chromosomal mapping revealed uneven distribution patterns: GmPLATZ genes were absent from five chromosomes (Chr04, Chr14, Chr16, Chr18, and Chr20) while clustering predominantly on chromosomes 1 (4 genes) and 11 (4 genes), indicating possible evolutionary hotspots.
Genes acquire functional diversity through conserved protein domains and exon–intron architectures, which govern their molecular functions [47,48]. While exons directly encode protein sequences, introns—traditionally considered non-coding regions—undergo splicing and degradation during RNA processing. Notably, emerging studies reveal that introns serve as evolutionary drivers in plants, facilitating functional innovation through multiple mechanisms, such as alternative splicing regulation and transposable element insertion [49,50]. To investigate the evolutionary relationships of the GmPLATZ gene family, a comprehensive analysis of conserved domains and exon–intron architectures was conducted [51,52,53]. The analysis revealed that all GmPLATZ members contain three–five exons, with the majority exhibiting four exons. Most GmPLATZ genes harbor three introns, while a small subset possess two or five introns. Intron loss is closely associated with biological evolution [54]. Typically, intron numbers remain conserved within subfamilies, and variations across genes may arise from insertion/deletion (indel) events. Introns regulate gene expression through both positive and negative mechanisms, which may confer evolutionary advantages. Consequently, the functional diversity of GmPLATZ genes could be influenced by conserved and variable structural features [55].
Notably, an in-depth analysis of GmPLATZ proteins revealed that each member harbors a characteristic B-box zinc-binding domain, which is a hallmark feature of both the PLATZ and BBOX superfamilies (Figure 2). Phylogenetic tree construction and subsequent cladistic analysis demonstrated that the PLATZ family can be distinctly categorized into five well-defined subfamilies. This structural diversity strongly implies the occurrence of historical gene duplication events, or alternatively, convergent evolutionary processes that have shaped the current composition of the PLATZ gene family. Furthermore, a comparative phylogenetic examination of GmPLATZs and AtPLATZs unveiled a conserved distribution pattern within specific evolutionary clades, indicative of shared ancestral origins. Conversely, marked divergence in distribution patterns was observed across different clades (Figure 3), suggesting the influence of lineage-specific evolutionary forces on the diversification of these gene families.
The unequal distribution of genes within the GmPLATZ family is strongly associated with segmental duplication events in soybean. Our analysis identified 32 pairs of segmental duplication events, whereas no tandem duplication events were detected. Segmental duplication, a prevalent phenomenon in plant genome evolution, is often linked to WGD events, which are thought to drive functional diversification of gene families and enhance plant adaptability to abiotic stresses. Further collinearity analyses across Glycine max–Glycine soja and Glycine max–Arabidopsis thaliana genomes revealed striking evolutionary conservation of GmPLATZ genes, particularly between soybean species. This conservation likely reflects the indispensable role of PLATZ family genes in abiotic stress responses during evolution, prompting their retention in closely related genomes. In contrast, significant divergence and potential gene loss were observed in distantly related Arabidopsis, presumably due to adaptive evolution under distinct environmental pressures. Regarding the selection pressure analysis, the ratio of nonsynonymous (Ka) to synonymous (Ks) substitutions (Ka/Ks) serves as a critical evolutionary metric: values > 1 indicate positive selection driving adaptive evolution or functional innovation, while Ka/Ks < 1 signifies purifying selection favoring conservation of the protein function by eliminating deleterious nonsynonymous mutations [56]. Notably, all 32 GmPLATZ gene pairs in this study exhibited Ka/Ks ratios < 1, providing strong evidence for an intense purifying selection during soybean evolution. This evolutionary constraint likely facilitated the maintenance of critical stress-responsive functions, thereby enhancing soybean adaptability to diverse environmental fluctuations.
Cis-acting regulatory elements are essential for gene expression patterns that are specific to tissues or responsive to stress, functioning as molecular switches to fine-tune plant physiological processes during adverse conditions and thereby enhancing adaptive responses to environmental stresses [57]. Promoter sequence analysis of GmPLATZ genes revealed that the majority harbor Cis-elements associated with pathogen defense and general stress responses, strongly indicating their active involvement in abiotic and biotic stress tolerance mechanisms. Furthermore, the identification of hormone-responsive Cis-elements—including those for salicylic acid, abscisic acid, and jasmonic acid—within GmPLATZ promoter regions underscores potential integration with plant hormonal signaling networks. These findings suggest that GmPLATZ genes may exert their stress-mitigating functions by responding to multiple hormonal cues, enabling coordinated regulation of stress-responsive pathways of adaptation.
The association between the PLATZ gene family and plant salt tolerance has been sporadically reported. In Arabidopsis thaliana, AtPLATZ2 acts as a transcriptional repressor to regulate the salt stress response by inhibiting the expression of CBL4/SOS3 and CBL10/scasp8. In cotton, GhiPLATZ17 and GhiPLATZ22 play critical roles in enhancing the salt tolerance of Gossypium hirsutum. However, reports in soybean remain remarkably limited [58]. In this study, RNA-seq datasets from the Soybean Expression Atlas were mined to characterize transcript abundance across diverse tissues. Comparative analysis revealed divergent tissue-specific expression patterns among GmPLATZ family members: some genes exhibited constitutive expression across all tissues, while others displayed tissue-restricted expression or undetectable transcription, potentially reflecting functional divergence or redundancy within the PLATZ gene family (Figure 7). To validate the RNA-seq results, RT-qPCR analyses were performed on 14 GmPLATZ genes that showed induced expression in both leaves and roots. Under salt stress conditions, distinct expression profiles were observed between leaves and roots: GmPLATZ9, GmPLATZ25, GmPLATZ27, and GmPLATZ28 exhibited significant upregulation in leaves, whereas GmPLATZ8, GmPLATZ10, GmPLATZ16, GmPLATZ18, GmPLATZ19, and GmPLATZ24 were markedly induced in roots. Conversely, GmPLATZ1, GmPLATZ11, GmPLATZ16, and GmPLATZ17 showed significant downregulation in leaves, with GmPLATZ11 and GmPLATZ17 also demonstrating reduced expression in roots (Figure 8). These differential responses strongly suggest functional involvement of GmPLATZ genes in salt stress adaptation. Given the limited current understanding of PLATZ gene functions in soybean, further investigations integrating molecular biology techniques and transgenic approaches are essential to characterize their biological roles. Additionally, conducting further explorations of their regulatory mechanisms under salt stress will supply critical genetic resources and groundbreaking strategies for breeding salt-tolerant soybean varieties.
4. Materials and Methods
4.1. Authentication of Candidate GmPLATZ Genes in Soybean
The hidden Markov model of the soybean B-box zinc-binding domain was retrieved from the Pfam database (https://www.ebi.ac.uk/interpro/entry/pfam/, accessed on 25 January 2025) [59]. The TBtools software was used to screen for soybean gene proteins containing the B-box zinc-binding domain, which were subsequently named PLATZ proteins [60]. Multiple alignments of the GmPLATZ gene sequences and protein sequences with the PLATZ gene family in Arabidopsis thaliana were performed to further identify the GmPLATZ family. The physicochemical properties of the GmPLATZ family proteins were predicted using the ExPASy website (https://web.expasy.org/protparam/, accessed on 25 January 2025) [61], and the corresponding subcellular localization was analyzed using the Cell-PLoc 2.0 website (available at http://www.csbio.sjtu.edu.cn/bioinf/Cell-PLoc-2/, accessed on 25 January 2025) [62].
4.2. Characterization of Chromosomal Location, Conserved Domain, and Structure Distribution of GmPLATZs
The positions of exons and introns of GmPLATZ genes were identified on the Phytozome website (https://phytozome-next.jgi.doe.gov/, accessed on 25 January 2025), utilizing the Glycine max Wm82.a6.v1 version. Subsequently, two online resources, NCBI [63] and MEME [64], were employed to analyze the domains and conserved motifs of the GmPLATZ proteins. Finally, the chromosomal structures, locations, motifs, and conserved domains were visualized as images using the TBtools software [65].
4.3. Phylogenetic Classification and Analysis
The phylogenetic analysis was conducted using the PLATZ protein sequences from Arabidopsis and soybean. With the MEGA_X_10.1.7 program, multiple alignment analyses and the construction of a phylogenetic tree were carried out. This process adopted the default parameters, specifically applying the neighbor-joining method and incorporating 1000 bootstrap iterations.
4.4. GmPLATZ Gene Synteny Analyses and Duplication
Tandem and segmental duplication events of GmPLATZ in the soybean genome were analyzed using TBtools with the GFF (General Feature Format) file. The Dual Synteny Plotter module was then employed to examine the homology between Arabidopsis thaliana and soybean, as well as between Glycine soja and soybean. Additionally, the non-synonymous substitution (Ka), synonymous substitution (Ks), and Ka/Ks ratio were calculated [65].
4.5. Promoter Cis-Regulatory Elements Analysis of GmPLATZs
The 2000 bp upstream sequences of the GmPLATZ genes were extracted from the Phytozome (https://phytozome-next.jgi.doe.gov/, accessed on 25 January 2025) website. Corresponding cis-acting elements were then identified using the PlantCARE database (http://bioinformatics.psb.ugent.be/webtools/plantcare/html/, accessed on 25 January 2025) [66], followed by visualization of the cis-regulatory elements in GmPLATZ promoters through TBtools software [65].
4.6. Expression Pattern Analysis of GmPLATZ Gene Family in Tissues
To explore the expression patterns of GmPLATZ genes, transcriptional levels of GmPLATZ gene members across different tissues were obtained, which was achieved by querying the Soybean Expression Atlas (https://soyatlas.venanciogroup.uenf.br, accessed on 7 January 2025). The Atlas offers high-resolution gene expression data from a wide range of fourteen tissues, including cotyledon, shoot, leaf, root, flower, seed, and pod, during the whole developmental stage of soybean [67]. Subsequently, the TBtools software [65] was utilized to generate a tissue expression heatmap for visualization.
The response of GmPLATZs to external stimuli was investigated using online transcriptome data. Specifically, the study analyzed GmPLATZ gene expression patterns in roots and leaves of Williams 82 soybean seedlings.
4.7. RNA Extraction and Reverse-Transcription Quantitative PCR (RT-qPCR) Analysis
Soybean cultivar Williams 82 seedlings were subjected to two treatments: normal water and 200 mM NaCl. The Williams 82 seeds were provided by the Hybrid Soybean Team of Jilin Academy of Agricultural Sciences. The seeds were first rinsed with tap water to remove surface debris, followed by sterilization via immersion in a 0.1% sodium hypochlorite solution for 5 min. After three rinses with distilled water, the seeds were sown in vermiculite and placed in a Conviron incubator set at 25 °C with 60% humidity under a 16 h light/8 h dark photoperiod. Upon reaching the V1 growth stage, the plants were subjected to salt solution treatment. Samples were collected at 0, 6, and 12 h after treatment. For both the control (normal water) and treatment (200 mM NaCl) groups, roots and leaves were harvested, with three biological replicates each. Immediately after collection, the samples were rapidly frozen in liquid nitrogen to preserve their integrity, which is essential for total RNA isolation. The RNA extraction process adhered strictly to the guidelines provided with the EasyPure Plant RNA Kit (Cwbio, Beijing, China). After obtaining the RNA, 1 µg of it was used for reverse transcription. This step was carried out using a TransScript All-in-One First-Strand cDNA Synthesis SuperMix for qPCR (Trans, Beijing, China), enabling the conversion of RNA into complementary DNA suitable for subsequent quantitative real-time PCR analysis. The expression levels of GmPLATZ1, GmPLATZ8, GmPLATZ9, GmPLATZ10, GmPLATZ11, GmPLATZ15, GmPLATZ16, GmPLATZ17, GmPLATZ18, GmPLATZ19, GmPLATZ24, GmPLATZ25, GmPLATZ27, and GmPLATZ28 were detected via the RT-qPCR. The RT-qPCR was performed using 2 × SYBR Green qPCR Mix kit (Trans, Beijing, China) on the applied biological systems by Thermo Fisher Scientific (Quant Studio Laboratories, Hercules, CA, USA). For SYBR Green-based amplification, Perfect Start Green qPCR Super Mix was utilized. The 10-μL reaction system consisted of 5 μL of Perfect Start Green qPCR Super Mix, 0.2 μL of forward primer, 0.2 μL of reverse primer, 100 ng of cDNA, and nuclease-free water to adjust the volume to 10 μL. The two-step qRT-PCR conditions were as follows: pre-denaturation: 95 °C for 30 s (1 cycle); denaturation and annealing–extension: 95 °C for 15 s, 60 °C for 1 min (40 cycles); melting-curve analysis: 95 °C for 15 s, followed by 60 °C for 1 min and 95 °C for 1 s (1 cycle each). Cons4 (BU578186) was used as the reference gene, and its specific primers are listed in Table S9. The relative expression levels were calculated using the method established by Livak and Schmittgen.
4.8. Statitical Analysis
In this study, a Student’s t-test in Graphpad Prism 8 (Version 8.0, Motulsky, San Diego, CA, USA) was used to analyze the differences between the different treatments. A p-value cut-off of 0.05 was considered as statistical significance. All the error bars were standard errors (SEs).
5. Conclusions
In this study, we systematically identified 29 GmPLATZ genes in the soybean genome and conducted comprehensive characterization of this family’s genes. Integrated analyses of gene structure, protein physicochemical properties, and conserved domains revealed that members within the same subfamily exhibited similar structural features. Phylogenetic and synteny analyses demonstrated that segmental duplication played a major role in the expansion of GmPLATZ genes during soybean genome evolution. Most GmPLATZ genes within the same subfamily contained identical cis-regulatory elements and conserved motifs in their promoter regions, particularly those associated with salt stress responses. However, certain discrepancies were observed, suggesting potential functional diversification among GmPLATZ members. Tissue-specific expression patterns indicated that these genes might play distinct regulatory roles in soybean growth and development. Notably, 14 GmPLATZ genes showed differential expression patterns in response to salt stress, and among the 14 GmPLATZ genes, the GmPLATZ18 and GmPLATZ19 genes are significantly regulated by salt stress in soybean roots, implying their potential key roles in salt tolerance. Further in-depth functional exploration of these two genes could be conducted in the next step. Functional characterization of GmPLATZ genes could significantly contribute to improving the soybean yield and stress resistance, offering potential targets for molecular breeding strategies.
Supplementary Materials
The following supporting information can be downloaded at https://www.mdpi.com/article/10.3390/plants14132004/s1: Table S1: List of the identified GmPLATZ genes and their related information in soybean; Table S2: Analyses the motifs in GmPLATZ from the MEME website; Table S3: AtPLATZ genes in Arabidopsis thaliana; Table S4: Tandemly and segmentally duplicated GmPLATZ gene pairs; Table S5: One-to-one orthologous relationships between the PLATZ gene members in Glycine max and Arabidopsis thaliana; Table S6: One-to-one orthologous relationships between the PLATZ gene members in Glycine max and Glycine soja; Table S7: Cis-element analyses of the GmPLATZ gene promoter regions; Table S8: Expression profiles of GmPLATZ genes in multiple tissues throughout various developmental stages; Table S9: Primers used in this study for RT-qPCR; Figure S1: Amino acid sequence alignment of the 29 GmPLATZ proteins; Figure S2: The treatment with 200 mM NaCl solution for Williams 82.
Author Contributions
M.W., M.S. and C.Z. conceived and designed the manuscript. Z.G., S.W., J.Z., C.L. and Y.S. performed formal analysis and validation. M.W. wrote the manuscript. M.S. and C.Z. critically revised the manuscript. All authors have read and agreed to the published version of the manuscript.
Funding
This research was funded by Jilin Province Science and Technology Development Plan Project (20240101214JC), the National Natural Science Foundation of China (32160069), the earmarked Fund for China Agriculture Research System (CARS-04), and Jilin Province Agricultural Science and Technology Innovation Project (CXGC2024RCY029).
Data Availability Statement
All data are contained within the article.
Conflicts of Interest
The authors declare no conflicts of interest.
Abbreviations
The following abbreviations are used in this manuscript:
| NF-Y | Nuclear Factor Y |
| MYB | Myeloblastosis |
| GRF | Growth-Regulating Factor |
| AP2 | APETALA2 |
References
- Singh, A. Soil salinity: A global threat to sustainable development. Soil Use Manag. 2022, 38, 39–67. [Google Scholar] [CrossRef]
- Navrot, N.; Rouhier, N.; Gelhaye, E.; Jacquot, J.-P. Reactive oxygen species generation and antioxidant systems in plant mitochondria. Physiol. Plant. 2007, 129, 185–195. [Google Scholar] [CrossRef]
- Abel, G.H. Inheritance of the Capacity for Chloride Inclusion and Chloride Exclusion by Soybeans. Crop Sci. 1969, 9, 697–698. [Google Scholar] [CrossRef]
- Qiu, Q.S.; Guo, Y.; Dietrich, M.A.; Schumaker, K.S.; Zhu, J.K. Regulation of SOS1, a plasma membrane Na+/H+ exchanger in Arabidopsis thaliana, by SOS2 and SOS3. Proc. Natl. Acad. Sci. USA 2002, 99, 8436–8441. [Google Scholar] [CrossRef]
- Lu, K.-K.; Yang, H.; Liao, C.-Y.; Song, R.-F.; Hu, X.-Y.; Ren, F.; Liu, W.-C. A transcriptional recognition site within SOS1 coding region controls salt tolerance in Arabidopsis. Dev. Cell 2025, 60, 1–17. [Google Scholar] [CrossRef]
- Samad, A.F.A.; Sajad, M.; Nazaruddin, N.; Fauzi, I.A.; Murad, A.M.A.; Zainal, Z.; Ismail, I. MicroRNA and Transcription Factor: Key Players in Plant Regulatory Network. Front. Plant Sci. 2017, 8, 565. [Google Scholar] [CrossRef]
- Brkljacic, J.; Grotewold, E. Combinatorial control of plant gene expression. Biochim. Biophys. Acta Gene Regul. Mech. 2017, 1860, 31–40. [Google Scholar] [CrossRef]
- Shi, W.Y.; Du, Y.T.; Ma, J.; Min, D.H.; Jin, L.G.; Chen, J.; Chen, M.; Zhou, Y.B.; Ma, Y.Z.; Xu, Z.S.; et al. The WRKY Transcription Factor GmWRKY12 Confers Drought and Salt Tolerance in Soybean. Int. J. Mol. Sci. 2018, 19, 4087. [Google Scholar] [CrossRef]
- Xu, Z.; Raza, Q.; Xu, L.; He, X.; Huang, Y.; Yi, J.; Zhang, D.; Shao, H.B.; Ma, H.; Ali, Z. GmWRKY49, a Salt-Responsive Nuclear Protein, Improved Root Length and Governed Better Salinity Tolerance in Transgenic Arabidopsis. Front. Plant Sci. 2018, 9, 809. [Google Scholar] [CrossRef]
- Xu, Z.; Ali, Z.; Xu, L.; He, X.; Huang, Y.; Yi, J.; Shao, H.; Ma, H.; Zhang, D. The nuclear protein GmbZIP110 has transcription activation activity and plays important roles in the response to salinity stress in soybean. Sci. Rep. 2016, 6, 20366. [Google Scholar] [CrossRef]
- Hao, Y.-J.; Wei, W.; Song, Q.-X.; Chen, H.-W.; Zhang, Y.-Q.; Wang, F.; Zou, H.-F.; Lei, G.; Tian, A.-G.; Zhang, W.-K.; et al. Soybean NAC transcription factors promote abiotic stress tolerance and lateral root formation in transgenic plants. Plant J. 2011, 68, 302–313. [Google Scholar] [CrossRef] [PubMed]
- Li, S.; Wang, N.; Ji, D.; Zhang, W.; Wang, Y.; Yu, Y.; Zhao, S.; Lyu, M.; You, J.; Zhang, Y.; et al. A GmSIN1/GmNCED3s/GmRbohBs Feed-Forward Loop Acts as a Signal Amplifier That Regulates Root Growth in Soybean Exposed to Salt Stress. Plant Cell 2019, 31, 2107–2130. [Google Scholar] [CrossRef] [PubMed]
- Yu, Z.; Duan, X.; Luo, L.; Dai, S.; Ding, Z.; Xia, G. How Plant Hormones Mediate Salt Stress Responses. Trends Plant Sci. 2020, 25, 1117–1130. [Google Scholar] [CrossRef] [PubMed]
- Eulgem, T.; Rushton, P.J.; Robatzek, S.; Somssich, I.E. The WRKY superfamily of plant transcription factors. Trends Plant Sci. 2000, 5, 199–206. [Google Scholar] [CrossRef]
- Kizis, D.; Lumbreras, V.; Pages, M. Role of AP2/EREBP transcription factors in gene regulation during abiotic stress. FEBS Lett. 2001, 498, 187–189. [Google Scholar] [CrossRef]
- Naeem, M.; Shahzad, K.; Saqib, S.; Shahzad, A.; Nasrullah; Younas, M.; Afridi, M.I. The Solanum melongena COP1LIKE manipulates fruit ripening and flowering time in tomato (Solanum lycopersicum). Plant Growth Regul. 2022, 96, 369–382. [Google Scholar] [CrossRef]
- Olsen, A.N.; Ernst, H.A.; Leggio, L.L.; Skriver, K. NAC transcription factors: Structurally distinct, functionally diverse. Trends Plant Sci. 2005, 10, 79–87. [Google Scholar] [CrossRef]
- Nagano, Y.; Furuhashi, H.; Inaba, T.; Sasaki, Y. A novel class of plant-specific zinc-dependent DNA-binding protein that binds to A/T-rich DNA sequences. Nucleic Acids Res. 2001, 29, 4097–4105. [Google Scholar] [CrossRef]
- Fu, Y.; Cheng, M.; Li, M.; Guo, X.; Wu, Y.; Wang, J. Identification and Characterization of PLATZ Transcription Factors in Wheat. Int. J. Mol. Sci. 2020, 21, 8934. [Google Scholar] [CrossRef]
- Ciftci-Yilmaz, S.; Mittler, R. The zinc finger network of plants. Cell Mol. Life Sci. 2008, 65, 1150–1160. [Google Scholar] [CrossRef]
- He, X.; Liu, M.; Fang, Z.; Ma, D.; Zhou, Y.; Yin, J. Genome-wide Analysis of a Plant AT-rich Sequence and Zinc-binding Protein (PLATZ) in Triticum Aestivum. Phyton-Int. J. Exp. Bot. 2021, 90, 971–986. [Google Scholar] [CrossRef]
- Wang, A.; Hou, Q.; Si, L.; Huang, X.; Luo, J.-h.; Lu, D.; Zhu, J.; Shangguan, Y.; Miao, J.; Xie, Y.; et al. The PLATZ Transcription Factor GL6 Affects Grain Length and Number in Rice. Plant Physiol. 2019, 180, 2077–2090. [Google Scholar] [CrossRef] [PubMed]
- Zhou, S.-R.; Xue, H.-W. The rice PLATZ protein SHORT GRAIN6 determines grain size by regulating spikelet hull cell division. J. Integr. Plant Biol. 2020, 62, 847–864. [Google Scholar] [CrossRef] [PubMed]
- Li, Q.; Wang, J.; Ye, J.; Zheng, X.; Xiang, X.; Li, C.; Fu, M.; Wang, Q.; Zhang, Z.; Wu, Y. The Maize Imprinted Gene Floury3 Encodes a PLATZ Protein Required for tRNA and 5S rRNA Transcription through Interaction with RNA Polymerase III. Plant Cell 2017, 29, 2661–2675. [Google Scholar] [CrossRef]
- Li, H.; Wang, Y.; Xiao, Q.; Luo, L.; Zhang, C.; Mao, C.; Du, J.; Long, T.; Cao, Y.; Yi, Q.; et al. Transcription factor ZmPLATZ2 positively regulate the starch synthesis in maize. Plant Growth Regul. 2021, 93, 291–302. [Google Scholar] [CrossRef]
- Chao, Q.; Gao, Z.F.; Zhang, D.; Zhao, B.G.; Dong, F.Q.; Fu, C.X.; Liu, L.J.; Wang, B.C. The developmental dynamics of the Populus stem transcriptome. Plant Biotechnol. J. 2019, 17, 206–219. [Google Scholar] [CrossRef]
- Hande, A.S.; Katageri, I.S.; Jadhav, M.P.; Adiger, S.; Gamanagatti, S.; Padmalatha, K.V.; Dhandapani, G.; Kanakachari, M.; Kumar, P.A.; Reddy, V.S. Transcript profiling of genes expressed during fibre development in diploid cotton (Gossypium arboreum L.). BMC Genom. 2017, 18, 675. [Google Scholar] [CrossRef]
- Kasirajan, L.; Hoang, N.V.; Furtado, A.; Botha, F.C.; Henry, R.J. Transcriptome analysis highlights key differentially expressed genes involved in cellulose and lignin biosynthesis of sugarcane genotypes varying in fiber content. Sci. Rep. 2018, 8, 11612. [Google Scholar] [CrossRef]
- Kim, J.H.; Kim, J.; Jun, S.E.; Park, S.; Timilsina, R.; Kwon, D.S.; Kim, Y.; Park, S.J.; Hwang, J.Y.; Nam, H.G.; et al. ORESARA15, a PLATZ transcription factor, mediates leaf growth and senescence in Arabidopsis. New Phytol. 2018, 220, 609–623. [Google Scholar] [CrossRef]
- Dong, T.; Yin, X.; Wang, H.; Lu, P.; Liu, X.; Gong, C.; Wu, Y. ABA-INDUCED expression 1 is involved in ABA-inhibited primary root elongation via modulating ROS homeostasis in Arabidopsis. Plant Sci. 2021, 304, 110821. [Google Scholar] [CrossRef]
- Timilsina, R.; Kim, Y.; Park, S.; Park, H.; Park, S.J.; Kim, J.H.; Park, J.H.; Kim, D.; Park, Y.I.; Hwang, D.; et al. ORESARA 15, a PLATZ transcription factor, controls root meristem size through auxin and cytokinin signalling-related pathways. J. Exp. Bot. 2022, 73, 2511–2524. [Google Scholar] [CrossRef] [PubMed]
- González-Morales, S.I.; Chávez-Montes, R.A.; Hayano-Kanashiro, C.; Alejo-Jacuinde, G.; Rico-Cambron, T.Y.; de Folter, S.; Herrera-Estrella, L. Regulatory network analysis reveals novel regulators of seed desiccation tolerance in Arabidopsis thaliana. Proc. Natl. Acad. Sci. USA 2016, 113, E5232–E5241. [Google Scholar] [CrossRef] [PubMed]
- Liu, S.; Yang, R.; Liu, M.; Zhang, S.; Yan, K.; Yang, G.; Huang, J.; Zheng, C.; Wu, C. PLATZ2 negatively regulates salt tolerance in Arabidopsis seedlings by directly suppressing the expression of the CBL4/SOS3 and CBL10/SCaBP8 genes. J. Exp. Bot. 2020, 71, 5589–5602. [Google Scholar] [CrossRef] [PubMed]
- Liu, M.; Wang, C.; Ji, Z.; Lu, J.; Zhang, L.; Li, C.; Huang, J.; Yang, G.; Yan, K.; Zhang, S.; et al. Regulation of drought tolerance in Arabidopsis involves the PLATZ4-mediated transcriptional repression of plasma membrane aquaporin PIP2;8. Plant J. 2023, 115, 434–451. [Google Scholar] [CrossRef]
- Zhang, K.; Lan, Y.; Wu, M.; Wang, L.; Liu, H.; Xiang, Y. PhePLATZ1, a PLATZ transcription factor in moso bamboo (Phyllostachys edulis), improves drought resistance of transgenic Arabidopsis thaliana. Plant Physiol. Biochem. 2022, 186, 121–134. [Google Scholar] [CrossRef]
- Zenda, T.; Liu, S.; Wang, X.; Liu, G.; Jin, H.; Dong, A.; Yang, Y.; Duan, H. Key Maize Drought-Responsive Genes and Pathways Revealed by Comparative Transcriptome and Physiological Analyses of Contrasting Inbred Lines. Int. J. Mol. Sci. 2019, 20, 1268. [Google Scholar] [CrossRef]
- Fang, C.; Kong, F. Soybean. Curr. Biol. 2022, 32, R902–R904. [Google Scholar] [CrossRef]
- Yang, F.; Xu, X.; Wang, W.; Ma, J.; Wei, D.; He, P.; Pampolino, M.F.; Johnston, A.M. Estimating nutrient uptake requirements for soybean using QUEFTS model in China. PLoS ONE 2017, 12, e0177509. [Google Scholar] [CrossRef]
- Muncan, J.; Jinendra, B.M.S.; Kuroki, S.; Tsenkova, R. Aquaphotomics Research of Cold Stress in Soybean Cultivars with Different Stress Tolerance Ability: Early Detection of Cold Stress Response. Molecules 2022, 27, 744. [Google Scholar] [CrossRef]
- Rasheed, A.; Raza, A.; Jie, H.; Mahmood, A.; Ma, Y.; Zhao, L.; Xing, H.; Li, L.; Hassan, M.U.; Qari, S.H.; et al. Molecular Tools and Their Applications in Developing Salt-Tolerant Soybean (Glycine max L.) Cultivars. Bioengineering 2022, 9, 495. [Google Scholar] [CrossRef]
- Wang, K.; Bu, T.; Cheng, Q.; Dong, L.; Su, T.; Chen, Z.; Kong, F.; Gong, Z.; Liu, B.; Li, M. Two homologous LHY pairs negatively control soybean drought tolerance by repressing the abscisic acid responses. New Phytol. 2021, 229, 2660–2675. [Google Scholar] [CrossRef] [PubMed]
- Yang, Y.; Wang, R.; Wang, L.; Cui, R.; Zhang, H.; Che, Z.; Hu, D.; Chu, S.; Jiao, Y.; Yu, D.; et al. GmEIL4 enhances soybean (Glycine max) phosphorus efficiency by improving root system development. Plant Cell Environ. 2023, 46, 592–606. [Google Scholar] [CrossRef] [PubMed]
- Cheng, Q.; Gan, Z.; Wang, Y.; Lu, S.; Hou, Z.; Li, H.; Xiang, H.; Liu, B.; Kong, F.; Dong, L. The Soybean Gene J Contributes to Salt Stress Tolerance by Up-Regulating Salt-Responsive Genes. Front. Plant Sci. 2020, 11, 272. [Google Scholar] [CrossRef] [PubMed]
- Wai, A.H.; Rahman, M.M.; Waseem, M.; Cho, L.-H.; Naing, A.H.; Jeon, J.-S.; Lee, D.-j.; Kim, C.-K.; Chung, M.-Y. Comprehensive Genome-Wide Analysis and Expression Pattern Profiling of PLATZ Gene Family Members in Solanum Lycopersicum L. under Multiple Abiotic Stresses. Plants 2022, 11, 3112. [Google Scholar] [CrossRef]
- Feng, X.; Zhu, G.; Meng, Q.; Zeng, J.; He, X.; Liu, W. Comprehensive analysis of PLATZ family genes and their responses to abiotic stresses in Barley. BMC Plant Biol. 2024, 24, 982. [Google Scholar] [CrossRef]
- Zhao, J.; Zheng, L.; Wei, J.; Wang, Y.; Chen, J.; Zhou, Y.; Chen, M.; Wang, F.; Ma, Y.; Xu, Z.-S. The soybean PLATZ transcription factor GmPLATZ17 suppresses drought tolerance by interfering with stress-associated gene regulation of GmDREB5. Crop J. 2022, 10, 1014–1025. [Google Scholar] [CrossRef]
- Hajibarat, Z.; Saidi, A.; Zeinalabedini, M.; Gorji, A.M.; Ghaffari, M.R.; Shariati, V.; Ahmadvand, R. Genome-wide identification of StU-box gene family and assessment of their expression in developmental stages of Solanum tuberosum. J. Genet. Eng. Biotechnol. 2022, 20, 25. [Google Scholar] [CrossRef]
- Wu, W.; Zhu, S.; Xu, L.; Zhu, L.; Wang, D.; Liu, Y.; Liu, S.; Hao, Z.; Lu, Y.; Yang, L.; et al. Genome-wide identification of the Liriodendron chinense WRKY gene family and its diverse roles in response to multiple abiotic stress. BMC Plant Biol. 2022, 22, 25. [Google Scholar] [CrossRef]
- Jeffares, D.C.; Penkett, C.J.; Bähler, J. Rapidly regulated genes are intron poor. Trends Genet. 2008, 24, 375–378. [Google Scholar] [CrossRef]
- Roy, S.W.; Penny, D. A Very High Fraction of Unique Intron Positions in the Intron-Rich Diatom Thalassiosira pseudonana Indicates Widespread Intron Gain. Mol. Biol. Evol. 2007, 24, 1447–1457. [Google Scholar] [CrossRef]
- Mashiguchi, K.; Asami, T.; Suzuki, Y. Genome-Wide Identification, Structure and Expression Studies, and Mutant Collection of 22 Early Nodulin-Like Protein Genes in Arabidopsis. Biosci. Biotechnol. Biochem. 2009, 73, 2452–2459. [Google Scholar] [CrossRef] [PubMed]
- Cao, J.; Li, X.; Lv, Y.; Ding, L. Comparative analysis of the phytocyanin gene family in 10 plant species: A focus on Zea mays. Front. Plant Sci. 2015, 6, 515. [Google Scholar] [CrossRef] [PubMed]
- Bilal Tufail, M.; Yasir, M.; Zuo, D.; Cheng, H.; Ali, M.; Hafeez, A.; Soomro, M.; Song, G. Identification and Characterization of Phytocyanin Family Genes in Cotton Genomes. Genes 2023, 14, 611. [Google Scholar] [CrossRef] [PubMed]
- Knowles, D.G.; McLysaght, A. High rate of recent intron gain and loss in simultaneously duplicated Arabidopsis genes. Mol. Biol. Evol. 2006, 23, 1548–1557. [Google Scholar] [CrossRef]
- Cao, J.; Shi, F. Dynamics of arginase gene evolution in metazoans. J. Biomol. Struct. Dyn. 2012, 30, 407–418. [Google Scholar] [CrossRef]
- Nekrutenko, A.; Makova, K.D.; Li, W.H. The KA/KS ratio test for assessing the protein-coding potential of genomic regions: An empirical and simulation study. Genome Res. 2002, 12, 198–202. [Google Scholar] [CrossRef]
- Biłas, R.; Szafran, K.; Hnatuszko-Konka, K.; Kononowicz, A.K. Cis-regulatory elements used to control gene expression in plants. Plant Cell Tissue Organ Cult. 2016, 127, 269–287. [Google Scholar] [CrossRef]
- Rehman, A.; Tian, C.; Li, X.; Wang, X.; Li, H.; He, S.; Jiao, Z.; Qayyum, A.; Du, X.; Peng, Z. GhiPLATZ17 and GhiPLATZ22, zinc-dependent DNA-binding transcription factors, promote salt tolerance in upland cotton. Plant Cell Rep. 2024, 43, 140. [Google Scholar] [CrossRef]
- Mistry, J.; Chuguransky, S.; Williams, L.; Qureshi, M.; Salazar, G.A.; Sonnhammer, E.L.L.; Tosatto, S.C.E.; Paladin, L.; Raj, S.; Richardson, L.J.; et al. Pfam: The protein families database in 2021. Nucleic Acids Res. 2021, 49, D412–D419. [Google Scholar] [CrossRef]
- Finn, R.D.; Clements, J.; Eddy, S.R. HMMER web server: Interactive sequence similarity searching. Nucleic Acids Res. 2011, 39, W29–W37. [Google Scholar] [CrossRef]
- Duvaud, S.; Gabella, C.; Lisacek, F.; Stockinger, H.; Ioannidis, V.; Durinx, C. Expasy, the Swiss Bioinformatics Resource Portal, as designed by its users. Nucleic Acids Res. 2021, 49, W216–W227. [Google Scholar] [CrossRef] [PubMed]
- Chou, K.C.; Shen, H.B. Cell-PLoc: A package of Web servers for predicting subcellular localization of proteins in various organisms. Nat. Protoc. 2008, 3, 153–162. [Google Scholar] [CrossRef] [PubMed]
- Yang, M.; Derbyshire, M.K.; Yamashita, R.A.; Marchler-Bauer, A. NCBI’s Conserved Domain Database and Tools for Protein Domain Analysis. Curr. Protoc. Bioinform. 2020, 69, e90. [Google Scholar] [CrossRef] [PubMed]
- Bailey, T.L.; Johnson, J.; Grant, C.E.; Noble, W.S. The MEME Suite. Nucleic Acids Res. 2015, 43, W39–W49. [Google Scholar] [CrossRef]
- Chen, C.; Chen, H.; Zhang, Y.; Thomas, H.R.; Frank, M.H.; He, Y.; Xia, R. TBtools: An Integrative Toolkit Developed for Interactive Analyses of Big Biological Data. Mol. Plant 2020, 13, 1194–1202. [Google Scholar] [CrossRef]
- Lescot, M.; Déhais, P.; Thijs, G.; Marchal, K.; Moreau, Y.; Van de Peer, Y.; Rouzé, P.; Rombauts, S. PlantCARE, a database of plant cis-acting regulatory elements and a portal to tools for in silico analysis of promoter sequences. Nucleic Acids Res. 2002, 30, 325–327. [Google Scholar] [CrossRef]
- Severin, A.J.; Woody, J.L.; Bolon, Y.-T.; Joseph, B.; Diers, B.W.; Farmer, A.D.; Muehlbauer, G.J.; Nelson, R.T.; Grant, D.; Specht, J.E.; et al. RNA-Seq Atlas of Glycine max: A guide to the soybean transcriptome. BMC Plant Biol. 2010, 10, 160. [Google Scholar] [CrossRef]
Disclaimer/Publisher’s Note: The statements, opinions and data contained in all publications are solely those of the individual author(s) and contributor(s) and not of MDPI and/or the editor(s). MDPI and/or the editor(s) disclaim responsibility for any injury to people or property resulting from any ideas, methods, instructions or products referred to in the content. |
© 2025 by the authors. Licensee MDPI, Basel, Switzerland. This article is an open access article distributed under the terms and conditions of the Creative Commons Attribution (CC BY) license (https://creativecommons.org/licenses/by/4.0/).