Article

Droplet Digital PCR for the Detection of Pseudomonas savastanoi pv. savastanoi in Asymptomatic Olive Plant Material

1
Council for Agricultural Research and Economics, Research Centre for Plant Protection and Certification of Rome, 00156 Rome, Italy
2
Council for Agricultural Research and Economics, Research Centre for Olive, Fruit and Citrus Crops (CREA-OFA), Rende, 87036 Cosenza, Italy
*
Authors to whom correspondence should be addressed.
Plants 2025, 14(12), 1831; https://doi.org/10.3390/plants14121831
Submission received: 1 April 2025 / Revised: 11 June 2025 / Accepted: 12 June 2025 / Published: 14 June 2025
(This article belongs to the Section Plant Protection and Biotic Interactions)

Abstract

:
Olive knot disease, caused by Pseudomonas savastanoi pv. savastanoi, severely impacts olive tree yield and oil quality. Early and accurate detection of the bacterium’s presence, particularly in asymptomatic plants, is crucial for effective disease management. This study aimed to develop an improved protocol for processing plant samples and adapting quantitative PCR to droplet digital PCR (ddPCR). For this purpose, four plant preparations—EW (external washing), PELLET (bacterial concentration), and enrichment in liquid media for 24 or 48 h (24hE, 48hE)—were tested using spiked samples. The ddPCR was set up and compared with qPCR to evaluate analytical sensitivity and specificity. Additionally, field samples from symptomatic and asymptomatic olive orchards were tested to evaluate the performance of the selected methods in naturally infected plants. ddPCR showed higher sensitivity than qPCR, particularly with the PELLET and 24hE preparations. The PELLET from the spiked sample preparation achieved a limit of detection of 10 CFU/mL for both molecular tests. The ddPCR, combined with the PELLET preparation, offers a highly sensitive and reliable tool for detecting P. savastanoi pv. savastanoi in asymptomatic olive material. This protocol shows great potential for improving early bacterial detection and disease prevention, thus aiding control strategies in nurseries and olive orchards, and supporting the production of certified plant propagation material.

1. Introduction

Pseudomonas savastanoi pv. savastanoi is the causal agent of olive knot disease (OKD), characterized by the formation of tumorous growths, or knots, primarily on the branches and twigs of olive trees (Olea europaea) [1,2], and occasionally on leaves and fruits [2,3,4,5]. OKD is a chronic disease, as symptoms persist and recur for many years in infected plants.
P. savastanoi pv. savastanoi enters the host plant through wounds resulting from various causes such as harvesting, pruning, hail, frost, and leaf scars. Knot development is driven by bacterial phytohormones, such as 3-indoleacetic acid and cytokinins, which promote uncontrolled cell growth around the infection site [6,7,8]. The knots contribute to the decline and death of branches, resulting in significant yield losses. Tree vigour, growth and the size and quality of the fruits can be moderately or severely reduced [1,9]. Crop losses caused by olive knot are not clearly assessed, and greatly depend on the geographical location and olive cultivar [4]. P. savastanoi pv. savastanoi can persist as an epiphyte on the surface of aerial plant parts and within young knots [1,10]. This persistence represents a critical inoculum source for new infections, allowing for rapid disease transmission across the entire orchard [1]. The bacterium can spread via rain, wind, insects, and human activities, such as olive grove management practices.
The dynamics of bacterial populations are influenced by seasonal factors and leaf age, with the most significant damage occurring under conditions that favor P. savastanoi pv. savastanoi epiphytic growth and its entry into olive bark, particularly during spring and autumn compared to winter and summer [10,11,12]. High rainfall and moderate temperatures (10–20 °C) are optimal for P. savastanoi pv. savastanoi epiphytic growth and penetration, resulting in significant harm to the host plant [12,13,14]. The spread of the disease through asymptomatic propagation materials is well-documented, as the epiphytic and endophytic lifestyle of P. savastanoi pv. savastanoi makes plants for planting a key pathway for its long-distance dissemination [15,16,17]. Consequently, the pathogen is usually introduced into new areas through asymptomatic infected plant material.
Controlling OKD is challenging, and current strategies focus on preventive measures such as reducing both endophytic and epiphytic bacterium populations through sanitary and cultural practices [1,3,4,18]. These strategies include pruning symptomatic branches, disinfecting the resulting wound and applying foliar treatments with copper-based compounds. Preventive measures also include the use of certified pathogen-tested plants and rootstocks for establishing new olive groves [19]. It is worth noting that the European phytosanitary certification program for the production of certified olive trees includes verification of the absence of P. savastanoi pv. savastanoi [20]. Thus, reliable diagnostic tests for detecting P. savastanoi pv. savastanoi in asymptomatic plant material are essential. Conventional P. savastanoi pv. savastanoi diagnosis relies on visual inspection of typical symptoms (e.g., knots) and direct bacterial isolation followed by pathogenicity and biochemical or serological tests [21,22,23,24]. However, these methods are time-consuming and lack sensitivity and specificity, especially for asymptomatic plants, where bacterial isolation is often unreliable [25,26,27,28,29]. To overcome these limitations, several assays for P. savastanoi pv. savastanoi detection have been developed, including PCR [26], nested PCR [29], enriched PCR [26], qPCR [27], and High-Resolution Melting Analysis (HRMA) [30]. These tools have demonstrated sensitivity and specificity, as well as the ability to discriminate among different pathovars (i.e., savastanoi, nerii, fraxini) or to quantify the pathogen. Despite this, a low bacterial load and/or the presence of inhibitors in plant matrices may lead to false negatives even with molecular methods. Under these conditions, two steps could be improved: (i) plant material processing to increase the detectable bacterial load and (ii) molecular tests less affected by inhibitors.
Bertolini et al. (2003) [28] compared two methods for processing plant material: external washing versus washing followed by an enrichment step. Their findings showed that the enrichment step enhanced the detection efficiency of P. savastanoi pv. savastanoi, both as an epiphyte and an endophyte. In this study, the initial steps for processing plant material were optimized to improve bacterial DNA detection by increasing sensitivity and minimizing PCR inhibition. To achieve this, the protocol described by Bertolini et al. 2003 [28] was partially modified by adding a concentration step after washing and by reducing the enrichment time from 72 h to 24 or 48 h. DNA was then extracted using four different approaches: (i) external washing step (EW); (ii) pellet of concentrated washing (PELLET); (iii) 24 h enrichment (24hE); and (iv) 48 h enrichment (48hE). These preparations were tested using both qPCR [27] and droplet digital PCR (ddPCR). The ddPCR has shown promise for efficiently detecting pathogens such as Ralstonia solanacearum in potatoes [31] and Xylella fastidiosa spp. in several plant hosts [32], showing sensitivity comparable to qPCR. Other studies showed increased detection sensitivity of ddPCR compared to qPCR for Xanthomonas citri subsp. citri [33,34], pepper mild mottle virus in plants, soil, and water [35], and Phytophthora nicotianae in environmental samples [36]. Recently, a ddPCR protocol for X. fastidiosa detection was implemented and showed greater analytical sensitivity than qPCR for O. europea, C. sinensis, and N. oleander [37]. The ddPCR allows the detection and quantification of pathogens, such as Agrobacterium vitis in grapevines, for which previous methods lacked sensitivity [38]. Unlike qPCR, ddPCR provides absolute target quantification without the need for a standard curve, facilitating data comparison and experimental design when standards are unavailable [38]. Additionally, ddPCR is less affected by PCR inhibitors than qPCR [38,39]. Given the challenges of detecting P. savastanoi pv. savastanoi in asymptomatic samples, using ddPCR as a highly sensitive and specific diagnostic method, this study aimed to develop a protocol for preparing samples and adapting the qPCR method by Tegli et al. 2010 [27] to ddPCR. To achieve this, ddPCR was first developed using spiked samples and then tested on naturally infected asymptomatic samples collected from olive trees in different Italian regions. The developed procedure showed high sensitivity, representing a valid diagnostic tool for testing the phytosanitary status of olive plant material.

2. Results

2.1. Optimization of the ddPCR Assay

Among the tested annealing temperatures, 58 °C was selected as the optimal temperature due to the highest fluorescence amplitude, minimal rain, and the greatest separation between negative and positive droplet clouds (Figure 1A). Following the identification of the optimal annealing temperature for ddPCR, the analytical sensitivity and inhibitory potential of the tested matrices were evaluated using DNA extracted from pure P. savastanoi pv. savastanoi colonies and spiked samples (S-EW, S-PELLET, S-24hE, and S-48hE) at a known concentration (103 CFU/mL).
Analytical sensitivity improved linearly with increasing DNA volumes in the reaction mix for both S-PELLET and S-24hE samples (Figure 1B, Table 1). In contrast, DNA extracted from the S-EW fraction did not show a linear increase in target detection, likely due to the low target concentration, while the S-48hE reaction was saturated, preventing accurate ddPCR analyses. Under these conditions, the correlation coefficient was calculated to assess the relationship between the amount of target DNA and the volume of DNA used in the ddPCR reaction. As shown in Table 1, S-PELLET and S-24hE exhibit a high degree of correlation between the amount of target DNA and the increased DNA volume per reaction, making them the most suitable extraction methods for analysing asymptomatic samples. Additionally, 8 μL of DNA per ddPCR reaction represents the optimal volume for maximizing the method’s sensitivity (Figure 1B). Moreover, the ddPCR reaction was not affected by plant matrix inhibitors.

2.2. ddPCR Analytical Specificity

The evaluation of analytical specificity performed for both qPCR and ddPCR yielded the same results (Table 2). All non-target strains tested showed negative results with both tests, while only the P. savastanoi pv. savastanoi target strains from olive and oleander tested positive.

2.3. ddPCR Analytical Sensitivity

The limit of detection (LoD) of the qPCR and ddPCR in all the spiked (S) samples (S-EW, PELLET, 24hE, and 48hE) was assessed (Table 3). Both methods exhibited the lowest analytical sensitivity when testing S-EW, with a LoD of 104 CFU/mL. Conversely, both methods showed high sensitivity for S-PELLET, achieving a LoD of 10 CFU/mL. For S-24hE, ddPCR displayed a 10-fold higher LoD than qPCR (10 CFU/mL vs. 102 CFU/mL). However, ddPCR results for S-48hE were saturated, making this preparative method unsuitable, while qPCR maintained a high sensitivity with a LoD of 10 CFU/mL. No false positives were observed.

2.4. Field Samples

All four plant material preparations from field (F) samples (F-EW, F-PELLET, F-24hE, F-48hE) were preliminarily assessed on 20 out of 100 samples. The results showed that F-EW was less reliable, while F-48hE showed a lower percentage of positive samples (20%) compared to F-24hE (50%).
Based on these preliminary results and those from spiked samples, the PELLET and the 24hE preparations were selected and evaluated on asymptomatic samples collected in fields infected by P. savastanoi pv. savastanoi. Table 4 presents the cumulative results for all tested samples, showing a higher sensitivity of ddPCR compared to qPCR, both for F-PELLET (34% vs. 19%) and for F-24hE samples (22% vs. 3%). The Chi-square test used to compare the distribution of positive samples between the two detection methods revealed a significant difference (χ2 = 4.771, df = 1, p = 0.0289*), suggesting that ddPCR has higher sensitivity than qPCR, particularly in the F-24hE preparation.
Pearson’s correlation analysis was performed on F-PELLET and F-24hE samples that yielded positive results in both qPCR and ddPCR (Figure 2A,B). In both cases, a high degree of correlation was observed (F-PELLET r = −0.932; F-24hE r = −0.991). However, while the correlation value for the PELLET samples is statistically significant (p-value < 0.0001; n = 14), the correlation for the 24hE samples is not statistically significant (p-value < 0.08) due to the low number of positive results obtained in qPCR (n = 3) (Table 4).
The results of qPCR and ddPCR were analysed based on the sampling period. The percentage of positive samples detected during the two sampling periods is reported in Table 5. The sampling in April-May, combined with the use of ddPCR, seems more efficient in detecting P. savastanoi pv. savastanoi, with respect to October-November, with 40% of F-PELLET samples and 31% of F-24hE samples tested positive. Conversely, the use of qPCR as a detection method does not highlight differences between the two sampling periods. These differences were analysed using the Chi-square test, which, however, did not show a statistically significant difference between the methods across the two sampling periods (April/May: χ2 = 1.891, df = 1, p = 0.1691; October/November: χ2 = 1.891, df = 1, p = 0.1691). (April/May χ2 = 0.9122, df = 1, p = 0.3395; October/November χ2 = 2.632, df = 1, p = 0.1048).

3. Discussion

Olive knot disease is known for causing severe damage to olive trees, significantly affecting both the yield and quality of olive oil, with substantial economic consequences for the Mediterranean olive oil industry [2].
The pathogen’s ability to persist, even in a low concentration, in asymptomatic olive material represents a critical challenge for the management of OKD and for the detection of the causal agent P. savastanoi pv. savastanoi. This bacterium thrives in the Mediterranean climate, where conditions such as high humidity and moderate temperatures promote its growth [12,13,14].
Conventional control strategies for OKD primarily focus on reducing bacterial populations through physical and chemical means. Pruning infected branches helps remove visible sources of infection [3], while traditional copper-based treatments or innovative approaches, such as copper-nanoparticles, thyme essential oil nanoparticles [40,41], or essential oils [42] aim to reduce the bacterial load. In addition to implementing control measures, early and accurate detection of P. savastanoi pv. savastanoi is essential to prevent the spread and introduction in new areas of P. savastanoi pv. savastanoi. Therefore, the application of efficient and reliable diagnostic methods becomes crucial. The current diagnostic tools, including visual inspection, isolation and qPCR, have limitations. Visual inspection and bacterial isolation can be unreliable, especially in asymptomatic plants where disease symptoms are not yet evident and bacterial load is generally low. Although qPCR is a highly sensitive molecular test, it can be not efficient to detect low bacterial loads in asymptomatic samples and may be affected by inhibitors present in plant matrices [43,44,45]. This highlights the need for more reliable diagnostic tools that can detect the pathogen before it leads to noticeable symptoms and, consequently, damage.
In this context ddPCR shows increased sensitivity and specificity by partitioning the sample into thousands of droplets, allowing for precise quantification of target DNA without relying on a standard curve [38,45]. This makes ddPCR particularly suited for detecting pathogens at low concentrations, which is essential for identifying latent infections in asymptomatic plants [36,46].
This study focused on the optimization of the procedure for the detection of P. savastanoi pv. savastanoi from an asymptomatic olive plant, by improving sample preparation and by developing a sensitive ddPCR to enhance diagnostic reliability.
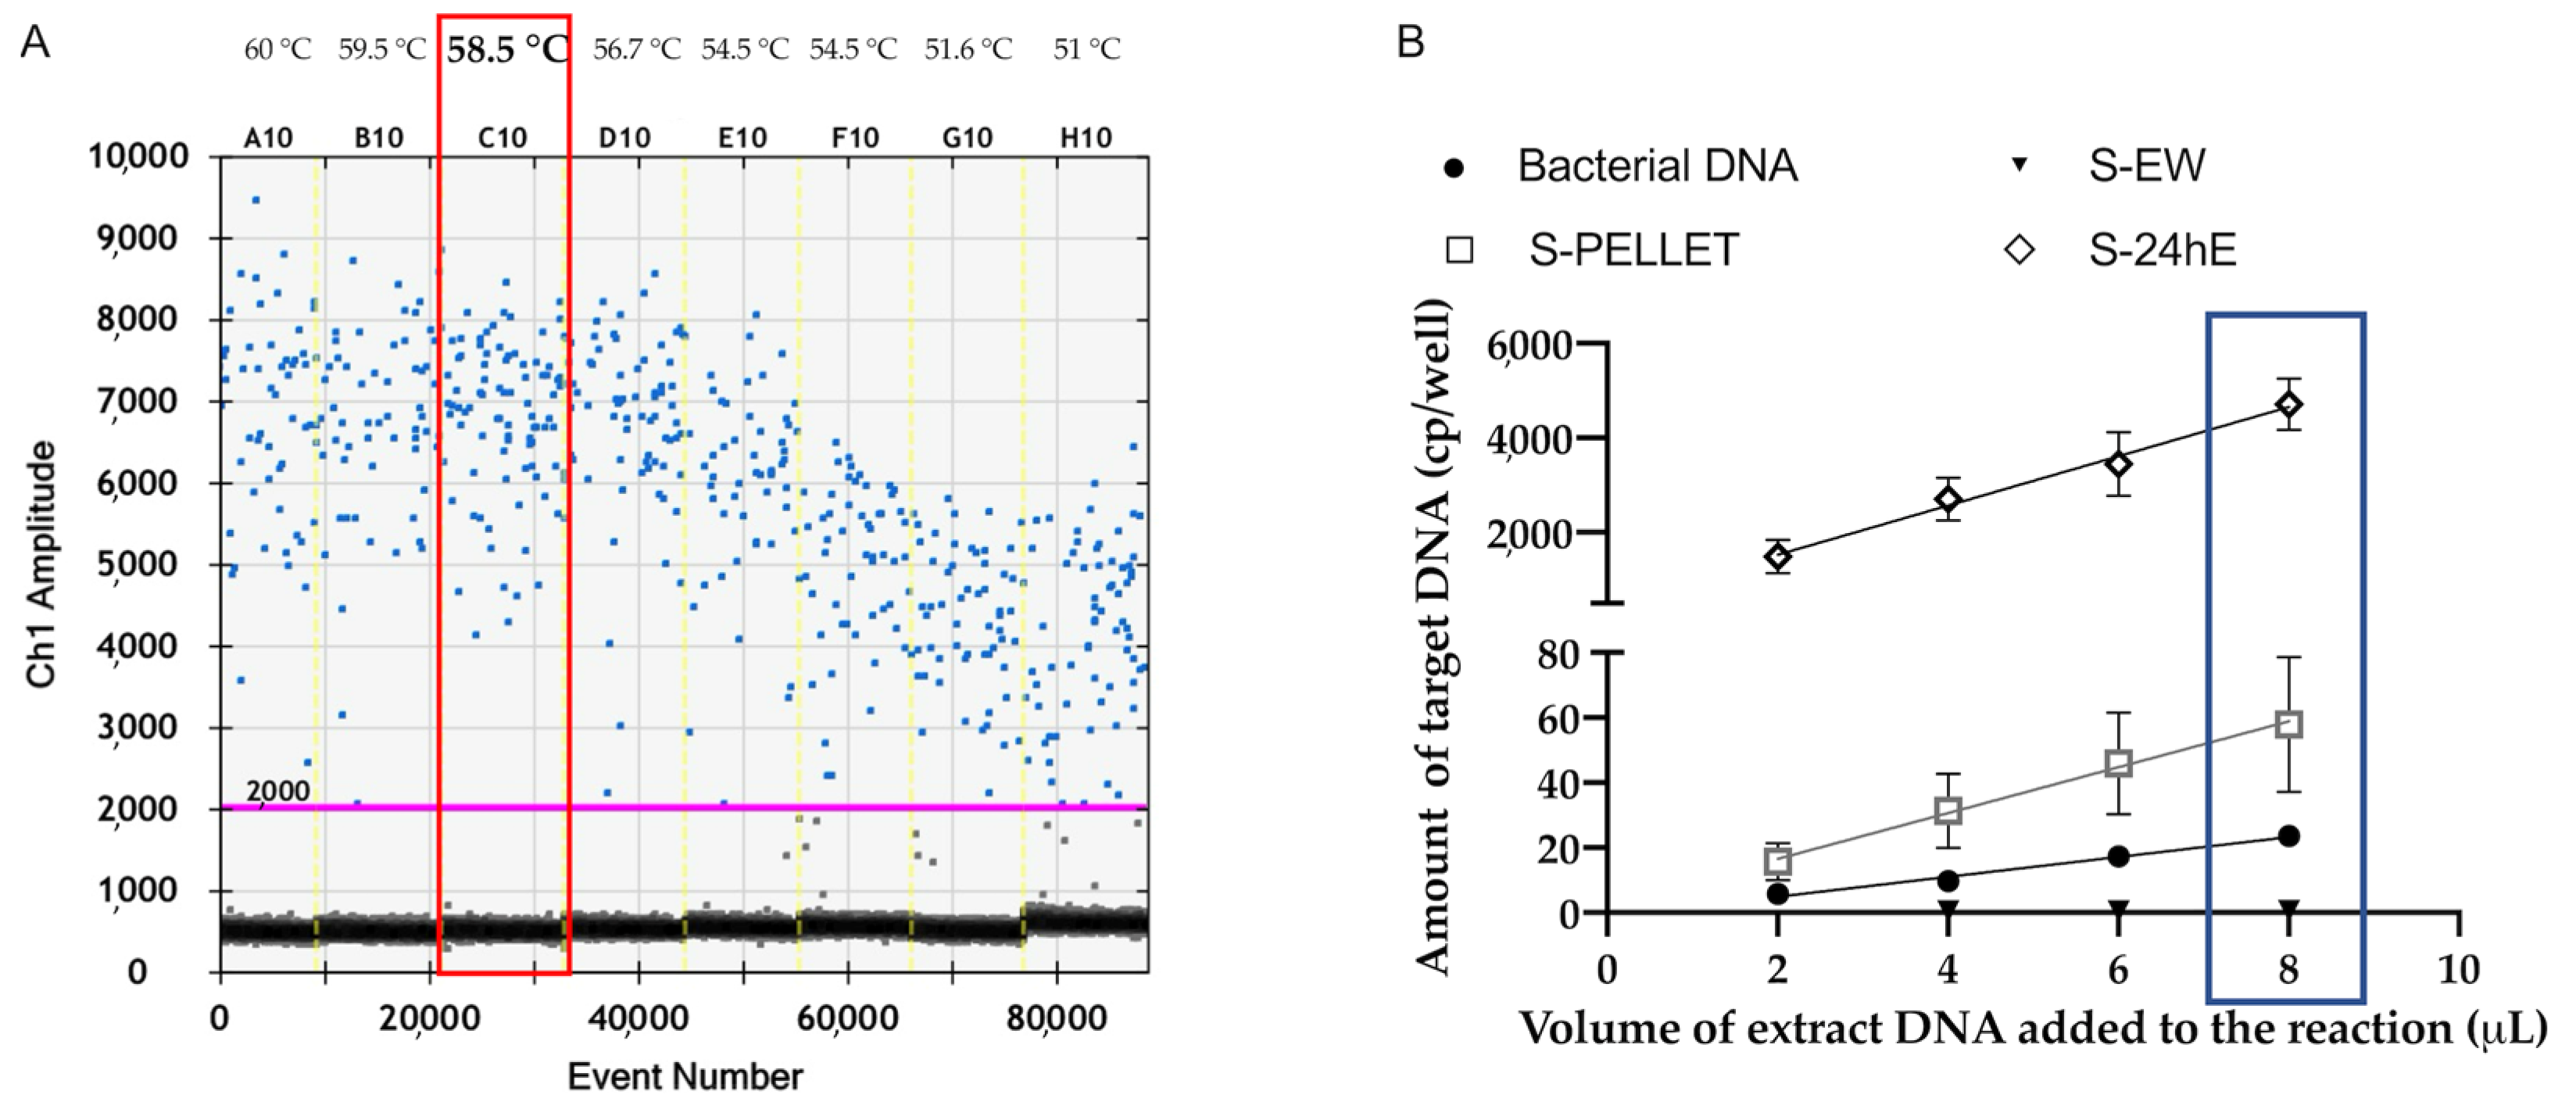
Among the four evaluated preparations on spiked samples, the S-PELLET and S-24hE proved to be the most effective in terms of analytical sensitivity. Furthermore, the S-PELLET, which involves concentrating the bacterial load of the washing solution, showed higher sensitivity achieving a high limit of detection of 10 CFU/mL for both qPCR PCR and ddPCR. Conversely, the S-EW exhibited lower sensitivity, likely due to the low bacterial load in the washing solution fraction. The S-48hE preparation, while effective for P. savastanoi pv. savastanoi detection by qPCR, showed ddPCR saturation, even at the lower concentration of 10 CFU/mL, making it less suitable for ddPCR.
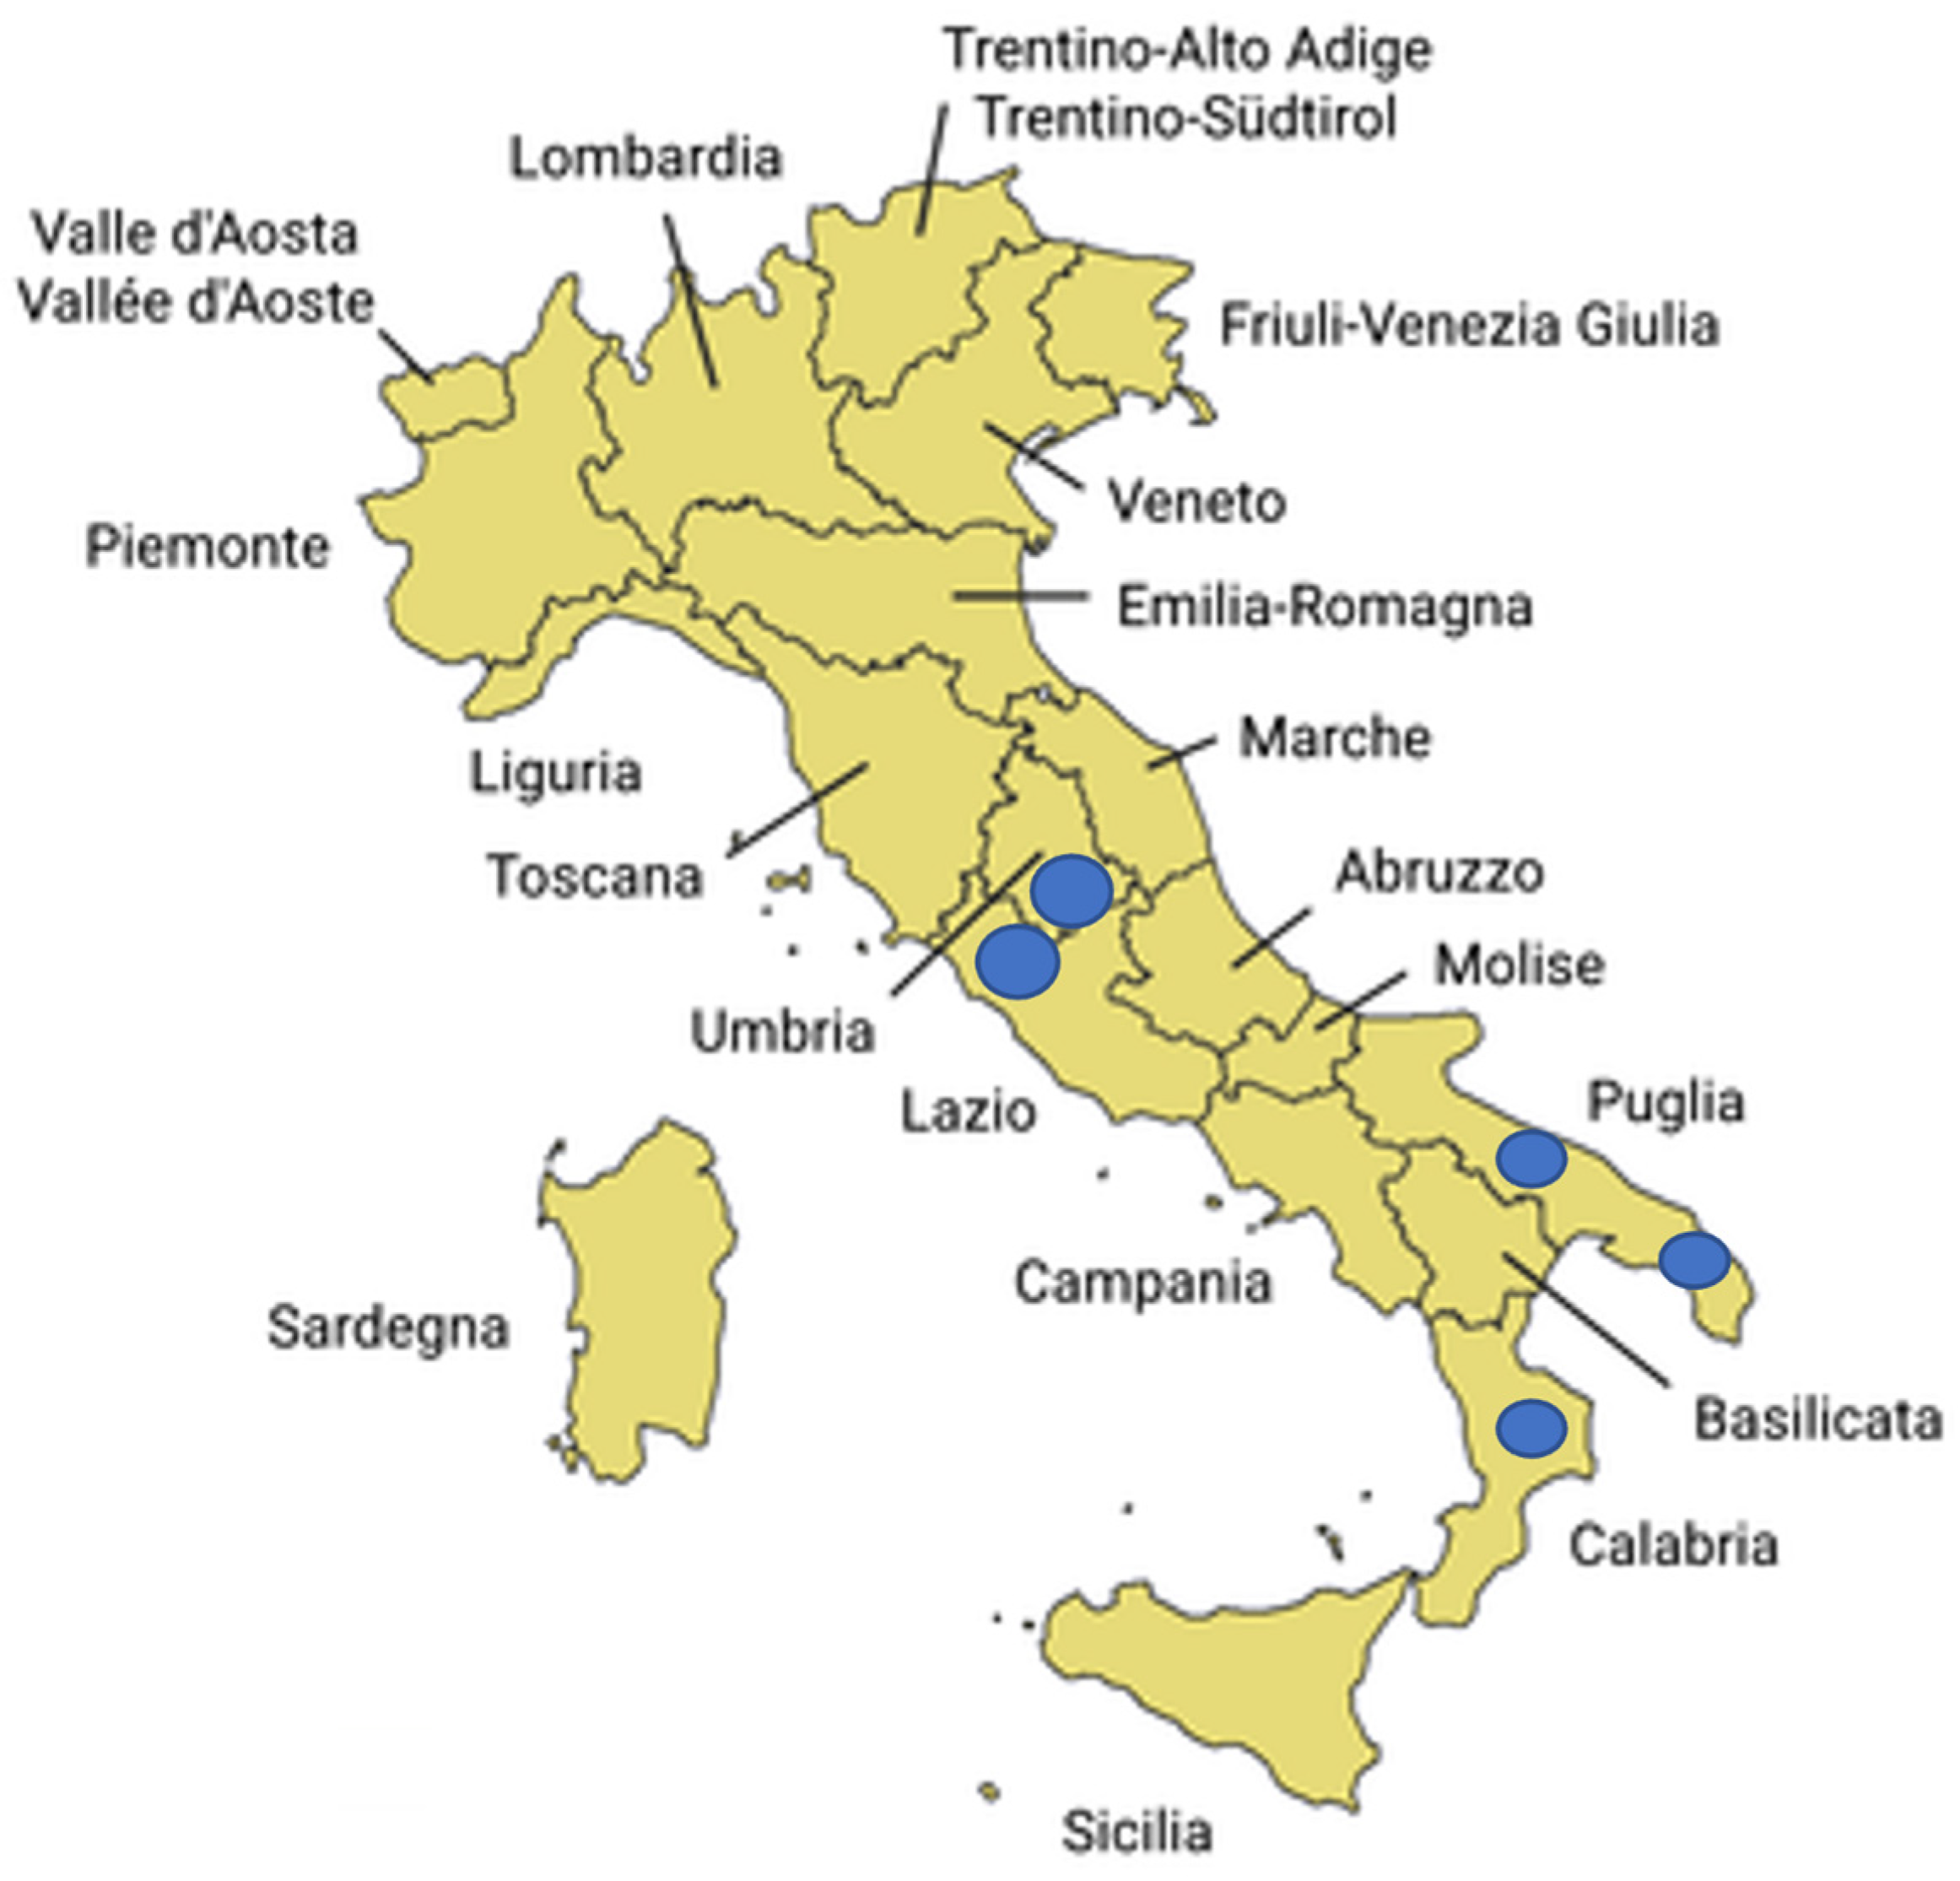
Regarding the two selected sample preparation methods (F-PELLET and F-24hE) used for the analysis of field samples, ddPCR demonstrated higher efficiency than qPCR in detecting P. savastanoi pv. savastanoi in 100 asymptomatic samples collected from both symptomatic and asymptomatic olive trees. These results highlight the improved analytical sensitivity of ddPCR, especially under challenging conditions where bacterial concentrations may be low, unevenly distributed, or where cells may be in a viable but non-culturable (VBNC) state—common scenarios in asymptomatic plant tissues.
Unlike spiked samples, field samples present greater variability. Such variability can affect both the presence and composition of PCR inhibitors. In this context, ddPCR offers a clear advantage over qPCR, as its droplet-based partitioning reduces the impact of inhibitors and enhances the detection of low bacterial DNA concentrations, thereby increasing overall accuracy. The higher efficiency of ddPCR in detecting the F-PELLET samples can be also attributed to its ability to detect DNA from both viable and non-viable bacterial cells, with respect to F-24hE preparation that enriched only viable cells. The concentration step increases the likelihood of capturing bacterial cells, even when the bacterial load is low. This makes it particularly useful for detecting P. savastanoi pv. savastanoi in asymptomatic samples, where bacteria may be present in low numbers or in a latent state. Conversely, the F-24hE, which requires viable bacterial cells to grow in an enrichment medium, was less effective. The F-24hE may be less effective than F-PELLET also due to the presence of P. savastanoi pv. savastanoi in a VBNC state. P. savastanoi pv. savastanoi can switch from a viable to a VBNC state, i.e., in plants exposed to heavy metal copper ions [18]. However, the F-24hE procedure still provided valuable insights when combined with ddPCR.
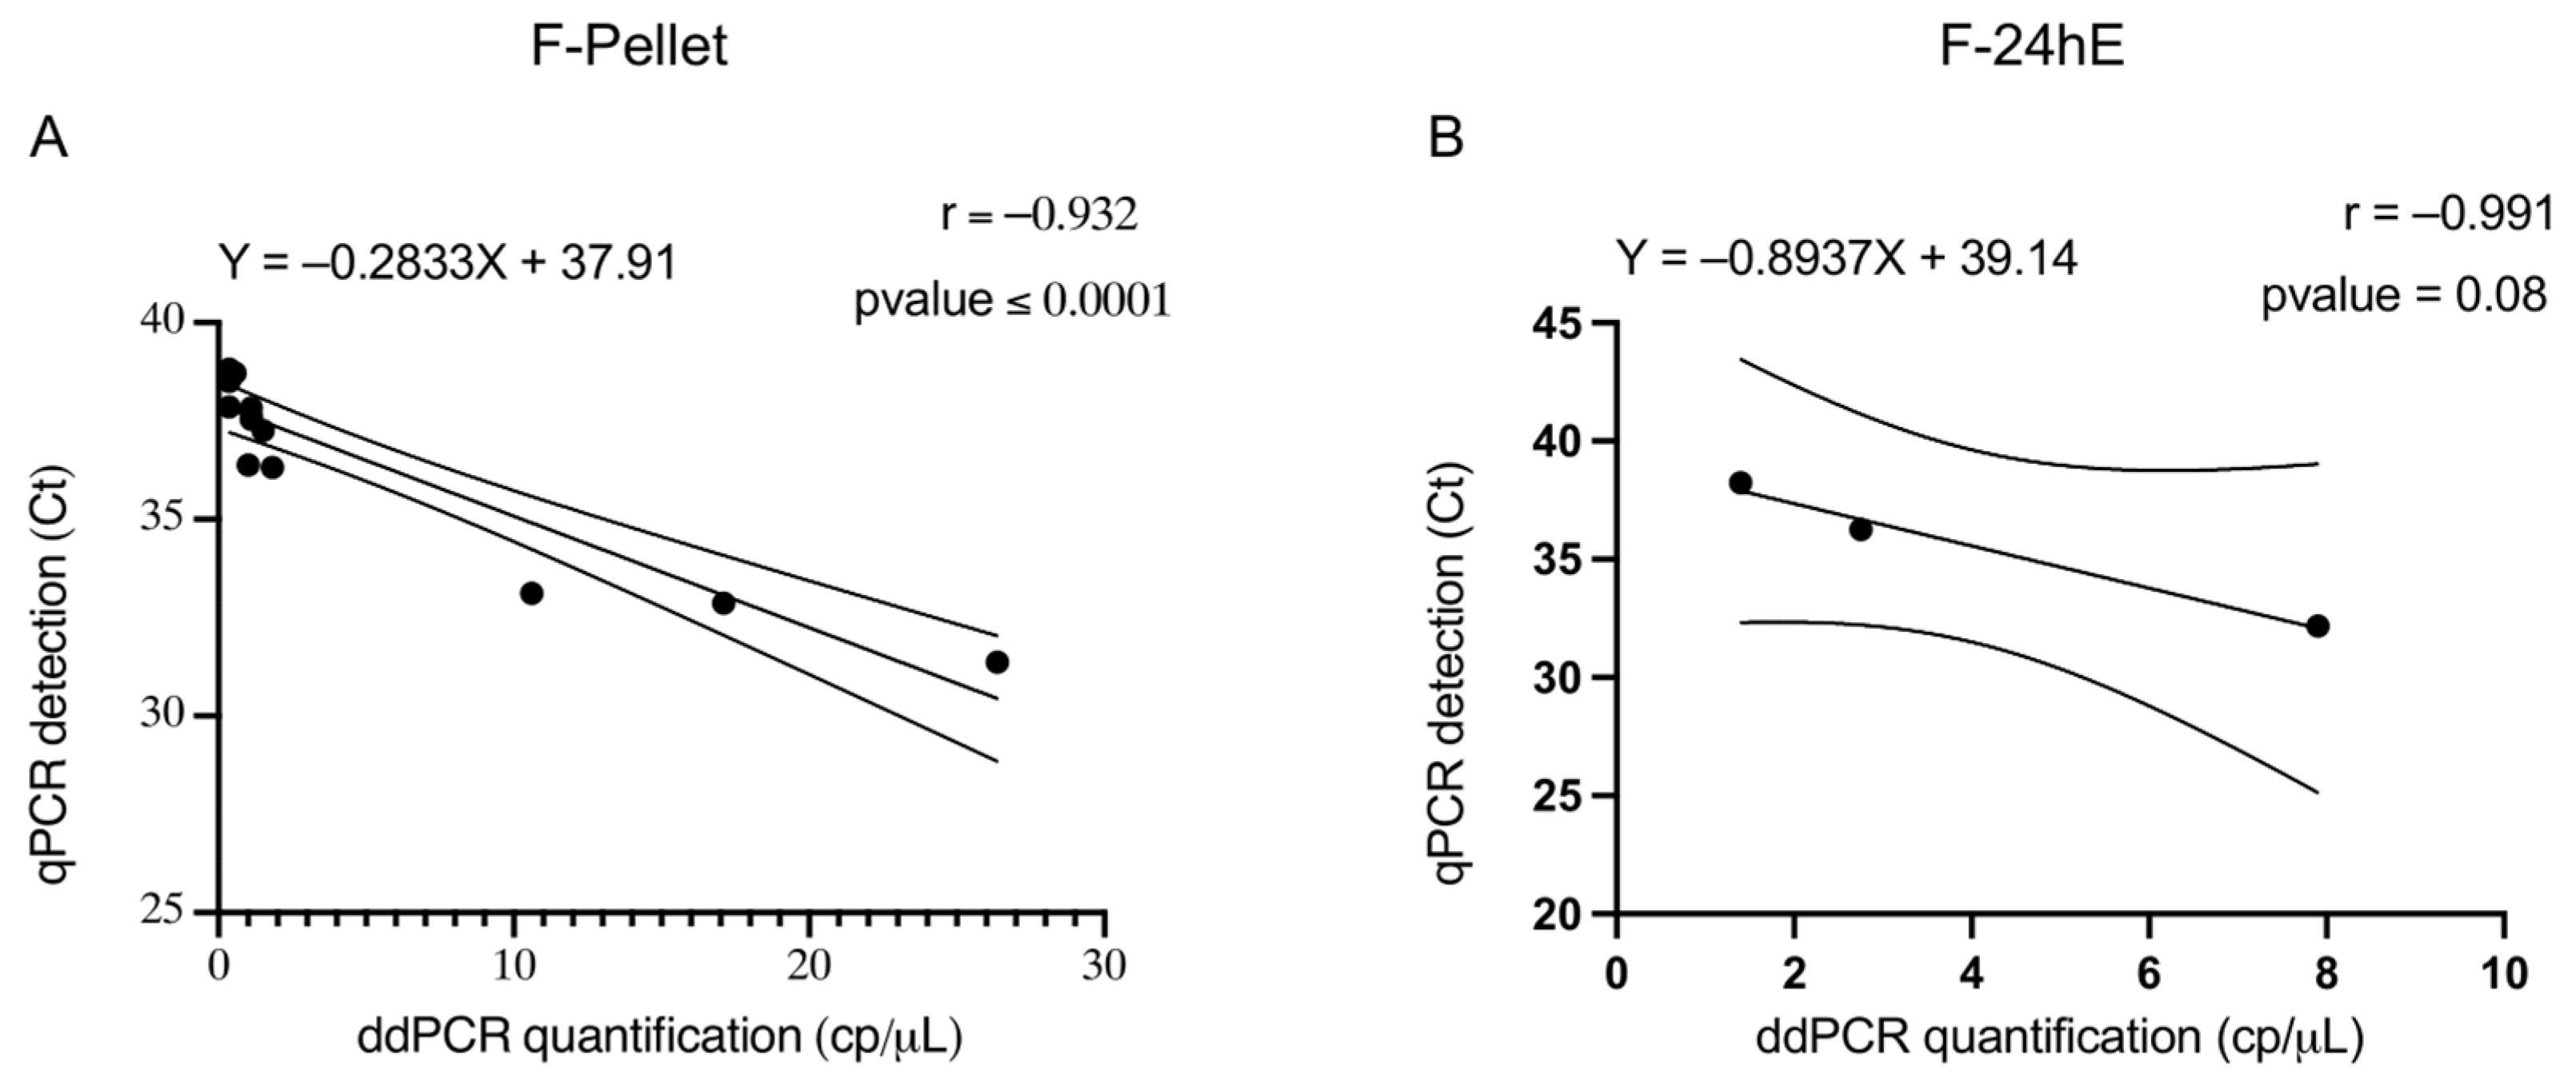
Pearson’s correlation coefficient for PELLET samples was statistically significant, indicating a strong correlation between the results obtained with the two molecular methods. This high correlation supports the reliability of ddPCR as an alternative to qPCR, with the added benefit of increased efficiency and sensitivity.
Given the seasonality of P. savastanoi pv. savastanoi’s activity and epiphytic growth we investigated if monitoring activity may be affected by the season of sampling. Our results highlighted a higher efficiency of ddPCR compared to qPCR, particularly during April/May for both sample preparation methods (F-PELLET: 40% vs. 12%; F-24hE: 31% vs. 4%). Nevertheless, these differences were not statistically significant. During the October/November sampling period, ddPCR also showed higher performance than qPCR, although the differences were less pronounced compared to the April/May period (F-PELLET: 26% vs. 20%; F-24hE: 13% vs. 2%). Similarly, these differences were not statistically significant.
In conclusion, the findings of the spiked and the field samples confirm that ddPCR is a highly sensitive and reliable tool for detecting P. savastanoi pv. savastanoi in olive trees, particularly in asymptomatic plant material. The PELLET preparation, in combination with ddPCR, offers the most effective procedure. On the other hand, the 24hE can be useful when the detection of only viable cells is advisable. Together, these results highlight the potential of ddPCR to improve early detection and management of OKD, ultimately contributing to the prevention and limiting the spread of this harmful pathogen through asymptomatic plant propagation material.

4. Materials and Methods

4.1. Bacterial Strains

The P. savastanoi pv. savastanoi strain (CREA-DC collection number 1918, CREA-DC, Rome, Italy), isolated in 2018 from an olive plant affected by olive knots in the Lazio region, was routinely cultured at 28 °C on nutrient agar (Oxoid, CM0003, Altrincham, UK) added of 0.25% glucose (NAG). The colony-forming units (CFUs) were quantified by plating 100 μL of bacterial suspensions on NAG medium and incubating at 28 °C for 4 days. The optical density of 0.1 at 600 nm corresponded to 107 CFU/mL, as reported by Martinez et al. in 2010 [47].

4.2. Spiked Sample Preparation

Samples were processed following Bertolini et al. [28] with modifications. Asymptomatic twigs were collected from olive plants previously tested by qPCR of Tegli et al. [27] to verify the absence of P. savastanoi pv. savastanoi. Twenty grams of young, leafless twigs were cut into ~5 cm fragments and placed in 100 mL of PBS1X with 0.05% Tween-20 (Sigma Aldrich, St. Louis, MO, USA) containing P. savastanoi pv. savastanoi bacterial suspensions at final concentrations of 104, 103, 102, and 10 CFU/mL. The washing solution from each spiked sample was divided into four preparations for DNA extraction: (i) external wash (S-EW); (ii) 96 mL of external wash was centrifugated at 10,000× g for 20 min at 4 °C, with the resulting pellet resuspended in 5 mL of PBS1X (S-PELLET); (iii) 500 μL of the external wash enriched in 4.5 mL of PVF-1 semi-selective medium for 24 h (S-24hE); (iv) 500 μL of the external wash enriched in 4.5 mL of PVF-1 for 48 h (S-48hE). PVF-1 medium used for enrichment analyses was prepared following Surico and Lavermicocca [22]. Three independent biological replicates were prepared for each preparation and each bacterial concentration.

4.3. Analytical Sensitivity

Analytical sensitivity of ddPCR was evaluated in comparison with qPCR Tegli et al. [27] following the EPPO Standard 7/98 (5) [48]. This was achieved by determining the lowest cell density that yielded a positive result, using three independent biological replicates of spiked samples.

4.4. Field Samples Collection

One hundred asymptomatic samples were collected from several Italian regions known for their extensive olive-growing tradition (Puglia, Calabria, Lazio, Umbria) (Table 6 and Figure 3) during spring and autumn (April, May, October, and November 2022). In particular, 24 samples were collected in Central Italy (Lazio and Umbria) and 76 in South of Italy (Apulia and Calabria); 52 samples were collected in spring (April–May) and 48 in autumn (October–November).
The asymptomatic samples were collected from knotless branches of plants showing symptoms of P. savastanoi pv. savastanoi infection and from plants adjacent to symptomatic ones. Each sample consisted in twenty grams of young, leafless twigs, cut into ~5 cm fragments. Twenty out of 100 samples were preliminarily processed as described for spiked samples with the four plant material preparations (F-EW, F-PELLET, F-24hE, F-48hE). Based on the results obtained, the remaining 80 samples were tested using the selected F-PELLET and F-24hE preparations.

4.5. DNA Extraction

DNA extraction from spiked and field-collected samples was performed using two different extraction kits, depending on the sample type. A total of 500 μL of the bacterial suspension (positive control), EW, 24hE, and 48E samples were extracted using the Gentra Puregene Yeast/Bact. Kit B (Qiagen, PL Venlo, The Netherlands); 500 μL of resuspended PELLET were extracted using the DNeasy Plant Mini kit (Qiagen, PL Venlo, The Netherlands). The DNA was stored at −15 °C.

4.6. qPCR and Droplet Digital PCR

The qPCR was carried out using the thermal cycler CFX96 real-time System C1000 Touch (Bio-Rad Laboratories Inc., Hercules, CA, USA) following Tegli et al. 2010 [27]. Primers and probe specific for P. savastanoi pv. savastanoi were used to develop the ddPCR reaction using the QX200TM Droplet DigitalTM PCR System (Bio-Rad, Hercules, CA, USA) in accordance with the manufacturer’s instructions. The reaction included 2xddPCRTM Supermix for Probes no dUTP (Bio-Rad Laboratories Inc., Hercules, CA, USA). Droplets were generated using a Droplet Generator (DG) with an 8-channel DG8 cartridge and cartridge holder with 70 μL of DG oil/well, 20 μL of PCR reaction mix and a DG8 gasket. Subsequently, the droplets (40 μL) were transferred to corresponding wells of a 96-well PCR plate (Bio-Rad Laboratories Inc., Hercules, CA, USA) and heat-sealed with pierceable foil using a PX1TM PCR plate sealer (Bio-Rad Laboratories Inc., Hercules, CA, USA) before amplification on the thermal cycler CFX96 Real-time System C1000 Touch (Bio-Rad Laboratories Inc., Hercules, CA, USA). The thermal cycling conditions were optimized using an annealing gradient ranging from 51 °C to 60 °C. The ddPCR assay was performed on DNA extracted from each spiked preparation (S-EW, S-PELLET, S-24hE) as well as from bacterial DNA at a concentration of 103 CFU/mL. For each preparation, different DNA volumes (2 μL, 4 μL, 6 μL, and 8 μL) were tested in the reaction mix. The optimal reaction conditions were identified testing three parameters: (i) achieving the highest fluorescence amplitude; (ii) ensuring clear separation between positive and negative droplets; (iii) minimizing rain (i.e., droplets ranging between the positive and negative ones). The optimized thermal cycling conditions consisted of an initial denaturation step at 95 °C for 10 min, followed by 40 cycles of a two-step thermal profile: 30 s at 94 °C for denaturation and 1 min at 58 °C for annealing/extension. This was followed by a final hold at 98 °C for 10 min for droplet stabilization and cooling to 4 °C. A temperature ramp of 2.5 °C/s was applied during all PCR steps, and the lid temperature was maintained at 105 °C, as recommended by Bio-Rad. At the end of the amplification, the 96-well plate was transferred to the QX200™ Droplet Reader (Bio-Rad Laboratories Inc., Hercules, CA, USA. The ddPCR reactions generating less than 10,000 droplets were excluded from the analysis. A sample was considered positive when at least two positive droplets were detected. All qPCR and ddPCR runs included a positive amplification control (PAC; DNA from 106 CFU/mL bacterial suspension), and a negative amplification control (NAC; PCR-grade water). The ddPCR data were analysed using QuantaSoft Analysis Pro software 1.0 (Bio-Rad Laboratories Inc., Hercules, CA, USA). The threshold was manually set above the negative droplet cloud, based on the results of the corresponding NAC.
The ddPCR reactions were performed on DNA extracted from samples (bacterial or spiked DNA) at concentrations up to 103 CFU/mL, as higher concentrations resulted in saturation and consequent errors in Poisson statistics.

4.7. Analytical Specificity

The analytical specificity of the ddPCR was evaluated in comparison with qPCR following the EPPO Standard 7/98 (5) [48], on several P. savastanoi pv. savastanoi isolates, bacteria taxonomically related to P. savastanoi pv. savastanoi, olive plant epiphytes, and other plant-pathogenic bacteria (Table 7).

4.8. Statistical Analysis

The linear regression and Pearson’s correlation of the Cq values from qPCR, the concentration of the copy number from ddPCR, and the Chi-square test analyses were carried out using GraphPad Prism 10 Software (GraphPad Software, San Diego, CA, USA). p-values less than 0.05 were considered significant. Data are expressed as mean ± standard deviation (SD).

Author Contributions

Conceptualization, G.T. and S.L.; methodology, G.T. and E.S.; software, formal analysis, data curation, G.T.; writing—original draft preparation, writing—review and editing, G.T. and S.L., N.P. and V.S.; visualization, supervision, project administration, funding acquisition, S.L. All authors have read and agreed to the published version of the manuscript.

Funding

This research was funded by MIPAAFT, Project SALVAOLIVI (“Salvaguardia e valorizzazione del patrimonio olivicolo italiano con azioni di ricerca nel settore della difesa fitosanitaria”), D.M. 33437 del 21-12-2017.

Data Availability Statement

Data will be available upon demand.

Acknowledgments

We thank Alessia L’Aurora and Simone Lucchesi for their support in experimental procedures.

Conflicts of Interest

The authors declare no conflicts of interest.

References

  1. Quesada, J.M.; Penyalver, R.; Pérez-Panadés, J.; Salcedo, C.I.; Carbonell, E.A.; López, M.M. Dissemination of Pseudomonas savastanoi pv. savastanoi populations and subsequent appearance of olive knot disease. Plant Pathol. 2010, 59, 262–269. [Google Scholar]
  2. Quesada, J.; Penyalver, R.; López, M. Epidemiology and control of plant diseases caused by phytopathogenic bacteria: The case of olive knot disease caused by Pseudomonas savastanoi pv. savastanoi. In Plant Pathology; Cumagun, C.J., Ed.; InTech: London, UK, 2012; pp. 299–326. [Google Scholar]
  3. Ramos, C.; Matas, I.M.; Bardaji, L.; Aragón, I.M.; Murillo, J. Pseudomonas savastanoi pv. savastanoi: Some like it knot. Mol. Plant Pathol. 2012, 13, 998–1009. [Google Scholar] [PubMed]
  4. Young, J.M. Olive knot and its pathogens. Australas. Plant Pathol. 2004, 33, 33–39. [Google Scholar] [CrossRef]
  5. Iacobellis, N.S. Olive knot. In Encyclopedia of Plant Pathology; Maloy, O.C., Murray, T.D., Eds.; John Wiley and Sons: New York, NY, USA, 2001; Volume 2, pp. 713–715. ISBN 0471298174. [Google Scholar]
  6. Comai, L.; Kosuge, T. Involvement of plasmid deoxyribonucleic acid in indoleacetic acid synthesis in Pseudomonas savastanoi. J. Bacteriol. 1980, 143, 950–957. [Google Scholar] [CrossRef]
  7. Smidt, M.; Kosuge, T. The rôle of indole-3-acetic acid accumulation by alpha methyl tryptophan-resistant mutants of Pseudomonas savastanoi in gall formation on oleanders. Physiol. Plant Pathol. 1978, 13, 203–213. [Google Scholar] [CrossRef]
  8. Surico, G.; Iacobellis, N.S.; Sisto, A. Studies on the role of indole-3-acetic acid and cytokinins in the formation of knots on olive and oleander plants by Pseudomonas syringae pv. savastanoi. Physiol. Plant Pathol. 1985, 26, 309–320. [Google Scholar] [CrossRef]
  9. Schroth, M.N. Quantitative assessment of the effect of the olive knot disease on olive yield and quality. Phytopathology 1973, 63, 1064. [Google Scholar] [CrossRef]
  10. Ercolani, G.L. Pseudomonas savastanoi and other bacteria colonizing the surface of olive leaves in the field. J. Gen. Microbiol. 1978, 109, 245–257. [Google Scholar] [CrossRef]
  11. Ercolani, G.L. Variability among isolates of Pseudomonas syringae pv. savastanoi from the phylloplane of the olive. Microbiology 1983, 129, 901–916. [Google Scholar]
  12. Quesada, J.M.; García, A. Recovery of Pseudomonas savastanoi pv. savastanoi from symptomless shoots of naturally infected olive trees. Int. J. Microbiol. 2007, 10, 77–84. [Google Scholar]
  13. Varvaro, L.; Surico, G. Comportamento di diverse cultivars di olivo (Olea europaea L.) alla inoculazione artificiale con Pseudomonas savastanoi (e. f. Smith) Stevens. Phytopathol. Mediterr. 1978, 17, 174–177. [Google Scholar]
  14. Ercolani, G.L. Presenza epifitica di Pseudomonas savastanoi (e.f. Smith) stevens sull’olivo, in puglia. Phytopathol. Mediterr. 1971, 10, 130–132. [Google Scholar]
  15. Azad, H.R.; Cooksey, D. A Semiselective medium for detecting epiphytic and systemic populations of Pseudomonas savastanoi from oleander. Phytopathology 1995, 85, 740–745. [Google Scholar] [CrossRef]
  16. Marchi, G.; Mori, B.; Pollacci, P.; Mencuccini, M.; Surico, G. Systemic spread of Pseudomonas savastanoi pv. savastanoi in olive explants. Plant Pathol. 2009, 58, 152–158. [Google Scholar] [CrossRef]
  17. Wilson, E.; Magie, A. Systemic invasion of the host plant by the tumor-inducing bacterium, Pseudomonas savastanoi. Phytopathology 1964, 54, 576–579. [Google Scholar]
  18. Quesada, J.M.; Penyalver, R.; Pérez-Panadés, J.; Salcedo, C.I.; Carbonell, E.A.; López, M.M. Comparison of chemical treatments for reducing epiphytic Pseudomonas savastanoi pv. savastanoi populations and for improving subsequent control of olive knot disease. Crop Prot. 2010, 29, 1413–1420. [Google Scholar]
  19. PM 4/17 (3) Certification scheme for olive trees and rootstocks. EPPO Bull. 2022, 52, 590–601. [CrossRef]
  20. Commission Implementing Directive 2014/98/EU. Implementing Council Directive 2008/90/EC as Regards Specific Requirements for the Genus and Species of Fruit Plants Referred to in Annex I thereto, Specific Requirements to be Met by Suppliers and Detailed Rules Concerning Official Inspections. 2020. Available online: https://eur-lex.europa.eu/legal-content/EN/TXT/?uri=CELEX:02014L0098-20200216 (accessed on 20 May 2025).
  21. Janse, J.D. Pathovar discrimination within Pseudomonas syringae subsp. savastanoi using whole cell fatty acids and pathogenicity as criteria. Syst. Appl. Microbiol. 1991, 14, 79–84. [Google Scholar] [CrossRef]
  22. Surico, G.; Lavermicocca, P. A semiselective medium for the isolation of Pseudomonas syringae pv. savastanoi. Phytopathology 1989, 79, 185–190. [Google Scholar] [CrossRef]
  23. Young, J.; Triggs, C. Evaluation of determinative tests for pathovars of Pseudomonas syringae van hall 1902. J. Appl. Bacteriol. 1994, 77, 195–207. [Google Scholar] [CrossRef]
  24. Casano, F.J.; Hung, S.Y.; Wells, J.M. Differentiation of some pathovars of Pseudomonas syringae with monoclonal antibodies1. EPPO Bull. 1987, 17, 173–176. [Google Scholar] [CrossRef]
  25. Tegli, S.; Pastacaldi, C. Specific detection of Pseudomonas savastanoi pathovars: From end-point PCR to real-time PCR and HRMA. In Plant Pathology: Method and Protocols; Springer: Berlin/Heidelberg, Germany, 2022; pp. 263–272. [Google Scholar]
  26. Penyalver, R.; García, A.; Ferrer, A.; Bertolini, E.; López, M.M. Detection of Pseudomonas savastanoi pv. savastanoi in olive plants by enrichment and PCR. Appl. Environ. Microbiol. 2000, 66, 2673–2677. [Google Scholar]
  27. Tegli, S.; Cerboneschi, M.; Libelli, I.M.; Santilli, E. Development of a versatile tool for the simultaneous differential detection of Pseudomonas savastanoi pathovars by end point and real-time PCR. BMC Microbiol. 2010, 10, 156. [Google Scholar] [CrossRef]
  28. Bertolini, E.; Penyalver, R.; García, A.; Olmos, A.; Quesada, J.M.; Cambra, M.; López, M.M. Highly sensitive detection of Pseudomonas savastanoi pv. savastanoi in asymptomatic olive plants by nested-PCR in a single closed tube. J. Microbiol. Methods 2003, 52, 261–266. [Google Scholar]
  29. Bertolini, E.; Olmos, A.; Lopez, M.M.; Cambra, M. Multiplex nested reverse transcription-polymerase chain reaction in a single tube for sensitive and simultaneous detection of four rna viruses and Pseudomonas savastanoi pv. savastanoi in olive trees. Phytopathology 2007, 93, 286–292. [Google Scholar] [CrossRef]
  30. Gori, A.; Cerboneschi, M.; Tegli, S.; Zhang, Z. High-resolution melting analysis as a powerful tool to discriminate and genotype Pseudomonas savastanoi pathovars and strains. PLoS ONE 2012, 7, e30199. [Google Scholar] [CrossRef] [PubMed]
  31. Dreo, T.; Pirc, M.; Ramšak, Ž.; Pavšič, J.; Milavec, M.; Žel, J.; Gruden, K. Optimising droplet digital PCR analysis approaches for detection and quantification of bacteria: A case study of fire blight and potato brown rot. Anal. Bioanal. Chem. 2014, 406, 6513–6528. [Google Scholar] [CrossRef] [PubMed]
  32. Dupas, E.; Legendre, B.; Olivier, V.; Poliakoff, F.; Manceau, C.; Cunty, A. Comparison of Real-Time PCR and Droplet Digital PCR for the detection of Xylella fastidiosa in plants. J. Microbiol. Methods 2019, 162, 86–95. [Google Scholar] [CrossRef]
  33. Pucci, N.; Scala, V.; Tatulli, G.; L’Aurora, A.; Lucchesi, S.; Salustri, M.; Loreti, S. Intra-laboratory evaluation of dna extraction methods and assessment of a droplet digital pcr for the detection of Xanthomonas citri pv. citri on different citrus species. Int. J. Mol. Sci. 2022, 23, 4975. [Google Scholar]
  34. Zhao, Y.; Xia, Q.; Yin, Y.; Wang, Z.; He, Y.-W. Comparison of droplet digital pcr and quantitative pcr assays for quantitative detection of Xanthomonas citri subsp. citri. PLoS ONE 2016, 11, e0159004. [Google Scholar] [CrossRef]
  35. Morisset, D.; Štebih, D.; Milavec, M.; Gruden, K.; Žel, J.; Heazlewood, J.L. Quantitative analysis of food and feed samples with droplet digital PCR. PLoS ONE 2013, 8, e62583. [Google Scholar] [CrossRef] [PubMed]
  36. Blaya, J.; Lloret, E.; Santísima-Trinidad, A.; Ros, M.; Pascual, J. Molecular methods (digital PCR and real-time PCR) for the quantification of low copy dna of Phytophthora nicotianae in environmental samples. Pest. Manag. Sci. 2016, 72, 747–753. [Google Scholar] [CrossRef]
  37. Amoia, S.S.; Minafra, A.; Ligorio, A.; Cavalieri, V.; Boscia, D.; Saponari, M.; Loconsole, G. Detection of Xylella fastidiosa in host plants and insect vectors by droplet digital PCR. Agriculture 2023, 13, 716. [Google Scholar] [CrossRef]
  38. Voegel, T.; Nelson, L. Quantification of Agrobacterium vitis from grapevine nursery stock and vineyard soil using droplet digital PCR. PLant Dis. 2018, 102, 2136–2141. [Google Scholar] [CrossRef]
  39. Rački, N.; Dreo, T.; Gutierrez-Aguirre, I.; Blejec, A.; Ravnikar, M. Reverse transcriptase droplet digital PCR shows high resilience to PCR inhibitors from plant, soil and water samples. Plant Methods 2014, 10, 42. [Google Scholar] [CrossRef]
  40. Varympopi, A.; Dimopoulou, A.; Theologidis, I.; Karamanidou, T.; Kaldeli Kerou, A.; Vlachou, A.; Karfaridis, D.; Papafotis, D.; Hatzinikolaou, D.G.; Tsouknidas, A.; et al. Bactericides based on copper nanoparticles restrain growth of important plant pathogens. Pathogens 2020, 9, 1024. [Google Scholar] [CrossRef]
  41. Baldassarre, F.; Schiavi, D.; Di Lorenzo, V.; Biondo, F.; Vergaro, V.; Colangelo, G.; Balestra, G.M.; Ciccarella, G. Cellulose Nanocrystal-based emulsion of thyme essential oil: Preparation and characterisation as sustainable crop protection tool. Molecules 2023, 28, 7884. [Google Scholar] [CrossRef]
  42. Košćak, L.; Lamovšek, J.; Đermić, E.; Godena, S. The antibacterial effect of selected essential oils and their bioactive constituents on Pseudomonas savastanoi pv. savastanoi: Phytotoxic properties and potential for future olive disease control. Microorganisms 2023, 11, 2735. [Google Scholar] [CrossRef] [PubMed]
  43. Demeke, T.; Jenkins, G.R. Influence of DNA extraction methods, pcr inhibitors and quantification methods on real-time PCR assay of biotechnology-derived traits. Anal. Bioanal. Chem. 2010, 396, 1977–1990. [Google Scholar] [CrossRef]
  44. Hedman, J.; Rådström, P. Overcoming inhibition in real-time diagnostic PCR. In PCR Detection of Microbial Pathogens; Springer: Berlin/Heidelberg, Germany, 2013; pp. 17–48. [Google Scholar]
  45. Morley, A.A. Digital PCR: A Brief History. Biomol. Detect. Quantif. 2014, 1, 1–2. [Google Scholar] [CrossRef]
  46. Lovera, A.; Rodríguez, E.; Simbaqueba, J.; Burbano-David, D.; Carmona, S.L.; Izquierdo-García, L.F.; Gómez-Correa, J.C.; Leon-Pacheco, R.I.; Parra-Fuentes, M.; Rodríguez-Yzquierdo, G.; et al. Development and application of a droplet digital PCR assay for the detection of Fusarium oxysporum f. sp. cubense tropical race 4 from different biological samples. Plant Pathol. 2024, 73, 342–354. [Google Scholar] [CrossRef]
  47. Pérez-Martínez, I.; Rodríguez-Moreno, L.; Lambertsen, L.; Matas, I.M.; Murillo, J.; Tegli, S.; Jiménez, A.J.; Ramos, C. Fate of a Pseudomonas savastanoi pv. savastanoi type iii secretion system mutant in olive plants (Olea europaea L.). Appl. Environ. Microbiol. 2010, 76, 3611–3619. [Google Scholar] [CrossRef] [PubMed]
  48. PM 7/98 (5) Specific requirements for laboratories preparingaccreditation for a plant pest diagnostic activity. EPPO Bull. 2021.
Figure 1. ddPCR optimization: (A) The solid pink line represents the threshold, with blue droplets above considered positive, indicating PCR amplification, and grey droplets below considered negative, indicating no amplification. The red box indicates the optimal annealing temperature. Eight ddPCR reactions, each with the same amount of target DNA, are separated by vertical dotted yellow lines. The reactions were performed across an annealing temperature gradient of 51 °C, 51.6 °C, 54.5 °C, 55.4 °C, 56.7 °C, 58.5 °C, 59.5 °C, and 60 °C. (B) ddPCR linear correlation graph illustrating the relationship between the detected DNA target concentration (y-axis) and the reaction DNA volume (x-axis).
Plants 14 01831 g001
Figure 2. Correlation analysis of qPCR and ddPCR results for F-PELLET (A) and F-24hE (B) preparations. The solid line represents the linear regression line. The dashed lines indicate the 95% confidence interval of the regression.
Plants 14 01831 g002
Figure 3. Map of Italian regions included in the sampling; the dots indicate the sampling regions.
Plants 14 01831 g003
Table 1. Curve information for 103 spiked samples and the correlation between qPCR—ddPCR.
SamplesCurve EquationR2Correlationp-Value
External washy = 0.03x + 0.2250.410.640.35
PELLETy = 7.05x + 2.420.99690.99840.0016 **
Enrichment 24 hy = 597x − 3480.96370.98170.0016 **
Bacterial DNAy = 32.27x − 13.630.9770.98840.0116 *
* p-value < 0.05; ** p-value < 0.02.
Table 2. Analytical specificity tested on several target and non-target bacterial strains (+ and − refer to test results).
Bacterial SpeciesHostqPCR 1ddPCR 2
Pseudomonas savastanoi pv. savastanoiOlea europaea++
Pseudomonas savastanoi pv. savastanoiNerium oleander++
Pseudomonas savastanoi pv. savastanoiPunica granatum++
EpiphytesOlea europaea
Pantoea agglomeransCucumis melo
Pseudomonas marginalis pv. marginalisOlea europaea
Pseudomonas syringae pv. syringaeActinidia chinensis
Pseudomonas syringae pv. actinidiaeActinidia deliciosa
Pseudomonas viridifavaActinidia chinensis
Pantoea agglomerans-likeOlea europaea
Xylella fastidiosa subsp. paucaOlea europaea
Xylella fastidiosa subsp. multiplexPrunus amygdalus
Xanthomonas arboricola pv. juglandisJuglans regia
Erwinia nigrifluensJuglans regia
Pseudomonas syringae pv. glycineaGlycine max
Xanthomonas campestris pv. pelargoniPelargonium
Erwinia billingiaePyrus comunis
Xanthomonas arboricola pv. corylinaCorylus avellana
Pseudomonas savastanoi pv. neriiNerium oleander
Pseudomonas avellanaeCorylus avellana
Xanthomonas arboricola pv. pruniPrunus persica
Agrobacterium vitisVitis vinifera
1 qPCR of Tegli et al. 2010 [27]; 2 This work.
Table 3. Analytical sensitivity of spiked samples obtained by qPCR and ddPCR. The LOD values for each method are shown in bold.
S-EWS-PELLETS-24hES-48hE
CFU/mLqPCR 1ddPCR 2qPCR 1ddPCR 2qPCR 1ddPCR 2qPCR 1ddPCR 2
1 × 10434.9 ± 0.47 a (9) b5.46 ± 0.44 c (3) d28.3 ± 0.53 (9)N.P. e25.5 ± 0.27 (9)N.P. e18.6 ± 0.84 (9)N.P. e
1 × 10338.5 ± 1.07 (7) 0.47 ± 0.44 (2)31.9 ± 0.65 (9)57.9 ± 20.7 (3)29.5 ± 0.99 (9)3342 ± 2169 (3)20.7 ± 2.5 (9)Saturated
1 × 10238.7 ± 0.81 (3)0.32 ± 0.38 (2)33.1 ± 0.72 (9)9.25 ± 3.78 (3)34.9 ± 1.24 (9)1444 ± 858 (3)20.6 ± 2.39 (9)Saturated
1 × 101N.A.(0)N.A.(0)35.8 ± 0.41 (9)1.26 ± 0.80 (3)N.A.(0)2232 ± 446 (3)20.5 ± 1.08 (9)Saturated
Healty matrixN.A. f(0)N.A. f (0)N.A. f (0)N.A. f (0)N.A. f (0)N.A. f (0)N.A. f (0)N.A. f (0)
1 qPCR of Tegli et al. 2010 [27]; 2 this work; a average Ct values ± Standard Deviation (SD); b number of positive replicates on 9 replicates analysed; c average target concentration per well ± Standard Deviation (SD); d number of positive replicates on 3 replicates analysed; e N.P., not performed; f N.A., not assigned;
Table 4. Positive samples obtained in qPCR and in ddPCR on a total of 100 analysed samples, for both F-PELLET and F-24hE preparations. The results are reported in percentage (%).
qPCR 1ddPCR 2
F-PELLET1934
F-24hE322
1 qPCR of Tegli et al. 2010 [27]; 2 This work.
Table 5. Percentage of positive samples obtained by qPCR and ddPCR for F-PELLET and F-24hE samples in April–May and October–November sampling periods.
qPCR 1ddPCR 2
April/May
F-PELLET1240
F-24hE431
October/November
F-PELLET2026
F-24hE213
1 qPCR of Tegli et al. 2010 [27]; 2 This work.
Table 6. Locations and GPS coordinates of the field sampling sites.
Italian RegionLocationGPS Coordinates (Lat/Long)
UmbriaNarni42.47861° N, 12.48934° E
LazioTarquinia42.25057° N, 11.76567° E
LazioCanale Monterano42.12377° N, 12.09327° E
PugliaGalatone40.13748° N, 18.04628° E
PugliaMolfetta41.18308° N, 16.57006° E
CalabriaRende39.36627° N, 16.22841° E
Table 7. Bacterial strains used in this work.
Bacterial SpeciesCollection NumberHostYear of IsolationCountries of Isolation
Pseudomonas savastanoi pv. savastanoiCREA-DC 1918Olea europaea2018Italy
Pseudomonas savastanoi pv. savastanoiNCPPB 3869Nerium oleander1985Italy
Pseudomonas savastanoi pv. savastanoiCREA-DC 2031Punica granatum2021Italy
EpiphytesCREA-DC 1936Olea europaea2019Italy
Pantoea agglomeransCFBP 6915Cucumis melo1993Brazil
Pseudomonas marginalis pv. marginalisCREA-DC 1229Olea europaea2001Italy
Pseudomonas syringae pv. syringaeCREA-DC 1231Actinidia chinensis2001Italy
Pseudomonas syringae pv. actinidiaeCREA-DC 1463Actinidia deliciosa2009Italy
Pseudomonas viridifavaCREA-DC 1819Actinidia chinensis2010Italy
Pantoea agglomerans-likeCREA-DC 1947Olea europaea2019Italy
Xylella fastidiosa subsp. paucaCFBP 8402Olea europaea2014Italy
Xylella fastidiosa subsp. multiplexCFBP 8730Prunus amygdalus2019Italy
Xanthomonas arboricola pv. juglandisCREA-DC 1020Juglans regia1992New Zealand
Erwinia nigrifluensNCPPB 564Juglans regia1958USA
Pseudomonas syringae pv. glycineaIPV-BO-2116Glycine max1985Italy
Xanthomonas campestris pv. pelargoniiCREA-DC 1234Pelargonium2001Italy
Erwinia billingiaeNCPPB 661Pyrus comunis1958UK
Xanthomonas arboricola pv. corylinaNCPPB 3870Corylus avellana1991Italy
Pseudomonas savastanoi pv. neriiITM 306Nerium oleandern.i.Italy
Pseudomonas avellanaeCREA-DC 1110Corylus avellana1998Italy
Xanthomonas arboricola pv. pruniCREA-DC 1224Prunus persica2001Italy
Agrobacterium vitisCREA-DC 1822Vitis vinifera2013Italy
n.i.,not indicated. CREA-DC, Consiglio per la Ricerca in Agricoltura, Centro di Ricerca per la Difesa e la Certificazione, Roma, Italy; NCPPB, National Collection of Plant Pathogenic Bacteria, York, UK; CFBP, Collection Française de Bactéries Phytopathogènes, INRA, Angers, France; ITM, Culture collection of Istituto Tossine e Micotossine da Parassiti vegetali, C.N.R., Bari, Italy; IPV-BO, Culture Collection of Istituto di Patologia Vegetale, Università di Bologna, Italy.
Disclaimer/Publisher’s Note: The statements, opinions and data contained in all publications are solely those of the individual author(s) and contributor(s) and not of MDPI and/or the editor(s). MDPI and/or the editor(s) disclaim responsibility for any injury to people or property resulting from any ideas, methods, instructions or products referred to in the content.

