Article

Integrative Physiological and Transcriptomic Analysis Reveals Metabolic Adaptation and Cold-Tolerance Marker Development in Winter Rye Under Low-Temperature Stress

1
Key Laboratory of Molecular Cell Genetics and Genetic Breeding in Heilongjiang Province, College of Life Science and Technology, Harbin Normal University, Harbin 150025, China
2
Heilongjiang Provincial Laboratory of Plant Physiology, College of Life Science and Technology, Harbin Normal University, Harbin 150025, China
3
Beijing Key Laboratory of Crop Molecular Design and Intelligent Breeding, Beijing Key Laboratory of Molecular Genetics in Hybrid Wheat, Institute of Hybrid Wheat Beijing Academy of Agriculture and Forestry Sciences, Beijing 100097, China
*
Authors to whom correspondence should be addressed.
These authors contributed equally to this work.
Plants 2025, 14(11), 1588; https://doi.org/10.3390/plants14111588
Submission received: 9 April 2025 / Revised: 14 May 2025 / Accepted: 20 May 2025 / Published: 23 May 2025

Abstract

Rye (Secale cereale), a cereal crop with high cold tolerance, serves as an ideal model for investigating plant cold adaptation mechanisms. Despite recent progress in identifying numerous genes and metabolic changes associated with cold tolerance, the detailed regulatory networks and coordinated interactions between metabolic pathways under low-temperature stress in rye remain unclear. In this study, we focused on the winter rye variety “Winter” and systematically explored its metabolic regulatory responses to cold stress through a combination of low-temperature treatments, phenotypic observations, antioxidant enzyme activity assays, and transcriptomic analysis. Four rye varieties (“Winter”, HZHM3, HZHM8, and “Victory”) were compared for cold tolerance, with the results indicating that “Winter” and HZHM3 exhibit superior cold tolerance. Physiological analysis revealed that after 12 h of exposure to −4 °C, the activities of catalase (CAT), peroxidase (POD), and ascorbate peroxidase (APX) in “Winter” were significantly upregulated, displaying an initial increase followed by a decline over time. Transcriptomic sequencing identified 1643 differentially expressed genes (DEGs), and GO, KEGG, and GSEA enrichment analyses highlighted the critical roles of carbohydrate metabolism (ko00630) and amino acid metabolism (ko00250) pathways in the cold stress response. These pathways are interconnected through key metabolic intermediates such as L-glutamate, collectively regulating cold adaptation. Furthermore, based on the transcriptomic data, we identified and developed molecular markers associated with cold tolerance, detecting 10,846 EST-SSR and 250,116 EST-SNP markers. We successfully developed 13 EST-SSR primer pairs applicable to rye and 7 KASP markers. Notably, the KASP-665 marker effectively distinguishes between winter and spring rye, providing a reliable tool for marker-assisted selection in cold tolerance breeding. This study not only elucidates the metabolic regulatory mechanisms of rye under low-temperature stress but also provides a solid theoretical and technical foundation for future cold-tolerance breeding programs.

1. Introduction

Low temperature is a critical abiotic stress factor that severely restricts plant development and crop yield [1,2]. Exposure to low temperatures reduces enzyme activities and slows metabolic processes, thereby disrupting cellular homeostasis and ultimately leading to yield loss. In response to cold stress, plants undergo a series of physiological adjustments, including modifications in membrane composition to optimize substance transport and energy metabolism, an increase in reactive oxygen species (ROS) levels that triggers oxidative stress, and alterations in antioxidant enzyme activities (such as SOD and POD) to mitigate ROS damage [3,4]. For instance, rice seedlings exposed to low temperatures of 10–12 °C show a rapid increase in SOD and POD activities during the initial phase of stress, while barley exhibits a marked upregulation of these enzymes under conditions ranging from −2 °C to 2 °C, although POD activity may decline as stress intensifies [5,6]. Similar adaptive mechanisms have been observed in maize and other crops.
In recent years, the advent of RNA-sequencing technology has enabled a comprehensive analysis of gene expression changes in plants under cold stress [7,8]. This approach not only captures protein-coding mRNAs but also includes various non-coding RNAs and splice variants, providing a robust tool for elucidating regulatory networks and molecular mechanisms underlying cold tolerance [9,10]. Moreover, high-throughput sequencing has significantly advanced the development of functional molecular markers—such as EST-SSR, EST-SNP, and KASP markers—which are crucial for assessing genetic diversity and facilitating marker-assisted breeding [11,12].
Rye (Secale cereale), known for its superior cold tolerance, serves as an ideal model for investigating plant cold adaptation mechanisms. Recent studies on cold tolerance in rye have yielded significant insights; for example, transcriptomic analyses under low-temperature stress have revealed critical roles for the CBF (C-repeat binding factor) transcription factor family and their downstream COR (Cold-regulated) genes, along with notable alterations in carbohydrate and amino acid metabolism [13,14]. However, the regulatory networks among these genes and the coordinated interactions between different metabolic pathways under cold stress remain incompletely understood.
In this study, we focus on the winter rye variety “Winter” and combine low-temperature treatments, phenotypic assessments, antioxidant enzyme activity assays, and transcriptomic analyses to systematically elucidate the metabolic regulatory mechanisms involved in cold response. Furthermore, we aim to develop molecular markers associated with cold tolerance. By comparing the cold tolerance of four rye varieties (“Winter”, HZHM3, HZHM8, and “Victory”), this work seeks to provide new insights into the comprehensive regulatory network of cold tolerance in rye and to support the advancement of marker-assisted breeding for cold-tolerant cereal crops.

2. Results

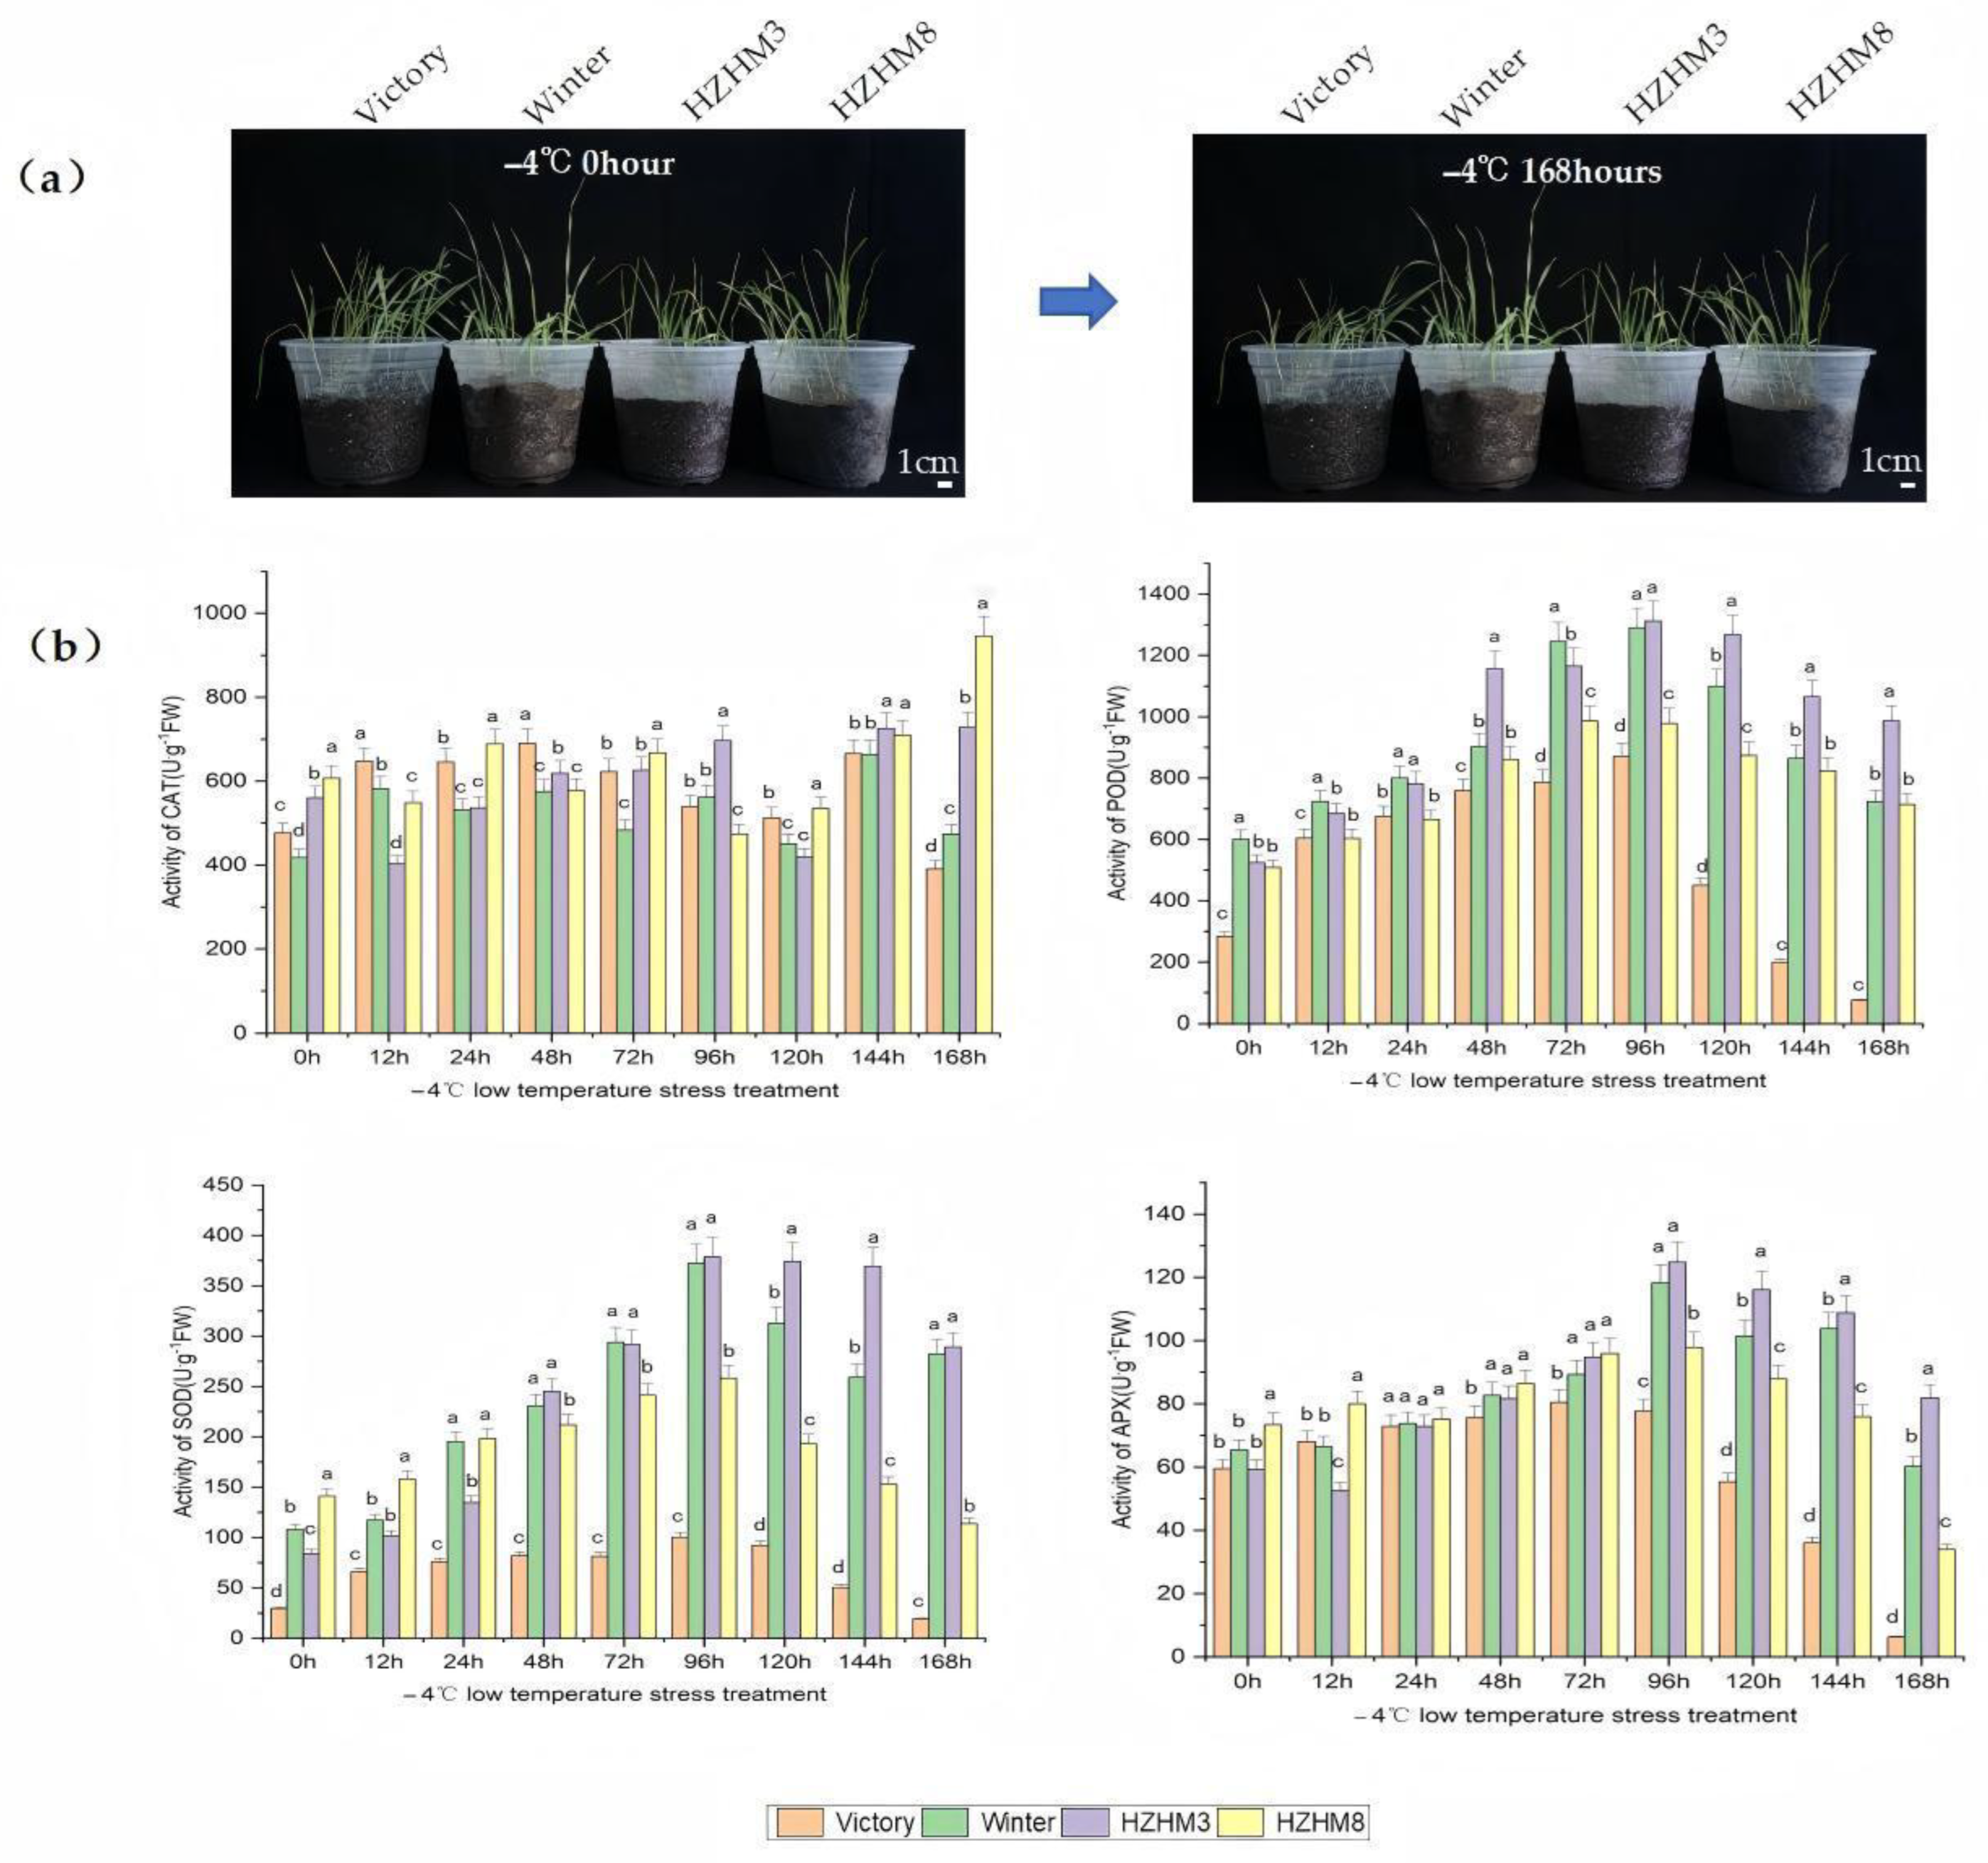
2.1. Physiological Responses and Cold Tolerance Evaluation of Different Rye Varieties Under Low-Temperature Stress

To evaluate the cold tolerance of four rye varieties—“Winter”, “Victory”, HZHM3, and HZHM8—this study analyzed their phenotypic changes and physiological responses under low-temperature stress, focusing on the activity dynamics of four key antioxidant enzymes: POD, SOD, CAT, and APX (Figure 1). The results showed that, except for “Victory”, which exhibited persistent wilting after 24 h of cold stress, the other three varieties displayed no significant phenotypic changes throughout the stress period (Figure 1a). In “Winter”, POD and APX activities remained stable at 12 h, while SOD, POD, CAT, and APX activities increased initially, peaking at 96 h before declining. The enzyme activity trends in HZHM3 were similar to those in “Winter” but slightly lower. Comprehensive analysis indicated that “Winter” and HZHM3 exhibited strong cold tolerance (Figure 1b). Overall, the three winter rye varieties (“Winter”, HZHM3, and HZHM8) demonstrated significantly higher cold tolerance than the spring rye variety “Victory”, particularly in terms of SOD activity. These findings provide physiological insights into rye cold tolerance and valuable references for breeding cold-resistant rye varieties.

2.2. Transcriptome Analysis and Differentially Expressed Gene Screening in “Winter” Rye Under −4 °C Low-Temperature Stress

Phenotypic and physiological analyses indicated that “Winter” rye exhibits strong cold tolerance under −4 °C low-temperature stress. To further investigate its cold tolerance mechanism, we conducted transcriptome sequencing to analyze gene expression profiles and relationships. Based on differential expression analysis, differentially expressed genes (DEGs) were identified, and their expression levels were examined. The filtered sequencing data for six samples are summarized in Table A1, showing that the quality of all clean reads exceeded 99.70%, indicating high data reliability. A total of 1643 DEGs were identified, including 863 upregulated and 780 downregulated genes (Figure 2).

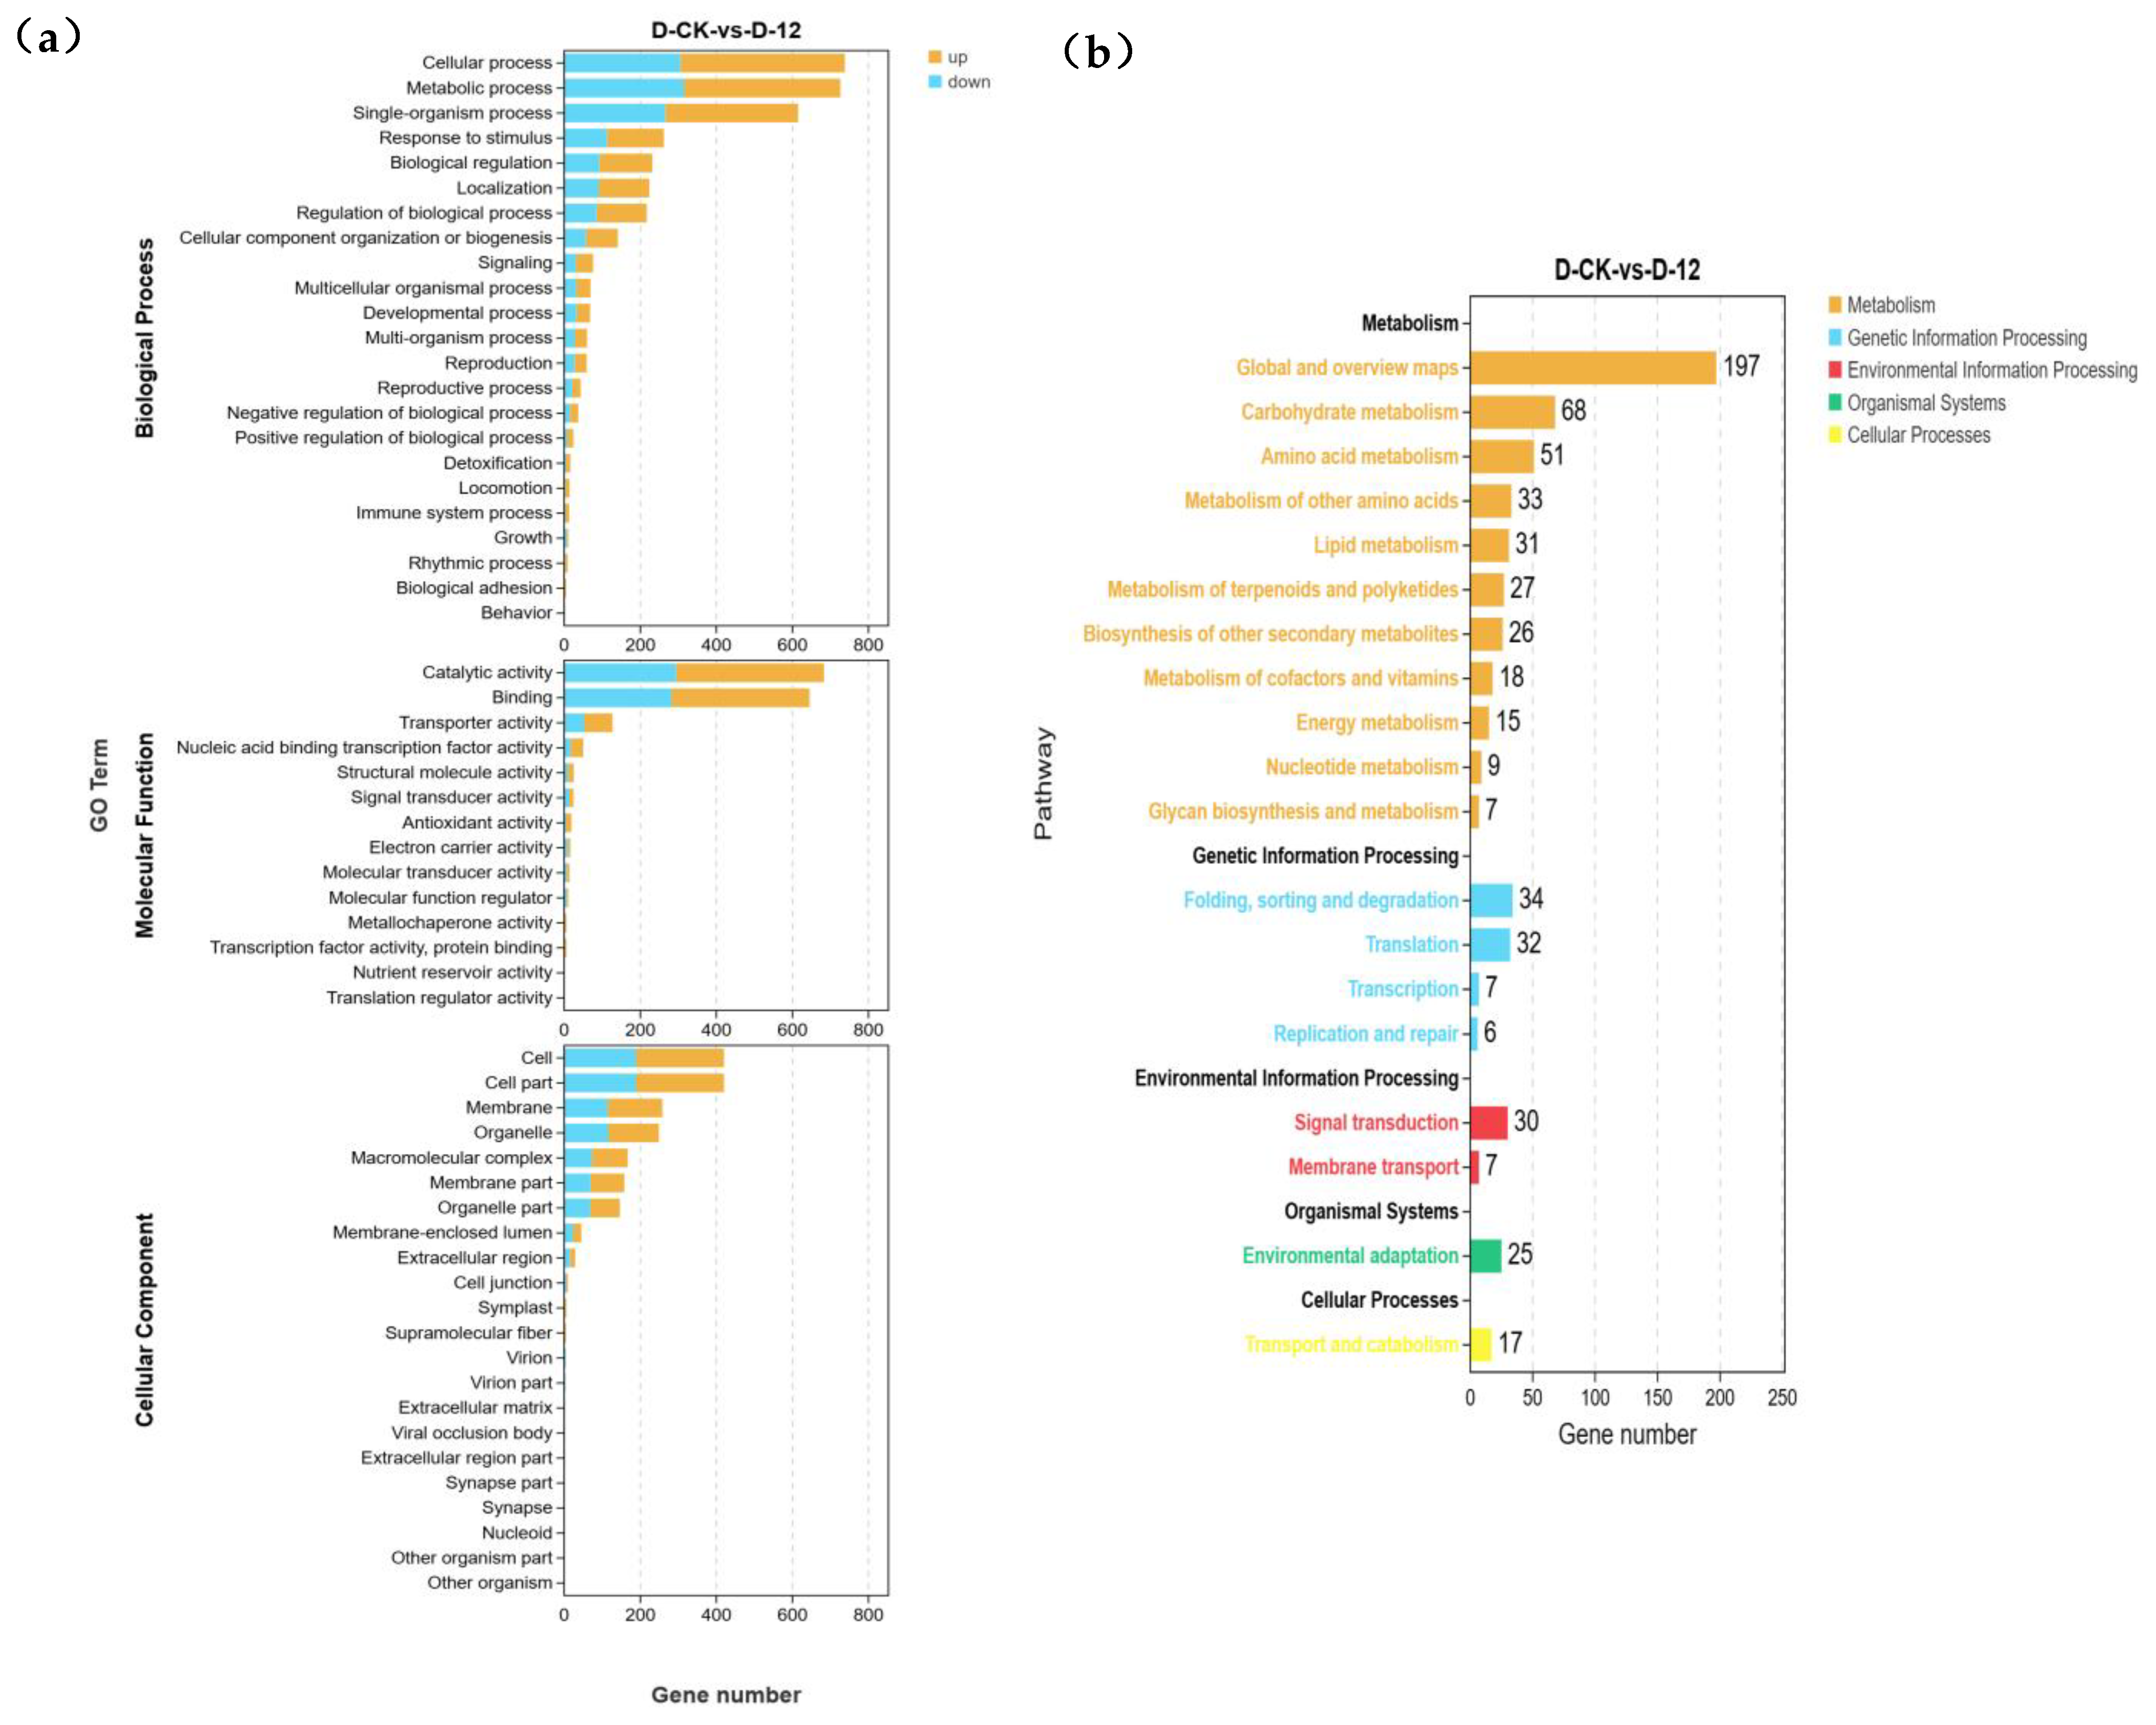
2.3. GO and KEGG Enrichment Analysis of Differentially Expressed Genes in “Winter” Rye Under Low-Temperature Stress

To further explore the functional roles of differentially expressed genes (DEGs) in “Winter” rye under low-temperature stress, we conducted Gene Ontology (GO) enrichment analysis (Figure 3a,b) and Kyoto Encyclopedia of Genes and Genomes (KEGG) enrichment analysis (Figure 3c,d). Figure 3a,b shows the overall GO annotations for the differentially expressed genes, covering a wide range of biological processes, cellular components, and molecular functions. In contrast, Figure 3c presents the top 20 GO terms based on the enrichment analysis results. These top 20 terms are selected from the broader set of GO annotations and are the ones that are most significantly enriched among the differentially expressed genes, providing a more focused view of the key biological functions affected by cold stress.
In the GO enrichment analysis, the most enriched biological process (BP) term was cellular process (GO:0009987), which included 432 upregulated and 306 downregulated DEGs, followed by metabolic process (GO:0008152). In the cellular component (CC) category, both cell (GO:0005623) and cell part (GO:0044464) exhibited an identical number of DEGs (420), indicating that these genes play roles in both cellular structures. In the KEGG enrichment analysis, 25 DEGs were identified, and they were primarily classified into two major pathways: circadian rhythm-plant (ko04712), with PRR genes predominantly enriched in this pathway, and plant–pathogen interaction (ko04626), with RBOHF genes being the main contributors.
Further examination of the top 20 KEGG pathways revealed that most of the DEGs were associated with metabolism, with a smaller subset enriched in environmental information processing pathways. Specifically, within metabolism, the pathways arginine and proline metabolism (ko00330), glyoxylate and dicarboxylate metabolism (ko00630), cyanoamino acid metabolism (ko00460), and alanine, aspartate, and glutamate metabolism (ko00250) showed the highest levels of enrichment. In the environmental information processing category, significant enrichment was observed in ABC transporters (ko02010) and the MAPK signaling pathway—plant (ko04016). These results provide important insights into the molecular mechanisms underlying “Winter” rye’s response to low-temperature stress and offer a foundation for further investigation into cold tolerance mechanisms.

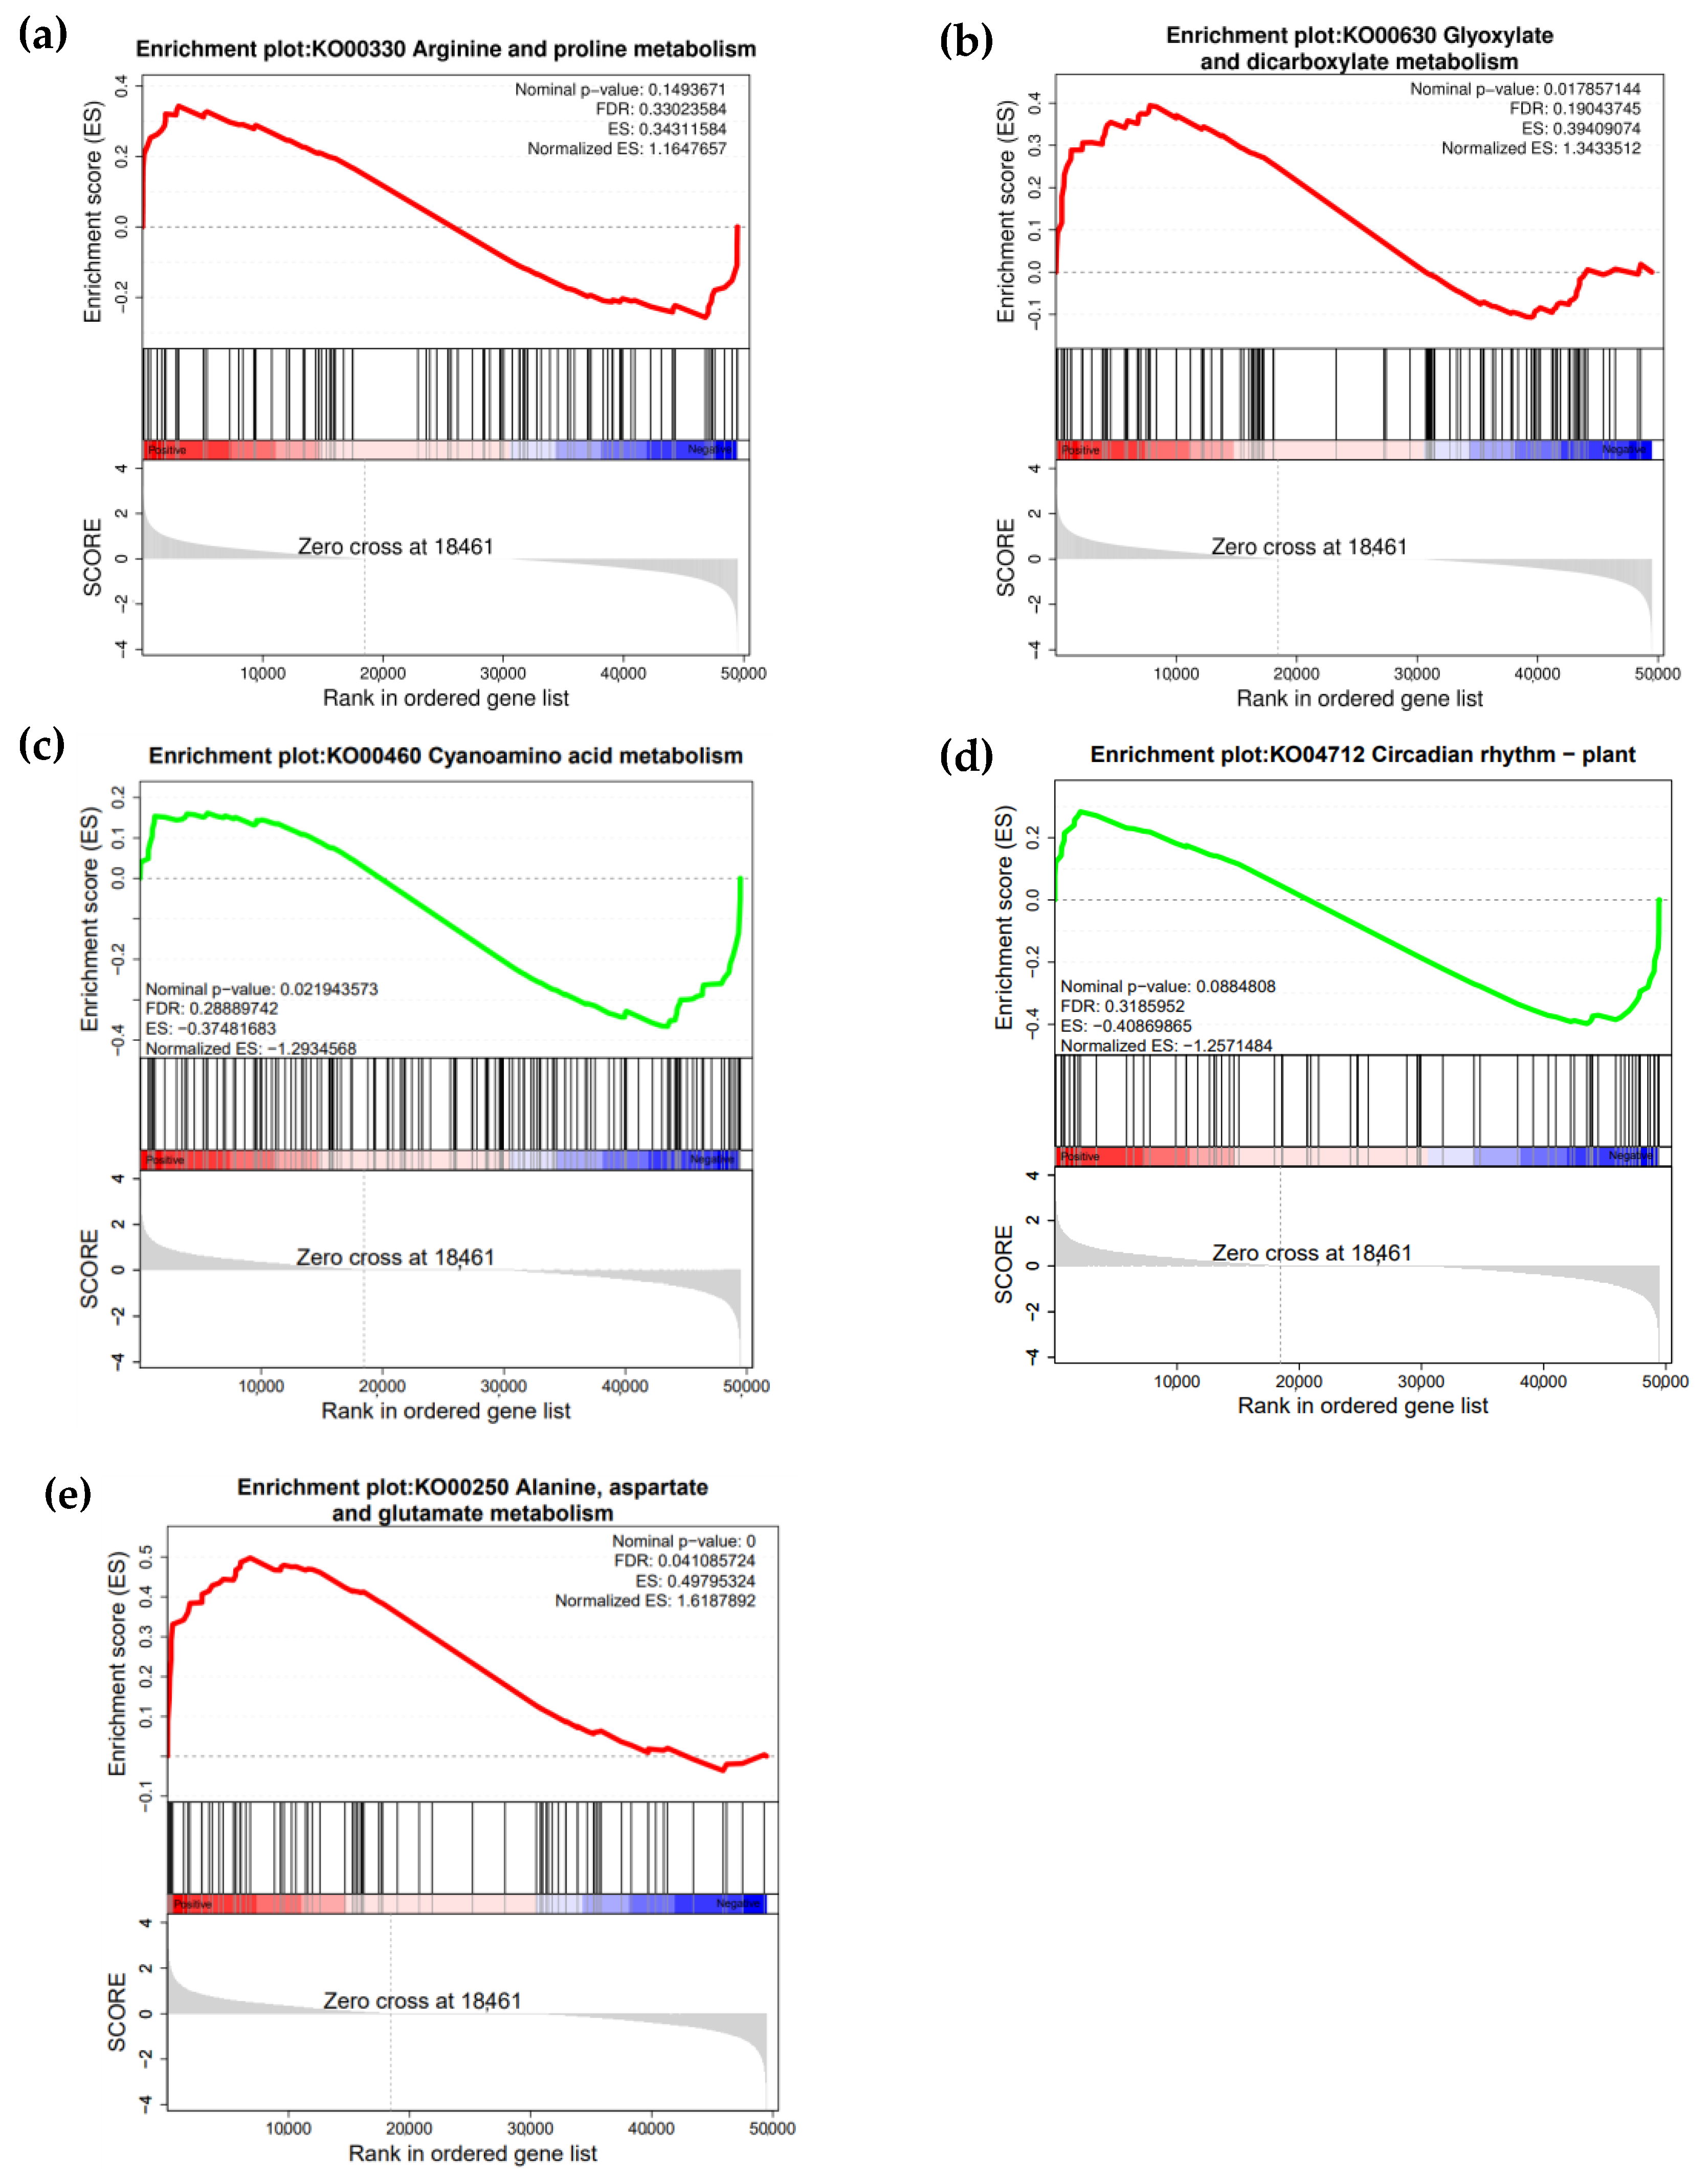
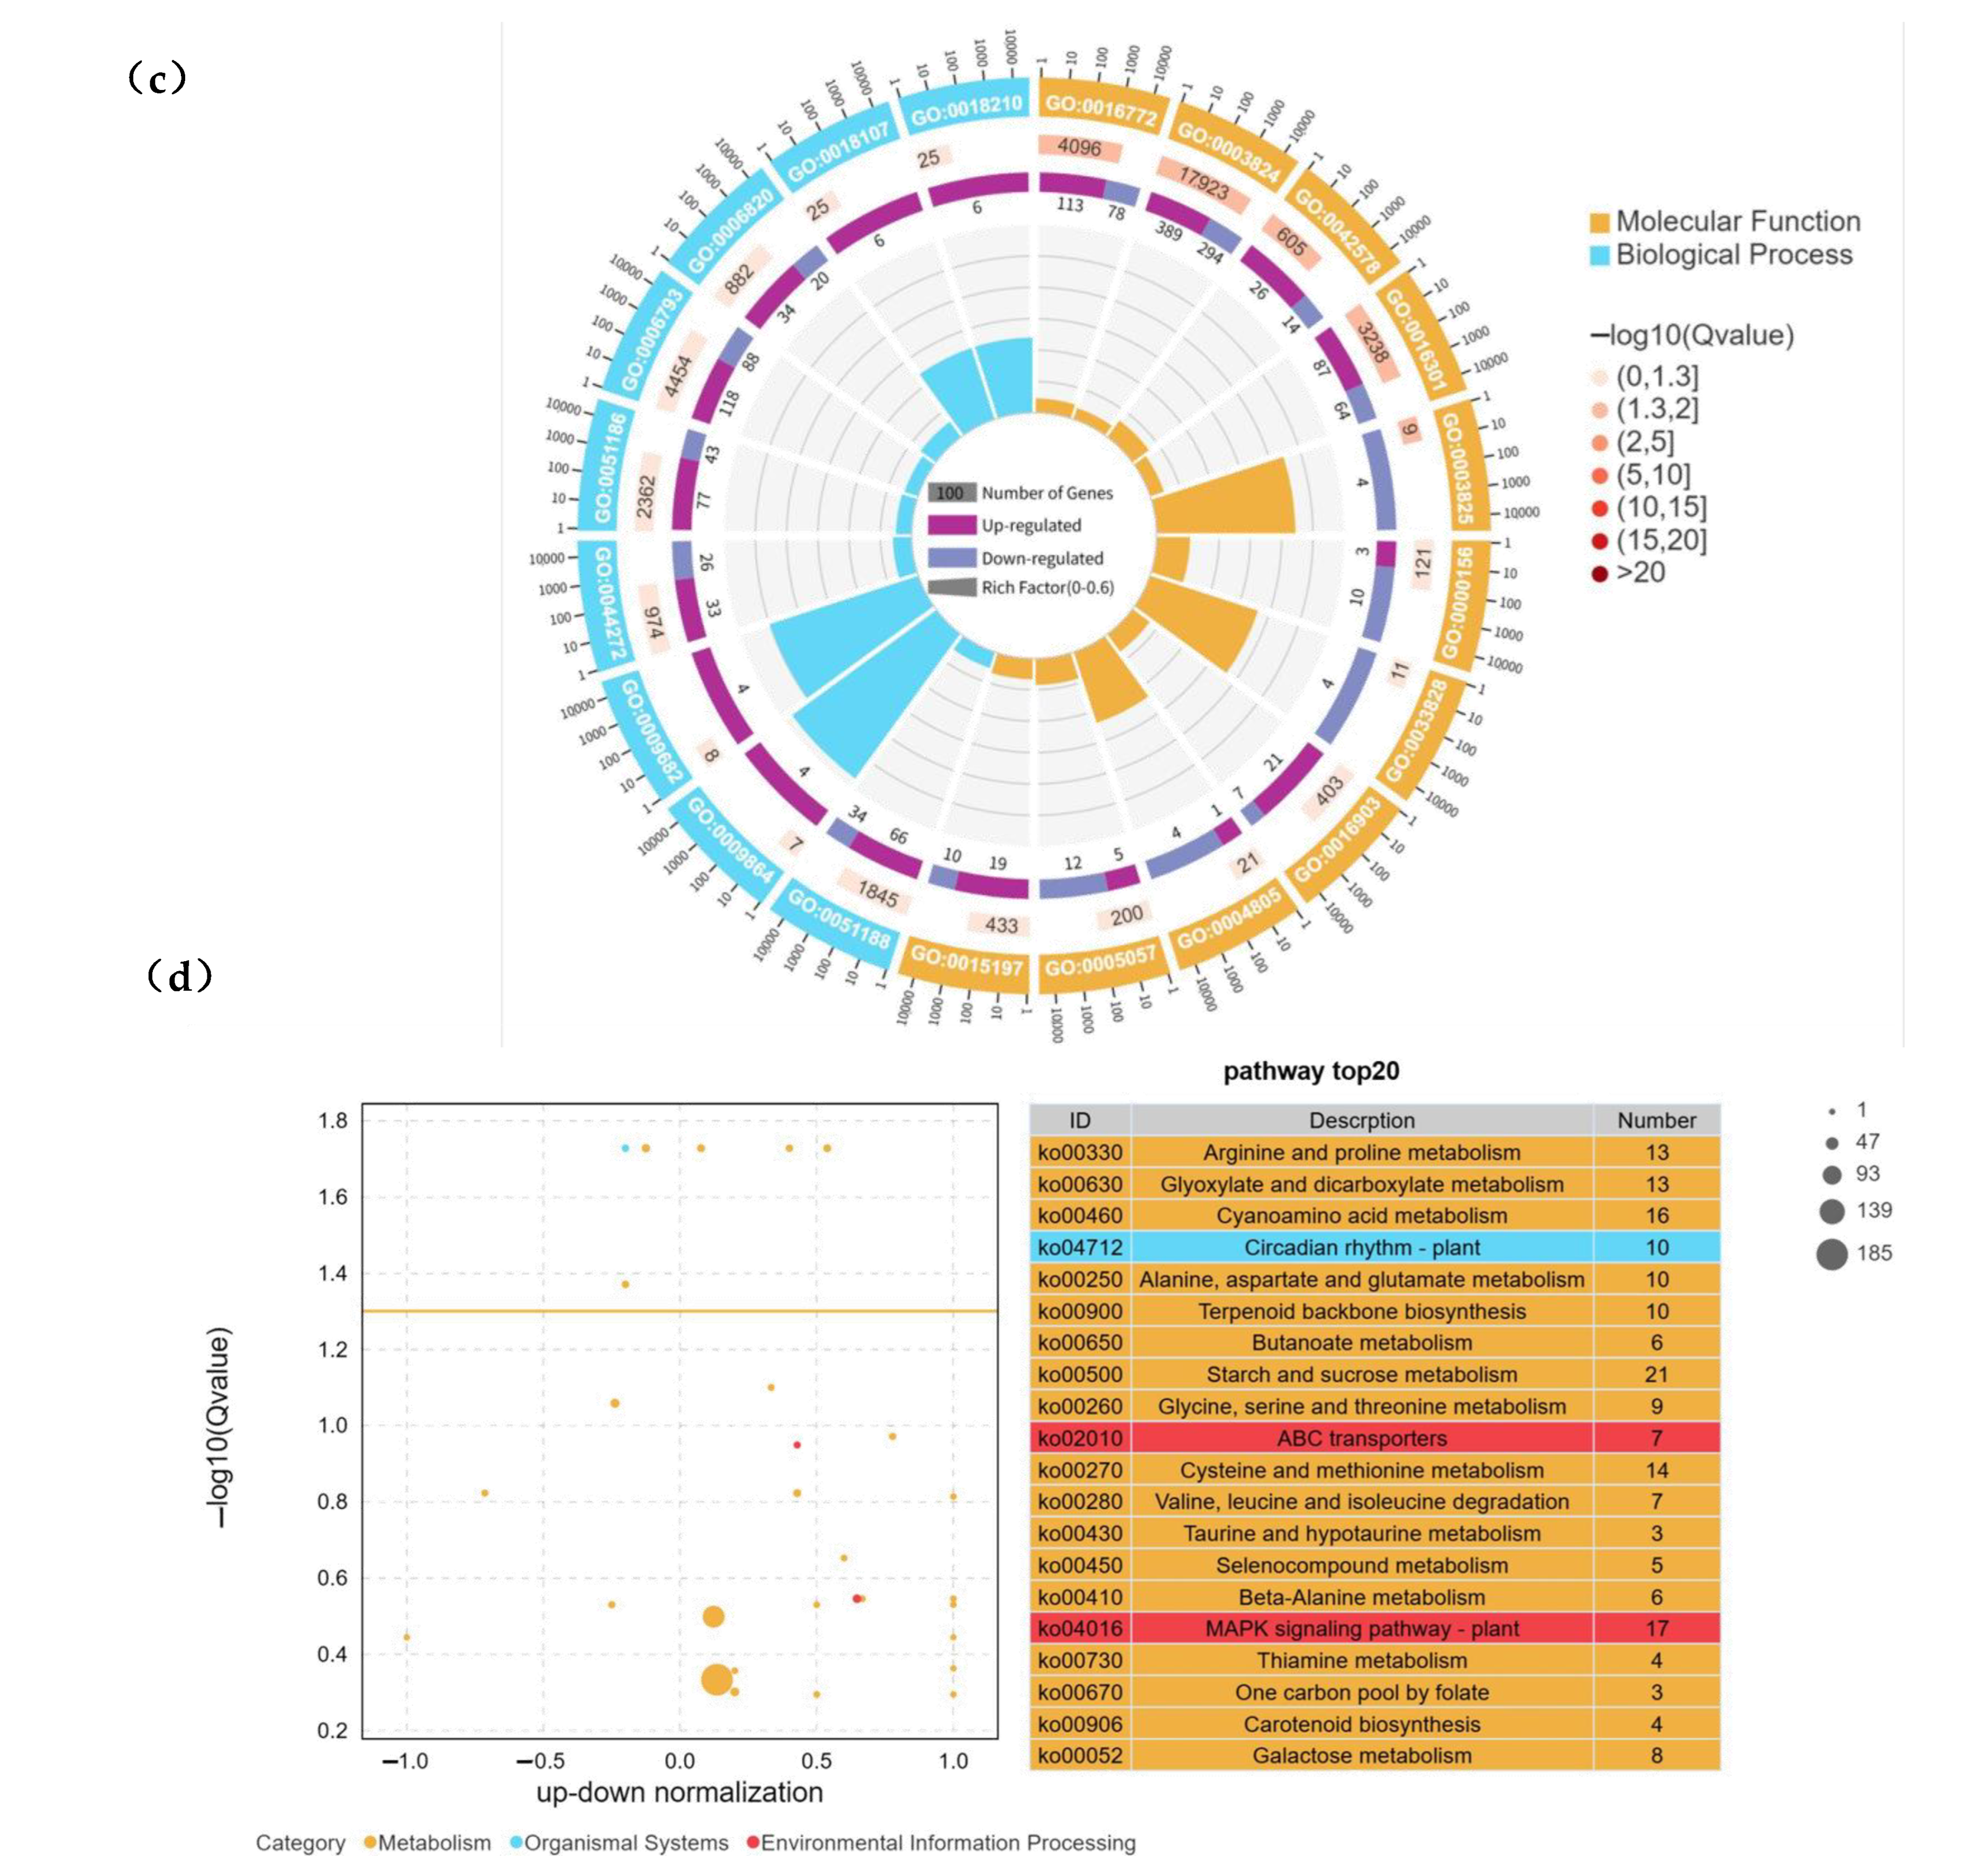
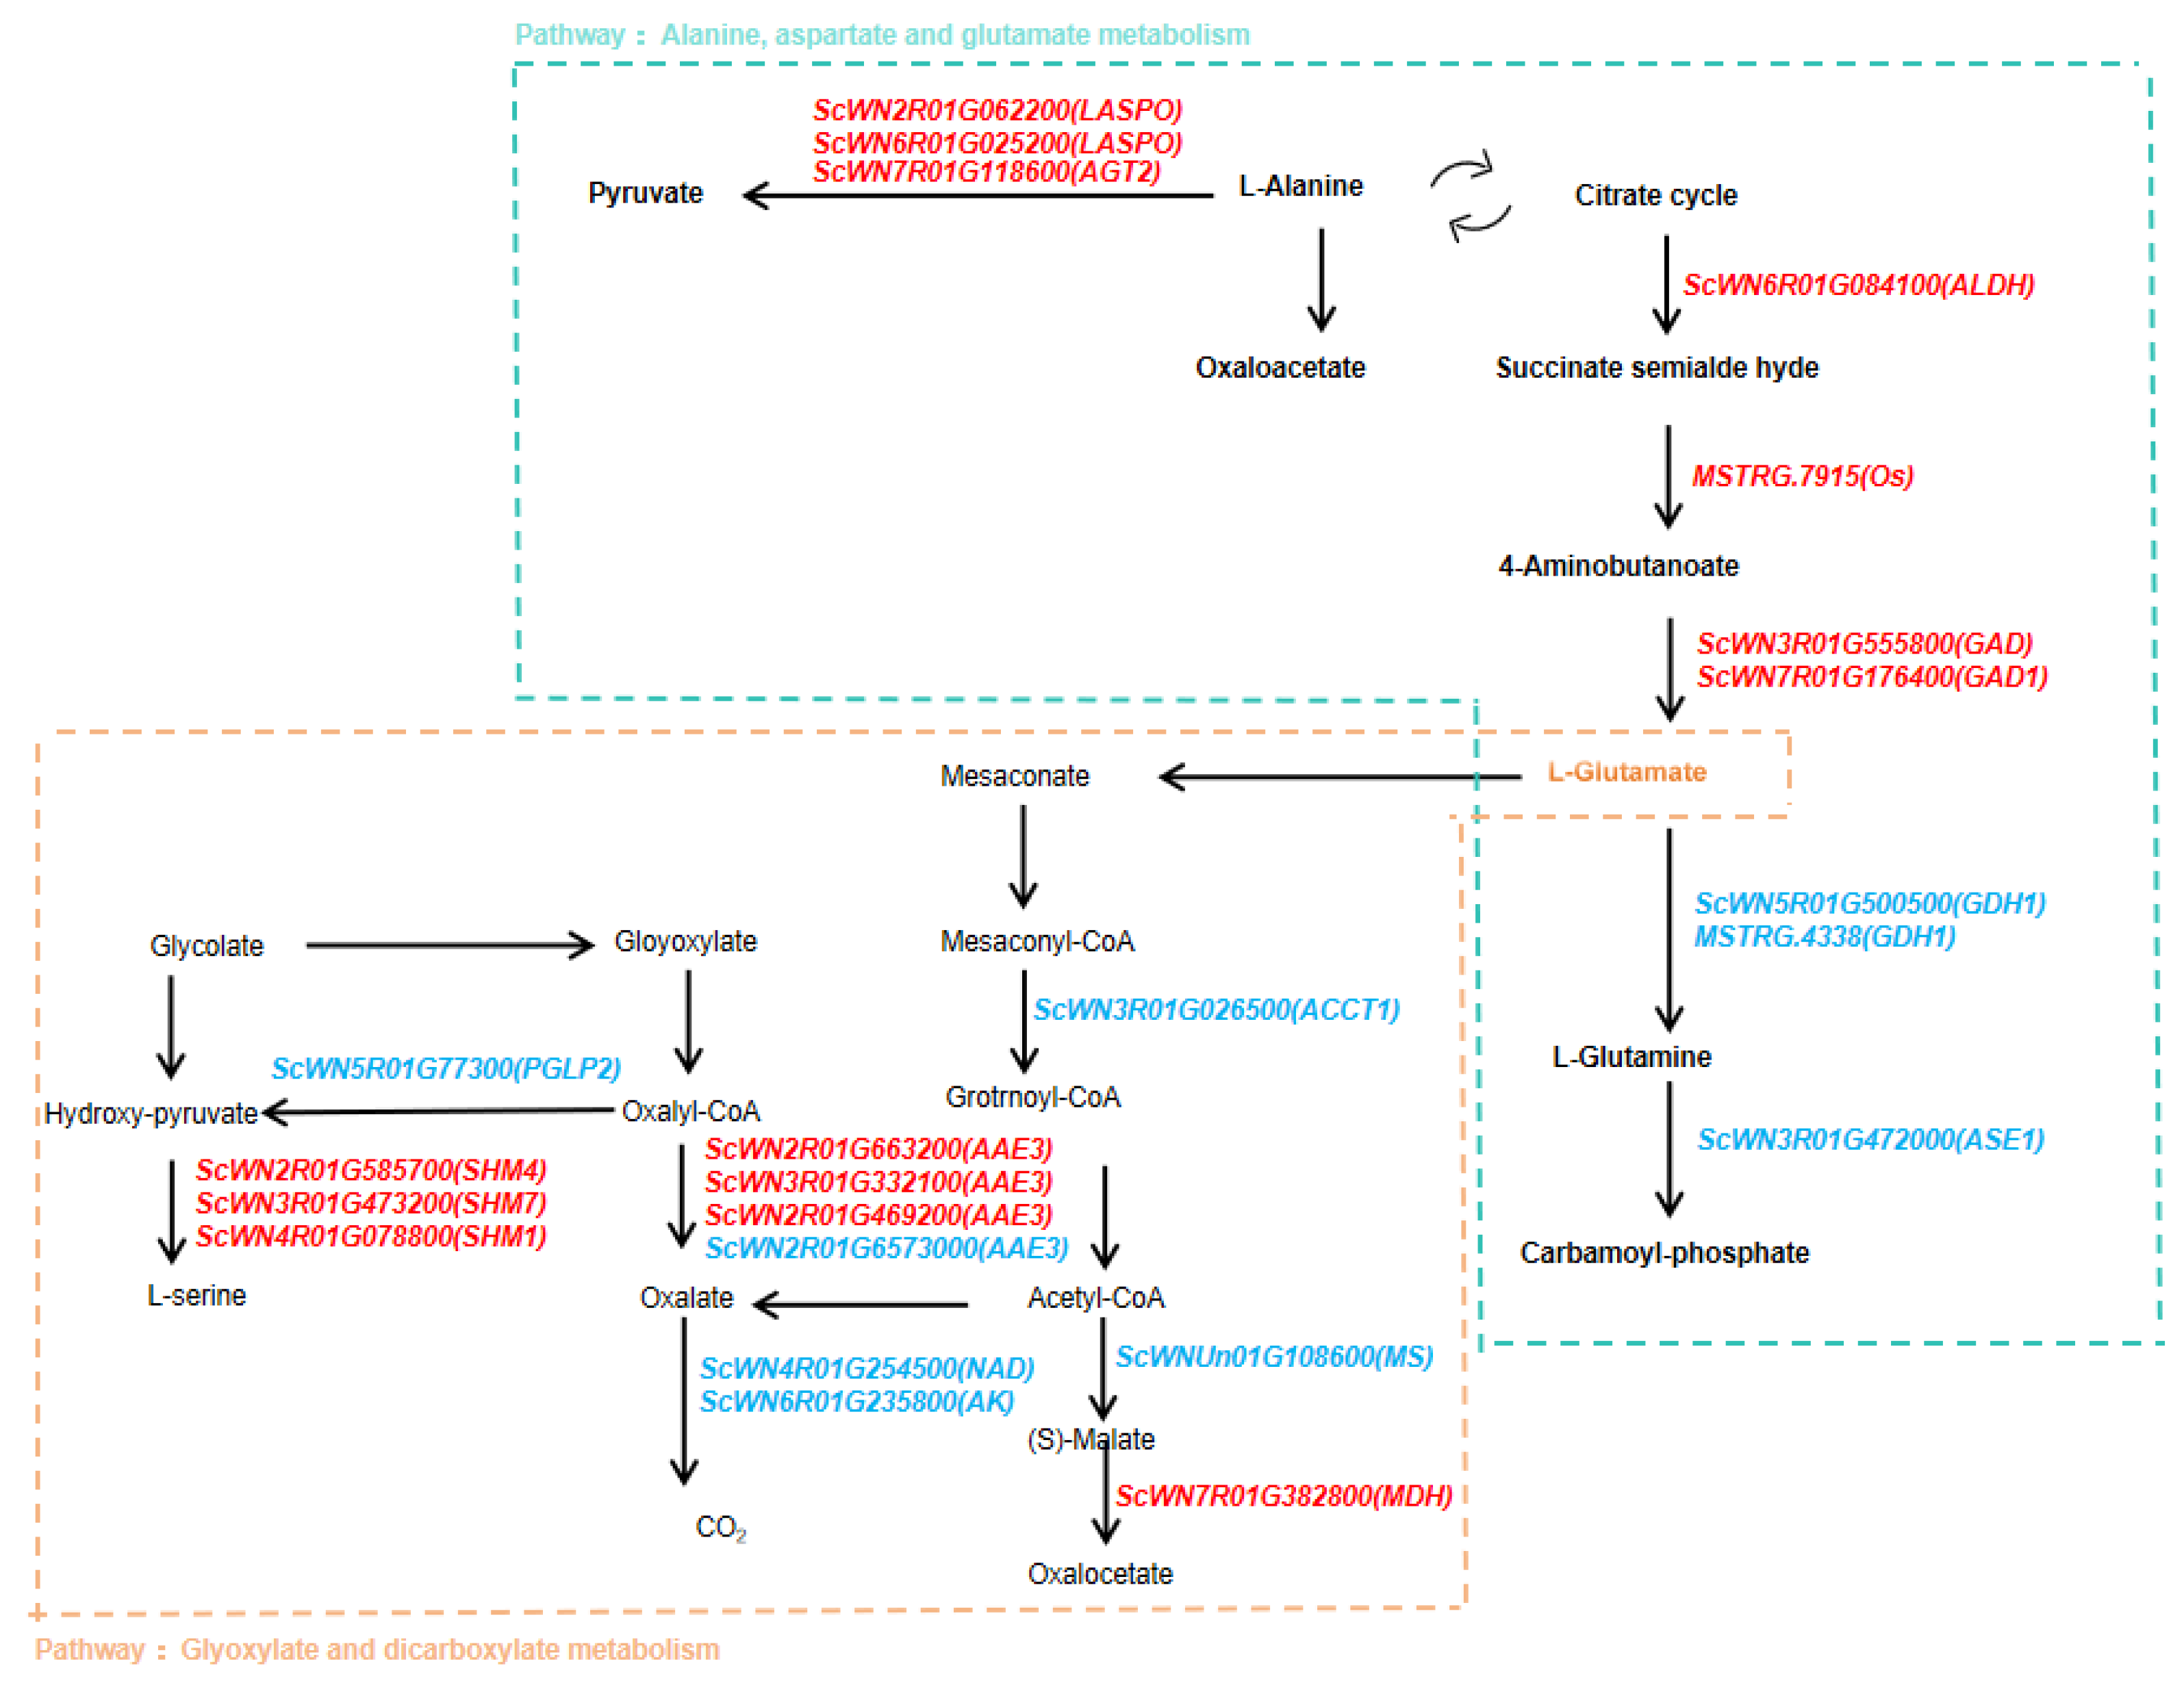
2.4. KEGG and GSEA Analysis of Differentially Expressed Genes (DEGs) in “Winter” Rye Under Cold Stress and Identification of Key Metabolic Pathways

To identify significant gene sets associated with differentially expressed genes (DEGs), we conducted gene set enrichment analysis (GSEA) on the top five most enriched KEGG pathways (q-value = 0.018685). Interestingly, the pathways glyoxylate and dicarboxylate metabolism (ko00630) and alanine, aspartate, and glutamate metabolism (ko00250) met the threshold for significant gene set enrichment. Both pathways are involved in carbohydrate metabolism and amino acid metabolism within the broader metabolic category (Figure A1).
We analyzed the genes responsible for the glyoxylate and dicarboxylate metabolism pathway, which contains 106 annotated genes. Of these, 13 genes were identified as candidates, including the upregulated Serine hydroxymethyltransferase (SHM) gene family, Acyl-activating enzyme (AAE) gene, and downregulated Phosphoglycolate Phosphatase (PGLP) gene and Acetyl-CoA acetyltransferase (AACT) gene (Figure 4a and Table A2).
In comparison to the glyoxylate and dicarboxylate metabolism pathway, the enrichment of the alanine, aspartate, and glutamate metabolism pathway was even more pronounced. Among the 10 candidate genes in this pathway, 7 were upregulated, and 3 were downregulated. Notably, the Glutamate dehydrogenase (GDH) gene (ScWN5R01G500500), MSTRG.4338, and Amidophosphoribosyltransferase (ASE) gene (ScWN3R01G472000) were significantly downregulated, while the other genes were upregulated. Importantly, compared to the control group, the L-aspartate oxidase (NadB) gene (ScWN2R01G062200) showed a remarkable increase in expression, upregulated approximately 10-fold under cold stress, while the ASE1 gene (ScWN3R01G472000) was downregulated by about 3-fold (Figure 4b and Table A2).
To further elucidate the genetic regulatory mechanisms underlying “Winter” rye’s response to cold stress through the glyoxylate and dicarboxylate metabolism and alanine, aspartate, and glutamate metabolism pathways, we propose a working model for the interaction of these two pathways in response to cold stress (Figure 5). These pathways primarily interact through the synthesis and interconversion of intermediate metabolites such as L-glutamine, L-glutamate, and mesaconate, forming a complex network of carbohydrate and amino acid metabolism. Specifically, L-glutamate serves as a central product linking the two cascades, contributing to the downstream synthesis of oxalate and oxaloacetate in carbohydrate metabolism, while simultaneously supporting the synthesis of carbamoyl-phosphate in amino acid metabolism. Together, these two pathways play a coordinated role in “Winter” rye’s response to cold stress.

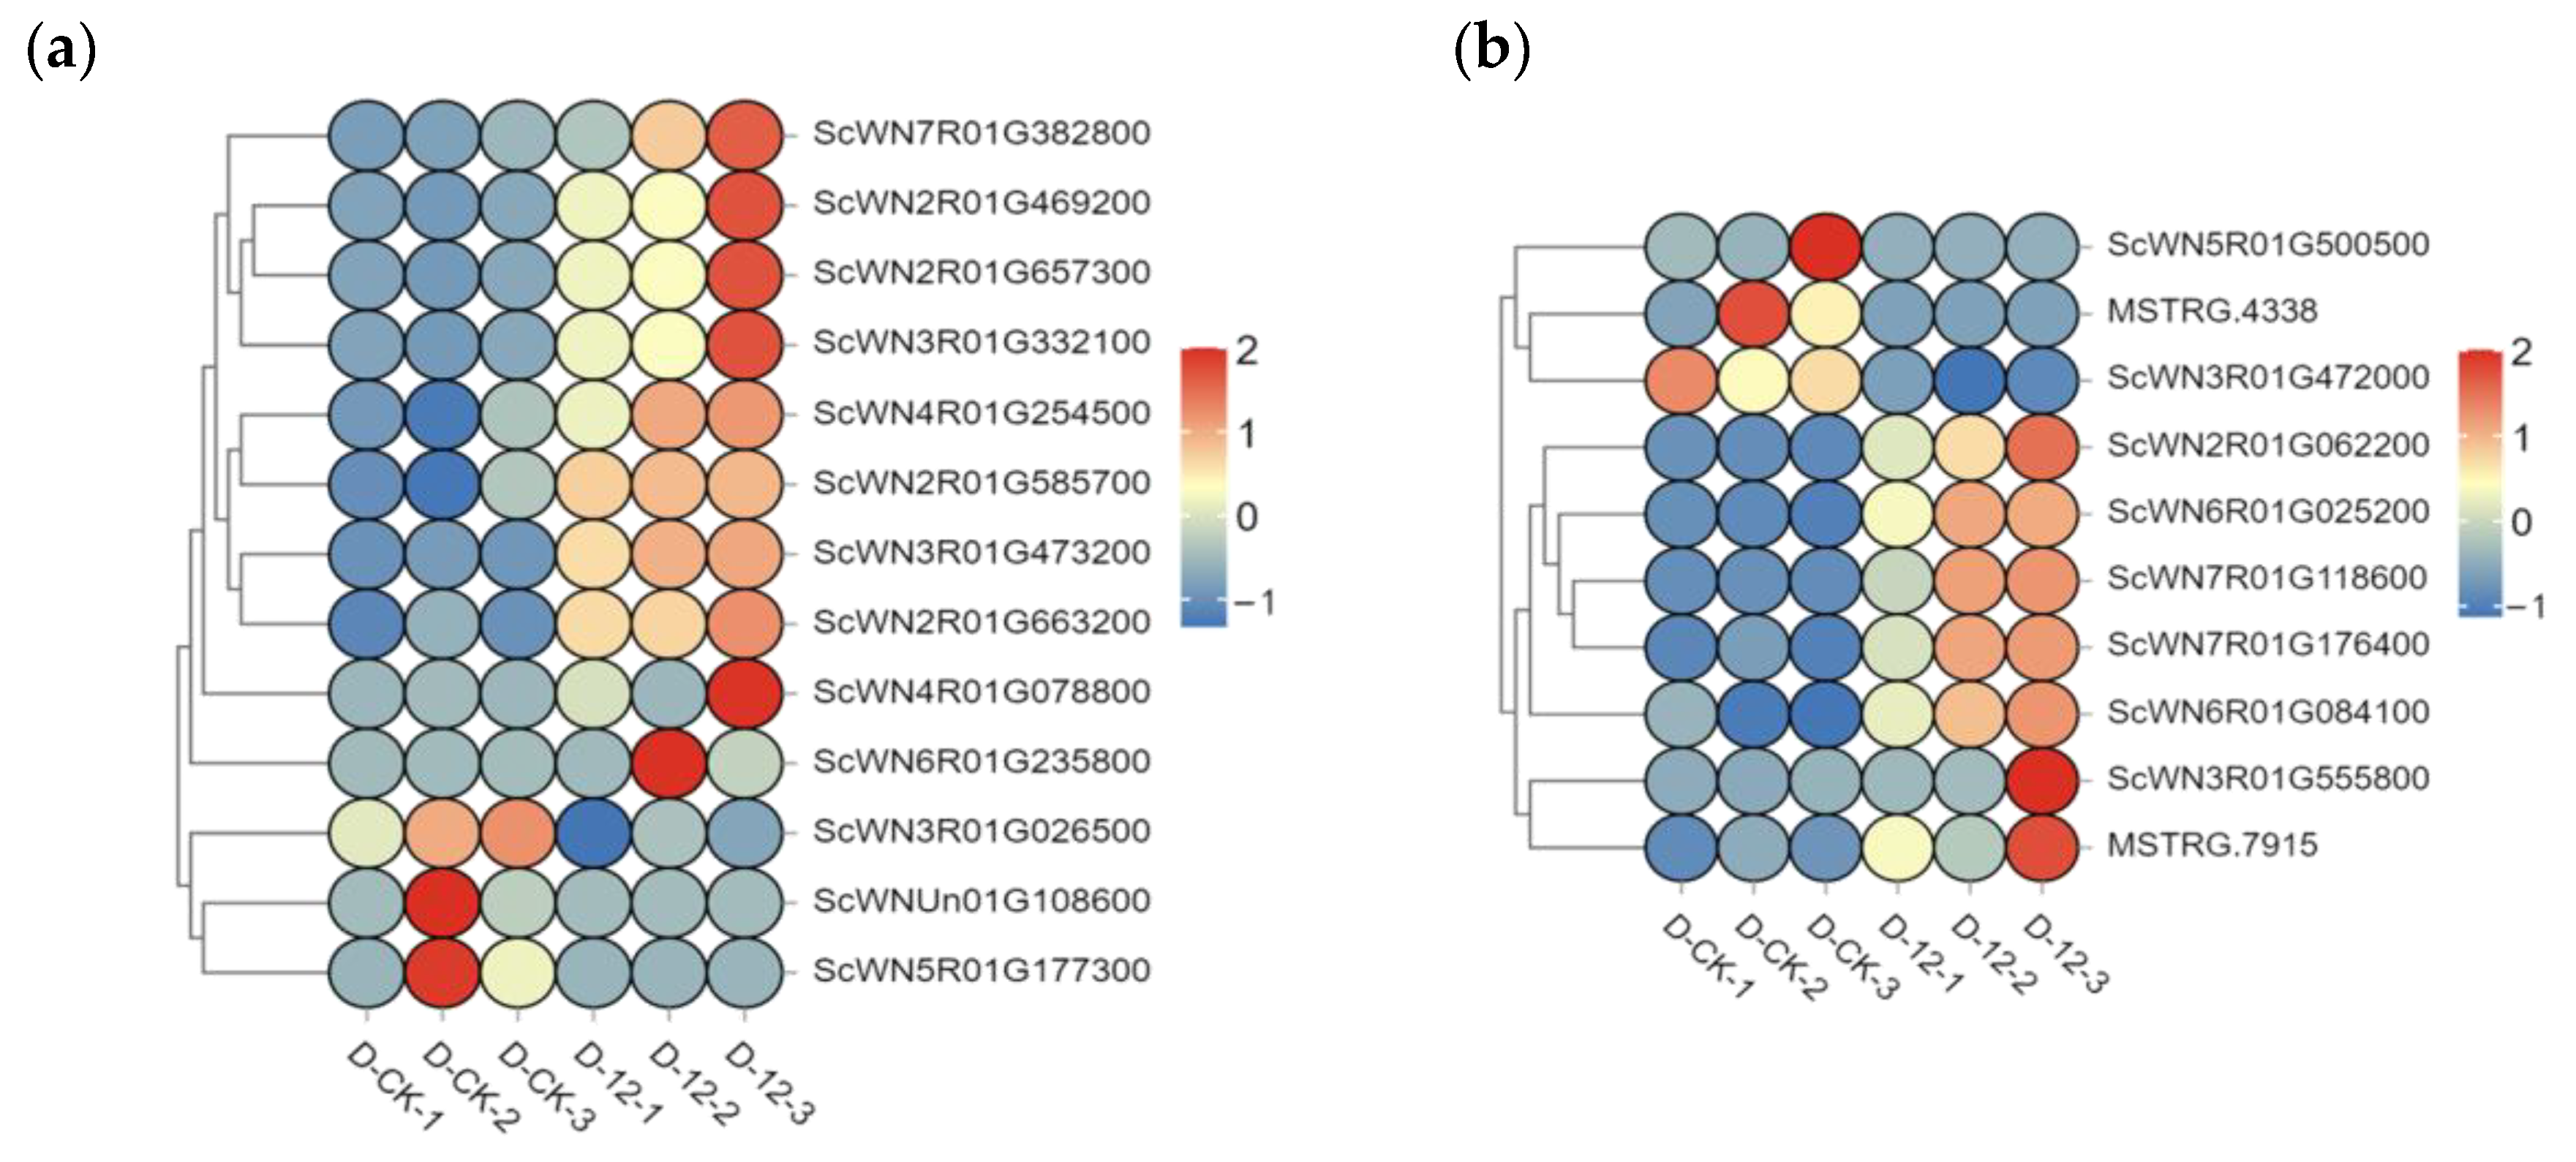
2.5. qRT-PCR Validation of Cold-Responsive Gene Expression and Expression Trends in “Winter” Rye

To validate the reliability of the transcriptomic data, we selected two cold-regulation (COR) genes and analyzed their expression trends under different durations of cold stress. The results showed that in “Winter” rye, ScCOR413 expression increased approximately twofold after 12 h of cold stress and was significantly upregulated at 72 h and 96 h, reaching a peak expression level of nearly tenfold. Overall, the expression of ScCOR413 exhibited an initial increase followed by a decline as the duration of cold stress prolonged (Figure 6).
Compared to HZHM8 and HZHM3, ScCOR413 expression levels in HZHM3 were slightly higher at each time point, whereas at 96 h of cold stress, ScCOR410 expression was higher in HZHM8 than in HZHM3; at other time points, HZHM3 maintained higher expression than HZHM8. Notably, “Victory” rye showed no significant expression of either gene at any time point, which contrasted with the expression patterns observed in the three winter rye varieties. This suggests that ScCOR413 and ScCOR410 are highly expressed exclusively in winter rye and may serve as candidate genes for cold tolerance.

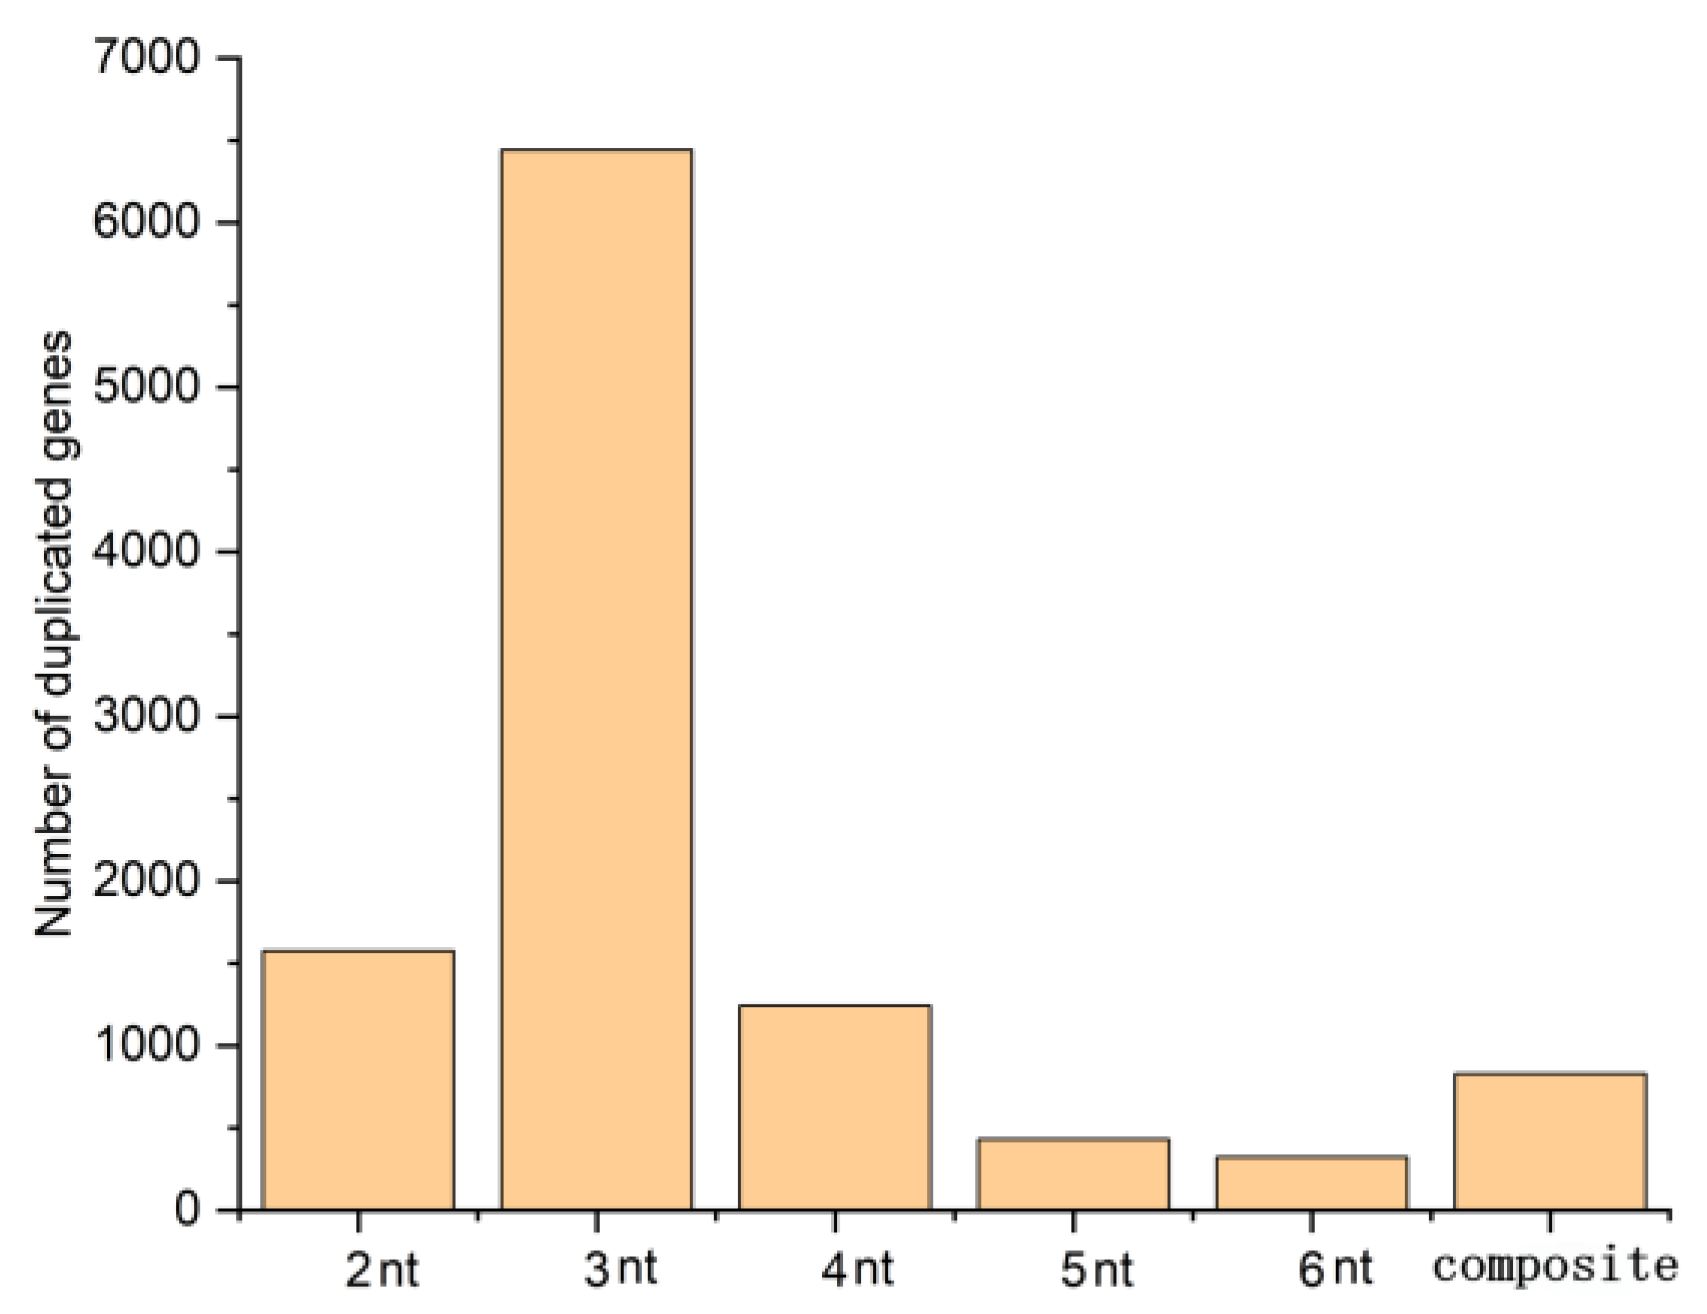
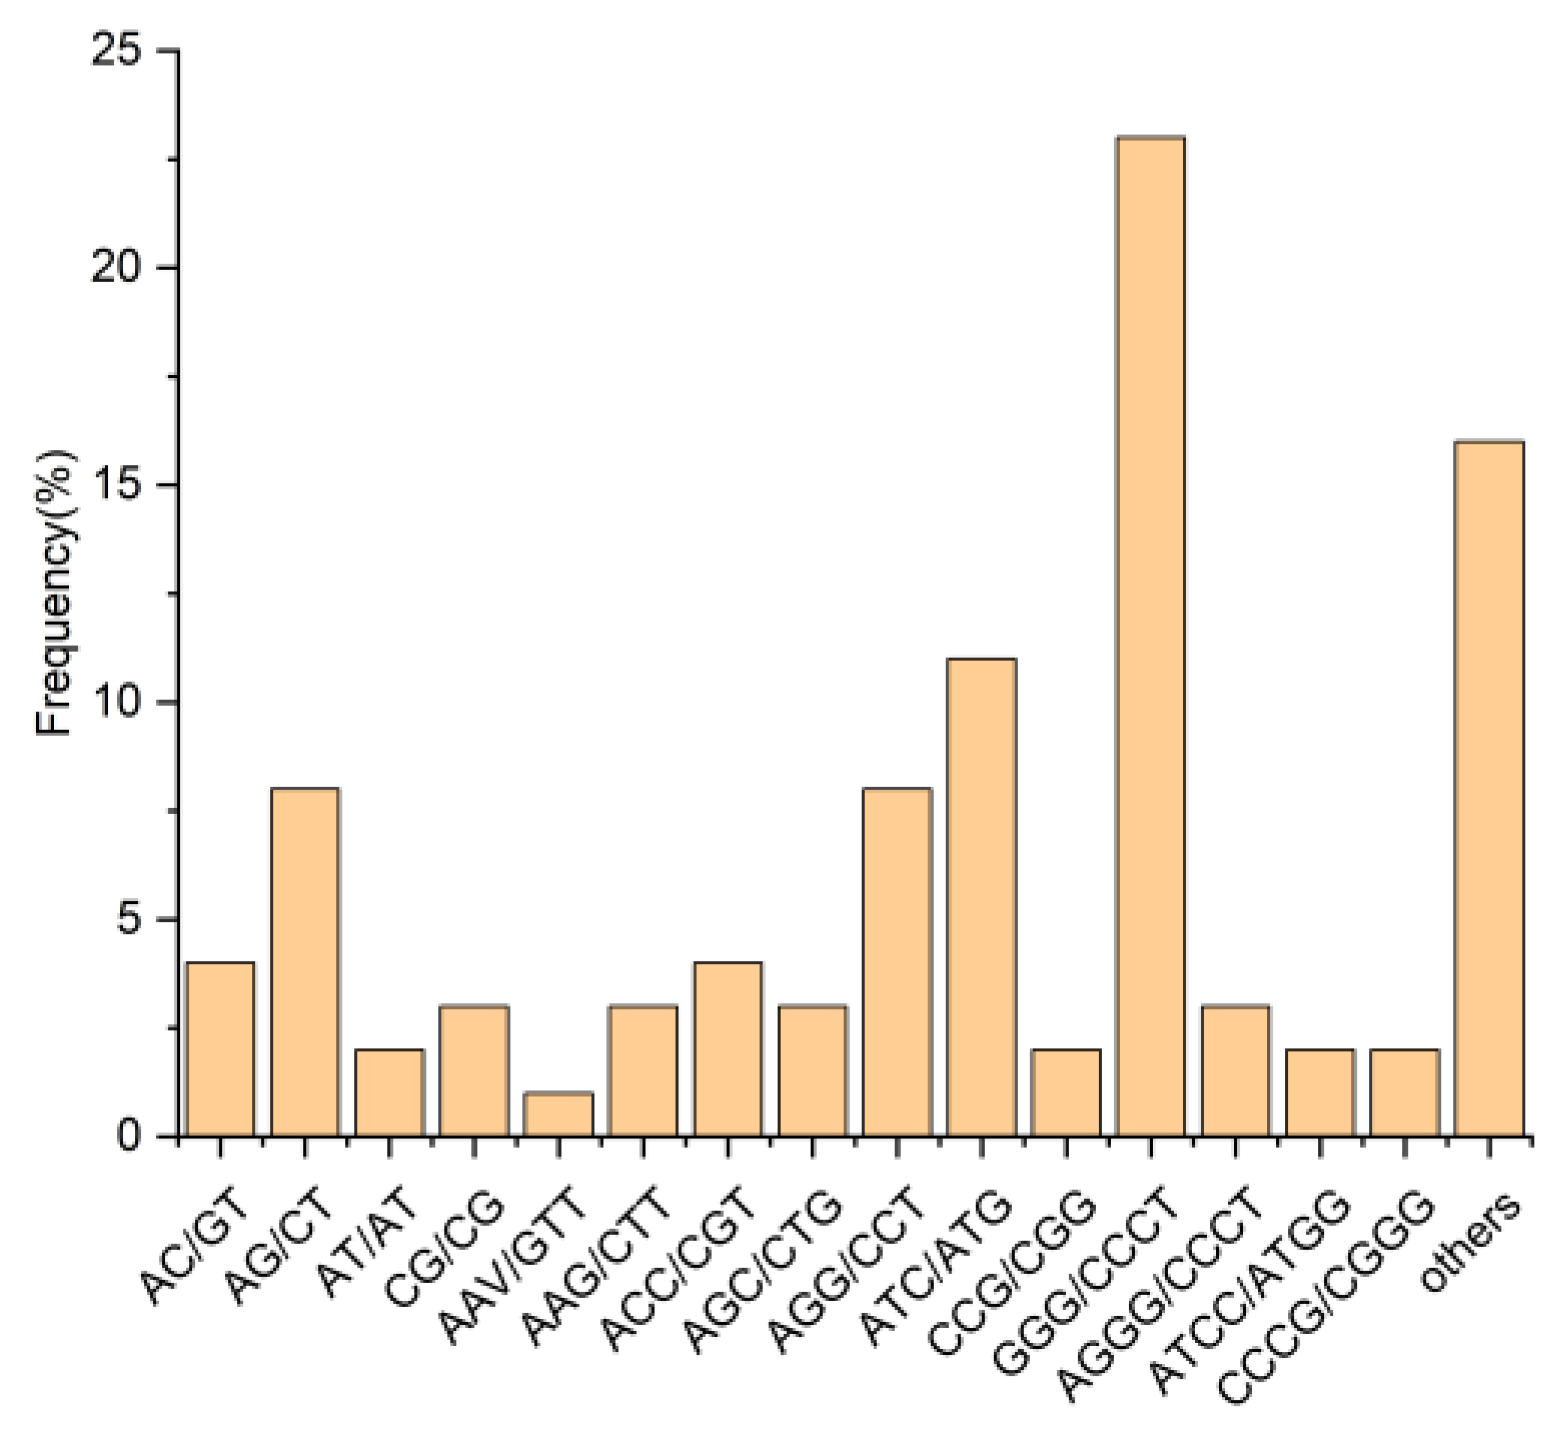
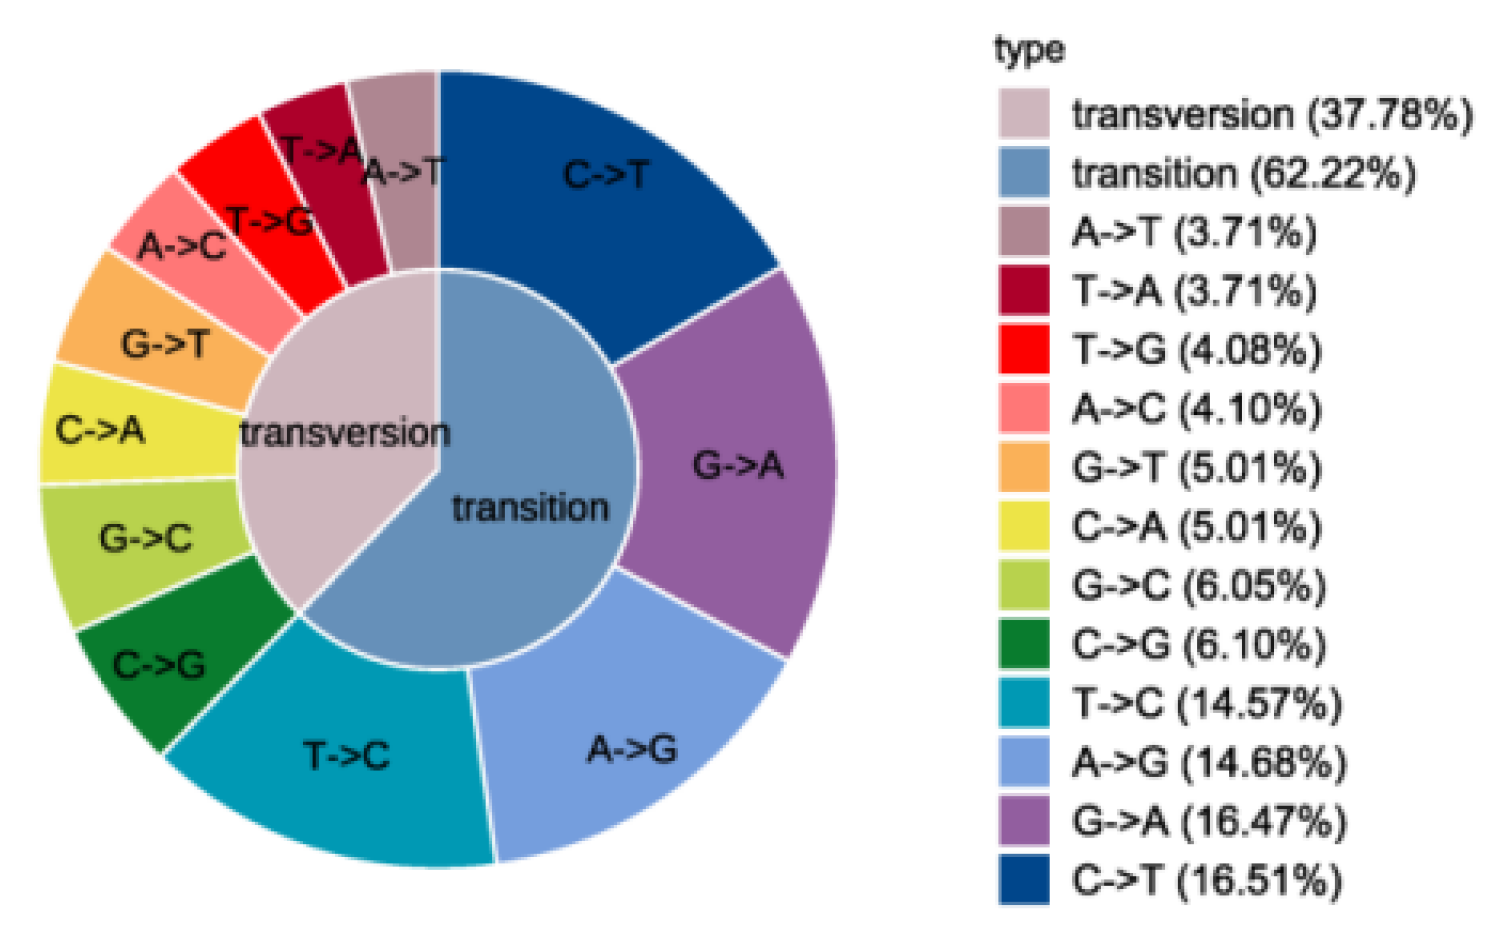
2.6. Transcriptome-Based Development and Characterization of EST-SSR and KASP Markers for Cold Tolerance in Rye

Using transcriptomic data derived from the “Winter” rye cultivar, we identified a total of 10,846 EST-SSR loci (Table 1). Notably, chromosome 5R harbored the highest number of loci (1757), followed by chromosome 2R. Analysis of SSR repeat types revealed that dinucleotide, trinucleotide, and tetranucleotide repeats were predominant, accounting for 6442, 1576, and 1244 loci, respectively, while pentanucleotide, hexanucleotide, and compound SSRs were relatively infrequent (Figure A2). Among base repeat motifs, the CCG/CGG motif was most common (25.65%), followed by AGG/CCT (11.37%), AG/CT (8.32%), and AGGG/CCCT (1.52%) (Figure A3).
To assess the amplification efficiency of these EST-SSR markers, we randomly selected 151 primer pairs for testing across 31 rye accessions. Of these, 143 primer pairs successfully amplified target fragments, with 50 producing single, clear bands and 93 exhibiting polymorphism (Table A3). Importantly, 13 EST-SSR markers were universally amplified across all accessions, underscoring their potential as generic markers for rye (Table A4).
Parallel SNP analysis of the transcriptomic dataset identified 250,116 SNPs. Base transition mutations accounted for 62.22% of these SNPs, while transversions comprised 37.78%. The most frequent SNP was a C→T transition (16.21%), followed by G→A, A→G, and T→C transitions, each exceeding 10% (Figure A4).
For Kompetitive Allele-Specific PCR (KASP) marker development, SNP-based screening was combined with qPCR validation. Three SNP loci, together with two ScCOR4 genes and their corresponding SNP sites, were randomly selected. qPCR analysis revealed that ScCOR4 genes were minimally expressed in spring rye under cold stress, indicating that these SNPs could serve as key molecular markers to distinguish between spring and winter rye accessions.
Among the developed KASP markers, KASP-665 effectively differentiated the cold-tolerant cultivars “Winter” and HZHM8 (green signal, T:C) from the cold-sensitive cultivar “Victory” (red signal, T:T), with accessions of intermediate cold tolerance exhibiting a blue signal (C:C). As this SNP represents a transition mutation, KASP-665 serves as a specific and reliable marker for cold tolerance classification within this population (Figure A5).
Additionally, KASP-396 displayed distinct genotype signals: the blue signal (G:G) was exclusive to the RUS1090 cultivar; the green signal (A:G) was detected in “Winter”, HZHM3, HZHM8, “Victory”, and RUS960; and the red signal (A:A) was observed in the remaining 23 rye accessions. These genotype variations enabled clear classification of the 31 accessions into three distinct groups (Table A8). Furthermore, five additional KASP markers (KASP-424, KASP-396, KASP-063, KASP-050, and KASP-109) were developed for genetic population genotyping (Figure A5).

3. Materials and Methods

3.1. Plant Materials, Low-Temperature Stress Treatment, and Physiological Index Measurement

In this study, four rye varieties—“Winter”, “Victory”, HZHM3, and HZHM8—were selected. Uniform and plump seeds were germinated and grown in nutrient pots until the two-leaf stage under a controlled environment with a temperature of −4 °C, a relative humidity of 75%, and a 16 h light/8 h dark cycle. The seedlings were then subjected to low-temperature stress at −4 °C for different time intervals: 0 h, 12 h, 24 h, 48 h, 72 h, 96 h, 120 h, 144 h, and 168 h. After treatment, leaf samples (0.1 g) were collected, immediately flash-frozen in liquid nitrogen, and stored at −80 °C for further analysis. Leaf samples were collected from three separate plants for each treatment time point and variety, serving as three biological replicates to ensure the reliability and representativeness of the data.
Superoxide dismutase (SOD) activity was measured using the nitroblue tetrazolium (NBT) colorimetric method [15], peroxidase (POD) activity was determined using the guaiacol colorimetric method, catalase (CAT) activity was assessed using a visible light colorimetric method, and ascorbate peroxidase (APX) activity was measured using the ultraviolet absorption method for ascorbic acid activity determination [16]. All physiological indices were measured using a UV spectrophotometer. One-way analysis of variance (ANOVA) was performed using SPSS (version 25.0) software, and data visualization was carried out using Excel.

3.2. Transcriptome Sequencing

For transcriptome sequencing, “Winter” rye plants with uniform growth status were selected. Seedlings were subjected to −4 °C for 12 h (experimental group), while the control group was grown under normal conditions (a temperature of 22 °C, a relative humidity of 75%, and a 16 h light/8 h dark cycle. The 12-h timepoint was chosen for transcriptome sequencing because pilot experiments indicated that by this time, significant physiological changes had occurred in the rye seedlings in response to cold stress. These changes included notable alterations in antioxidant enzyme activities and gene expression patterns related to cold stress response pathways. Selecting this timepoint allowed us to capture the early-to-mid-stage molecular responses to cold stress, which are crucial for understanding the initial regulatory mechanisms activated in rye upon exposure to low-temperature stress. Moreover, it provided a balance between observing the immediate effects of cold stress and avoiding potential confounding factors that might arise from longer-term stress. Young leaves from both groups were collected, and total RNA was extracted using the Trizol reagent. mRNA was used as a template to synthesize double-stranded cDNA. The sequencing library was constructed through PCR amplification and enrichment of ligated products followed by paired-end sequencing (150 bp read length) on the Illumina HiSeq platform.
Raw sequencing reads were processed using Trimmomatic software (version 0.33) to remove adapter sequences and low-quality reads (reads with a base quality score < 20 and an N base proportion > 5%). Clean reads were aligned to the wheat reference genome using Hisat2 software (version 2.2.1), and StringTie software (version 2.2.3) was used for transcript reconstruction, novel transcript prediction, and the calculation of FPKM values to quantify gene expression levels.

3.3. Differentially Expressed Gene (DEG) Analysis and Functional Enrichment

Based on RNA-Seq data, gene expression levels were analyzed between the experimental and control groups. The input data consisted of a gene expression matrix (read counts), which was normalized using the EdgeR and DESeq2 software (version 1.38.3) packages. p-values and false discovery rates (FDR) were calculated, and genes with FDR < 0.05 and |log2FC| > 1 were considered significantly differentially expressed genes (DEGs).
Functional enrichment analysis of DEGs was performed using Gene Ontology (GO) and Kyoto Encyclopedia of Genes and Genomes (KEGG) pathway analysis to explore biological functions, molecular activities, and metabolic pathways. Significantly enriched pathways were visualized using bar plots based on p-values or Q-values.

3.4. Gene Set Enrichment Analysis (GSEA)

Gene set enrichment analysis (GSEA) was conducted using the GSEA-P software (version 4.2.3) and the MSigDB database to identify KEGG pathways significantly enriched between the experimental and control groups. The gene expression matrix was used as input, and gene ranking was performed using the signal-to-noise normalization method. Enrichment scores (NES) and p-values were calculated under default parameters. Significantly enriched pathways were determined based on the criteria |NES| > 1, P adj < 0.05, and FDR < 0.25.

3.5. qRT-PCR Validation

Quantitative real-time PCR (qRT-PCR) was used to analyze the expression of target genes using cDNA from “Winter”, “Victory”, HZHM3, and HZHM8 rye varieties at different low-temperature treatment time points (0 h, 12 h, 24 h, 48 h, 72 h, 96 h, 120 h, 144 h, and 168 h). The wheat actin gene (TaActin) was used as an internal reference (primer information is provided in Table A7). qRT-PCR reactions were conducted in two steps: Denaturation at 95 °C for 10 min. Amplification at 95 °C for 30 s, 60 °C for 30 s, 72 °C for 40 s, repeated for 39 cycles. The specificity of the amplification products was confirmed through melting curve analysis. Each experiment was performed in triplicate, and the 2^(−∆∆CT) method was used to calculate the relative expression levels of cold-responsive genes ScWN5R01G457800 and ScWN6R01G204000.

3.6. Development of Rye EST-SSR Molecular Markers

MISA software (version MISA.pl, http://pgrc.ipk-gatersleben.de/misa/, accessed on 13 March 2022) was used to predict the EST-SSR loci of the already sequenced transcripts. The locus screening parameters were as follows: When 2, 3, 4, 5, and 6 bases were repeated for 6, 5, 4, 4, and 4 units, respectively, it was regarded as an SSR locus. If the distance between two SSRs sequences was less than 100 bp, it was considered a compound SSR. EST-SSR primers were designed using Primer3 software (version 1.1.4) with the following parameters: amplification product length, 100–300 bp; primer length, 18–25 nt; annealing temperature, 50–65 °C; GC content, 45–65%. A total of 151 primer pairs were selected and synthesized by Sangon Biotech. Using “Winter” rye transcriptome sequences, EST-SSR markers applicable to 31 rye varieties were developed.

3.7. Development of Rye EST-SNP and KASP Molecular Markers

EST-SNP loci in the transcriptome were identified using the Genome Analysis Toolkit (GATK) software(version 4.4.0.0). Based on SNP screening and qPCR validation, KASP molecular markers were developed. Three randomly selected SNP loci, along with two SNP loci from ScCOR410 and two from ScCOR413, were used for KASP marker development. KASP reaction system (10 μL): 5 μL 2× KASP Master Mix; 0.14 μL Primer Mix; 4.86 μL Template DNA. KASP reaction conditions: Pre-denaturation at 94 °C for 15 min; denaturation at 94 °C for 20 s, annealing at 61–55 °C for 60 s, for 10 cycles; denaturation at 94 °C for 20 s, annealing at 55 °C for 60 s, for 26 cycles. Amplification was performed on a Bio-Rad CFX96 real-time PCR system, and the specificity of the products was confirmed through melting curve analysis.

4. Discussion

4.1. Antioxidant Enzymes and Cold Tolerance in Plants

Low-temperature stress induces a series of physiological and biochemical responses in plants, among which the modulation of the antioxidant enzyme system is crucial for mitigating cellular damage. Numerous studies have demonstrated that enhanced activities of antioxidant enzymes such as SOD, POD, and APX are closely correlated with improved cold tolerance [4,17,18,19,20,21,22,23,24,25]. In our study, phenotypic evaluations and measurements of antioxidant enzyme activities in different rye cultivars under cold stress revealed that the cold-tolerant cultivars “Winter” and HZHM3 exhibited the highest SOD, POD, and APX activities after 168 h of exposure. In contrast, the cold-sensitive cultivar “Victory” did not show a significant accumulation of these enzymes and displayed severe wilting. These findings underscore the importance of sustained and elevated antioxidant enzyme activities in conferring cold tolerance in rye.
Similar responses have been reported in other species. For instance, grapevine leaves exposed to 4 °C showed a transient increase in SOD, POD, and CAT activities, reaching a peak after 5–7 days of treatment [17,18,19]. Likewise, cold-tolerant rice cultivars rapidly increased the activities of SOD, POD, CAT, and APX under 5 °C stress, effectively scavenging reactive oxygen species and reducing lipid peroxidation, whereas cold-sensitive cultivars exhibited a slower and lower increase in enzyme activities. Comparable trends were observed in chickpea, where cold-tolerant genotypes maintained higher antioxidant activities during cold acclimation and freezing treatments compared to sensitive ones. Our study not only confirms the dynamic changes of antioxidant enzymes under cold stress in rye but also highlights “Winter” and HZHM3 as ideal materials for further investigation of the underlying molecular mechanisms.

4.2. Role of Carbohydrate and Amino Acid Metabolism Pathways in Rye Cold Tolerance

Transcriptome sequencing has emerged as a powerful tool for elucidating the molecular mechanisms underlying plant cold tolerance. In our transcriptomic analysis of the “Winter” cultivar, 1643 differentially expressed genes (DEGs) were identified. Subsequent GO, KEGG, and GSEA enrichment analyses revealed significant enrichment of the carbohydrate metabolism (ko00630) and amino acid metabolism (ko00250) pathways under cold stress. These pathways exhibited substantial changes in the expression levels of key genes, suggesting that modulation of these metabolic routes is critical for the cold adaptation of rye.
Similar observations have been reported in other species. For example, eggplant under cold stress adjusts the expression of genes related to starch and sucrose metabolism, energy metabolism, redox reactions, and hormone signaling to maintain cellular function [26,27,28]. In cucumber seedlings, glucose pretreatment enhanced cold tolerance by modulating glycolysis and the tricarboxylic acid cycle [29]. Moreover, olive and Chinese cabbage maintain cellular osmotic balance under cold stress by regulating pathways involved in glucose, sucrose, and mannitol metabolism [30,31]. These studies collectively underscore the universal role of carbohydrate and amino acid metabolism in plant responses to low-temperature stress.
In rye, our results suggest that the pyruvate acid and dicarboxylic acid metabolism pathway (ko00630) plays a pivotal role in cold tolerance. Analysis of this pathway revealed 106 annotated genes, including upregulated candidates such as members of the Serine hydroxymethyltransferase (SHM) gene family and acyl-activating enzyme (AAE) genes, as well as downregulated genes like Phosphoglycolate Phosphatase (PGLP) and Acetyl-CoA acetyltransferase (AACT). These expression changes likely alter the activities of key enzymes, thereby affecting the rate and direction of metabolic reactions and ultimately enhancing cold tolerance. Moreover, the alanine–aspartate–glutamate metabolism pathway displayed even more pronounced enrichment, with 7 of 10 candidate genes being upregulated. For instance, the L-aspartate oxidase (NadB) gene (ScWN2R01G062200) was upregulated approximately tenfold under cold stress, whereas the Amidophosphoribosyltransferase (ASE) gene (ScWN3R01G472000) was downregulated to about one-third of its original level. These alterations likely modulate the synthesis of key intermediates such as L-glutamine, L-glutamate, and mesaconate, which may in turn facilitate the flexible regulation of energy supply and osmotic balance under cold stress.

4.3. Application of Transcriptome Sequencing and Molecular Markers in Rye Cold Tolerance Research

Molecular marker technology plays a pivotal role in plant breeding by accelerating the selection process for stress tolerance traits. Transcriptome-based development of molecular markers offers distinct advantages, including direct reflection of gene expression changes, high-throughput screening capability, high accuracy, and clear functional associations [17,18,19,20,21,24]. In this study, we utilized transcriptomic data from the “Winter” cultivar to develop various molecular markers, including EST-SSR, EST-SNP, and KASP markers, thereby providing novel tools for marker-assisted selection in cold-tolerant rye breeding.
Specifically, we identified 10,846 EST-SSR loci and developed 13 universal EST-SSR primer pairs for rye, alongside detecting 250,116 EST-SNPs. Through SNP screening and qPCR validation, we further developed 7 KASP markers, among which KASP-665 effectively distinguished winter rye from spring rye by differentiating a T:T to T:C transition, suggesting a potential association with cold tolerance. Although not all KASP markers directly correlate with cold tolerance, they have proven useful for analyzing population genetic structure, parental selection, and heterosis prediction [32,33,34,35,36,37,38,39]. Collectively, these markers provide robust technical support for the breeding of cold-tolerant rye varieties and demonstrate a successful application of transcriptome sequencing in molecular marker development. This work lays a solid foundation for future studies aimed at further uncovering the molecular mechanisms of cold tolerance in rye.

5. Conclusions

In this study, we demonstrated that the rye cultivar “Winter” exhibits high and stable antioxidant enzyme activity under prolonged cold stress. Transcriptome sequencing revealed that the primary metabolic pathways responsive to low-temperature stress are the pyruvate acid and dicarboxylic acid metabolism pathway and the alanine–aspartate–glutamate metabolism pathway. Additionally, transcriptome-based screening allowed for the identification of SSR and SNP loci, leading to the development of 13 universal EST-SSR markers and 7 KASP markers for rye. Together, these transcriptomic data and molecular markers enhance our understanding of the physiological and biochemical mechanisms underlying cold adaptation in rye and offer significant potential for improving rye yields in cold regions through marker-assisted breeding.

Author Contributions

H.L. designed the entire study, analyzed the experimental data, and drafted the manuscript. J.Z. conducted all the experiments related to trait observation, photography, qRT-PCR, and drafted the manuscript. C.H., Y.G. and H.G. assisted with sowing and sample preparation. T.H. and D.M. contributed to the data analysis. X.W. and Y.T. helped with writing—review and editing. All authors have read and agreed to the published version of the manuscript.

Funding

This research received no external funding.

Data Availability Statement

The original contributions presented in this study are included in the article. Further inquiries can be directed to the corresponding author.

Acknowledgments

We would like to express our gratitude to Zhang Yanming for the technical support provided for this experiment and to Zhao Haibin for the rye research materials provided for this experiment.

Conflicts of Interest

The authors declare no conflicts of interest.

Appendix A

Appendix A.1

Table A1. Transcriptome data filtering statistics of “Winter” rye.
SampleRawDataCleanData (%)Adapter (%)LowQuality (%)PolyA (%)N (%)
D-CK-148,707,14648,582,636 (99.74%)13,498 (0.03%)111,006 (0.23%)0 (0.00%)6 (0.00%)
D-CK-247,871,73847,739,978 (99.72%)14,448 (0.03%)117,306 (0.25%)0 (0.00%)6 (0.00%)
D-CK-353,268,82453,127,680 (99.74%)15,382 (0.03%)125,762 (0.24%)0 (0.00%)0 (0.00%)
D-12-158,454,22858,295,122 (99.73%)17,392 (0.03%)141,712 (0.24%)0 (0.00%)2 (0.00%)
D-12-262,533,21062,354,096 (99.71%)19,844 (0.03%)159,258 (0.25%)0 (0.00%)12 (0.00%)
D-12-358,815,09858,660,926 (99.74%)19,262 (0.03%)134,906 (0.23%)0 (0.00%)4 (0.00%)
D-CK represents the winter control group, and D-12 represents the winter experimental group treated at 4 °C for 12 h, with three biological replicates per group.

Appendix A.2

Table A2. Two important expression pathways in “Winter” rye.
Pathway IDPathwayKEGG_A ClassKEGG_B ClassCandidate GenesUpgrade Candidate GenesDown Candidate GenesAll Genes
ko00630Glyoxylate and dicarboxylate metabolismMetabolismCarbohydrate metabolism1376112
ko00250Alanine, aspartate and glutamate metabolismMetabolismAmino acid metabolism104679

Appendix A.3

Table A3. Analysis of 151 pairs of EST-SSR primers.
CategoriesNumbers
Non-amplified band8
Amplified band143
Polymorphic band93
Unitary strip50

Appendix A.4

Table A4. Primer information of “Winter” rye EST-SSR primers.
IDSSRSizeFORWARDPRIMER (5′-3′)REVERSEPRIMER (5′-3′)Tm (°C)PRODUCT Size (bp)
Sc1R14(CGCCGA)424CCTCCTCCTCCTCCTCCTCCCGAAGCTGTCGTAGTGGAT57.1253
Sc1R20(CT)714TCCTCCCCCTCTCTTCTCTCACATAACGGTCCGCAAACTC55.4212
Sc3R06(TTCT)624AGCTTCTGCTGGTCTGTGGTAAGAATGCCAGAGCAGGCTA56.3184
Sc3R09(CCGC)520CAGCAGAGTCCAACAAACCCAGCTGGGCGAGCTCTTGT56.7205
Sc4R02(CCT)515AACCTCGCTCCACCTCATCTAATGGAAGGTGTCCGGGT56.6278
Sc4R08(TA)612GAGAGCCGTCACTTTTGGTCTCACAGCAGAGATGAGGTCG56.3165
Sc4R18(TG)816AGCAAGCTGCTTCTCTGAGGTTTGCTCACGACTTTGGTTG53.4244
Sc6R15(CAG)721ATCCAATGAATCAAGCCAGCCATGGAGTGATGGTTAGGGG53278
Sc7R03(GAA)721GGGACTCTGACAACGACGATTAATGGTGGCCCAAGAAGAC54.8148
Sc1R02(GAT)618CTGGTGATACAGCCAACCCTCGGATAGCACGGAGTACGTT57205
Sc1R03(TTTC)520AGGTTGTCATTTTCATGCCCGAGCTGATCTTCAAGGCCAC53.1237
Sc4R04(ACG)927CTCCTCAAGTCCAGTGCTCCTCCATCAGAGACAGCAGACG56.8233
Sc5R03(GC)612CAAATTTAGCCACCTCCCAACCTTTCTTTCCGCTTCCTCT52.6247

Appendix A.5

Table A5. Analysis of 140 pairs of EST-SNP primers.
CategoriesNumbers
Non-amplified band56
Amplified band84
Polymorphic band54
Unitary strip30

Appendix A.6

Table A6. Primer information for 7 KASP molecular markers.
IDRefMutFORWARD PRIMER1 (5′-3′)REVERSE PRIMER1 (5′-3′)Primer Common
KSAP-063CTGCCGCGCCGGTGACGCCGCGCCGGTAAGGAGAAGGTCGGGG
AGGTGAA
KASP-050CACGCGGCTTGTGCAGCAGACCTCGCGGCTTGTGCAGCAGAAGCAGCTTGGGGACATCGCCAAT
KASP-109GCCGCCGGCGTGGCGCGCCGGCGTGGCCGATGTCGGCCTGGATCTTGCTGTA
KASP-126TCCCACGCCATCGTCCTCGGTCACGCCATCGTCCC
GGC
CACTGGAGGAAGGTGCCGATGAA
KASP-424AGGCCCCCAGCATCTTCGCCACCCCCAGCATCTTG
CCG
TGATGAGCCACGACCCCCTGAA
KASP-396CTCGGTGCACGCGCC
GGC
CCGGTGCACGCGCC
GGT
CCAAGCAGGCCCTTCTTCTCCTT
KASP-665GAGCCGCCGGTGCG
GGC
GGCCGCCGGTGCG
GGT
AGGAGAAGCTGCCTGGCCACAA

Appendix A.7

Table A7. Primer information of the wheat actin gene (TaActin) used as an internal reference.
Gene NameForward PrimerReverse Primer
TaActinATGGCTGGAGAAGGATTCCTCCTTAATGTCACGCACG

Appendix A.8

Table A8. The experimental materials used for the developed molecular markers.
NumberThe Experimental Materials
1“Winter”
2HZHM3
3HZHM8
4“Victory”
5RUS1060 HZHM132
6RUS1063 HZHM135
7RUS1087 HZHM159
8RUS1095 HZHM167
9RUS1080 HZHM158
10RUS110 HZHM72
11RUS960 HZHM32
12RUS1079 HZHM151
13RUS1081 HZHM153
14RUS169
15RUS1082
16RUS1064
17RUS1091
18RUS966
19RUS1071
20RUS1098
21RUS1075
22RUS1090
23RUS964
24RUS920
25RUS1057
26RUS1073
27RUS1070
28RUS1092
29RUS961
30RUS990
31RUS1088

Appendix B

Figure A1. GESA plots of genes for the top 5 items with the highest KEGG enrichment (q-value = 0.018685). (a) GESA plot of KO00330; (b) GESA plot of KO00630; (c) GESA plot of KO00460; (d) KO04712 GESA plot; (e) KO00250 GESA plot. The upper part of the figure represents the distribution curve of the enrichment pathway name and the ES value of each position, the vertical axis represents the enrichment score, the upper right corner NES represents the corrected normalized ES, P.adj represents the significance of the gene set enrichment, the FDR represents the p value corrected by the FDR method, the middle part represents the position of genes in the gene set S in the gene sorting list L, and each vertical line represents a gene in the pathway. The lower part represents the normalized values of genes in the gene sorting list L for visualization. Note: It is generally considered that |The NES| > 1, Padj < 0.05, FDR < 0.25 pathways were significantly enriched.
Plants 14 01588 g0a1
Figure A2. The number distribution of EST-SSR repeat unit types in “Winter”. The horizontal axis represents the type of repetitive unit, which is subdivided into repetitive units (2, 3, 4, 5, and 6) and composite units. The vertical axis corresponds to the number of each type of repeating unit.
Plants 14 01588 g0a2
Figure A3. Distribution map of EST-SSR genotypes in “Winter”. The horizontal axis in the figure indicates different genotype markers, such as AC/GT, AT/AT, etc.; the vertical axis represents the relative number of these genotypes in the sample. The blue bars visually show the differences between genotypes.
Plants 14 01588 g0a3
Figure A4. Statistics of “Winter” ESP-SNP mutants. Note: Base transversion and base transition; base transversion refers to the substitution between purine and pyrimidine in base substitution (G<->T, C<->A, A< ->T, C<->G, while base conversion is a purine replaced by another purine or a pyrimidine replaced by another pyrimidine (T<->C, A<->G).
Plants 14 01588 g0a4
Figure A5. KASP marker genotyping results. (a) KASP-665—red dots are genotype T:T, green dots are genotype T:C, and blue dots are genotype C:C. (b) KASP-126—red dots are genotype C:C, green dots are genotype C:T, blue dots are genotype T:T, and black dots are NTC blank controls. (c) KASP-424—red dots are genotype G:G, green dots are genotype G:A, blue dots are genotype A:A, pink dots are untyped results, and black dots are NTC blank controls. (d) KASP-396—blue G:G, “Winter” rye, HZHM3, HZHM8, “Victory”, and RUS960; green A:G; pink for typing failure lines; red, genotype showing A:A; and black dots for NTC blank control. (e) KASP-063—the red dots are genotype T:T; green dots are genotype T:C; black dots are NTC blank control, and pink dots are untyped results. Each point within the axis represents a single plant individual. (f) KASP-050—blue dots are genotype C:C, green dots are genotype A:C, black dots are NTC blank control, and pink dots are untyped results. Each point within the axis represents a single plant individual. (g) KASP-109—blue dots are genotype G:G; green dots are genotype C:G, black dots are NTC blank control, and pink dots are untyped results. Each point within the axis represents a single plant individual.
Plants 14 01588 g0a5

References

  1. Rihan, H.Z.; Al-Issawi, M.; Fuller, M.P. Advances in physiological and molecular aspects of plant cold tolerance. J. Plant Interact. 2017, 12, 143–157. [Google Scholar] [CrossRef]
  2. Ding, Y.; Yang, S. Surviving and thriving: How plants perceive and respond to temperature stress. Dev. Cell 2022, 57, 947–958. [Google Scholar] [CrossRef] [PubMed]
  3. Zhu, S.; Sun, S.; Zhao, W.; Yang, X.; Chen, Z.; Mao, H.; Sheng, L. Comprehensive physiology and proteomics analysis revealed the resistance mechanism of rice (Oryza sativa L.) to cadmium stress. Ecotoxicol. Environ. Saf. 2024, 278, 116413. [Google Scholar] [CrossRef] [PubMed]
  4. Wang, J.; Liu, G.; Liu, F.; Zhu, J. Responses of Antioxidant Enzymes to Chronic Free-Air Ozone Stress in Rice (Oryza sativa L.) Cultivars with Different Ozone-Sensitivities. Bull. Environ. Contam. Toxicol. 2019, 103, 428–434. [Google Scholar] [CrossRef] [PubMed]
  5. Mougiou, N.; Baalbaki, B.; Doupis, G.; Kavroulakis, N.; Poulios, S.; Vlachonasios, K.E.; Koubouris, G.C. The Effect of Low Temperature on Physiological, Biochemical and Flowering Functions of Olive Tree in Relation to Genotype. Sustainability 2020, 12, 10065. [Google Scholar] [CrossRef]
  6. Chen, H.; Liang, X.; Yang, Z. Effects of Low-Temperature Stress on Physiological Characteristics and Microstructure of Stems and Leaves of Pinus massoniana L. Plants 2024, 13, 2229. [Google Scholar] [CrossRef]
  7. Wang, Y.; Xiang, C.; Li, D.; Du, M.; Mo, Y.; Jiang, Z.; Wang, J. Identification of key genes involved in the two lignifications in stored king oyster mushrooms (Pleurotus eryngii) and their expression features. Postharvest Biol. Technol. 2020, 169, 111289. [Google Scholar] [CrossRef]
  8. Deng, X.; Wei, Y.; Chen, Y.; Ding, P.; Xu, F.; Shao, X. Gene co-expression network analysis of the transcriptome identifies cold-resistant hub genes related to carbohydrate metabolism in peach fruit. Postharvest Biol. Technol. 2025, 220, 113300. [Google Scholar] [CrossRef]
  9. Erath, W.; Bauer, E.; Fowler, D.B.; Gordillo, A.; Korzun, V.; Ponomareva, M.; Schmidt, M.; Schmiedchen, B.; Wilde, P.; Schön, C.-C. Exploring new alleles for frost tolerance in winter rye. Theor. Appl. Genet. 2017, 130, 2151–2164. [Google Scholar] [CrossRef]
  10. Jiang, G.; Hassan, M.A.; Muhammad, N.; Arshad, M.; Chen, X.; Xu, Y.; Xu, H.; Ni, Q.; Liu, B.; Yang, W.; et al. Comparative Physiology and Transcriptome Analysis of Young Spikes in Response to Late Spring Coldness in Wheat (Triticum aestivum L.). Front. Plant Sci. 2022, 13, 811884. [Google Scholar] [CrossRef]
  11. Tyagi, W.; Yumnam, J.S.; Sen, D.; Rai, M. Root transcriptome reveals efficient cell signaling and energy conservation key to aluminum toxicity tolerance in acidic soil adapted rice genotype. Sci. Rep. 2020, 10, 4580. [Google Scholar] [CrossRef] [PubMed]
  12. Xuhui, L.; Weiwei, C.; Siqi, L.; Junteng, F.; Hang, Z.; Xiangbo, Z.; Yongwen, Q. Full-length transcriptome analysis of maize root tips reveals the molecular mechanism of cold stress during the seedling stage. BMC Plant Biol. 2022, 22, 398. [Google Scholar] [CrossRef] [PubMed]
  13. Wang, X.; Wu, D.; Yang, Q.; Zeng, J.; Jin, G.; Chen, Z.H.; Zhang, G.; Dai, F. Identification of Mild Freezing Shock Response Pathways in Barley Based on Transcriptome Profiling. Front. Plant Sci. 2016, 7, 106. [Google Scholar] [CrossRef] [PubMed]
  14. Xinquan, Y.; Peng, L.; Han, Z.; Zhongfu, N.; Sun, Q. Genetic diversity revealed by genomic-SSR and EST-SSR markers among common wheat, spelt and compactum. Prog. Nat. Sci. 2005, 15, 24–33. [Google Scholar] [CrossRef]
  15. Qu, K.; Wang, J.; Cheng, Y.; Bai, B.; Xia, X.; Geng, H. Identification of quantitative trait loci and candidate genes for grain superoxide dismutase activity in wheat. BMC Plant Biol. 2024, 24, 716. [Google Scholar] [CrossRef]
  16. Sedaghat, M.; Hazrati, S.; Omrani, M. Use of zeolite and salicylic acid as an adaptation strategy against drought in wheat plants. S. Afr. J. Bot. 2022, 146, 111–117. [Google Scholar] [CrossRef]
  17. Romero, I.; Teresa Sanchez-Ballesta, M.; Maldonado, R.; Isabel Escribano, M.; Merodio, C. Anthocyanin, antioxidant activity and stress-induced gene expression in high CO2-treated table grapes stored at low temperature. J. Plant Physiol. 2008, 165, 522–530. [Google Scholar] [CrossRef]
  18. Guy, C. Cold Acclimation And Freezing Stress Tolerance: Role Of Protein Metabolism. Annu. Rev. Plant Physiol. 1990, 41, 187–223. [Google Scholar] [CrossRef]
  19. Gopalakrishnan Nair, P.M.; Kang, I.-S.; Moon, B.-Y.; Lee, C.-H. Effects of low temperature stress on rice (Oryzasativa L.) plastid ω-3 desaturase gene, OsFAD8 and its functional analysis using T-DNA mutants. Plant Cell Tissue Organ Cult. (PCTOC) 2009, 98, 87–96. [Google Scholar] [CrossRef]
  20. Zhao, Y.; Zhou, M.; Xu, K.; Li, J.; Li, S.; Zhang, S.; Yang, X. Integrated transcriptomics and metabolomics analyses provide insights into cold stress response in wheat. Crop J. 2019, 7, 857–866. [Google Scholar] [CrossRef]
  21. Qiao, Y.; Wu, L.; Yang, S.; Wang, Q.; Gu, H.; Wei, L.; Liu, G.; Zhou, S.; Wang, P.; Song, M. Metabolomic and transcriptomic analyses provide insights into variations in flavonoids contents between two Artemisia cultivars. BMC Plant Biol. 2023, 23, 288. [Google Scholar] [CrossRef] [PubMed]
  22. Lai, J.; Li, C.; Zhang, Y.; Wu, Z.; Li, W.; Zhang, Z.; Ye, W.; Guo, H.; Wang, C.; Long, T.; et al. Integrated Transcriptomic and Metabolomic Analyses Reveal the Molecular and Metabolic Basis of Flavonoids in Areca catechu L. J. Agric. Food Chem. 2023, 71, 4851–4862. [Google Scholar] [CrossRef]
  23. Li, H.; Zhao, J.; Zhang, W.; He, T.; Meng, D.; Lu, Y.; Zhou, S.; Wang, X.; Zhao, H. Comparative Transcriptome Analysis of Two Types of Rye Under Low-Temperature Stress. Curr. Issues Mol. Biol. 2025, 47, 171. [Google Scholar] [CrossRef]
  24. Li, Y.; Böck, A.; Haseneyer, G.; Korzun, V.; Wilde, P.; Schön, C.-C.; Ankerst, D.P.; Bauer, E. Association analysis of frost tolerance in rye using candidate genes and phenotypic data from controlled, semi-controlled, and field phenotyping platforms. BMC Plant Biol. 2011, 11, 146. [Google Scholar] [CrossRef] [PubMed]
  25. Molla, K.A.; Debnath, A.B.; Ganie, S.A.; Mondal, T.K. Identification and analysis of novel salt responsive candidate gene based SSRs (cgSSRs) from rice (Oryza sativa L.). BMC Plant Biol. 2015, 15, 122. [Google Scholar] [CrossRef]
  26. Hwarari, D.; Guan, Y.; Ahmad, B.; Movahedi, A.; Min, T.; Hao, Z.; Lu, Y.; Chen, J.; Yang, L. ICE-CBF-COR Signaling Cascade and Its Regulation in Plants Responding to Cold Stress. Int. J. Mol. Sci. 2022, 23, 1549. [Google Scholar] [CrossRef]
  27. Singh, K.; Gulyás, Z.; Athmer, B.; Kovács, B.; Mednyánszky, Z.; Galiba, G.; Stein, N.; Simon-Sarkadi, L.; Kocsy, G. Comparative study of free amino acids at metabolite and gene expression levels in Triticeae during cold acclimation. J. Plant Biochem. Biotechnol. 2024, 33, 558–569. [Google Scholar] [CrossRef]
  28. Rahman, F.U.; Zhu, Q.; Zhang, K.; Kang, X.; Wang, X.; Chen, W.; Li, X.; Zhu, X. Transcriptome and metabolome analyses provide insights into the fruit softening disorder of papaya fruit under postharvest heat stress. Food Chem. 2024, 460, 140771. [Google Scholar] [CrossRef]
  29. Liu, J.; Bao, Y.; Liu, S.; Zhu, L.; Xu, X.; Jiang, G.; Zhang, Z. Physiological and transcriptomic analyses reveal mechanisms of exogenous strigolactones to regulate cold tolerance in litchi fruit. Postharvest Biol. Technol. 2024, 210, 112764. [Google Scholar] [CrossRef]
  30. Asakura, H.; Yamakawa, T.; Tamura, T.; Ueda, R.; Taira, S.; Saito, Y.; Abe, K.; Asakura, T. Transcriptomic and Metabolomic Analyses Provide Insights into the Upregulation of Fatty Acid and Phospholipid Metabolism in Tomato Fruit under Drought Stress. J. Agric. Food Chem. 2021, 69, 2894–2905. [Google Scholar] [CrossRef]
  31. Song, Z.; Yan, A.; Li, Z.; Shang, Y.; Chen, R.; Yang, Z.; Guo, Z.; Zhang, Y.; Wen, T.; Ogaji, O.D.; et al. Integrated metabolomic and transcriptomic analysis reveals the effects and mechanisms of Jinqi Jiangtang tablets on type 2 diabetes. Phytomedicine 2024, 134, 155957. [Google Scholar] [CrossRef] [PubMed]
  32. Mehta, G.; Muthusamy, S.K.; Singh, G.P.; Sharma, P. Identification and development of novel salt-responsive candidate gene based SSRs (cg-SSRs) and MIR gene based SSRs (mir-SSRs) in bread wheat (Triticum aestivum). Sci. Rep. 2021, 11, 2210. [Google Scholar] [CrossRef] [PubMed]
  33. Gao, L.; Jia, J.; Kong, X. A SNP-Based Molecular Barcode for Characterization of Common Wheat. PLoS ONE 2016, 11, e0150947. [Google Scholar] [CrossRef]
  34. Yang, F.; Lang, T.; Wu, J.; Zhang, C.; Qu, H.; Pu, Z.; Yang, F.; Yu, M.; Feng, J. SNP loci identification and KASP marker development system for genetic diversity, population structure, and fingerprinting in sweetpotato (Ipomoea batatas L.). BMC Genom. 2024, 25, 1245. [Google Scholar] [CrossRef] [PubMed]
  35. Tang, W.; Lin, J.; Wang, Y.; An, H.; Chen, H.; Pan, G.; Zhang, S.; Guo, B.; Yu, K.; Li, H.; et al. Selection and Validation of 48 KASP Markers for Variety Identification and Breeding Guidance in Conventional and Hybrid Rice (Oryza sativa L.). Rice 2022, 15, 48. [Google Scholar] [CrossRef]
  36. Fang, T.; Lei, L.; Li, G.; Powers, C.; Hunger, R.M.; Carver, B.F.; Yan, L. Development and deployment of KASP markers for multiple alleles of Lr34 in wheat. Theor. Appl. Genet. 2020, 133, 2183–2195. [Google Scholar] [CrossRef]
  37. Liu, G.; Mullan, D.; Zhang, A.; Liu, H.; Liu, D.; Yan, G. Identification of KASP markers and putative genes for pre-harvest sprouting resistance in common wheat (Triticum aestivum L.). Crop J. 2023, 11, 549–557. [Google Scholar] [CrossRef]
  38. Peng, X.-A.; Lu, M.-A.; Zhang, L.; Liu, T.; Cao, L.; Song, Y.-H.; Zheng, W.-Y.; He, X.-F.; Zhu, Y.-L. Genome-wide association study of major grain quality traits in wheat based on 55K SNP arrays. Acta Agron. Sin. 2024, 50, 1948–1960. [Google Scholar]
  39. Hasanuzzaman, M.; Saha, N.R.; Farabi, S.; Tahjib-Ul-Arif, M.; Yasmin, S.; Haque, M.S. Screening of salt-tolerant wheat (Triticum aestivum L.) through morphological and molecular markers. Cereal Res. Commun. 2023, 51, 87–100. [Google Scholar] [CrossRef]
Figure 1. Phenotypic and physiological responses of four rye varieties to low-temperature stress. (a) Phenotypic changes in four rye varieties (“Winter”, HZHM3, HZHM8, and “Victory”) following low-temperature treatment. Growth status at 0 h and 168 h of treatment. (b) Histograms depicting physiological responses of the four rye varieties under low-temperature stress, including CAT, POD, SOD, and APX activity levels. Different letters indicate significant difference at p < 0.05. Error bars are the standard deviation.
Plants 14 01588 g001
Figure 2. Statistical distribution of differentially expressed genes in the “Winter” rye transcriptome. Yellow bars indicate the number of upregulated genes in “Winter” rye under 12 h of cold stress compared to the control group, while green bars represent the number of downregulated genes under the same conditions.
Plants 14 01588 g002
Figure 3. Transcriptomic differential gene expression changes in “Winter” rye under cold stress and a KEGG enrichment map of DEGs expression. (a) GO analysis of DEGs in “Winter” rye after 12 h of cold stress. The red bars represent upregulated DEGs, and the green bars represent downregulated DEGs. The vertical axis indicates the number of DEGs, while the horizontal axis corresponds to different biological functions, including biological processes, cellular components, and molecular functions. (b) KEGG pathway enrichment analysis of differentially expressed genes in the “Winter” rye transcriptome under cold stress. The diagram illustrates DEG enrichment across various pathways, including cellular pathways, genetic information, metabolism, and organic systems. The vertical axis represents the pathway names, and the horizontal axis shows the number of genes involved in each pathway. The length of each horizontal line corresponds to the number of DEGs in the pathway, with the color of the dots indicating different pathway categories. (c) Top 20 GO entry enrichments for differentially expressed genes in the transcriptome of “Winter” rye. This circular diagram displays the names or descriptions of GO entries in the outer circle, involving biological processes and molecular functions. In the middle circle, the distribution of upregulated and downregulated genes in each GO term is indicated. Purple domains represent upregulated gene enrichment, and blue domains represent downregulated gene enrichment. (d) Top 20 KEGG pathways enriched for differentially expressed genes in the “Winter” rye transcriptome. The vertical axis represents the pathway names, and the horizontal axis represents the number of differing genes. The size of the circles indicates the degree of DEG enrichment in each pathway, with larger circles representing more significant enrichment.
Plants 14 01588 g003aPlants 14 01588 g003b
Figure 4. Heat map of differential gene expression in the glyoxylate and dicarboxylate metabolism and alanine, aspartate, and glutamate metabolism pathways under cold stress. (a) Changes in the expression of differentially expressed genes (DEGs) in the glyoxylate and dicarboxylate metabolism pathway under cold stress at 0 h and 12 h. (b) Changes in the expression levels of DEGs in the alanine, aspartate, and glutamate metabolism pathway under cold stress at 0 h and 12 h. Red indicates a significant upregulation of gene expression, while blue indicates significant downregulation. The horizontal axis represents the duration of cold stress treatment (0 h and 12 h), and the vertical axis represents the names of the differential genes.
Plants 14 01588 g004
Figure 5. Pathway interactions between glyoxylate and dicarboxylate metabolism and alanine, aspartate, and glutamate metabolism under cold stress. The glyoxylate and dicarboxylate metabolism pathway is represented in orange, while the alanine, aspartate, and glutamate metabolism pathway is shown in blue-green. Genes highlighted in red indicate upregulated expression, whereas genes marked in blue indicate downregulated expression within their respective pathways.
Plants 14 01588 g005
Figure 6. Expression dynamics of ScCOR410 and ScCOR413 in rye under cold stress. (a) Histogram illustrating the changes in ScCOR410 expression levels in four rye varieties subjected to low-temperature stress. (b) Expression patterns of ScCOR413 in four rye varieties under cold stress. Rye plants were subjected to 4 °C cold stress with sampling at 0 h, 12 h, 24 h, 48 h, 72 h, 96 h, 120 h, 144 h, and 168 h. Red bars indicate upregulated expression, while blue bars indicate downregulated expression. Different letters indicate significant difference at p < 0.05. Error bars are the standard deviation.
Plants 14 01588 g006
Table 1. Number of “Winter” rye EST-SSRs.
Chromosome LocationNumber
Chromosome1R1491
Chromosome2R1628
Chromosome3R1398
Chromosome4R1448
Chromosome5R1757
Chromosome6R1374
Chromosome7R1404
Unknown Chromosome346
Total10,846
Disclaimer/Publisher’s Note: The statements, opinions and data contained in all publications are solely those of the individual author(s) and contributor(s) and not of MDPI and/or the editor(s). MDPI and/or the editor(s) disclaim responsibility for any injury to people or property resulting from any ideas, methods, instructions or products referred to in the content.

