Article

Invasion Status, Mechanisms, and Future Distribution Prediction of Solidago canadensis in the Trade Port Region: A Case Study of Ningbo Port, China

1
Ningbo University Donghai Academy, Zhejiang Ocean Development Think Tank Alliance, Ningbo 315211, China
2
Department of Geography & Spatial Information Techniques, Ningbo University, Ningbo 315211, China
*
Authors to whom correspondence should be addressed.
Plants 2025, 14(10), 1546; https://doi.org/10.3390/plants14101546
Submission received: 13 April 2025 / Revised: 16 May 2025 / Accepted: 19 May 2025 / Published: 21 May 2025
(This article belongs to the Topic Plant Invasion)

Abstract

:
Trade ports are the first places where alien species invade and the source of their spread to other areas. Controlling invasions in these regions can effectively reduce invasion pressure and disrupt the spread pathways of invasive species, thereby significantly reducing their threat to local ecosystems and biodiversity loss. Based on 595 field survey plots, the Generalized Linear Model (GLM) and Species Distribution Model (MaxEnt) were employed to analyze and predict the invasion mechanisms and future possible distribution of Solidago canadensis in the Ningbo Port, China. The results indicate that the invasion of S. canadensis in the Ningbo Port was particularly severe, with a 67.7% occurrence rate of all sampling plots in the field survey, and a risk level classified as Grade 1. Biodiversity (p < 0.001) and the minimum temperature of the coldest month (p < 0.01) significantly affect the invasiveness. Highly diverse communities could resist the invasion of alien species, which support Elton’s diversity–invasibility hypothesis. Low temperatures had a restrictive effect on the invasion of S. canadensis. The total suitable area continued to expand under three different climate change scenarios compared to current conditions (increased by 3.73%, 5.67%, and 3.74% by the 2070s). The total potential habitat area of S. canadensis reached its maximum extent (89.77%) under the medium greenhouse gas emission scenario in the 2050s. Meanwhile, the medium suitable area exhibited the greatest fluctuation among the three climate scenarios. Under the low emission condition, the medium suitable area of S. canadensis diminished by 63.10 km2, but in the medium and high emission condition, its area expanded by 91.13 km2 and 16.20 km2, respectively. Under future climate warming scenarios, the invasion risk of S. canadensis in Ningbo Port will continue to increase. The results of our study reveal the diffusion mechanisms of invasive plants at the colonization source, providing important theoretical support for invasive alien species’ initial prevention and control.

1. Introduction

Influenced by global trade and climate change, invasive alien species (IAS) have become a significant threat to global ecological security [1,2]. Taking China as an example, the number of IAS increased from 126 in 2005 to 403 in 2020 [3], causing economic losses of approximately USD 14.45 billion, which severely threatens ecological security, biodiversity, and food security [4]. As the core nodes of global trade, ports handle over 80% of the world’s cargo volume and serve as major hubs for trade and maritime traffic [5]. The frequent ship transportation and human activities in the port region make these regions the first to be colonized by invasive species, and the richness of alien plants in these regions is obviously higher than that in near-natural ecosystems [6]. The research of 54 waterway ports in Central Europe over the past 40 years has shown that alien species account for 41% of all species and increase with the decrease in the distance from the ocean [7]. Moreover, studies shown a positive correlation between the first record of alien species and international import volume [8]. It was projected that, by 2050, the global shipping volume will further increase by 240% to 1209%, leading to significant changes in the risk of alien species invasion in port areas [9]. Thus, effectively controlling IAS in the port region plays a crucial role in preventing their wide spread and in formulating control measures.
The successful establishment of IAS is influenced by factors such as species characteristics, community diversity, climate, and soil nutrition [10,11,12,13]. Studies have demonstrated that variations in species traits play a crucial role in determining the success of invasions [12,14]. For example, Conyza canadensis successfully invaded eastern China due to its superior light acquisition ability compared to local species [15]. Ailanthus altissima successfully invaded all administrative regions in Italy through competition [16]. Moreover, some studies using comparative methods have found that many IAS, such as Ageratina adenophora and Jacobaea vulgaris, enhance the probability of their successful invasion by adjusting the nutrient distribution and functional traits of leaves [17,18,19]. The Elton’s diversity–invasibility hypothesis posits that a higher species diversity in local communities reduces the likelihood of successful invasion by alien plants [20]. The successful establishment of IAS is also closely related to environmental conditions. For instance, Dawson et al. [13] found that abundant resources facilitate biological invasions. However, in contrast, Funk et al. [21] concluded that areas with resource scarcity can also be successfully invaded because IAS have a higher resource utilization efficiency than local species in resource-poor environments. Most existing studies primarily focus on analyzing community survey data post-invasion, aiming to uncover the relationship among invasion intensity, diversity, and environmental factors to explain invasion mechanisms [22,23,24]. They relatively lack analyses of the colonization source, specifically in the trade port region where alien species first arrive. This limitation hinders the implementation of control measures at the source.
Solidago canadensis is a perennial herb that belongs to the Asteraceae family, indigenous to the United States and Canada [25]. Initially imported to China in 1935 as an ornamental species, it subsequently escaped cultivation and became an invasive problem [26]. S. canadensis has a strong competitive ability due to its tall, rapid growth and high reproductive capacity [15,27], and can quickly form monodominant stands in invaded areas, severely threatening local biodiversity and ecological balance [28]. Moreover, it exhibits strong allelopathic effects, as its root exudates can inhibit the growth and development of various crops [29], resulting in reduced crop yields and quality decline. Thus, understanding the invasion mechanisms of S. canadensis and seeking control methods have become a hot issue for local governments and the academic community.
Ningbo Port is the largest foreign trade port in the world by cargo throughput, with approximately 25% of its containers originating from North America, which is the native region of S. canadensis [30]. The reproductive bodies of this species are spread through containers, ballast water, or transport vehicles along roads, rivers, and other pathways [31,32]. Among them, ballast water alone can transfer 3000 to 4000 different species every day [33]. Furthermore, a large number of artificial structures in port regions (such as docks and breakwaters) provide important spatial resources for the settlement and spread of IAS [34]. Thus, port regions are highly vulnerable to invasion and the establishment of IAS. Our study investigated the current invasion status of S. canadensis in the Ningbo Port region, analyzed the influencing factors, and aimed to reveal the invasion mechanisms and predict its invasion trends under different future climate scenarios. The specific objectives of this study were: (1) to analyze the current geographic distribution and invasion risk level of S. canadensis in Ningbo Port; (2) to reveal its invasion mechanisms in port regions; and (3) to predict the trend of its potential distribution area in the port region under different climate scenarios in the future.

2. Results

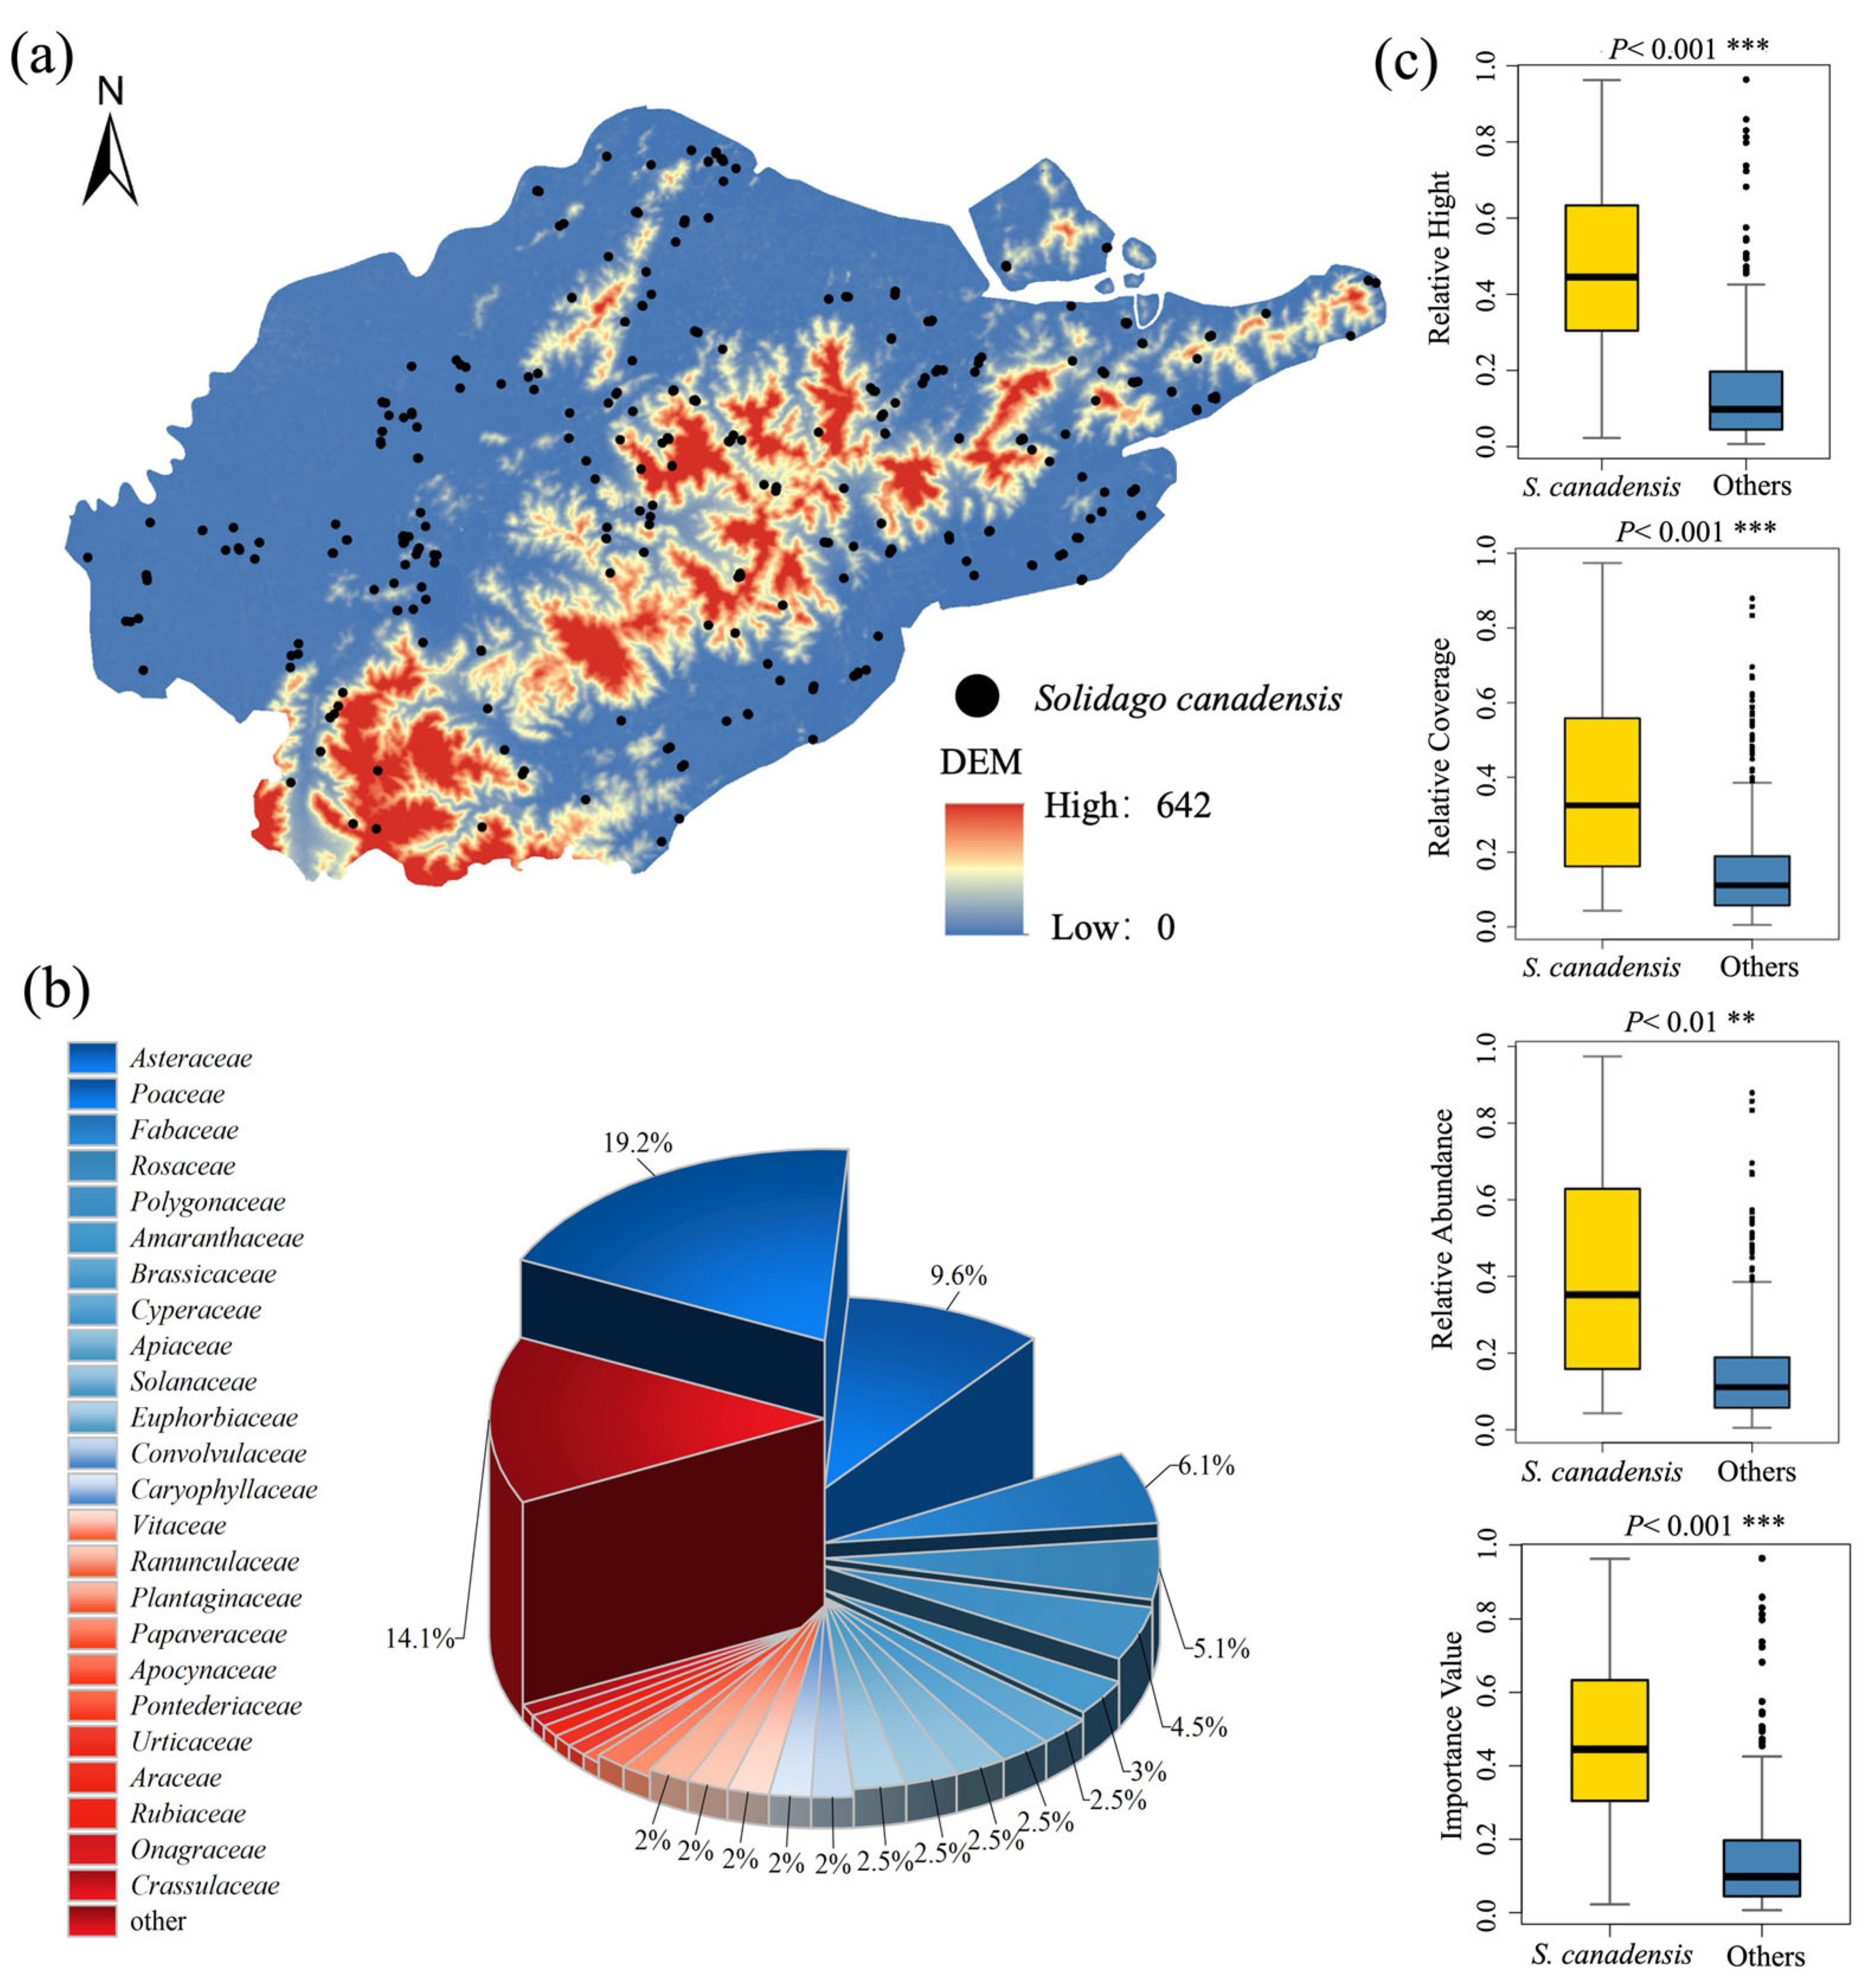
2.1. Invasion Status and Risk Level

We surveyed a total of 205 species in 595 sample plots; these species belong to 53 families, with the Asteraceae family having the highest proportion (19.2%) (Figure 1b). The next were Poaceae and Fabaceae, accounting for 9.6% and 6.1%, respectively. S. canadensis was widely distributed in the study area, exhibiting a scattered multi-point distribution pattern. S. canadensis was present in 403 of the total plots, accounting for 67.7% (Figure 1a). In addition, S. canadensis held a competitive advantage in the plots, with mean values of relative height, relative cover, relative abundance, and ecological importance of 0.459, 0.379, 0.381, and 0.457, respectively. Other species had a more dispersed distribution of height, coverage, abundance, and importance value. All values of S. canadensis were significantly higher than those of other species for relative height (p < 0.001), relative cover (p < 0.001), relative abundance (p < 0.01), and importance (p < 0.001) (Figure 1c). Among them, the plant height showed the most significant difference.
Based on the formulas mentioned in the Section 4.2 and Table S1 (list in the Supplementary Materials), the risk assessment of S. canadensis indicated an evaluation score of 2.92, classifying it as a level 1 invasion risk. This was consistent with the classification in the Chinese Alien Invasive Species Information System (https://www.iplant.cn/ias/, accessed on 13 May 2025), where it was categorized as a malicious invader.

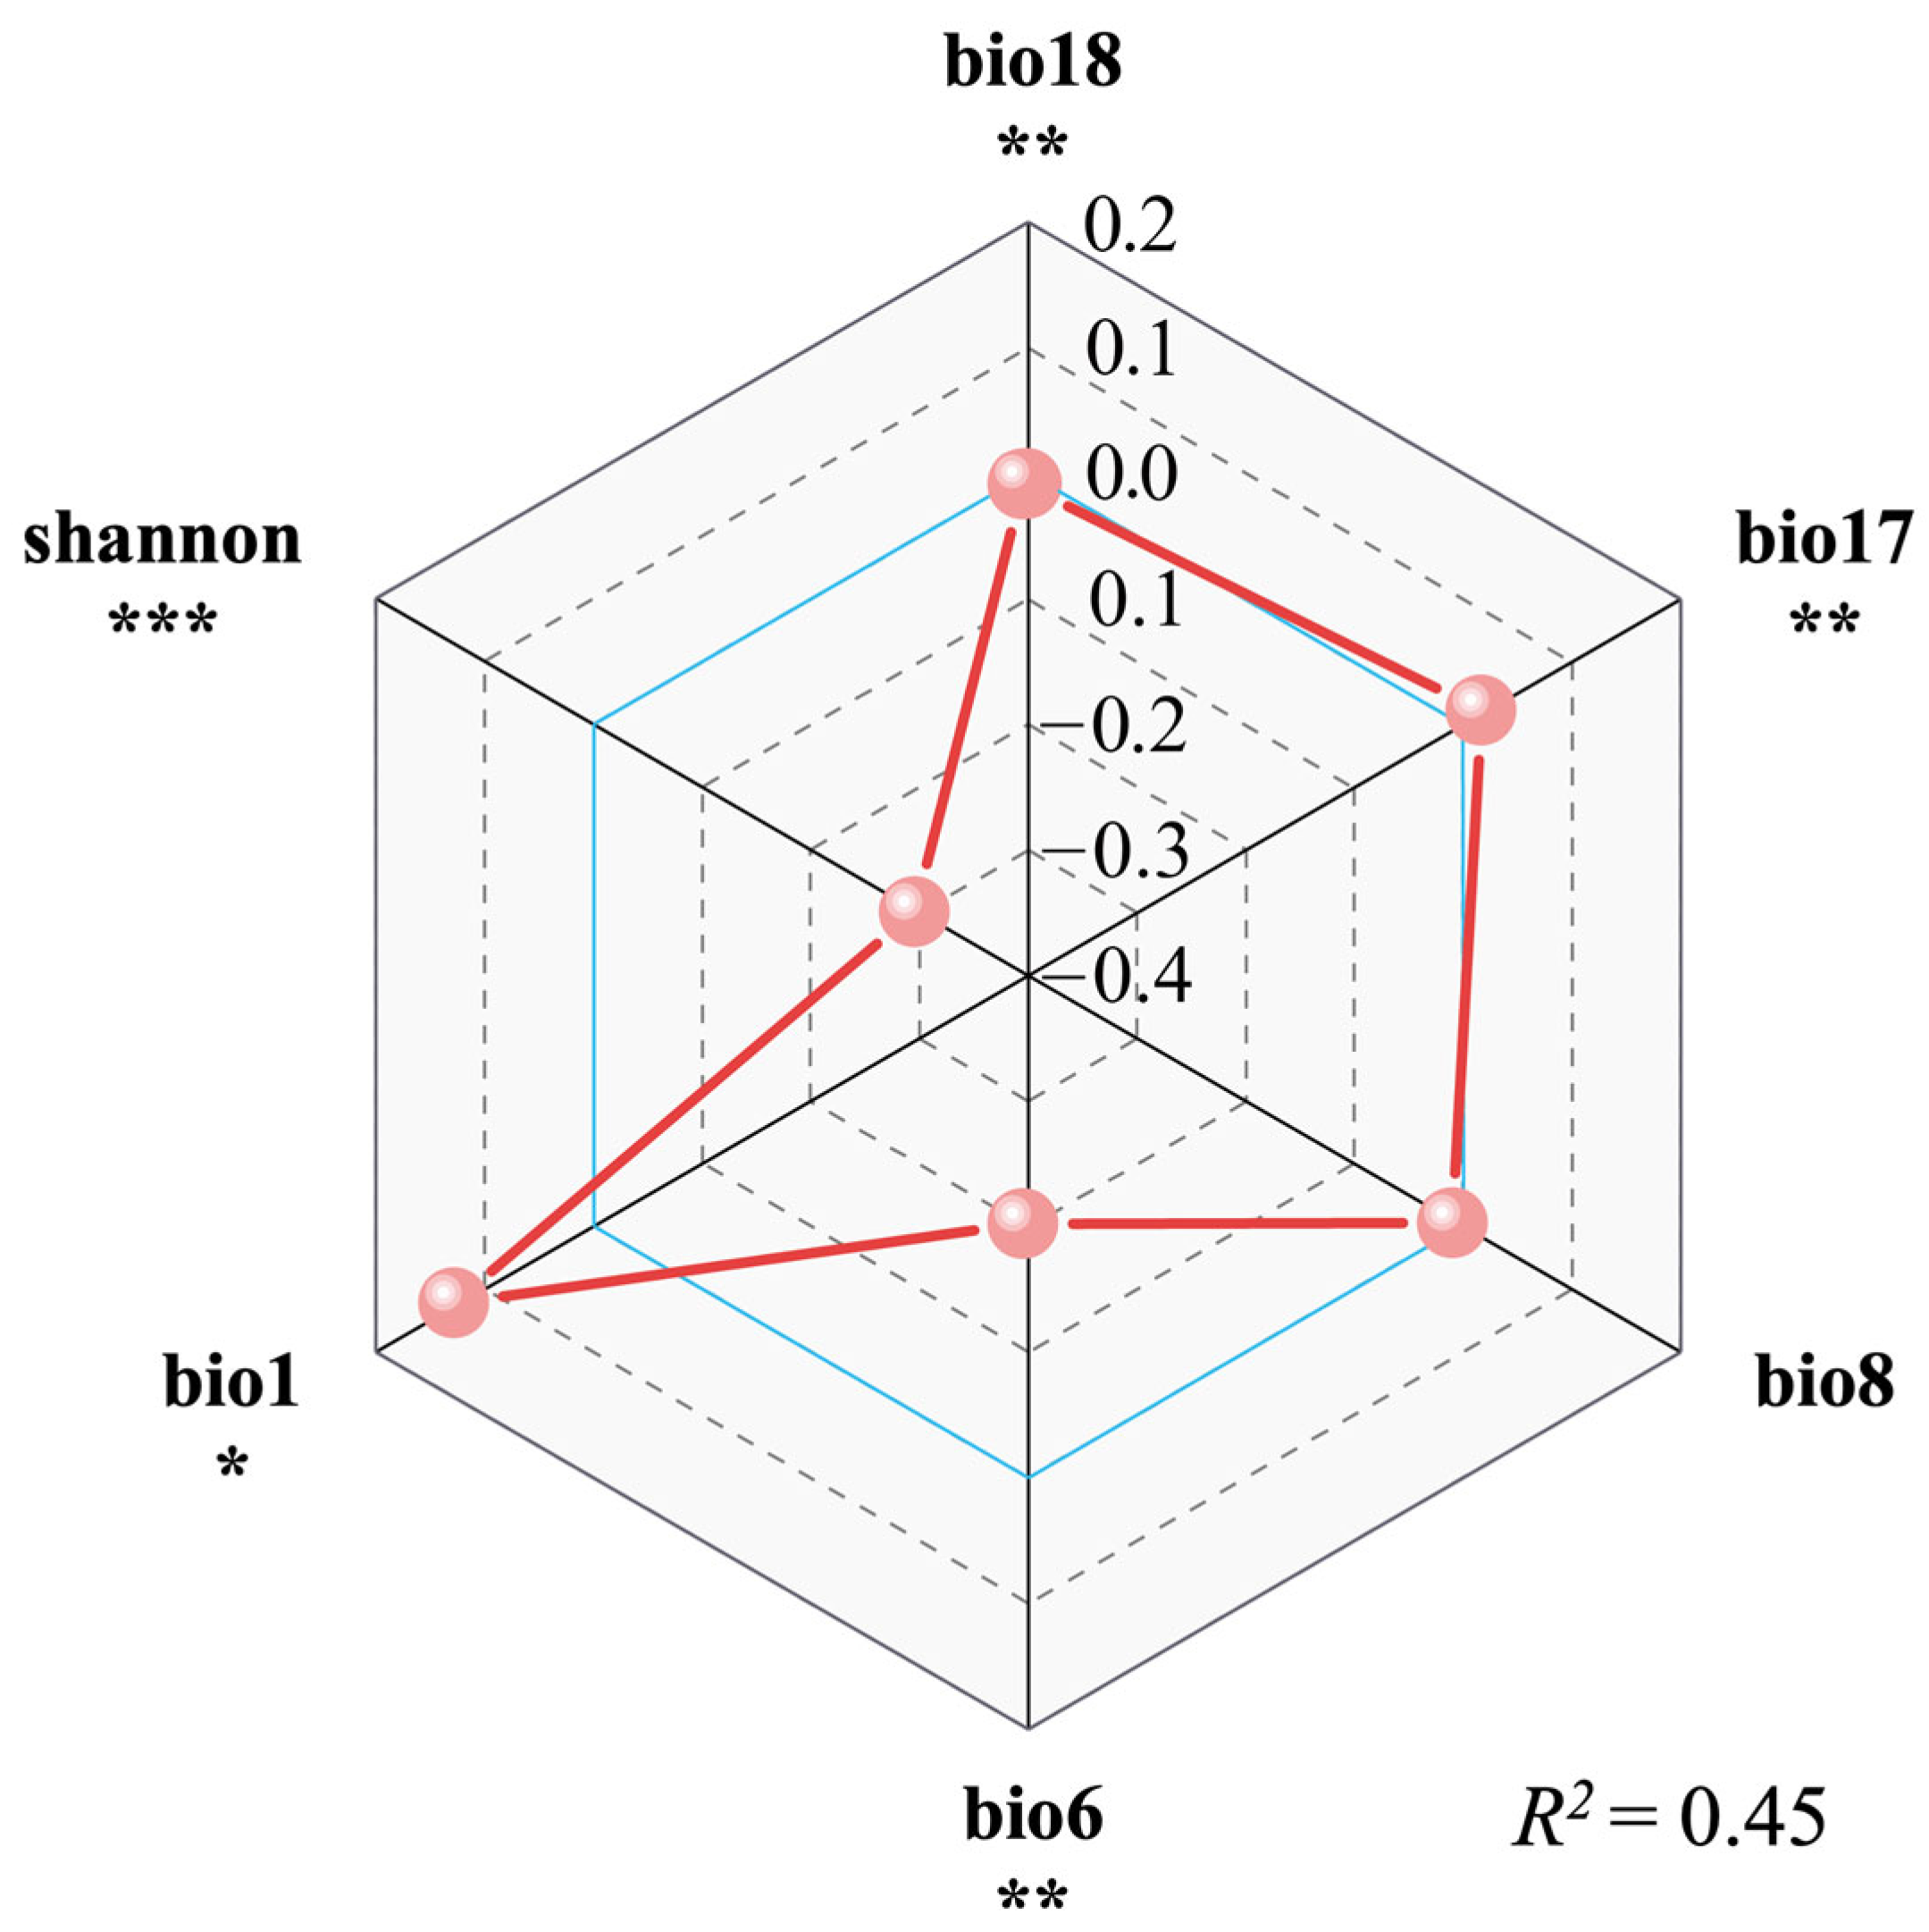
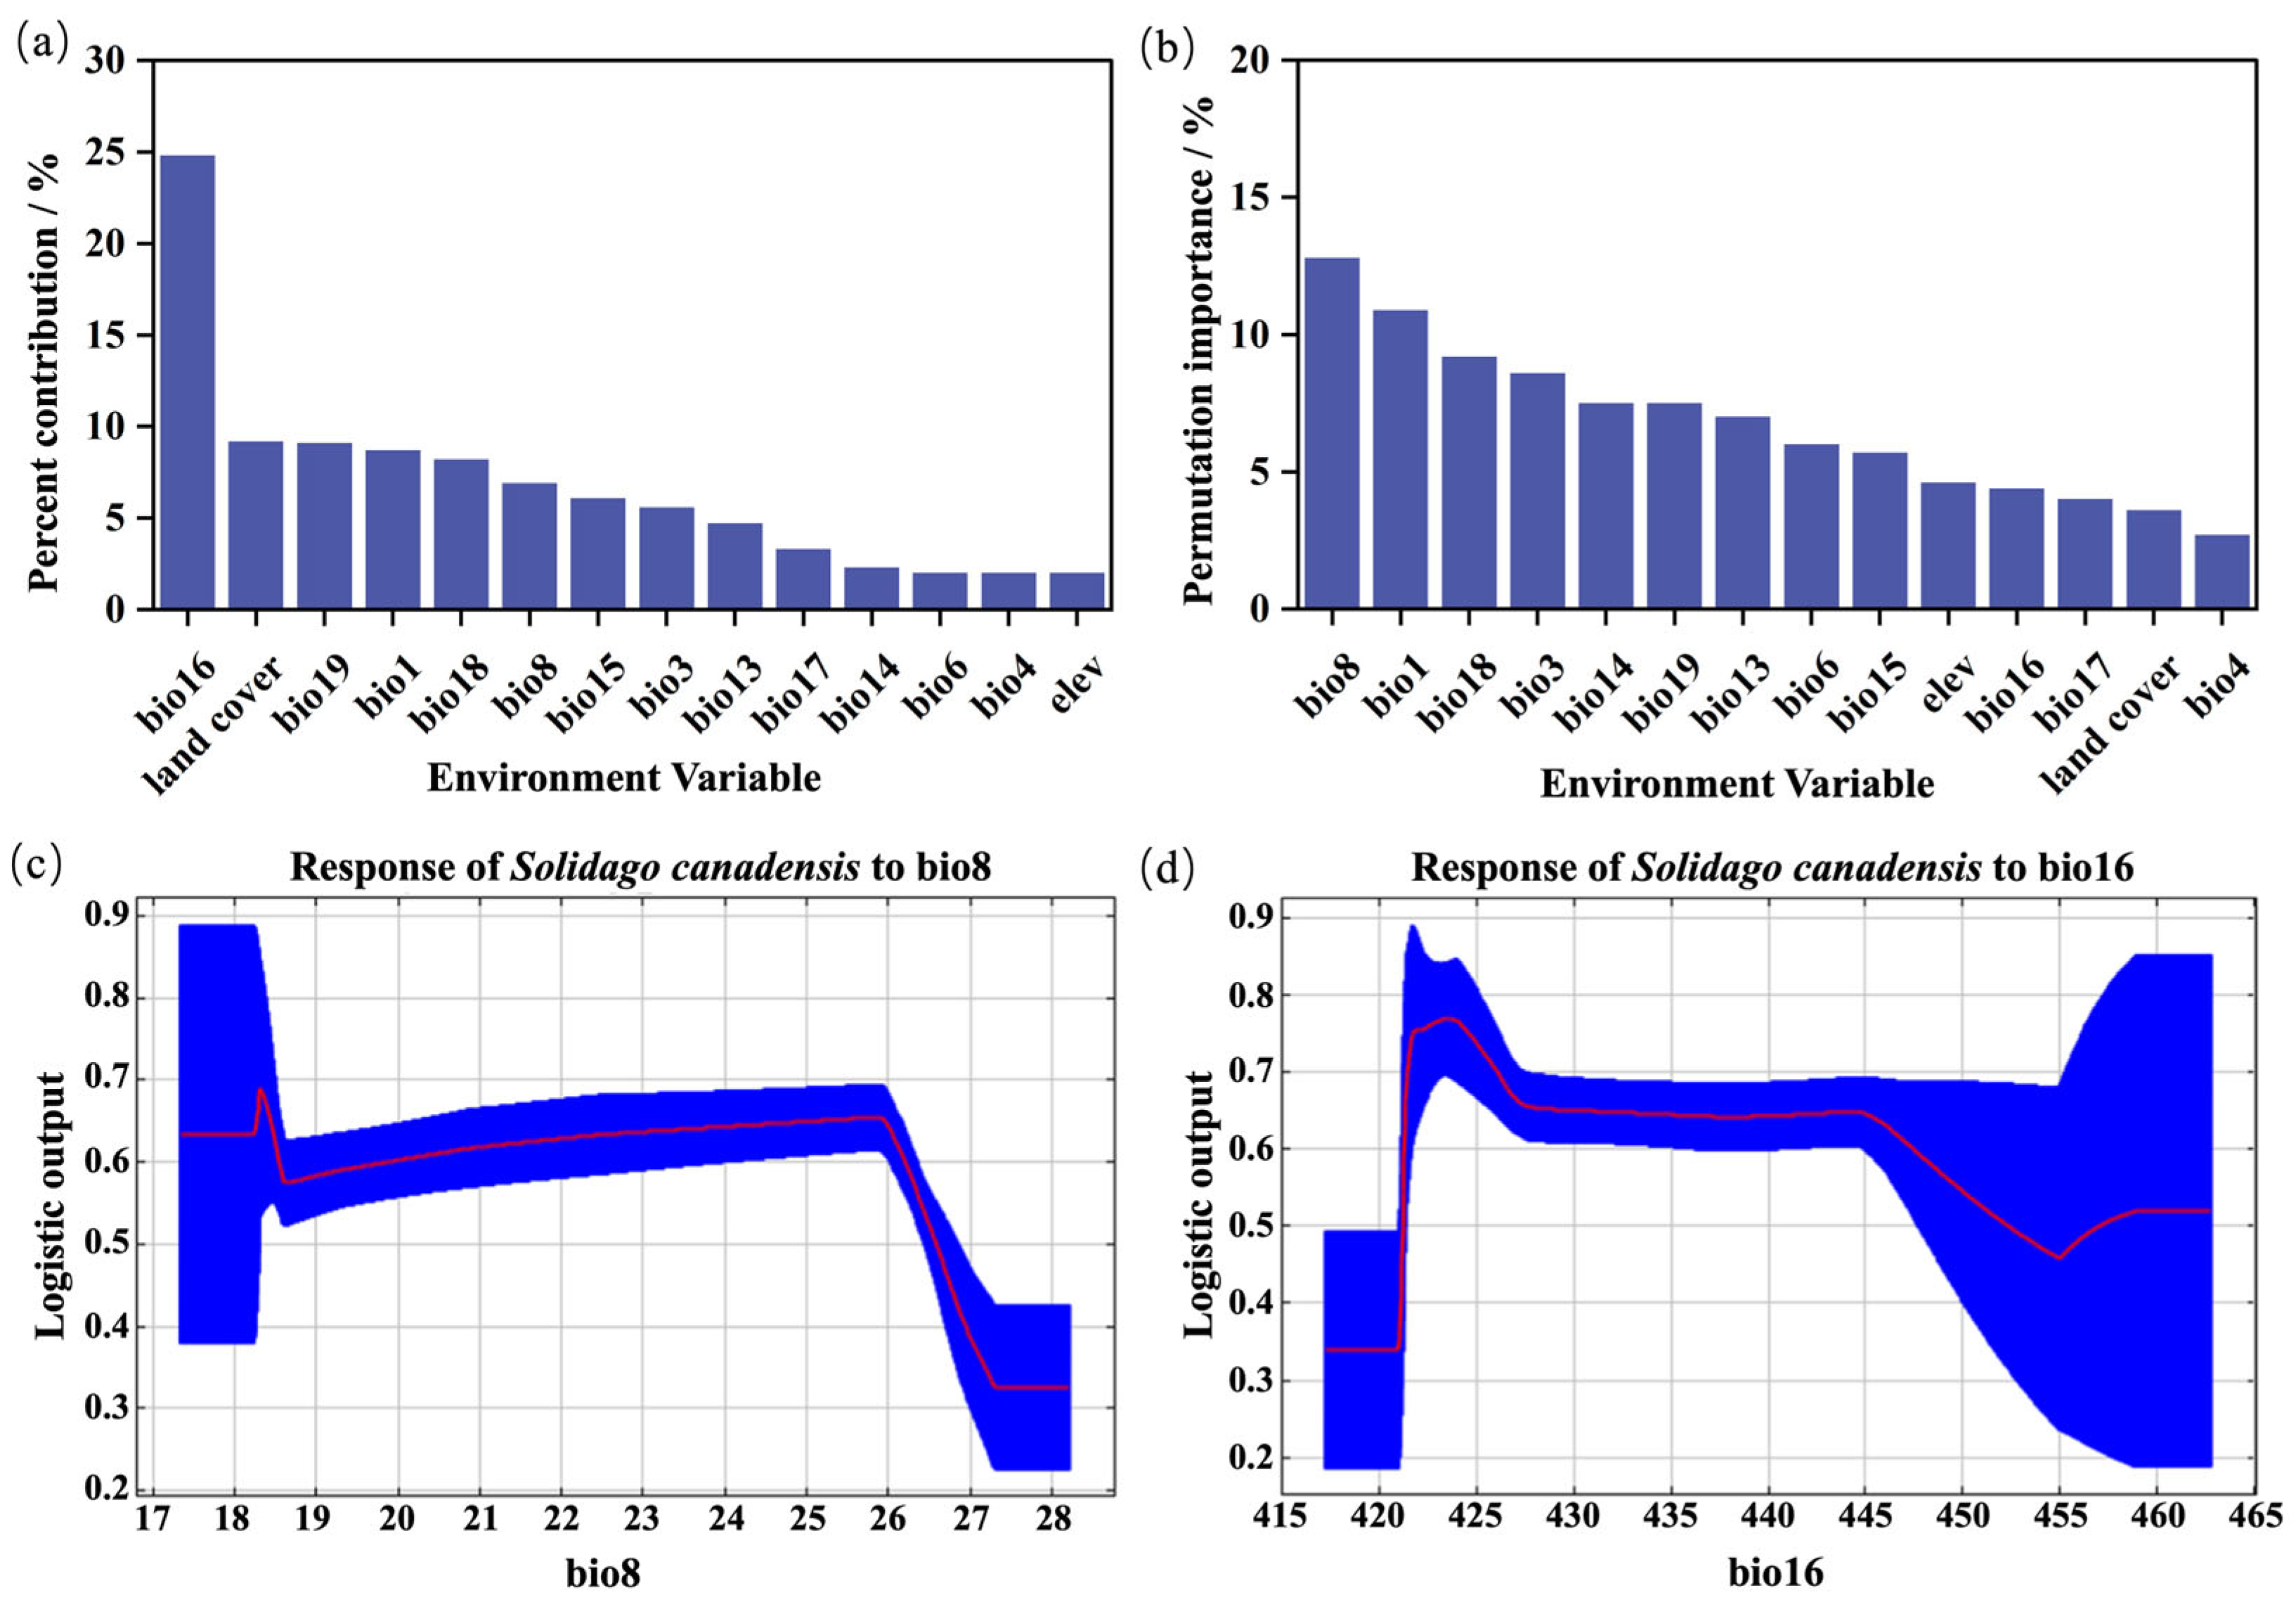
2.2. The Relationship Between Invasion Intensity, Plant Diversity, and Environmental Factors

We analyzed the selected variables using the GLM. The R2 of the model was 0.45, indicated a relatively good explanatory power. The results of GLM show that the Shannon–Wiener Diversity Index was the most important factor on the invasiveness of S. canadensis, and there was an extremely significant negative correlation between them (p < 0.001). Among the variables, bio6 and bio18 showed significant negative correlations with the invasiveness of S. canadensis (p < 0.01). Notably, bio6 contributes more than bio18 to this relationship. Oppositely, it had a significant positive correlation with bio1 (p < 0.01) and bio17 (p < 0.01). Although a negative correlation between invasiveness and bio8 was observed, it was not statistically significant (Figure 2).

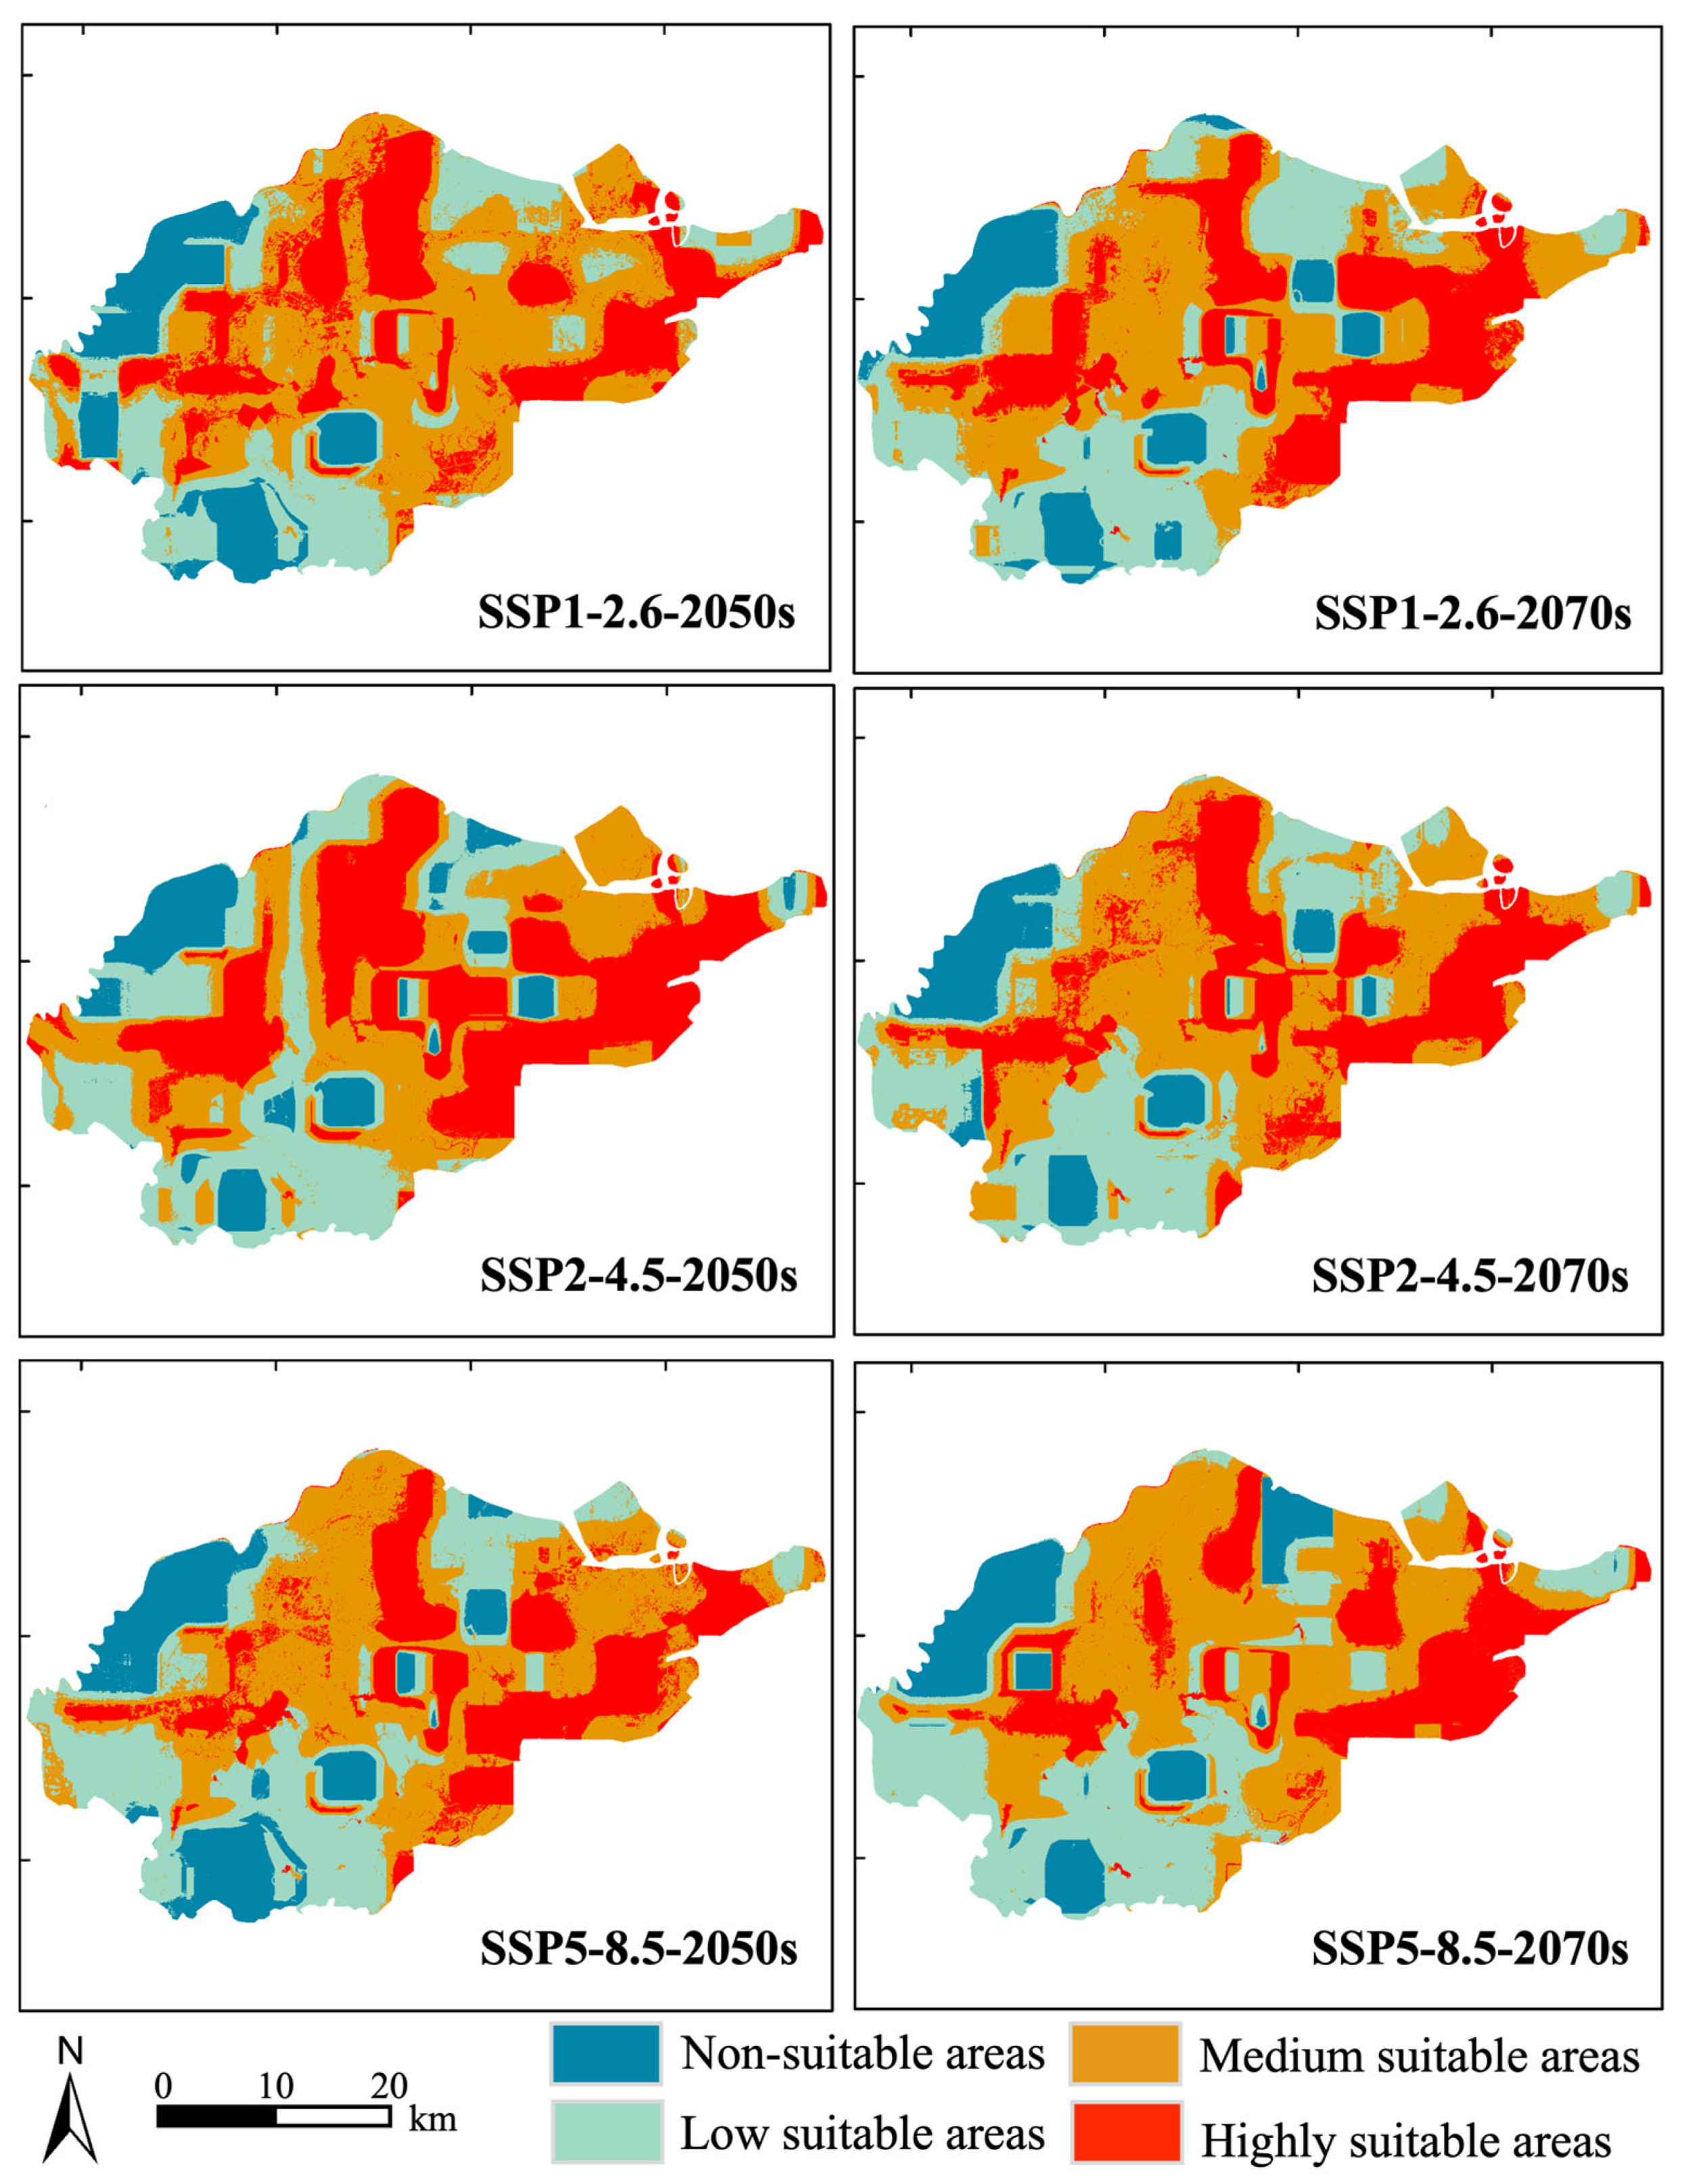
2.3. Potential Distribution of S. canadensis Under Climate Scenarios

The AUC value of this model was 0.845, which indicates that the performance of the model had relatively good predictive accuracy (Figure S1). The percentage contribution of each environmental factors is shown in Figure 3a, with bio16 having the highest contribution (26.1%), followed by land cover (9.7%), bio19 (9.6%), bio1 (9.2%), bio18 (8.6%), bio8 (7.3%), bio15 (6.4%), and bio3 (5.9%). The total contribution of these factors was 82.7%. The permutation importance of the environmental factors is shown in Figure 3b, with bio18 having the highest importance (12.1%), followed by bio1 (11.2%), bio18 (9.2%), bio3 (8.6%), bio19 (7.5%), bio14 (7.5%), bio13 (7.0%), and bio6 (6.0%). After reclassification, the total suitable area of S. canadensis under current climate conditions was estimated: 244.24 km2 in the low suitable areas, 458.88 km2 in the medium suitable areas, and 240.55 km2 in the highly suitable areas, with the total suitable habitat area accounting for 84.10%.
Single-factor modeling was performed for bio8 and bio16. The results show that the probability of S. canadensis distribution fluctuated significantly with changes in the environmental variables. When bio8 was between 17 and 18 °C, the probability of S. canadensis presence remained stable at 0.64 (Figure 3c). As the temperature increased to 18.2~18.5 °C, the probability gradually increased, reaching a peak value of 0.69. It was stable within the range of 18.6 °C~25.9 °C. When the temperature exceeded 25.9 °C, the distribution probability decreased rapidly and stabilized at 0.33 within the range of 27.3~28.1 °C. When bio16 was between 417 and 421 mm, the probability of S. canadensis distribution was 0.33 (Figure 3d). As the precipitation increased to 421~424 mm, the probability gradually rose, peaking at 0.76, stably existing in the range of 427~445 mm. When the precipitation exceeded 424 mm, the distribution probability showed a decreasing trend, stabilizing at 0.51 between 458 and 464 mm.
Under all SSP scenarios, the total suitable habitat area for S. canadensis was higher than that under current climate conditions, although the increase was not substantial (Figure 4). The highly suitable habitat area had a relatively wide distribution, mainly concentrated in the five major port regions of Ningbo Port, extending inland. Under low greenhouse gas emission conditions and medium greenhouse gas emission conditions (from 2050s to 2070s), the percentage of total suitable habitat area decreased from 88.12% to 87.83% and from 89.77% to 89.46%, respectively. Under high greenhouse gas emission conditions, the proportion of total suitable habitat area increased from 86.39% to 87.84%. Specifically, the highly suitable habitat area increased by 0.66 km2, the medium suitable area decreased by 63.10 km2, and the low suitable area increased by 59.09 km2 under low emission greenhouse gas conditions. Under medium greenhouse gas emission conditions, the highly suitable area decreased by 84.03 km2, the medium suitable area increased by 91.13 km2, and the low suitable habitat area decreased by 10.55 km2. Under high greenhouse gas emission conditions, the highly suitable area decreased by 25.17 km2, the medium suitable area increased by 16.20 km2, and the low suitable area increased by 25.25 km2. In summary, under scenarios of low greenhouse gas emissions and medium greenhouse gas emissions, the total suitable habitat area for S. canadensis reached its maximum proportion in the 2050s and then declined slowly. However, under high greenhouse gas emission conditions, the total suitable habitat area continued to increase.

3. Discussion

3.1. The Invasion of S. canadensis Was Severe in the Port Region

Our field survey of S. canadensis in Ningbo Port showed that S. canadensis was present in 403 out of 595 plots, accounting for 67.73%, indicating a severe invasion. This was due to the long history of S. canadensis invasion in the area. S. canadensis first escaped to Zhejiang and Jiangsu provinces after entering Shanghai city [35]. Furthermore, ports were the first areas where S. canadensis established itself through transportation routes. Ningbo Port, with its numerous inner and outer ports and frequent human activity, facilitated the efficient spread of the species via rail, road, and water transport [2]. S. canadensis reproduces sexually and can be wind-dispersed, with a single plant producing 15,000–25,000 seeds annually. The higher average wind speed in coastal cities accelerated seed dispersal [36]. Our results show that S. canadensis had significant advantages in its traits. Its height usually ranges from 1 to 3 m, which is quite different from that of other local species. This made it more competitive in the struggle for resources and enabled it to become an advantageous species. Meanwhile, the competitive advantage in abundance and cover enhanced shading within the community, led to vegetation homogenization, and reduced community diversity [37,38]. The study conducted by Wang et al. further demonstrated that the height of S. canadensis was a critical factor at all stages of invasion, as it occupied distinct spatial niches compared to local species [15,39].
The risk assessment of the invasion of S. canadensis showed it as level 1, and it is regarded as a malicious invader. This classification indicated that S. canadensis poses a high ecological threat and had a significant dispersal potential in the Ningbo Port region. As a malicious IAS, its high reproductive capacity, broad adaptability, and allelopathic effects enabled it to rapidly occupy local ecological niches, substantially inhibiting the establishment and development of native plant community, which resulted in biodiversity decline and impairment in ecosystem functions [29,40]. Our results indicate the severity of the invasion risk posed by S. canadensis. Therefore, regulatory authorities should enhance monitoring and management in port trade areas to reduce the spread of invasive alien plants.

3.2. The Major Underlying Drivers of S. canadensis Invasion

Our results show a significant negative relationship between the invasiveness of S. canadensis and species diversity within the community, which was highly consistent with Elton’s diversity–invasibility hypothesis [20]. Native species occupy multidimensional ecological niches, reducing resource availability to resist alien species. This mechanism was also confirmed in experimental studies on IAS such as Phragmites australis, Senecio, and Cytisus scoparius [41,42]. Furthermore, the mixed allelopathic substances in high-diversity communities can counteract the singular allelopathic effects of S. canadensis, weakening its suppression of the growth and development of local species [35].
Climate change influences multiple mechanisms underlying the success of biological invasions [43], with temperature playing a particularly significant role [44]. Our results show that the invasion intensity of S. canadensis in Ningbo Port decreased with a lower minimum temperature of the coldest month. The possible reason is that S. canadensis is a temperate plant, and changes in climate niches are relatively rare among terrestrial invasive plants [45]. Thus, the low-temperature limitation threshold of S. canadensis suppressed its invasion, while native plants were unaffected [44]. Another major negative influencing factor was bio18. It may be that S. canadensis is better adapted to drier or moderately humid environments, while excessive rainfall could potentially affect root respiration and inhibit its invasion. These two negative influencing factors may suggest that the success of S. canadensis invasion depends on specific climatic windows. The increase in bio1 shortens the plant growth cycle, which may improve the overwinter survival rate of S. canadensis and its seeds [46,47], while bio17 may suppress local plants (such as annual herbs), releasing their ecological niche. The effects of these two factors alleviate the competitive pressure on S. canadensis, enhancing its invasion intensity within the community.

3.3. The Potential Area of S. canadensis Under Different Climate Scenarios

Under the current climate scenario, S. canadensis exhibited strong adaptability in the Ningbo Port region. The total area of suitable habitat accounted for 84.1%, primarily consisting of medium and highly suitable zones, indicating elevated invasion pressure. The response curve under the current climate conditions showed that S. canadensis had a relatively long suitable growth range in the Ningbo Port region. Under the context of global warming, the total suitable habitat area for S. canadensis was higher than that under the current climate scenario, which may be due to its preference for moderately warmer and wetter climatic conditions. The increasing trend under future high emission climate scenarios was evident. This indicates that the invasion of S. canadensis in the Ningbo Port has not yet reached saturation, and its invasion risk is rising, suggesting a potential outbreak. This result aligns with the findings of Seebens et al. [48]. Spatially, the potential highly suitable habitat was relatively dispersed in all three climate scenarios and was mainly located near five major ports. Among them, Meishan Port and its surrounding areas in the southeastern part showed the most concentration. This was because ports, as sources of invasion, were the initial areas where S. canadensis established itself and spread rapidly. Ports acted as “stepping stones” for alien species to invade inland areas, and studies in Taiwan and Hainan have also highlighted the serious issue of alien species invasions in ports [49,50]. The changes in various suitable habitat zones within the port region under the three climatic scenarios differed. The reason may be related to the sensitivity of S. canadensis to dynamic changes in temperature and precipitation, with Ningbo Port being mostly coastal lowlands, with a humid climate and significant influence from monsoons and typhoons. Medium suitable habitat areas may be concentrated in the transition zones from the ports to the inland (such as farmland and wetland edges), where S. canadensis is more sensitive to changes in temperature and precipitation. The response curve of high–weight factors also reflected that S. canadensis prefers warm conditions but not excessive heat. Therefore, regulatory authorities should strengthen the prevention, monitoring, and management of IAS in the port region. Control measures should be prioritized based on the suitability of habitat areas, particularly for highly suitable and medium suitable areas. A multi-scale, cross-regional monitoring network should be established using satellite remote sensing and drone patrols. Additionally, physical removal should be carried out during the growth window of S. canadensis, such as before flowering and seeding or during the coldest month. Its spread could also be mitigated by increasing local species diversity.
Our study mainly focused on exploring the impact of climate change on the distribution of IAS, with less consideration of human activities. Meanwhile, the optimal model we adopted only considered the land cover factor, which might be inadequate. Because of the frequent human activities in port regions, the propagules can be spread through cargo transportation, vehicle tires, personnel clothing, and other ways. Therefore, future studies should consider more factors related to human activities (such as traffic density, land use intensity etc.) to better understand their impact on IAS distribution patterns. In addition to Elton’s diversity–invasibility hypothesis, the current theories about the invasion mechanism of alien species also include the Darwin puzzle (naturalization hypothesis and preadaptation hypothesis). However, we did not analyze genetic diversity or niche overlap to validate these theories, which may limit the generality and scalability of our study. Furthermore, the invasion mechanisms at trade ports in different regions also vary. Future research should expand the scale of study, implement long-term monitoring, and comprehensively consider various influencing factors. These future studies are conducive to a more comprehensive understanding of the contributions and applicability of different invasion mechanisms. This will provide stronger theoretical support for managing IAS, protecting ecosystems, and preserving biodiversity.

4. Materials and Methods
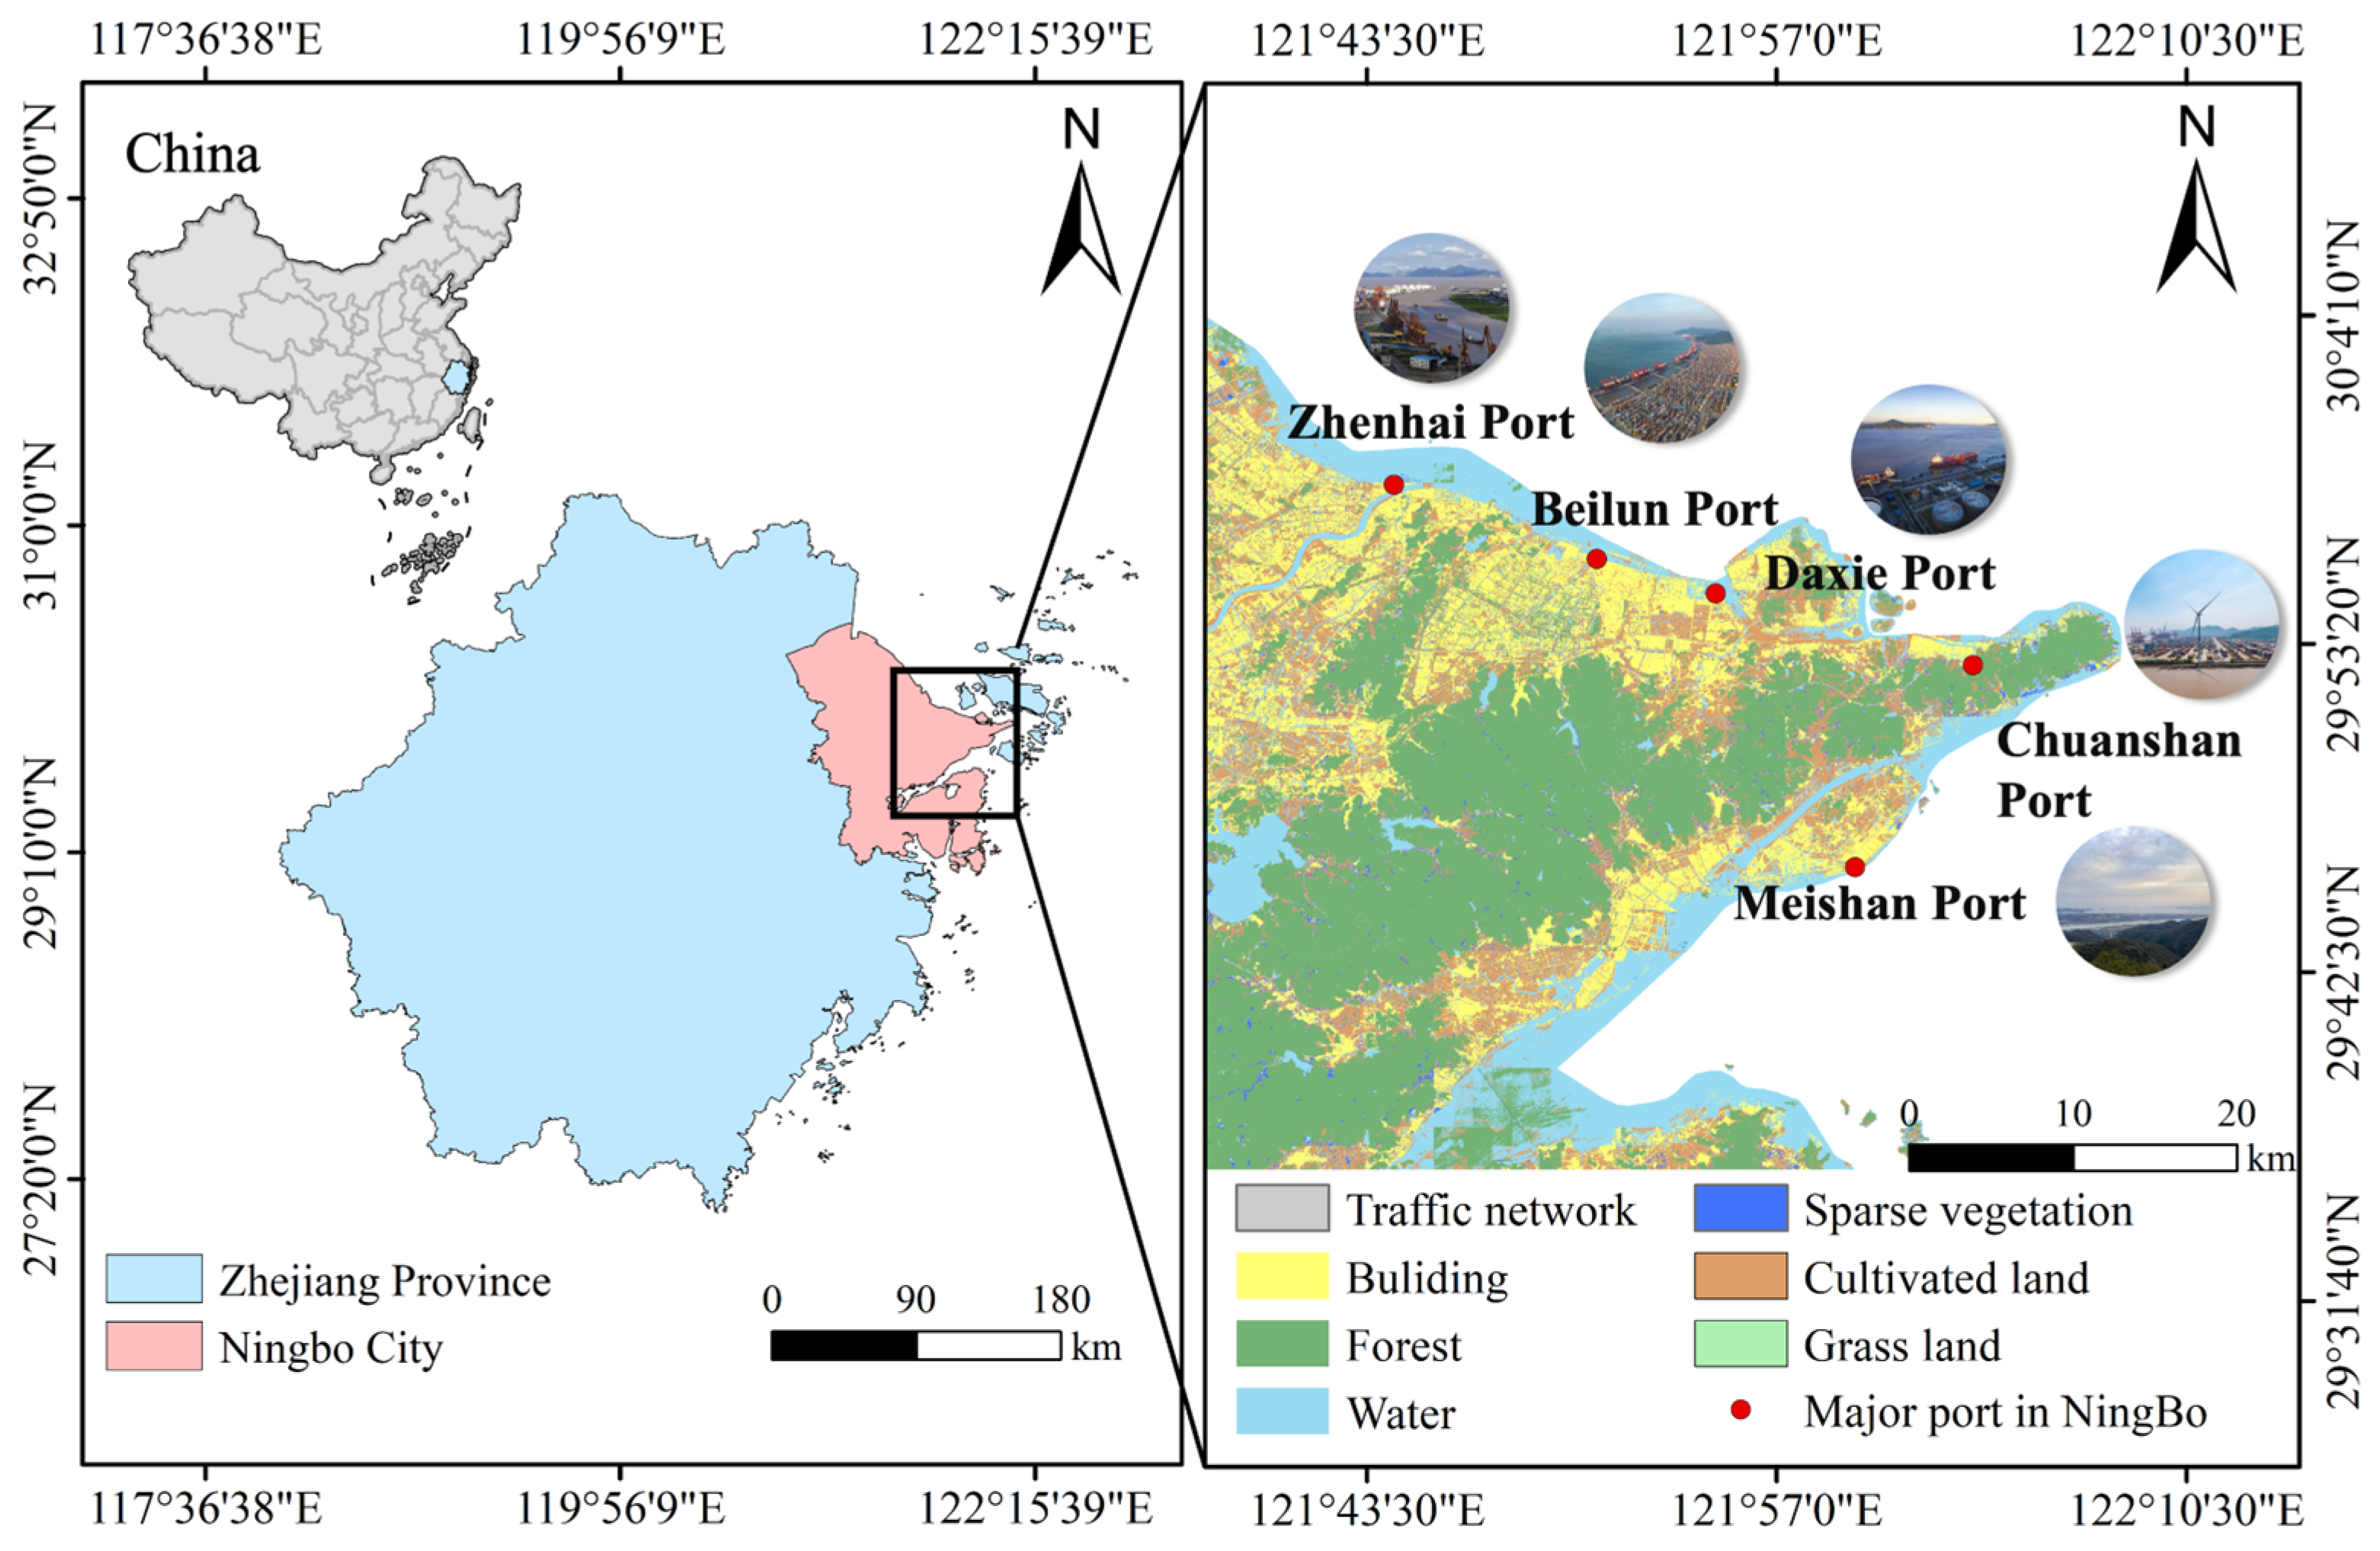
4.1. Study Area

Ningbo Port is the port with the highest number of large and extra-large deep-water berths in mainland China. As of the end of 2023, it has 205 large deep-water berths of over 1 × 10⁴ tons and 129 extra-large deep-water berths of over 5 × 10⁴ tons (data from the Ningbo Port’s official website (www.nbport.com.cn, accessed on 8 April 2025)). It consists of several port regions, including Beilun, Zhenhai, Ningbo, Daxie, Chuanshan North, and Meishan. Ningbo Port is located in Ningbo city, in southeastern China, covering a total land area of 9816 km2 (Figure 5) [51]. The climate type is characterized by subtropical monsoon climate, with 22 days of high temperatures, 18 days of frost, an average annual temperature of 17.4 °C, 1850 h of annual sunshine, and annual precipitation of 1480 mm [52,53]. The local vegetation belongs to the northern subzone of the central subtropical evergreen broadleaf forest, with dominant woody plants such as Fagaceae and Lauraceae [54].

4.2. Methods

4.2.1. Field Community Surveys

Through the reviewing of the literature, the distribution status of IAS in the Ningbo Port and its surrounding areas was initially understood, and potential distribution areas were identified (Figure 5). Comprehensive field surveys were conducted in these potential areas. Surveys were conducted during the plant growing seasons from 2022 to 2023. The survey habitats included forests, wetlands, and grasslands. A simple random sampling method was used to establish 1 m × 1 m herbaceous plots along different survey routes within the study area, totaling 595 plots. We recorded the coordinates (latitude and longitude) and elevation and conducted a community survey for all plants within the plots. The survey indicators included species names, abundance, heights, and coverage. The types of communities in the study area are shown in Table 1.

4.2.2. Environmental Data

The environmental data used in this study included climate data, soil data, and topographic data. Current climate condition data were obtained from 6 meteorological observation stations provided by the local meteorological department, consisting of a total of 19 variables (Table 2). We selected future climate data from three climate change scenarios (SSP1-2.6, SSP2-4.5, SSP5-8.5), with low greenhouse gas emission, medium greenhouse gas emissions, and high greenhouse gas emissions under the BCC-CSM2-MR model for prediction, with a resolution of 2.5 arc-minutes for all scenarios. The soil data included soil salinity, moisture content, and pH. These were determined through laboratory experiments. Specifically, we collected 0–20 cm of topsoil in each quadrat center and conducted laboratory experiments after completing community surveys. The topographic data were sourced from the Geospatial Data Cloud, with a resolution of 30 m × 30 m.

4.2.3. Risk Assessment of Biological Invasions

According to Helen et al. [55] and Jian et al. [56], we developed a risk assessment system for IAS to evaluate the invasion risk of S. canadensis (Table S1). The evaluation formulas are provided in Equations (1)–(5). Risk assessment values ranging from 2.8 to 4.0 correspond to level 1 (high risk), 1.2 to 2.8 to level 2 (medium risk), and 0 to 1.2 to level 3 (low risk). The specific calculation formula is as follows:
P = P 1 × P 2 × P 3 × P 4 4
P 1 represents the introduction and colonization risk, P 2 represents the spread risk, P 3 represents the potential hazards and impacts, and P 4 represents the control of hazards.
The calculation formula for P 1 , the introduction and colonization risk, is as follows:
P 1 = 0.3 × P 11 + 0.3 × P 12 + 0.2 × P 13 + 0.2 × P 14
P 11 represents environmental factor suitability, P 12 represents food factor suitability, P 13 represents growth and reproduction characteristics, and P 14 represents the situation of natural enemies.
The formula of P 2 , the spread risk, is as follows:
P 2 = P 21 × P 22 × P 23 × P 24 4
P 21 represents distribution, P 22 represents existing management measures, P 23 represents spread capacity, and P 24 represents the suitable habitat range.
The calculation formula for P 3 , the potential hazards and impacts, is as follows:
P 3 = max P 31 , P 32 , P 33
P 31 represents the impact on socio-economic factors, P 32 represents the impact on the ecological environment, and P 33 represents the importance of the affected targets.
P 4 , the hazard control, is calculated as follows:
P 4 = P 41 + P 42 + P 43 3
P 41 represents the difficulty of identification and verification, P 42 represents the difficulty of monitoring and surveying, and P 43 represents the difficulty of control and management.

4.2.4. Invasion Mechanism Analysis

To reveal the invasion mechanisms of S. canadensis, our study followed the method of Kreft et al. [57], and first calculated the ecological importance value of S. canadensis and the Shannon–Wiener Index. Subsequently, the T test method was used to compare the growth dominance of S. canadensis with that of other species [58]. We then used the Generalized Linear Model (GLM) to analyze the effects of species diversity and environmental factors on S. canadensis. To avoid the impact of multicollinearity, we chose environmental variables and excluded those with high collinearity; we finally selected 6 variables, which were bio1, bio6, bio8, bio17, bio18, and the Shannon–Wiener Diversity Index.

4.2.5. Prediction of Suitable Habitat Area for S. canadensis

We used the Maximum Entropy Model (MaxEnt) in Species Distribution Models (SDMs) to predict the growth areas of S. canadensis under different future climate scenarios [59]. This model is a quantitative approach based on niche theory, utilizing species distribution data and relevant environmental data, combined with Global Climate Models (GCMs), to study species’ environmental tolerance and map their potential distribution. Prior to prediction, climate and topographic factors were resampled using the ArcMap 10.8 software. Additionally, considering the presence of autocorrelation and multicollinearity among environmental factors, we employed a Spearman correlation analysis to identify the environmental variables (Figure S2). Factors with a correlation coefficient higher than 0.75 were modeled using the Jackknife method for single-factor modeling, determining the contribution of each factor, and the final prediction variables were selected. These variables were categorized into three types. The first category was climate factors, which included biol, bio2, bio3, bio4, bio6, bio7, bio8, bio12, bio13, biol4, bio15, bio16, bio17, bio18, and bio19. The second category was topographic factors, with only one variable: elevation (elev). The third category was land cover type.
To reduce overfitting issues in the niche model analysis, the “kuenm” package in the R 4.3.3 software was used to evaluate different regularization factors, and feature types were adjusted based on distribution points to obtain the optimal combination for running the MaxEnt model. We used 75% of the dataset to parameterize the model and the remaining 25% for validation. Model accuracy was evaluated using the area under receiver operator curve (AUC), which ranges from 0 to 1; higher AUC values mean a better performance of this model [60]. Finally, the probability of species presence was estimated based on presence records, and background points were randomly generated by identifying the maximum entropy distribution. Using the natural breaks method in the ArcMap software, the habitat suitability was classified into four levels: non-, low, medium, and highly suitable level. Furthermore, the total area of S. canadensis distribution under current and future climate conditions was estimated by multiplying the number of “presence” grid cells by their spatial resolution values.

5. Conclusions

Our study was based on field survey data and involved analyzing and simulating the current invasion drivers of S. canadensis and its suitable habitat distribution under climate change scenarios. The results show that the problem of invasive alien species in the port area was serious, and due to high-intensity human interference, the level of invasion risk was relatively high. Biodiversity and the lowest temperature (especially that of the coldest month) were the key drivers of the invasion of S. canadensis. A highly diverse plant community could inhibit the invasion of S. canadensis. Meanwhile, S. canadensis was sensitive to low temperatures and had a distinct low-temperature limiting threshold. Under three global climate warming scenarios, the suitable habitat area of S. canadensis continued to increase, reaching its maximum under the medium greenhouse gas emission scenario in the 2050s. Our results provide scientific evidence for assessing and managing the risk of invasive plants, offering significant practical theoretical value for guiding source control of invasive species.

Supplementary Materials

The following supporting information can be downloaded at: https://www.mdpi.com/article/10.3390/plants14101546/s1, Table S1: Table of risk assessment index system of invasive alien species; Figure S1: ROC curve validation of the potential distribution prediction results for Solidago canadensis.; Figure S2: The results of correlation analysis of climate factors.

Author Contributions

Conceptualization, X.L. and X.Y.; methodology, X.L.; software, S.S. and K.L.; validation, X.L., S.S. and S.L.; formal analysis, S.S. and K.L.; investigation, X.L., S.L., Q.P., J.M. and W.L.; writing—original draft preparation, S.S., K.L. and X.L.; writing—review and editing, X.Y. and S.S.; visualization, Q.P.; supervision, X.L.; project administration, X.L.; funding acquisition, X.Y. All authors have read and agreed to the published version of the manuscript.

Funding

This work was supported by the Key Technology Breakthrough Plan Project of Science and Innovation Yongjiang 2035 (Grant No. 2023Z146, 2024Z249, 2024Z262), the National Natural Science Foundation of China (Grant No. 42371027) and Ningbo Natural Science Foundation (Grant No. 2021J084).

Data Availability Statement

The data presented in this study are available upon request from the corresponding authors.

Acknowledgments

We thank our lab members for their helpful discussions.

Conflicts of Interest

The authors declare no conflicts of interest.

References

  1. Early, R.; Bradley, B.A.; Dukes, J.S.; Lawler, J.J.; Olden, J.D.; Blumenthal, D.M.; Gonzalez, P.; Grosholz, E.D.; Ibañez, I.; Miller, L.P.; et al. Global Threats from Invasive Alien Species in the Twenty-First Century and National Response Capacities. Nat. Commun. 2016, 7, 12485. [Google Scholar] [CrossRef] [PubMed]
  2. Hulme, P.E. Unwelcome Exchange: International Trade as a Direct and Indirect Driver of Biological Invasions Worldwide. One Earth 2021, 4, 666–679. [Google Scholar] [CrossRef]
  3. Hao, Q.; Ma, J.-S. Invasive Alien Plants in China: An Update. Plant Divers 2022, 45, 117–121. [Google Scholar] [CrossRef] [PubMed]
  4. Xu, H.; Ding, H.; Li, M.; Qiang, S.; Guo, J.; Han, Z.; Huang, Z.; Sun, H.; He, S.; Wu, H.; et al. The Distribution and Economic Losses of Alien Species Invasion to China. Biol. Invasions 2006, 8, 1495–1500. [Google Scholar] [CrossRef]
  5. Kang, L.; Wu, W.; Yu, H.; Su, F. Global Container Port Network Linkages and Topology in 2021. Sensors 2022, 22, 5889. [Google Scholar] [CrossRef]
  6. Potgieter, L.J.; Li, D.; Baiser, B.; Kühn, I.; Aronson, M.F.J.; Carboni, M.; Celesti-Grapow, L.; de Matos, A.C.L.; Lososová, Z.; Montaño-Centellas, F.A.; et al. Cities Shape the Diversity and Spread of Nonnative Species. Annu. Rev. Ecol. Evol. Syst. 2024, 55, 157–180. [Google Scholar] [CrossRef]
  7. Jehlík, V.; Dostálek, J.; Frantík, T. Alien Plants in Central European River Ports. Neobiota 2019, 45, 93–115. [Google Scholar] [CrossRef]
  8. Seebens, H.; Essl, F.; Dawson, W.; Fuentes, N.; Moser, D.; Pergl, J.; Pyšek, P.; Van Kleunen, M.; Weber, E.; Winter, M.; et al. Global Trade Will Accelerate Plant Invasions in Emerging Economies under Climate Change. Glob. Change Biol. 2015, 21, 4128–4140. [Google Scholar] [CrossRef] [PubMed]
  9. Sardain, A.; Sardain, E.; Leung, B. Global Forecasts of Shipping Traffic and Biological Invasions to 2050. Nat. Sustain. 2019, 2, 274–282. [Google Scholar] [CrossRef]
  10. Meyerson, L.A.; Mooney, H.A. Invasive Alien Species in an Era of Globalization. Front. Ecol. Environ. 2007, 5, 199–208. [Google Scholar] [CrossRef]
  11. Pyšek, P.; Hulme, P.E.; Simberloff, D.; Bacher, S.; Blackburn, T.M.; Carlton, J.T.; Dawson, W.; Essl, F.; Foxcroft, L.C.; Genovesi, P.; et al. Scientists’ Warning on Invasive Alien Species. Biol. Rev. 2020, 95, 1511–1534. [Google Scholar] [CrossRef] [PubMed]
  12. Gioria, M.; Hulme, P.E.; Richardson, D.M.; Pyšek, P. Why Are Invasive Plants Successful? Annu. Rev. Plant Biol. 2023, 74, 635–670. [Google Scholar] [CrossRef] [PubMed]
  13. Dawson, W.; Rohr, R.P.; Van Kleunen, M.; Fischer, M. Alien Plant Species with a Wider Global Distribution Are Better Able to Capitalize on Increased Resource Availability. New Phytol. 2012, 194, 859–867. [Google Scholar] [CrossRef]
  14. Huenneke, L.F.; Hamburg, S.P.; Koide, R.; Mooney, H.A.; Vitousek, P.M. Effects of Soil Resources on Plant Invasion and Community Structure in Californian Serpentine Grassland. Ecology 1990, 71, 478–491. [Google Scholar] [CrossRef]
  15. Wang, C.; Cheng, H.; Wei, M.; Wang, S.; Wu, B.; Du, D. Plant Height and Leaf Size: Which One Is More Important in Affecting the Successful Invasion of Solidago Canadensis and Conyza Canadensis in Urban Ecosystems? Urban For. Urban Green. 2021, 59, 127033. [Google Scholar] [CrossRef]
  16. Lazzaro, L.; Bolpagni, R.; Buffa, G.; Gentili, R.; Lonati, M.; Stinca, A.; Acosta, A.T.R.; Adorni, M.; Aleffi, M.; Allegrezza, M.; et al. Impact of Invasive Alien Plants on Native Plant Communities and Natura 2000 Habitats: State of the Art, Gap Analysis and Perspectives in Italy. J. Environ. Manag. 2020, 274, 111140. [Google Scholar] [CrossRef]
  17. Feng, Y.-L.; Lei, Y.-B.; Wang, R.-F.; Callaway, R.M.; Valiente-Banuet, A.; Inderjit; Li, Y.-P.; Zheng, Y.-L. Evolutionary Tradeoffs for Nitrogen Allocation to Photosynthesis versus Cell Walls in an Invasive Plant. Proc. Natl. Acad. Sci. USA 2009, 106, 1853–1856. [Google Scholar] [CrossRef]
  18. Huang, K.; Kong, D.-L.; Lu, X.-R.; Feng, W.-W.; Liu, M.-C.; Feng, Y.-L. Lesser Leaf Herbivore Damage and Structural Defense and Greater Nutrient Concentrations for Invasive Alien Plants: Evidence from 47 Pairs of Invasive and Non-Invasive Plants. Sci. Total Environ. 2020, 723, 137829. [Google Scholar] [CrossRef]
  19. Lin, T.; Doorduin, L.; Temme, A.; Pons, T.L.; Lamers, G.E.M.; Anten, N.P.R.; Vrieling, K. Enemies Lost: Parallel Evolution in Structural Defense and Tolerance to Herbivory of Invasive Jacobaea Vulgaris. Biol. Invasions 2015, 17, 2339–2355. [Google Scholar] [CrossRef]
  20. Elton, C.S. The Ecology of Invasions by Animals and Plants; Springer Nature: Berlin, Germany, 2020; pp. 23–30. [Google Scholar]
  21. Funk, J.L.; Vitousek, P.M. Resource-Use Efficiency and Plant Invasion in Low-Resource Systems. Nature 2007, 446, 1079–1081. [Google Scholar] [CrossRef]
  22. Raheem, A.; Yohanna, P.; Li, G.; Noh, N.J.; Iqbal, B.; Tang, J.; Du, D.; Alahmadi, T.A.; Ansari, M.J.; Zhan, A.; et al. Unraveling the Ecological Threads: How Invasive Alien Plants Influence Soil Carbon Dynamics. J. Environ. Manag. 2024, 356, 120556. [Google Scholar] [CrossRef] [PubMed]
  23. Wang, C.; Cheng, H.; Wu, B.; Jiang, K.; Wang, S.; Wei, M.; Du, D. The Functional Diversity of Native Ecosystems Increases during the Major Invasion by the Invasive Alien Species, Conyza canadensis. Ecol. Eng. 2021, 159, 106093. [Google Scholar] [CrossRef]
  24. Hejda, M.; Sádlo, J.; Kutlvašr, J.; Petřík, P.; Vítková, M.; Vojík, M.; Pyšek, P.; Pergl, J. Impact of Invasive and Native Dominants on Species Richness and Diversity of Plant Communities. Preslia 2021, 93, 181–201. [Google Scholar] [CrossRef]
  25. Benelli, G.; Pavela, R.; Cianfaglione, K.; Nagy, D.U.; Canale, A.; Maggi, F. Evaluation of Two Invasive Plant Invaders in Europe (Solidago canadensis and Solidago gigantea) as Possible Sources of Botanical Insecticides. J. Pest Sci. 2019, 92, 805–821. [Google Scholar] [CrossRef]
  26. Wang, C.; Jiang, K.; Zhou, J.; Wu, B. Solidago canadensis Invasion Affects Soil N-Fixing Bacterial Communities in Heterogeneous Landscapes in Urban Ecosystems in East China. Sci. Total Environ. 2018, 631–632, 702–713. [Google Scholar] [CrossRef]
  27. Wang, W.; Zhu, Q.; Dai, S.; Meng, L.; He, M.; Chen, S.; Zhao, C.; Dan, X.; Cai, Z.; Zhang, J.; et al. Effects of Solidago canadensis L. on Mineralization-Immobilization Turnover Enhance Its Nitrogen Competitiveness and Invasiveness. Sci. Total Environ. 2023, 882, 163641. [Google Scholar] [CrossRef]
  28. Wang, C.; Jiang, K.; Liu, J.; Zhou, J.; Wu, B. Moderate and Heavy Solidago canadensis L. Invasion Are Associated with Decreased Taxonomic Diversity but Increased Functional Diversity of Plant Communities in East China. Ecol. Eng. 2018, 112, 55–64. [Google Scholar] [CrossRef]
  29. Abhilasha, D.; Quintana, N.; Vivanco, J.; Joshi, J. Do Allelopathic Compounds in Invasive Solidago canadensis s.l. Restrain the Native European Flora? J. Ecol. 2008, 96, 993–1001. [Google Scholar] [CrossRef]
  30. Ningbo Municipal Bureau of Statistics. Ningbo Statistical Yearbook; China Statistics Press: Beijing, China, 2022; pp. 258–271.
  31. Wilson, J.R.U.; Dormontt, E.E.; Prentis, P.J.; Lowe, A.J.; Richardson, D.M. Something in the Way You Move: Dispersal Pathways Affect Invasion Success. Trends Ecol. Evol. 2009, 24, 136–144. [Google Scholar] [CrossRef]
  32. Hulme, P.E. Trade, Transport and Trouble: Managing Invasive Species Pathways in an Era of Globalization. J. Appl. Ecol. 2009, 46, 10–18. [Google Scholar] [CrossRef]
  33. Lan, R.; Qiao, B. Study on the Invasion Mechanism of Alien Species through Ship Activities. IOP Conf. Ser. Earth Environ. Sci. 2020, 446, 052104. [Google Scholar] [CrossRef]
  34. Dafforn, K. Future-Proofing Our Ports against Biological Invasion. Curr. Opin. Environ. Sustain. 2025, 73, 101518. [Google Scholar] [CrossRef]
  35. Adomako, M.O.; Ning, L.; Tang, M.; Du, D.-L.; Van Kleunen, M.; Yu, F.-H. Diversity- and Density-Mediated Allelopathic Effects of Resident Plant Communities on Invasion by an Exotic Plant. Plant Soil 2019, 440, 581–592. [Google Scholar] [CrossRef]
  36. Zhang, Z.; Wen, G.; Bu, D.; Sun, G.; Qiang, S. Long−Distance Wind Dispersal Drives Population Range Expansion of Solidago Canadensis. Plants 2022, 11, 2734. [Google Scholar] [CrossRef]
  37. Vojík, M.; Boublík, K. Fear of the Dark: Decline in Plant Diversity and Invasion of Alien Species Due to Increased Tree Canopy Density and Eutrophication in Lowland Woodlands. Plant Ecol. 2018, 219, 749–758. [Google Scholar] [CrossRef]
  38. Biswas, S.R.; He, D.; Li, J.; Gong, L.; Biswas, P.L.; Zhuo, Z.; Xu, M.; Yang, X.; Yan, E. Putting Space into Trait Ecology: Trait, Environment and Biodiversity Relationships at Multiple Spatial Scales. J. Ecol. 2024, 112, 613–628. [Google Scholar] [CrossRef]
  39. Blossey, B.; Notzold, R. Evolution of Increased Competitive Ability in Invasive Nonindigenous Plants: A Hypothesis. J. Ecol. 1995, 83, 887–889. [Google Scholar] [CrossRef]
  40. Mei, D.; Jian-Zhong, L.; Wen-Ju, Z.; Jia-Kuan, C.; Bo, L. Canada Goldenrod (Solidago canadensis): An Invasive Alien Weed Rapidly Spreading in China. J. Syst. Evol. 2006, 44, 72–85. [Google Scholar]
  41. Levine, J.M.; Adler, P.B.; Yelenik, S.G. A Meta-analysis of Biotic Resistance to Exotic Plant Invasions. Ecol. Lett. 2004, 7, 975–989. [Google Scholar] [CrossRef]
  42. Byun, C.; De Blois, S.; Brisson, J. Plant Functional Group Identity and Diversity Determine Biotic Resistance to Invasion by an Exotic Grass. J. Ecol. 2013, 101, 128–139. [Google Scholar] [CrossRef]
  43. Hulme, P.E. Climate Change and Biological Invasions: Evidence, Expectations, and Response Options. Biol. Rev. 2017, 92, 1297–1313. [Google Scholar] [CrossRef] [PubMed]
  44. Yang, W.; Sun, S.; Wang, N.; Fan, P.; You, C.; Wang, R.; Zheng, P.; Wang, H. Dynamics of the Distribution of Invasive Alien Plants (Asteraceae) in China under Climate Change. Sci. Total Environ. 2023, 903, 166260. [Google Scholar] [CrossRef] [PubMed]
  45. Petitpierre, B.; Kueffer, C.; Broennimann, O.; Randin, C.; Daehler, C.; Guisan, A. Climatic Niche Shifts Are Rare Among Terrestrial Plant Invaders. Science 2012, 335, 1344–1348. [Google Scholar] [CrossRef]
  46. Zhou, X.-H.; He, W.-M. Climate Warming Facilitates Seed Germination in Native but Not Invasive Solidago canadensis Populations. Front. Ecol. Evol. 2020, 8, 595214. [Google Scholar] [CrossRef]
  47. Li, H.; Ali, A.; Luo, X.; Liao, K.; Sun, N.; Xu, M.; Sha, L.; He, D.; Du, Y.; Sun, W.; et al. China’s Subtropical Deciduous Plants Are More Sensitive to Climate Change than Evergreen Plants by Flowering Phenology. Glob. Change Biol. 2024, 30, e17168. [Google Scholar] [CrossRef]
  48. Seebens, H.; Blackburn, T.M.; Dyer, E.E.; Genovesi, P.; Hulme, P.E.; Jeschke, J.M.; Pagad, S.; Pyšek, P.; Winter, M.; Arianoutsou, M.; et al. No Saturation in the Accumulation of Alien Species Worldwide. Nat. Commun. 2017, 8, 14435. [Google Scholar] [CrossRef]
  49. Dawson, W.; Moser, D.; Van Kleunen, M.; Kreft, H.; Pergl, J.; Pyšek, P.; Weigelt, P.; Winter, M.; Lenzner, B.; Blackburn, T.M.; et al. Global Hotspots and Correlates of Alien Species Richness across Taxonomic Groups. Nat. Ecol. Evol. 2017, 1, 0186. [Google Scholar] [CrossRef]
  50. Lu, J.; Li, S.; Wu, Y.; Jiang, L. Are Hong Kong and Taiwan Stepping-Stones for Invasive Species to the Mainland of China? Ecol. Evol. 2018, 8, 1966–1973. [Google Scholar] [CrossRef]
  51. Li, X.; Fu, J.; Jiang, D.; Lin, G.; Cao, C. Land Use Optimization in Ningbo City with a Coupled GA and PLUS Model. J. Clean. Prod. 2022, 375, 134004. [Google Scholar] [CrossRef]
  52. Li, S.; Pan, Q.; Yang, X.; Gao, Y.; Xu, M. Differential Influences of Island Biogeographic Effects on the Diversity among Three Plant Life-Forms. Glob. Ecol. Conserv. 2025, 58, e03499. [Google Scholar] [CrossRef]
  53. Tang, Y.T.; Chan, F.K.S.; Griffiths, J. City Profile: Ningbo. Cities 2015, 42, 97–108. [Google Scholar] [CrossRef]
  54. Wu, Z. Chinese Vegetation, 1st ed.; Science Press: Beijing, China, 1980; pp. 823–836. [Google Scholar]
  55. Roy, H.E.; Rabitsch, W.; Scalera, R.; Stewart, A.; Gallardo, B.; Genovesi, P.; Essl, F.; Adriaens, T.; Bacher, S.; Booy, O.; et al. Developing a Framework of Minimum Standards for the Risk Assessment of Alien Species. J. Appl. Ecol. 2018, 55, 526–538. [Google Scholar] [CrossRef]
  56. Ou, J.; Lu, C.; O’Toole, D.K. A Risk Assessment System for Alien Plant Bio-Invasion in Xiamen, China. J. Environ. Sci. 2008, 20, 989–997. [Google Scholar] [CrossRef] [PubMed]
  57. Kreft, H.; Jetz, W. Global Patterns and Determinants of Vascular Plant Diversity. Proc. Natl. Acad. Sci. USA 2007, 104, 5925–5930. [Google Scholar] [CrossRef]
  58. Tello, R.; Crewson, P.E. Hypothesis Testing II: Means. Radiology 2003, 227, 1–4. [Google Scholar] [CrossRef] [PubMed]
  59. Anibaba, Q.A.; Dyderski, M.K.; Jagodziński, A.M. Predicted Range Shifts of Invasive Giant Hogweed (Heracleum mantegazzianum) in Europe. Sci. Total Environ. 2022, 825, 154053. [Google Scholar] [CrossRef]
  60. Shi, X.; Wang, J.; Zhang, L.; Chen, S.; Zhao, A.; Ning, X.; Fan, G.; Wu, N.; Zhang, L.; Wang, Z. Prediction of the Potentially Suitable Areas of Litsea cubeba in China Based on Future Climate Change Using the Optimized MaxEnt Model. Ecol. Indic. 2023, 148, 110093. [Google Scholar] [CrossRef]
Figure 1. Invasion status of S. canadensis in Ningbo Port. (a) The distribution map of S. canadensis; (b) showed the proportion of plant families, with the lower part of the family (<1.0%) being merged into the others; and (c) presented the T test results for S. canadensis compared to other species.
Plants 14 01546 g001
Figure 2. The relationship of IAS ecological importance to species diversity and environmental factors. *** p < 0.001, ** p < 0.01, and * p < 0.05.
Plants 14 01546 g002
Figure 3. Response curves of high–weight influencing factors for S. canadensis under current climate conditions. (a,b) represent the percent contribution and permutation importance of environmental factors to S. canadensis, respectively. (c,d) respectively represent the response curves of the most influential environmental variables for S. canadensis.
Plants 14 01546 g003
Figure 4. Potential geographic distribution of S. canadensis under different future climate change scenarios.
Plants 14 01546 g004
Figure 5. Map of the study area.
Plants 14 01546 g005
Table 1. Vegetation community types in the study area.
Community TypeCompanion SpeciesNumber of PlotsCoverage (Mean ± SD %) *Height (Mean ± SD cm) *
1Solidago canadensisSetaria viridis, Lactuca indica, Vicia sepium, Artemisia indica16634.7 ± 1964.5 ± 50.4
2Veronica persicaGeranium carolinianum, Vicia sepium, Stellaria media8120.2 ± 16.97.1 ± 5.1
3Galium spuriumVeronica persica, Solidago canadensis, Artemisia indica6012.50 ± 8.99.9 ± 17.3
4Alternanthera philoxeroidesSolidago canadensis, Erigeron canadensis4532.50 ± 20.625.1 ± 13.3
5Artemisia indicaVeronica persica, Erigeron sumatrensis, Trifolium repens4512.70 ± 5.96.2 ± 14.1
6Setaria viridisSymphyotrichum subulatum, Solidago canadensis, Anthriscus sylvestris4115.0 ± 5.972.4 ± 30.3
7Oxalis corniculataSolidago canadensis, Stellaria media368.20 ± 3.89.4 ± 6.2
8Symphyotrichum subulatumArtemisia argyi, Erigeron canadensis2915.10 ± 8.667.1 ± 41.3
9Spartina alternifloraPhragmites australis2650.80 ± 28.275.7 ± 42.2
10Digitaria sanguinalisSolidago canadensis, Symphyotrichum subulatum, Humulus scandens2420.80 ± 13.241.2 ± 19.7
11Geranium carolinianumStellaria media, Cerastium glomeratum2216.90 ± 7.88.4 ± 8.6
12Erigeron canadensisOxalis corniculata, Pseudognaphalium affine2028.80 ± 12.555.6 ± 50.5
Total number of plots595
* The coverage and height refer to those of the dominant species.
Table 2. Climate data.
TypeFactorsDescription
Climate databio1Average temperature for the year
bio2Mean daily temperature variation
bio3The consistency of temperature (bio2/bio7) (×100)
bio4Seasonal temperature variation
bio5Highest temperature in the warmest month
bio6Minimum temperature of the coldest month
bio7Annual temperature variation (bio5-bio6)
bio8Average temperature of the wettest season
bio9Temperature average of the driest season
bio10Temperature average of the warmest season
bio11Temperature average of the coldest season
bio12Total precipitation for the year
bio13Total precipitation in the wettest month
bio14Total precipitation in the driest month
bio15Seasonal variation in precipitation (coefficient of variation)
bio16Total precipitation in the wettest season
bio17Precipitation during the driest season
bio18Total precipitation in the warmest season
bio19Total precipitation in the coldest season
Disclaimer/Publisher’s Note: The statements, opinions and data contained in all publications are solely those of the individual author(s) and contributor(s) and not of MDPI and/or the editor(s). MDPI and/or the editor(s) disclaim responsibility for any injury to people or property resulting from any ideas, methods, instructions or products referred to in the content.

