
Quantitative Comparison of Yield, Quality, and Metabolic Products of Different Medicinal Parts of Two Types of Perilla frutescens Cultivated in a New Location from Different Regions

Abstract
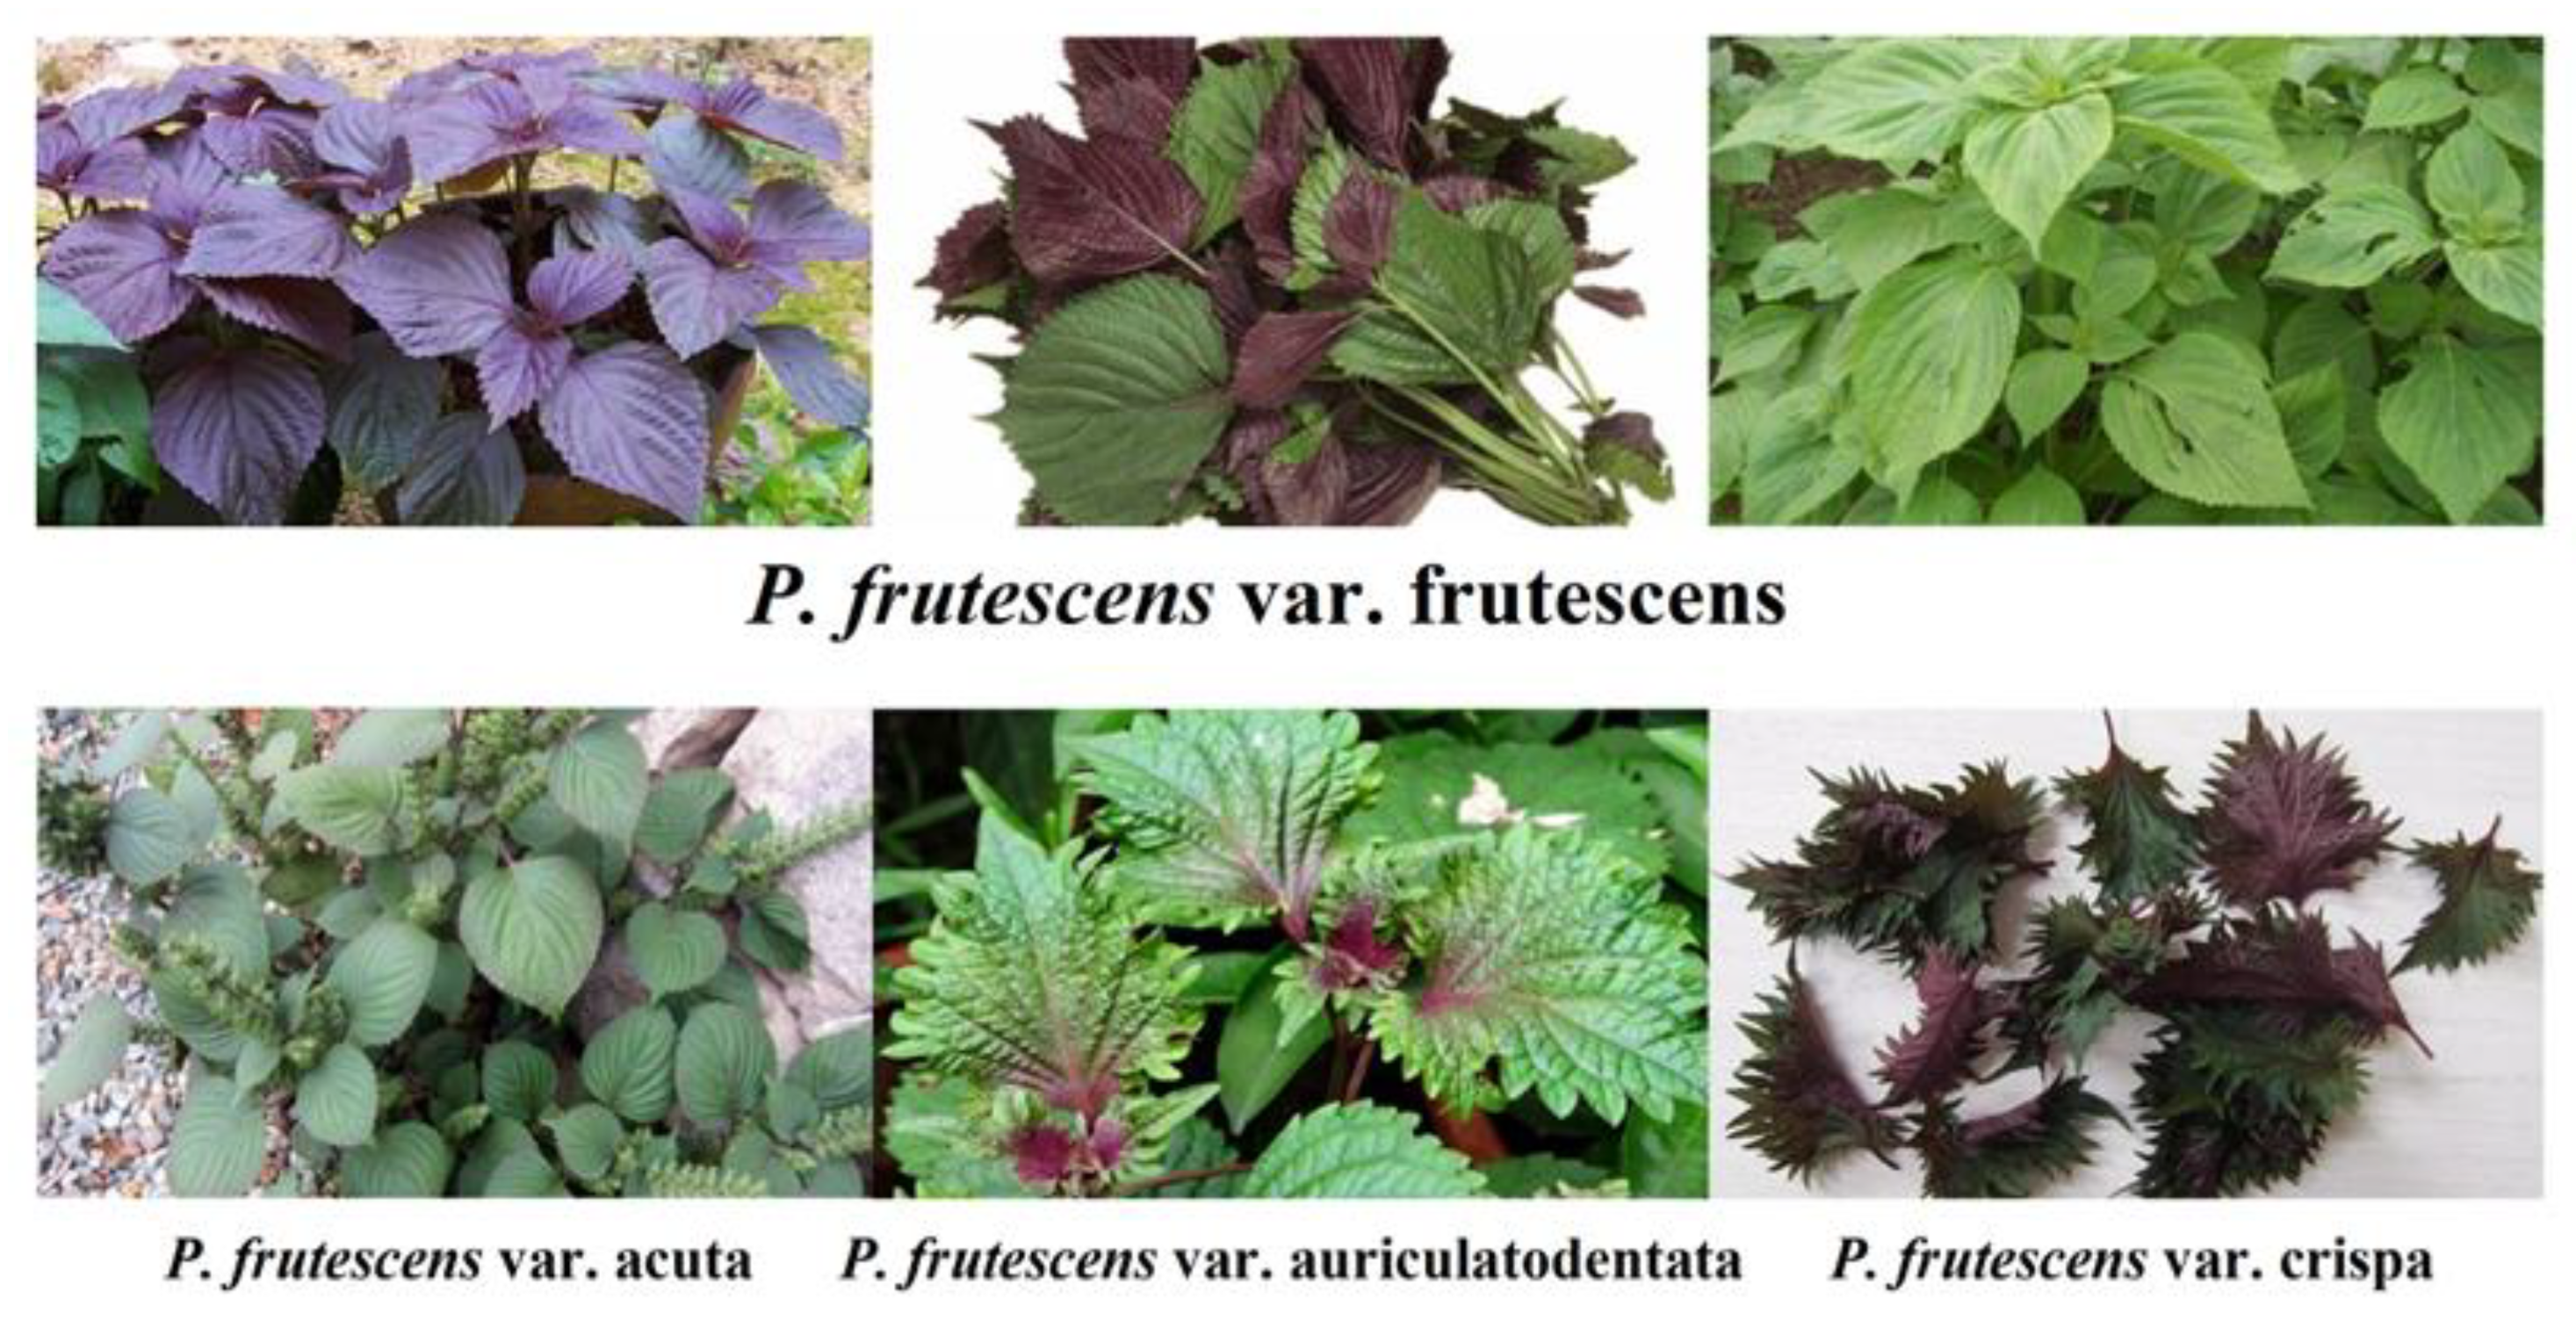
1. Introduction
2. Results
2.1. Yield and Quality of P. frutescens
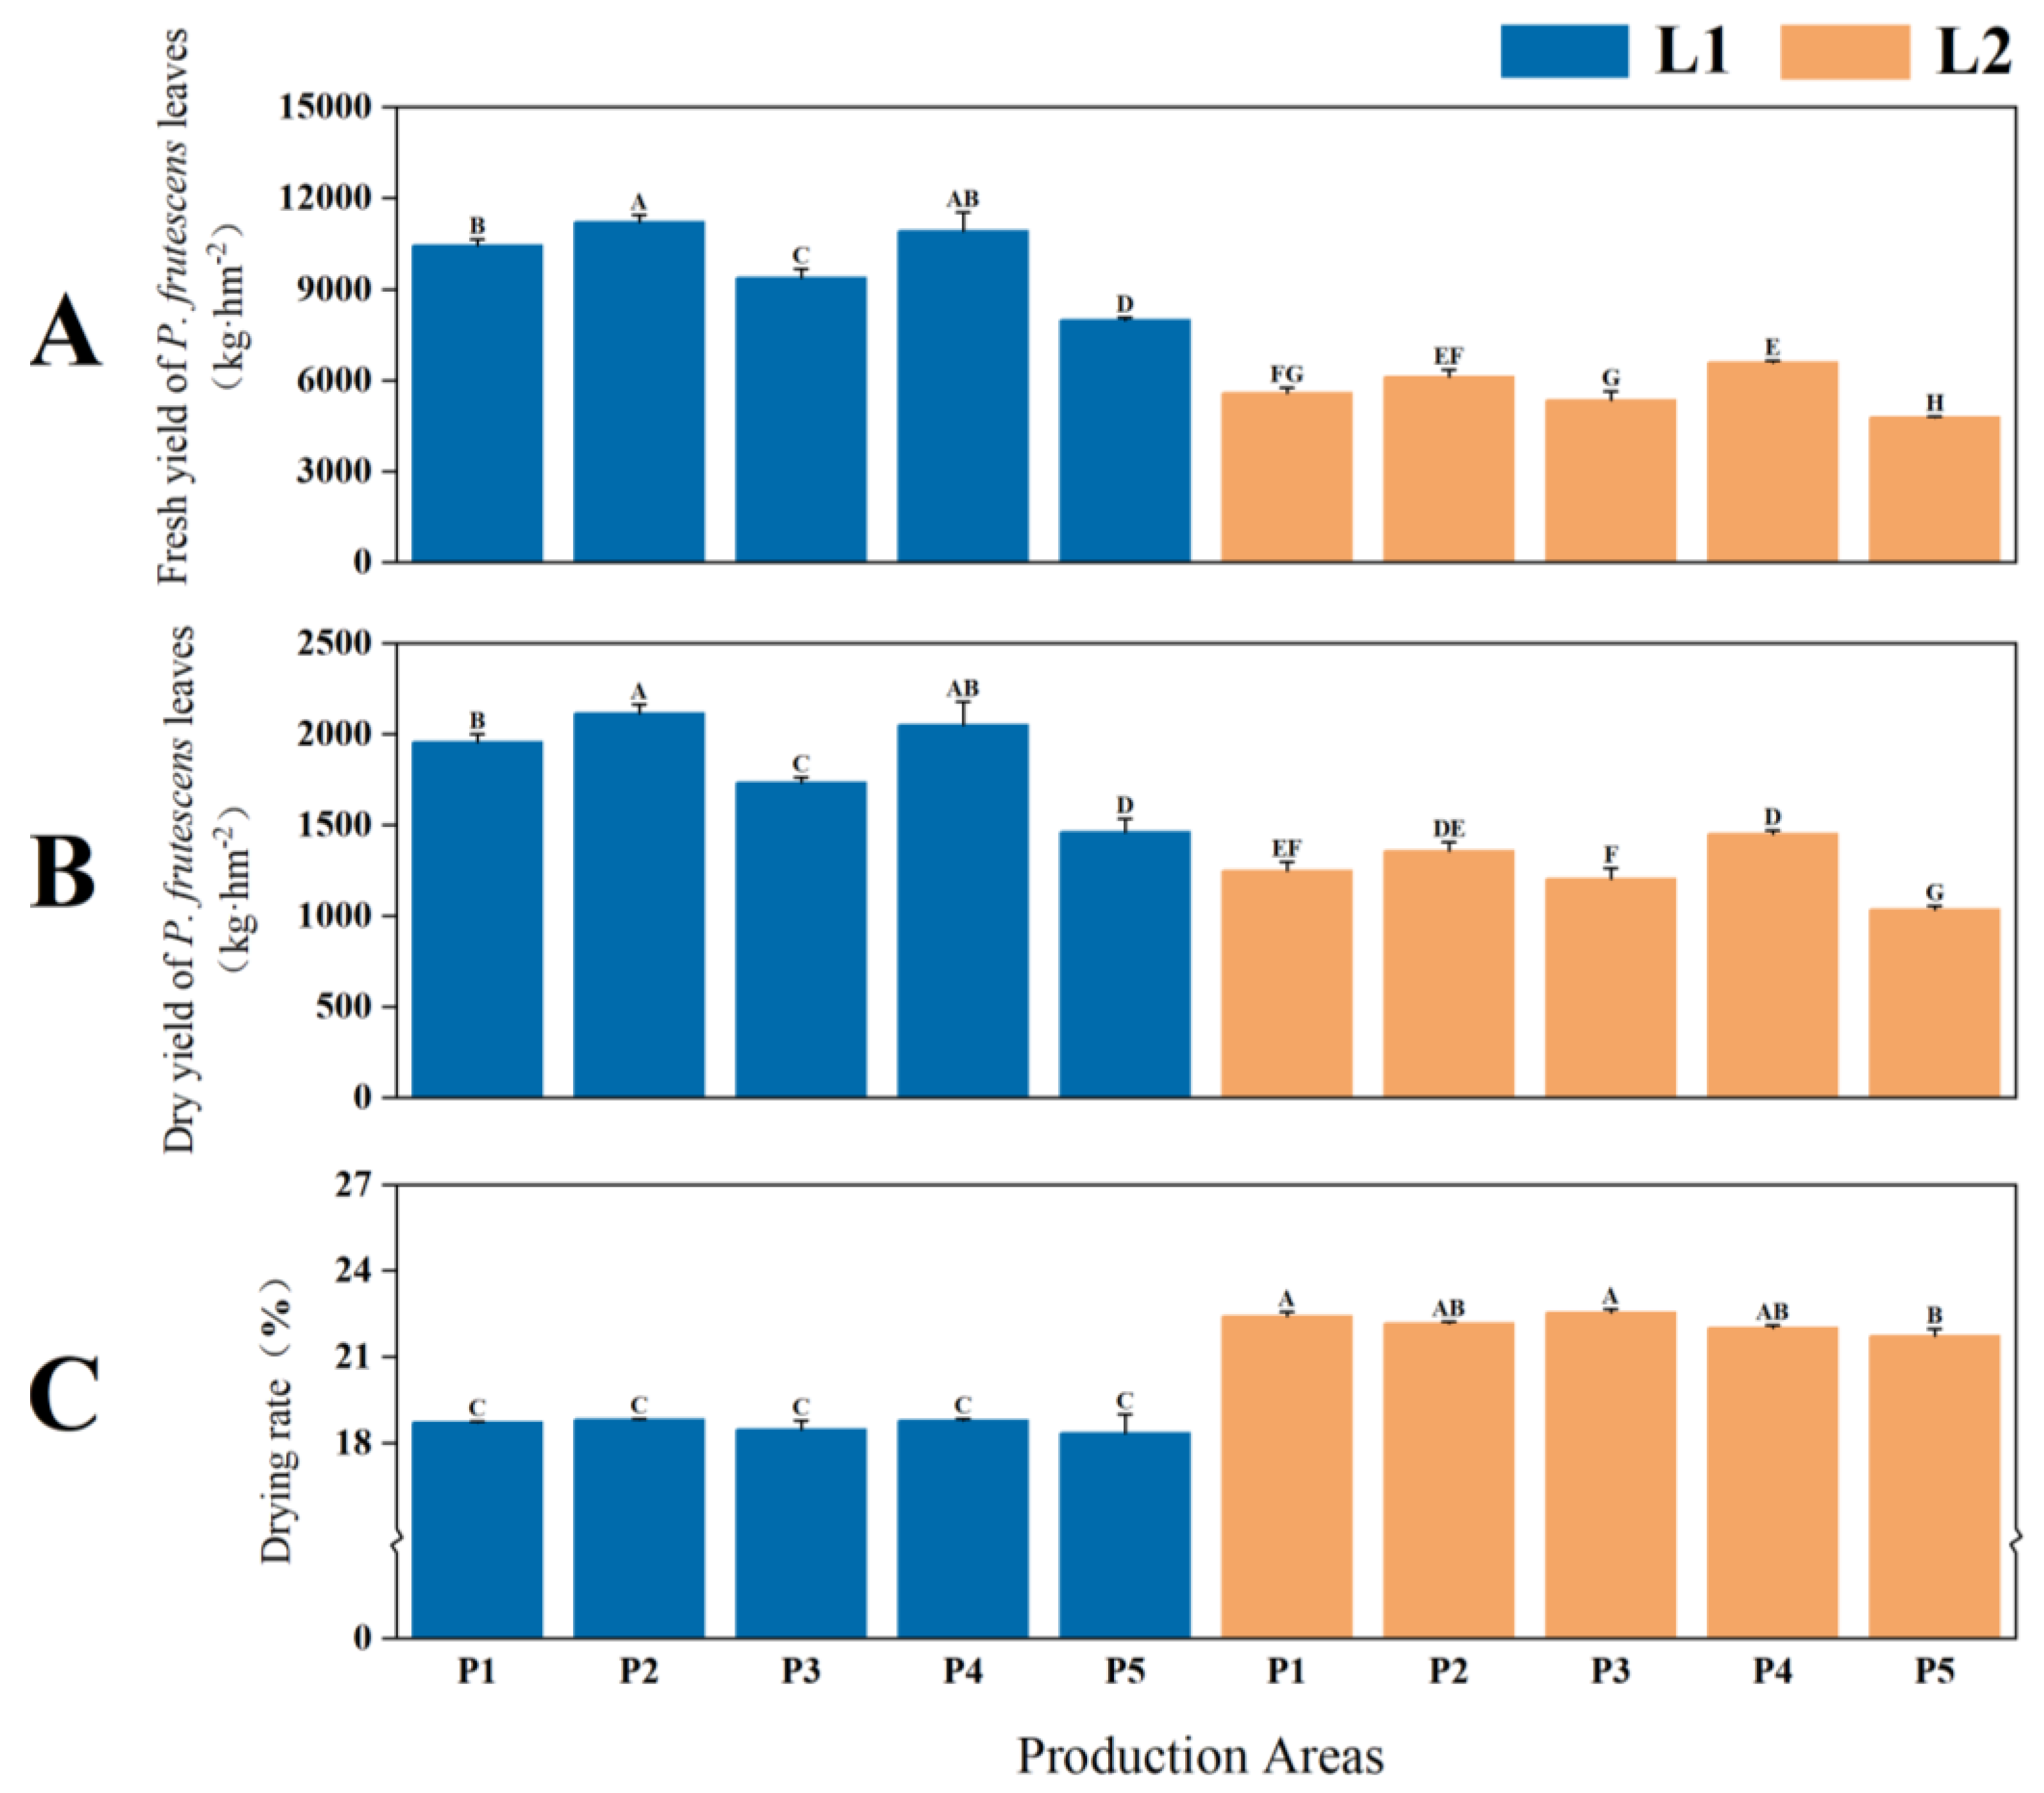
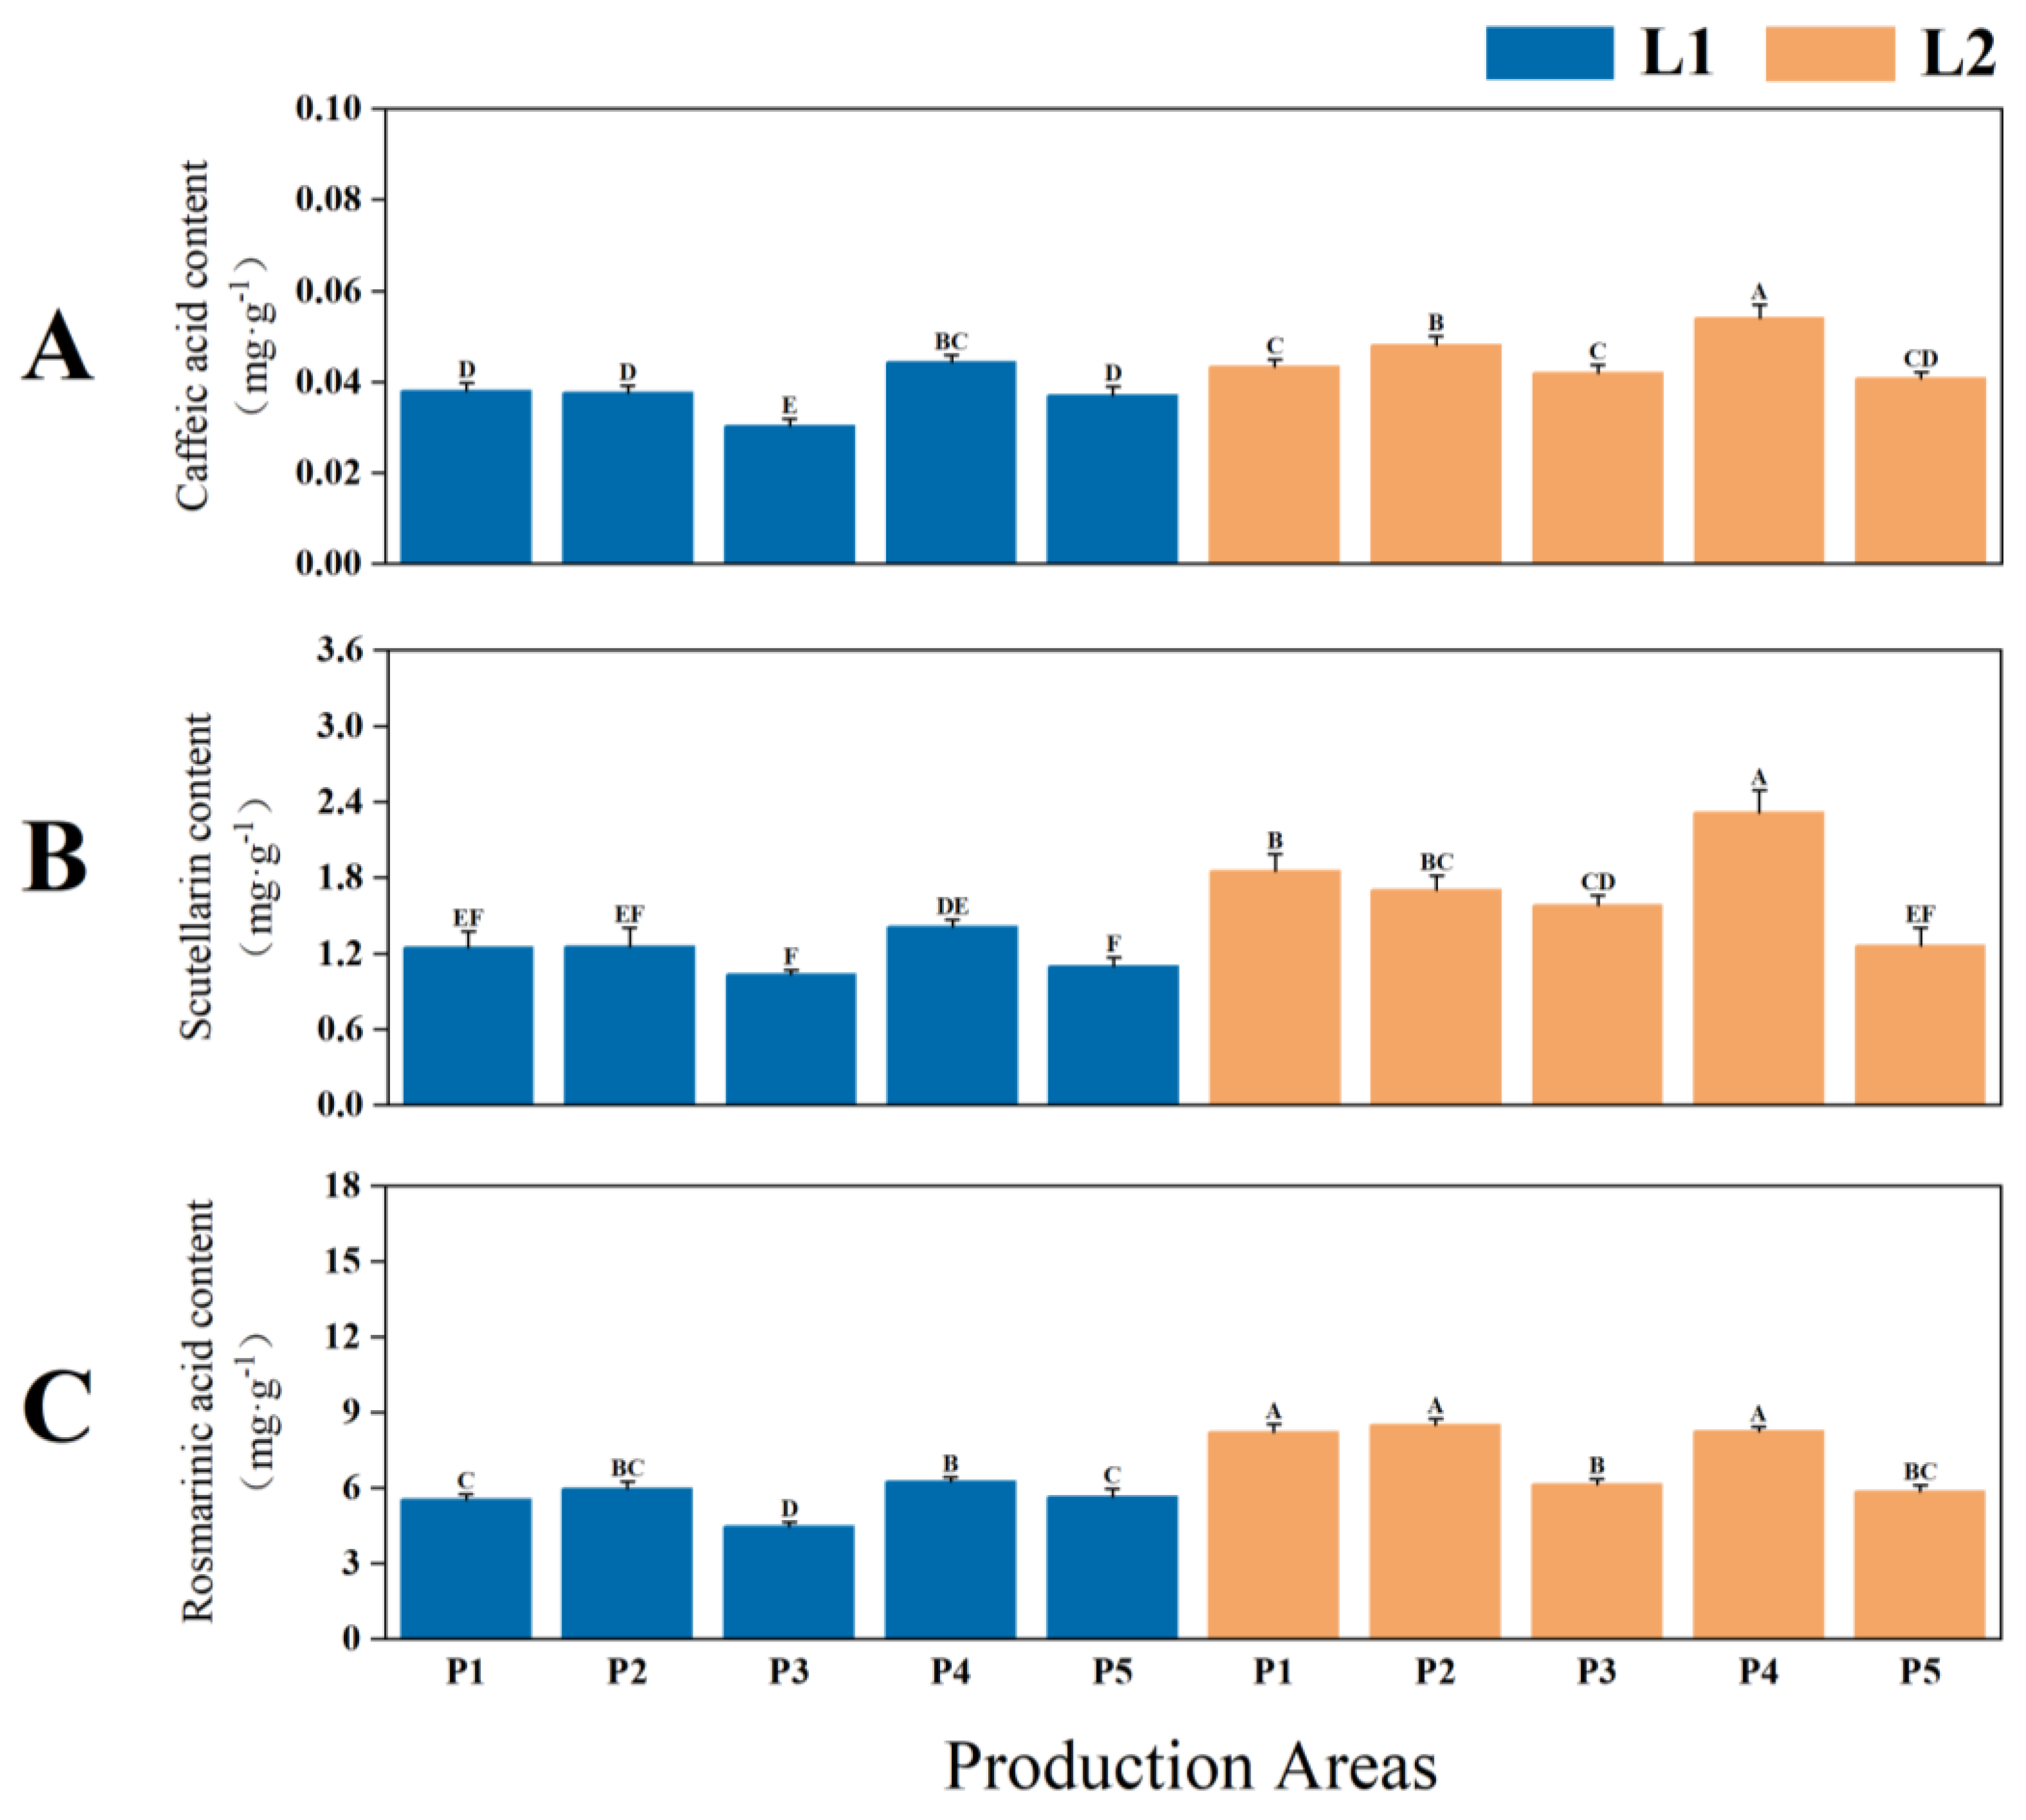
2.1.1. Yield and Quality of P. frutescens Leaves
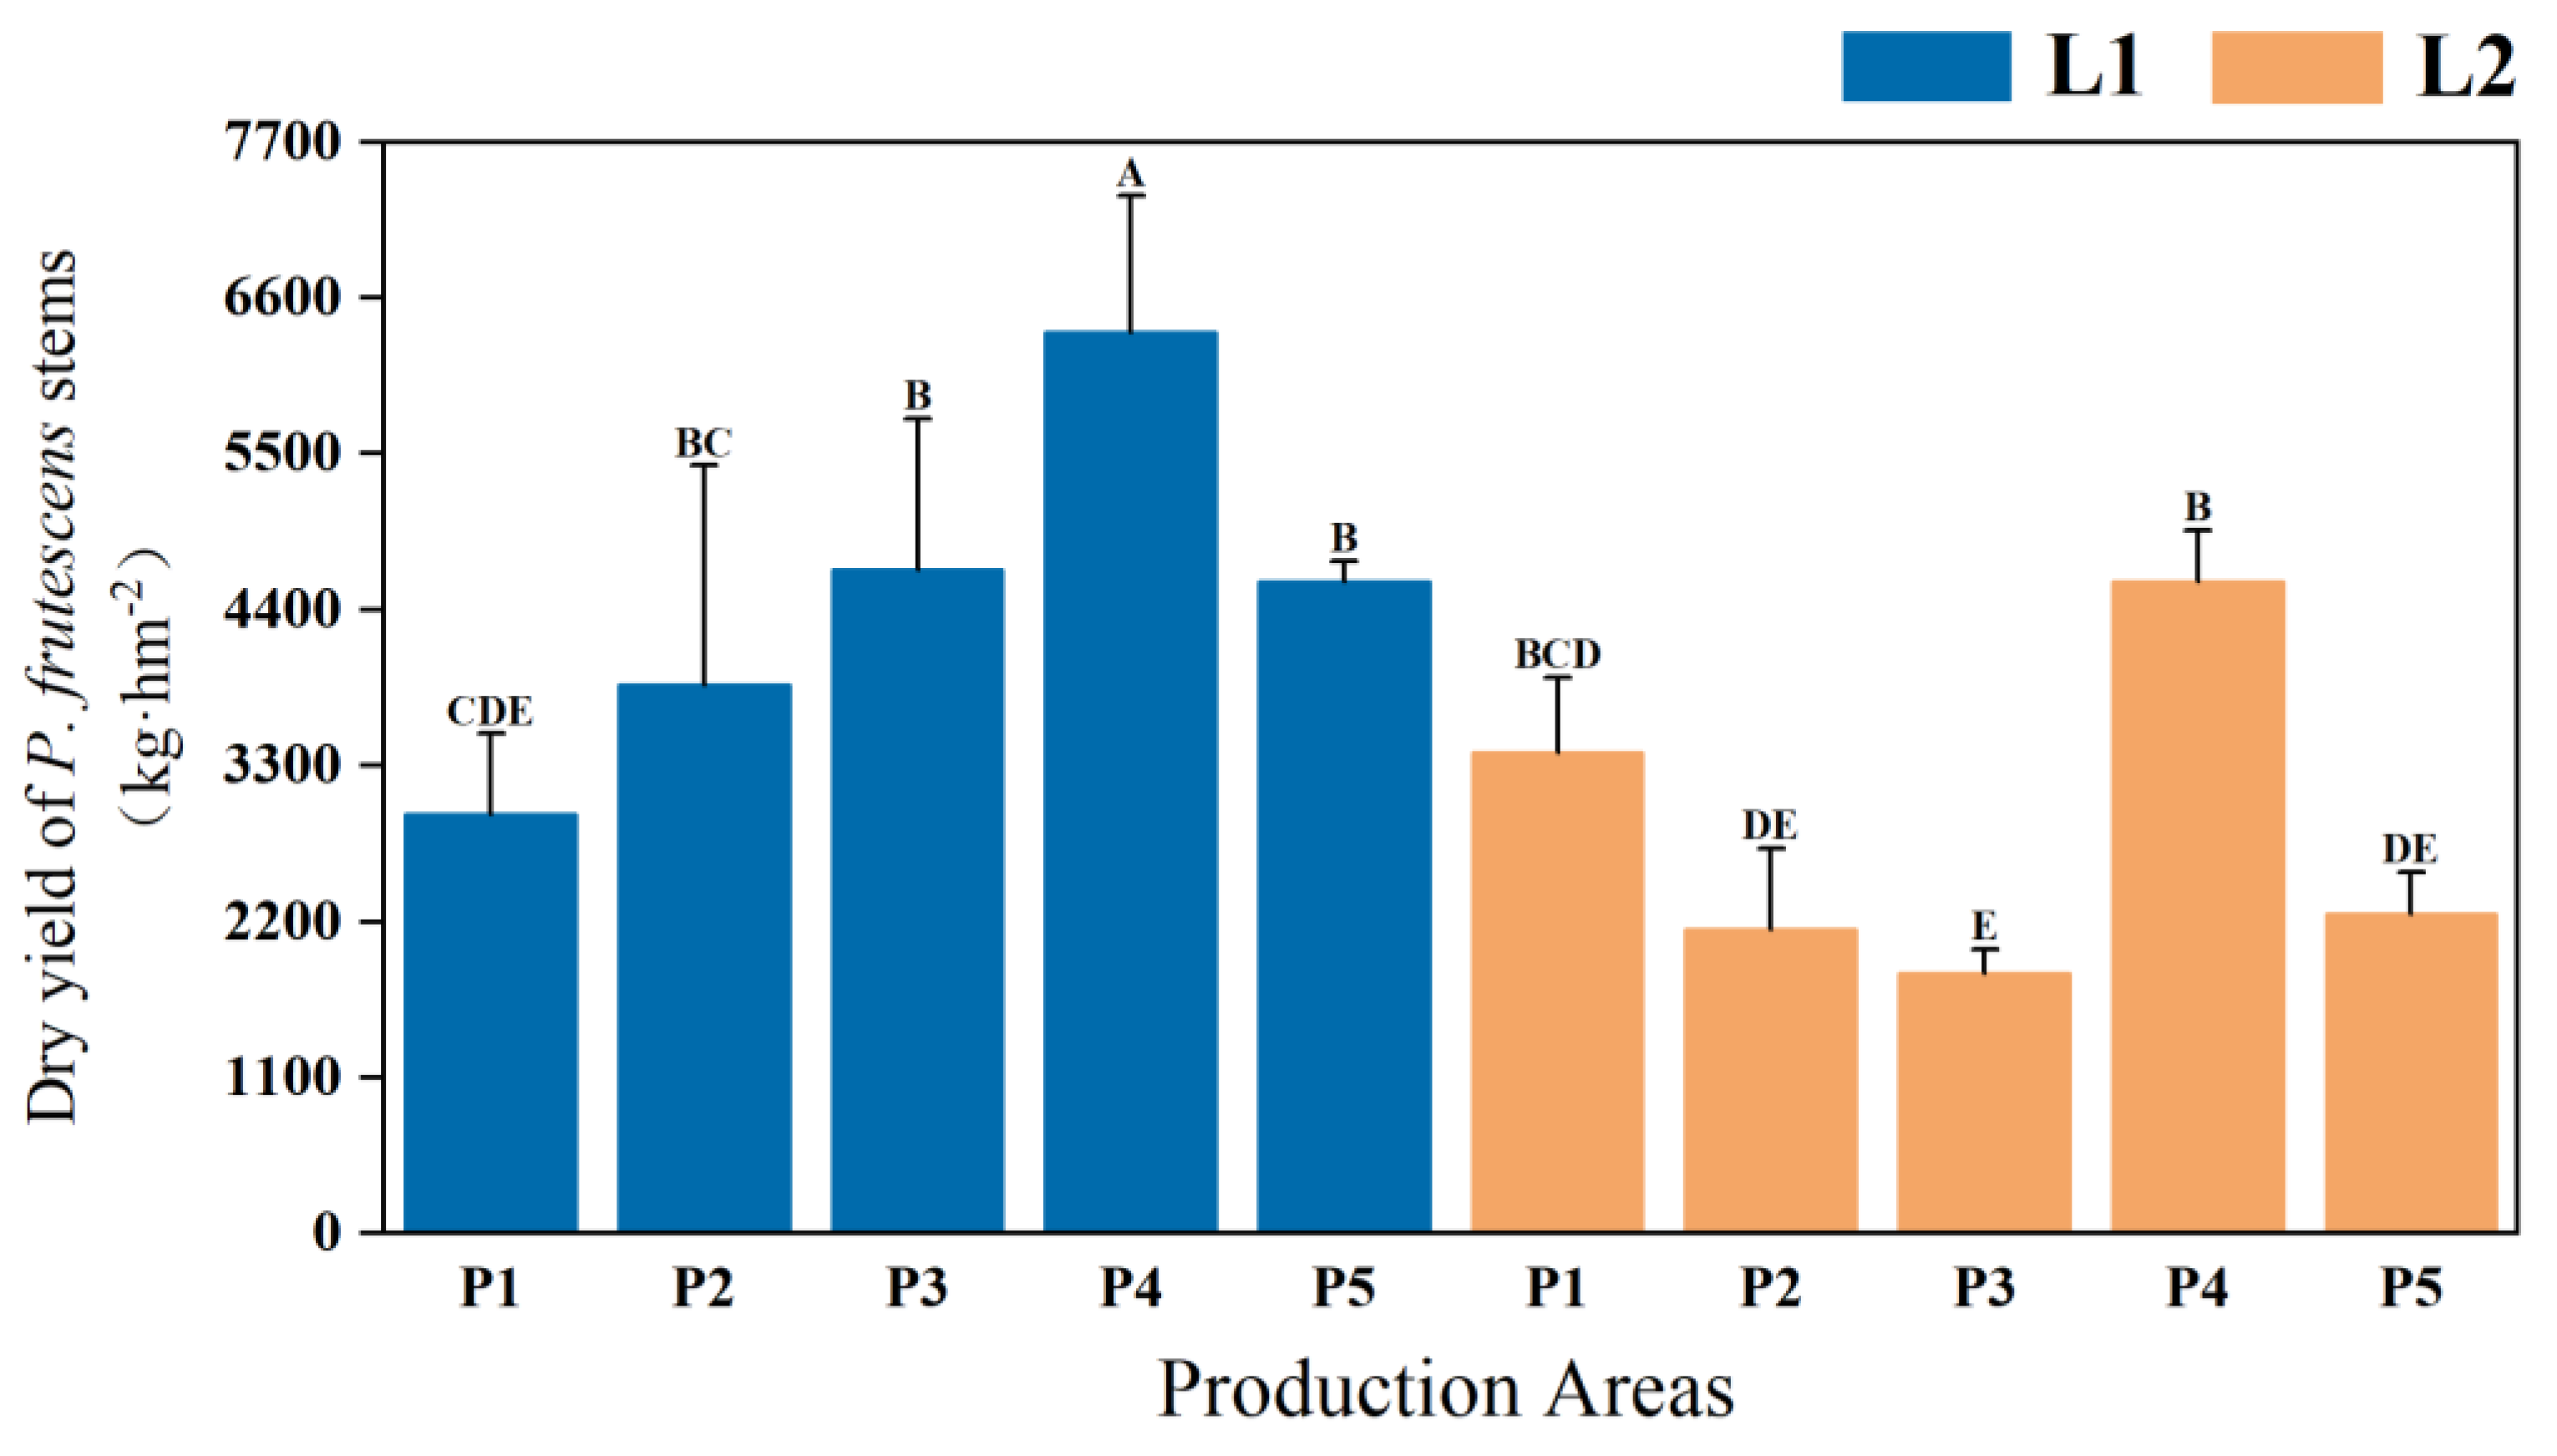
2.1.2. Yield and Quality of P. frutescens Stems
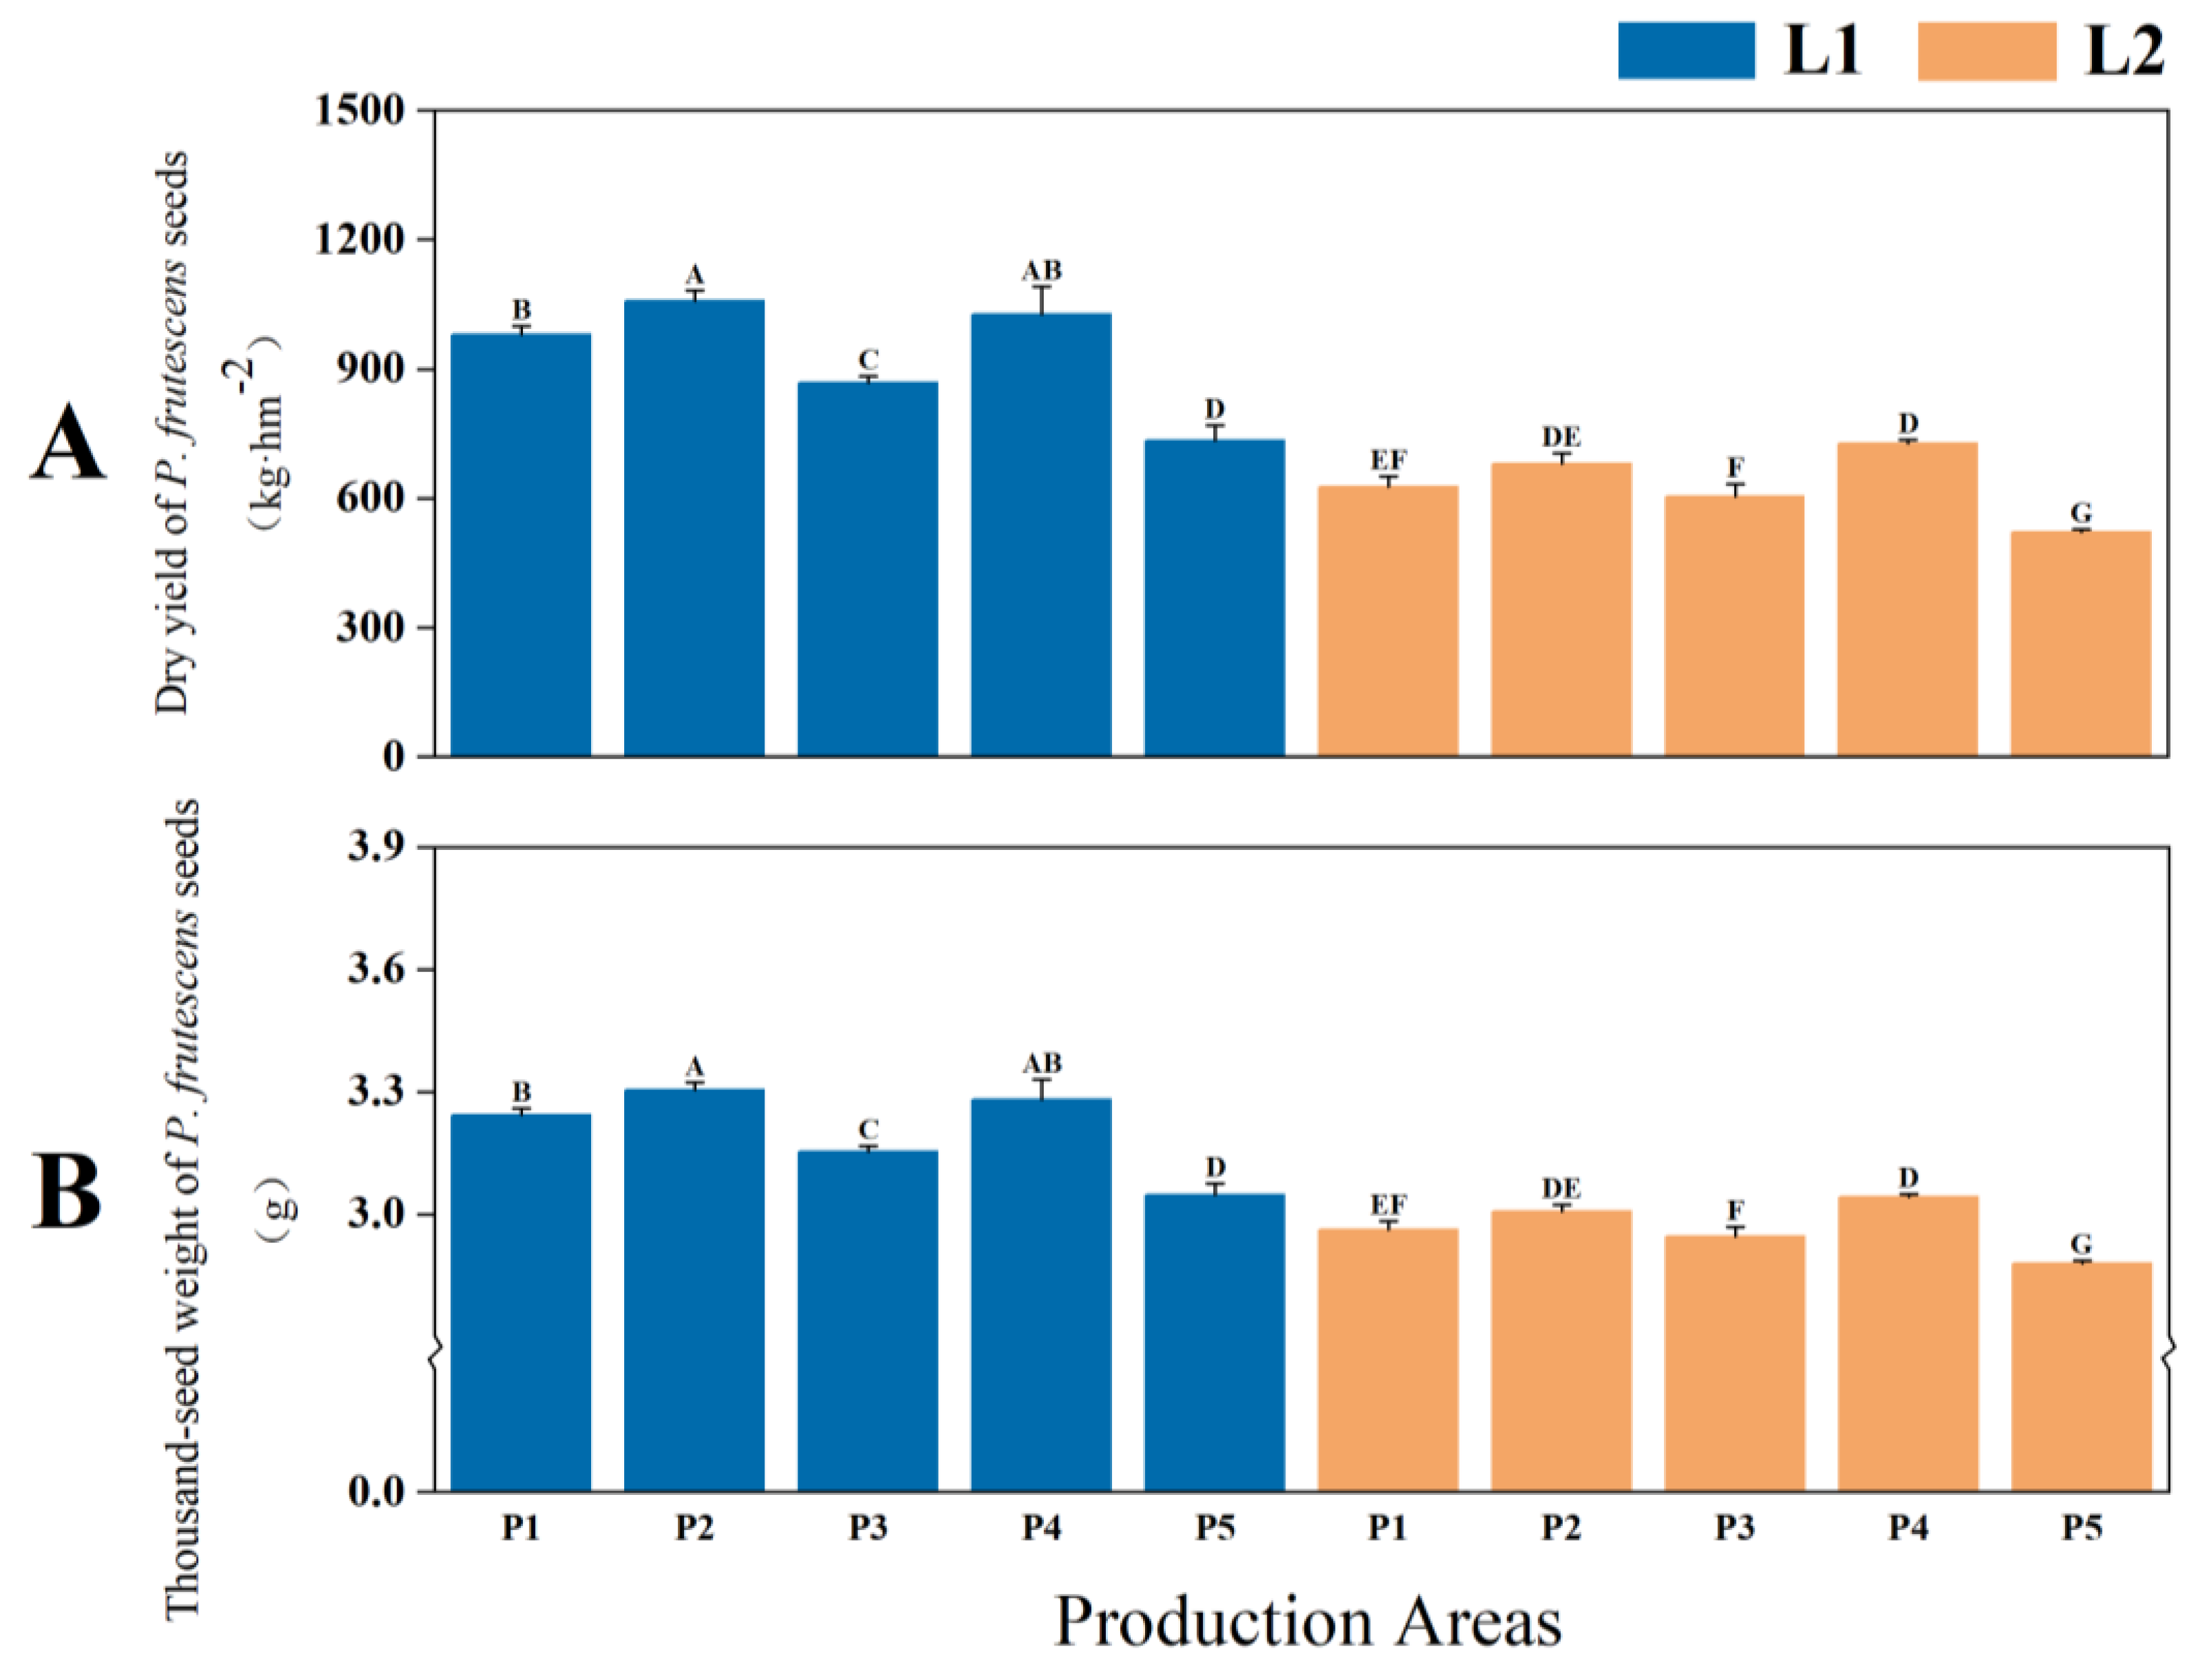
2.1.3. Yield and Quality of P. frutescens Seeds
2.2. Differences in the Anthocyanin Compositions of Two Varieties of P. frutescens Leaves Based on Leaf Color
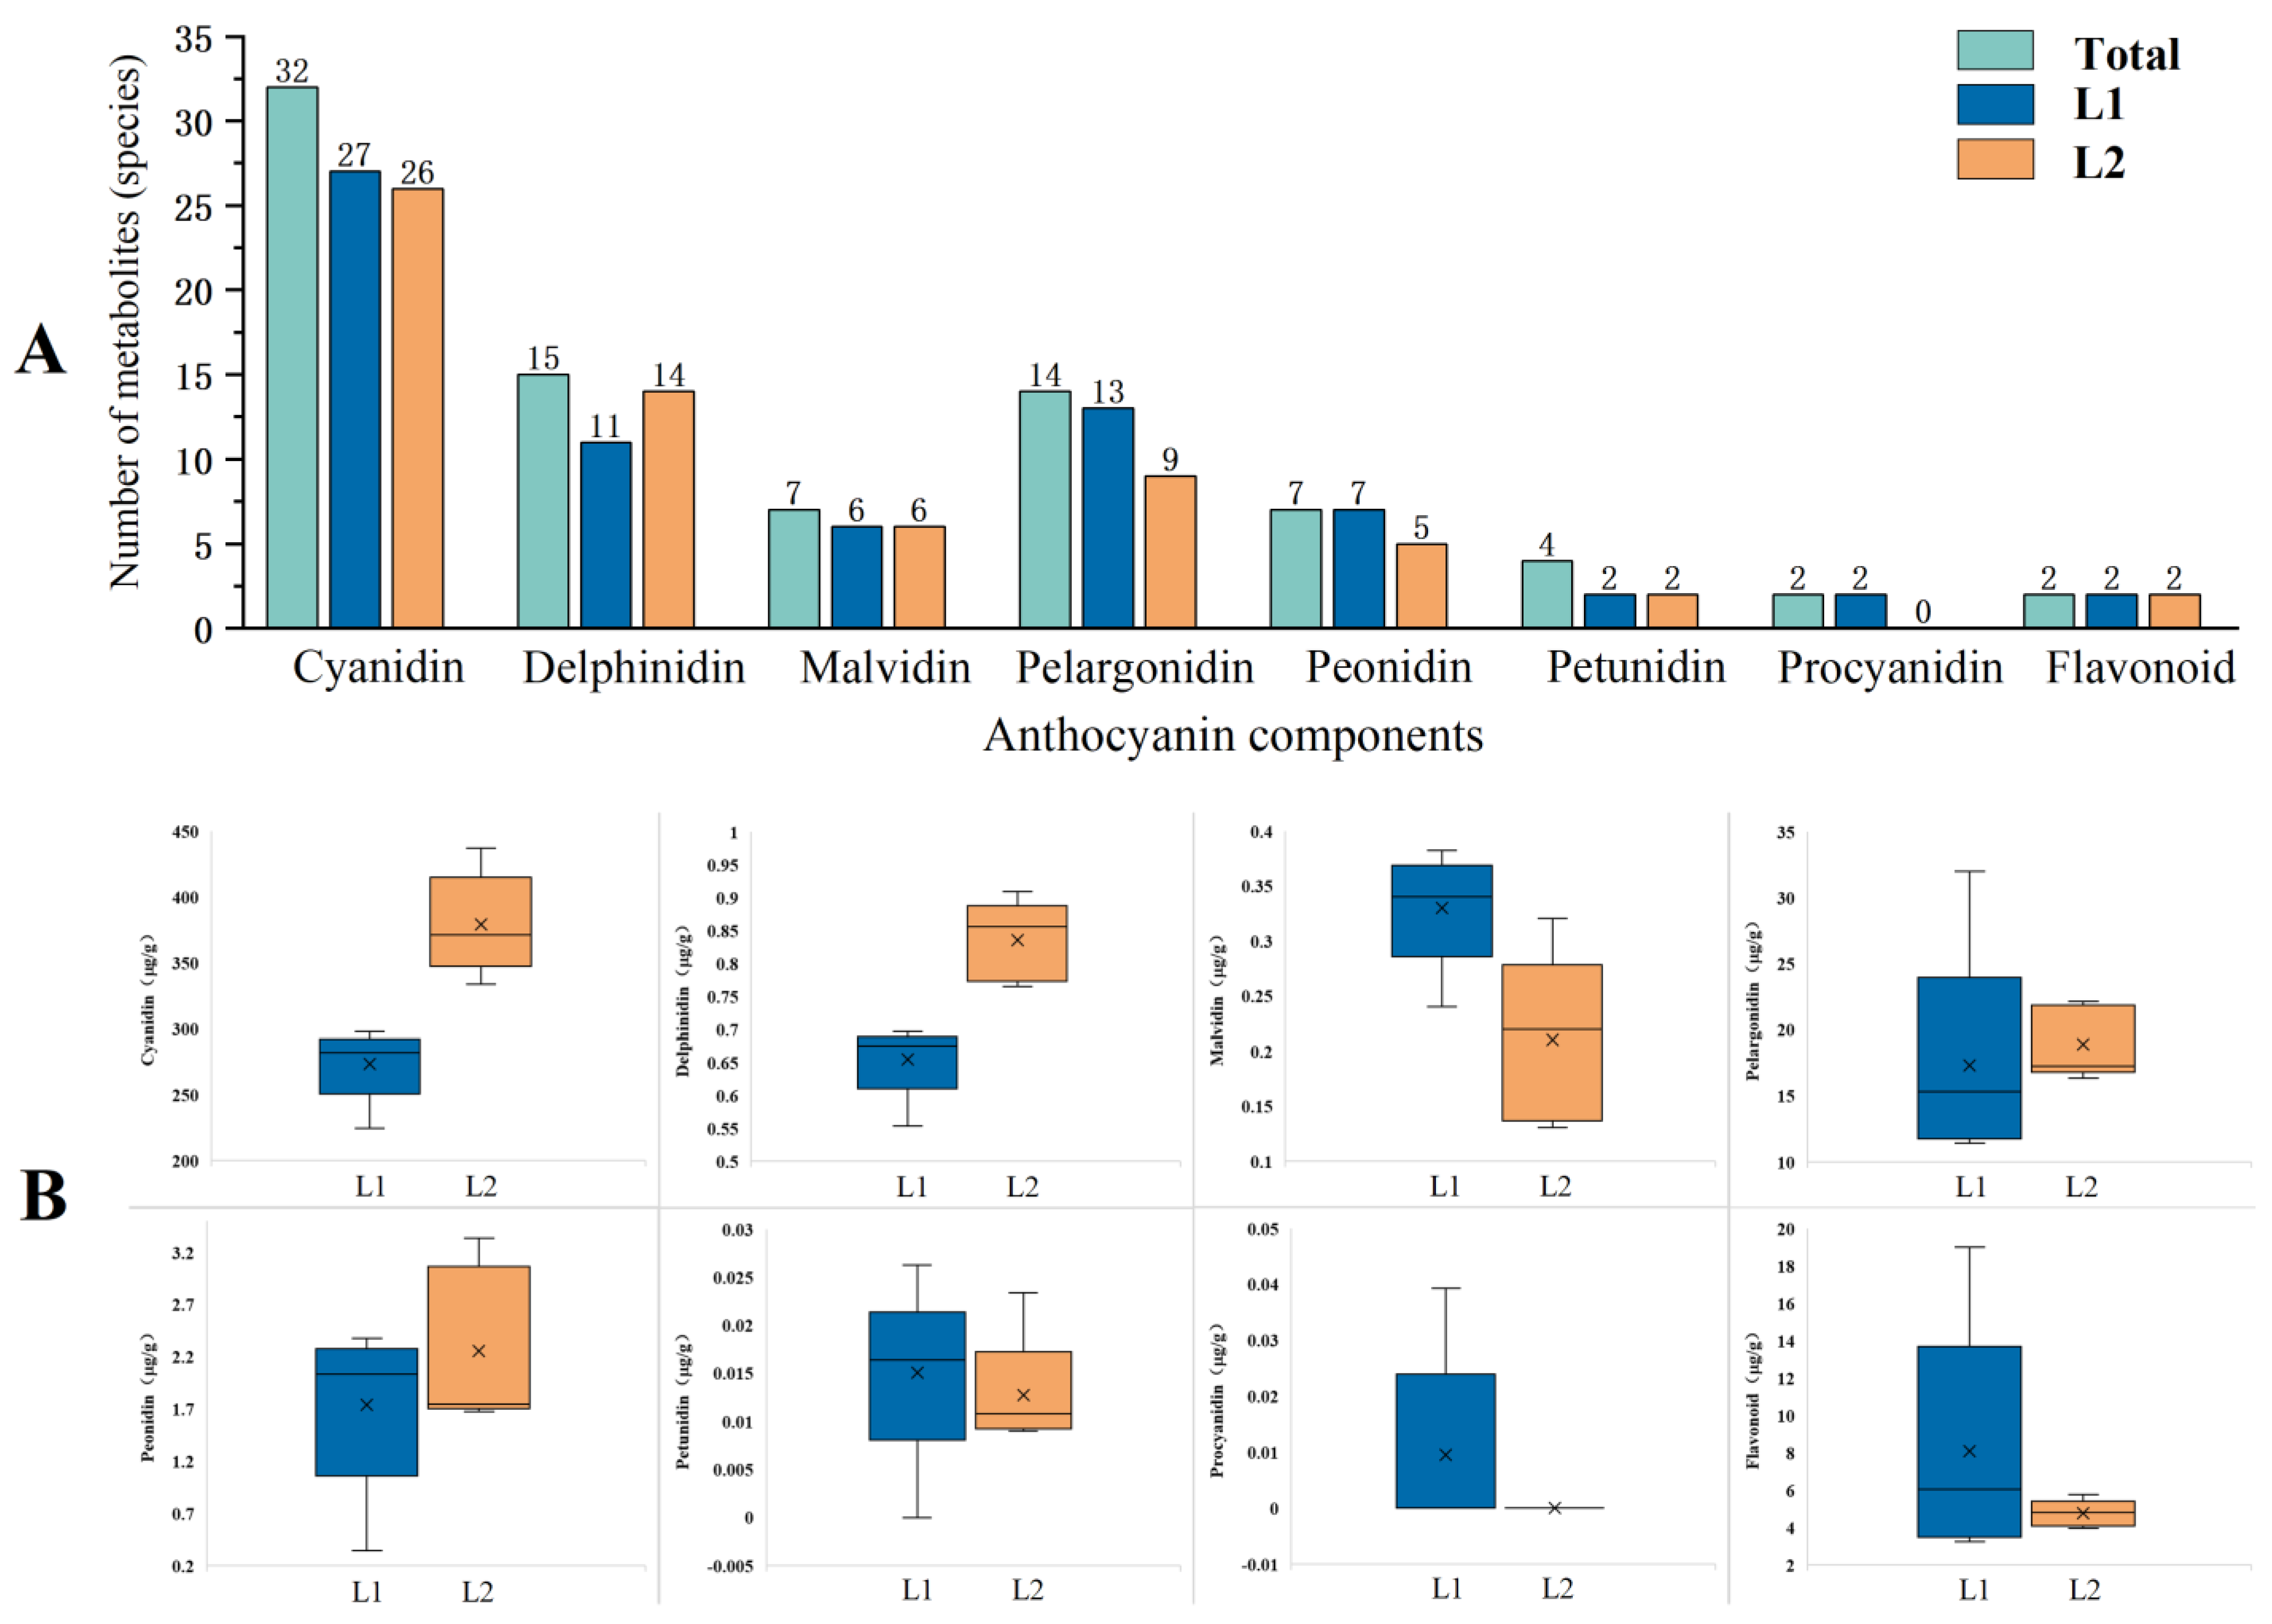
2.2.1. Comparison of Anthocyanin Compositions in Leaves of Two Types of P. frutescens Based on Leaf Color
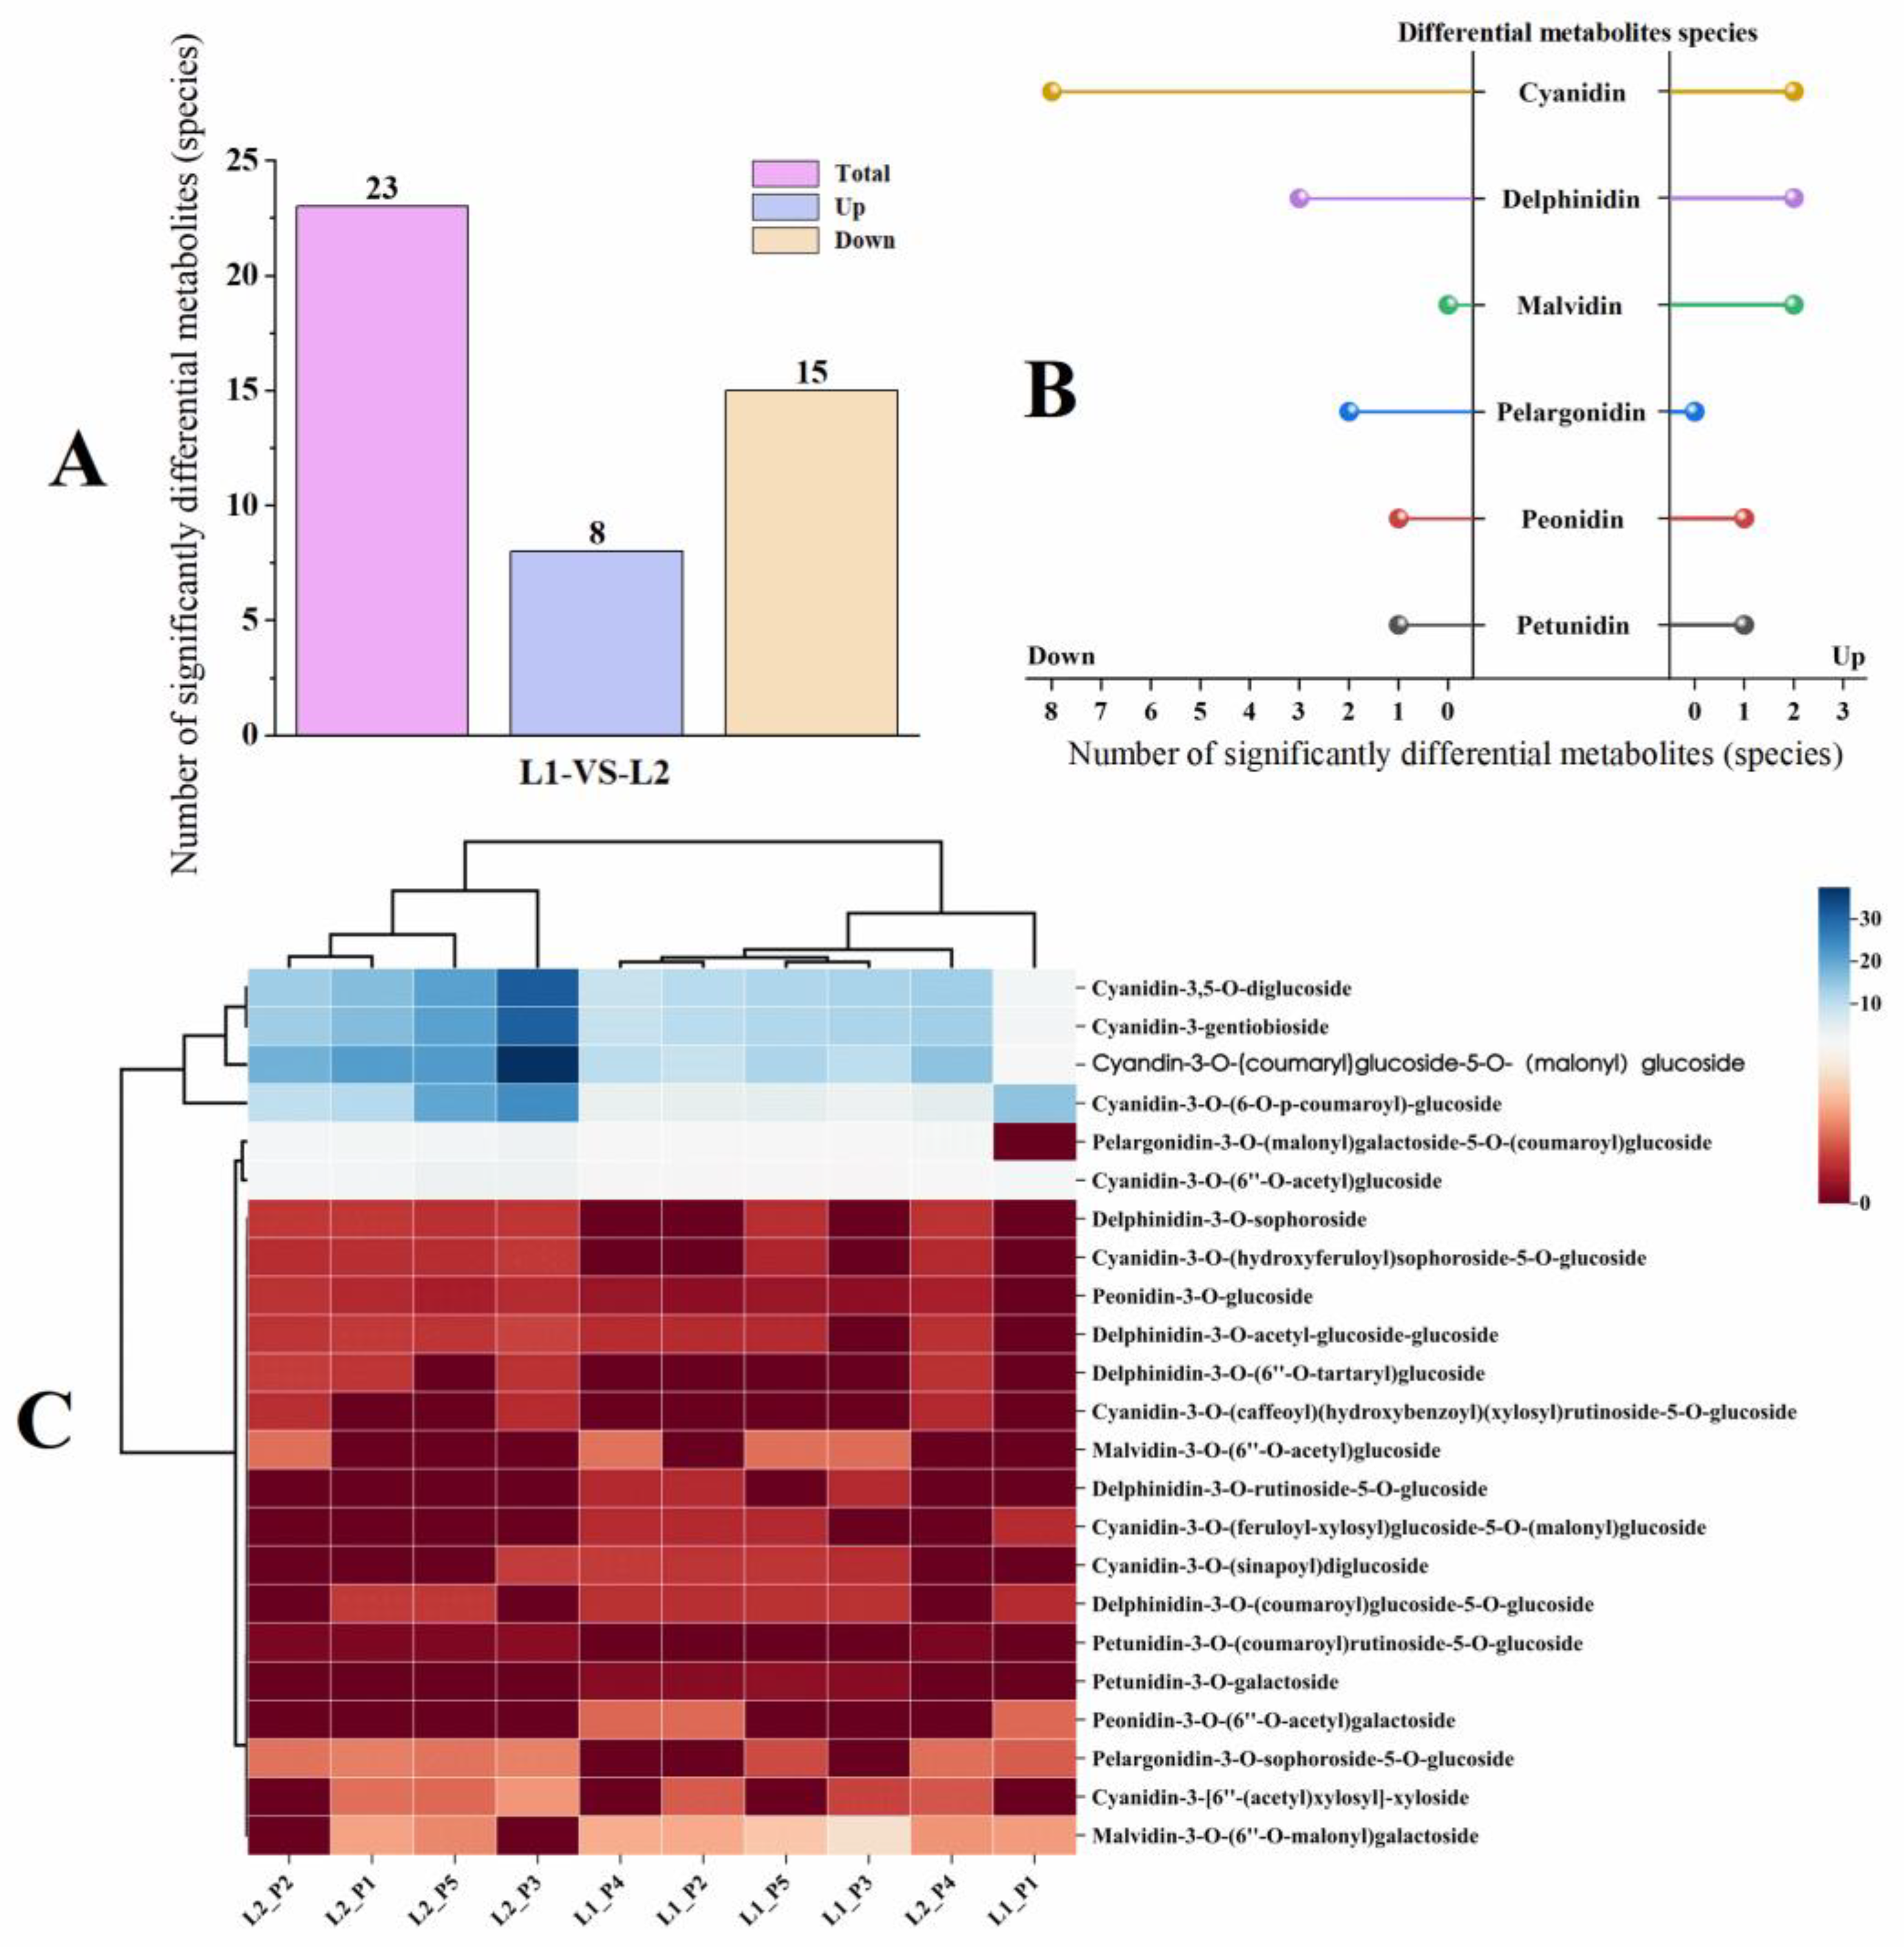
2.2.2. Analysis of Significantly Differentiated Metabolites of Anthocyanin Compounds in Two Varieties of P. frutescens Leaves Based on Leaf Color
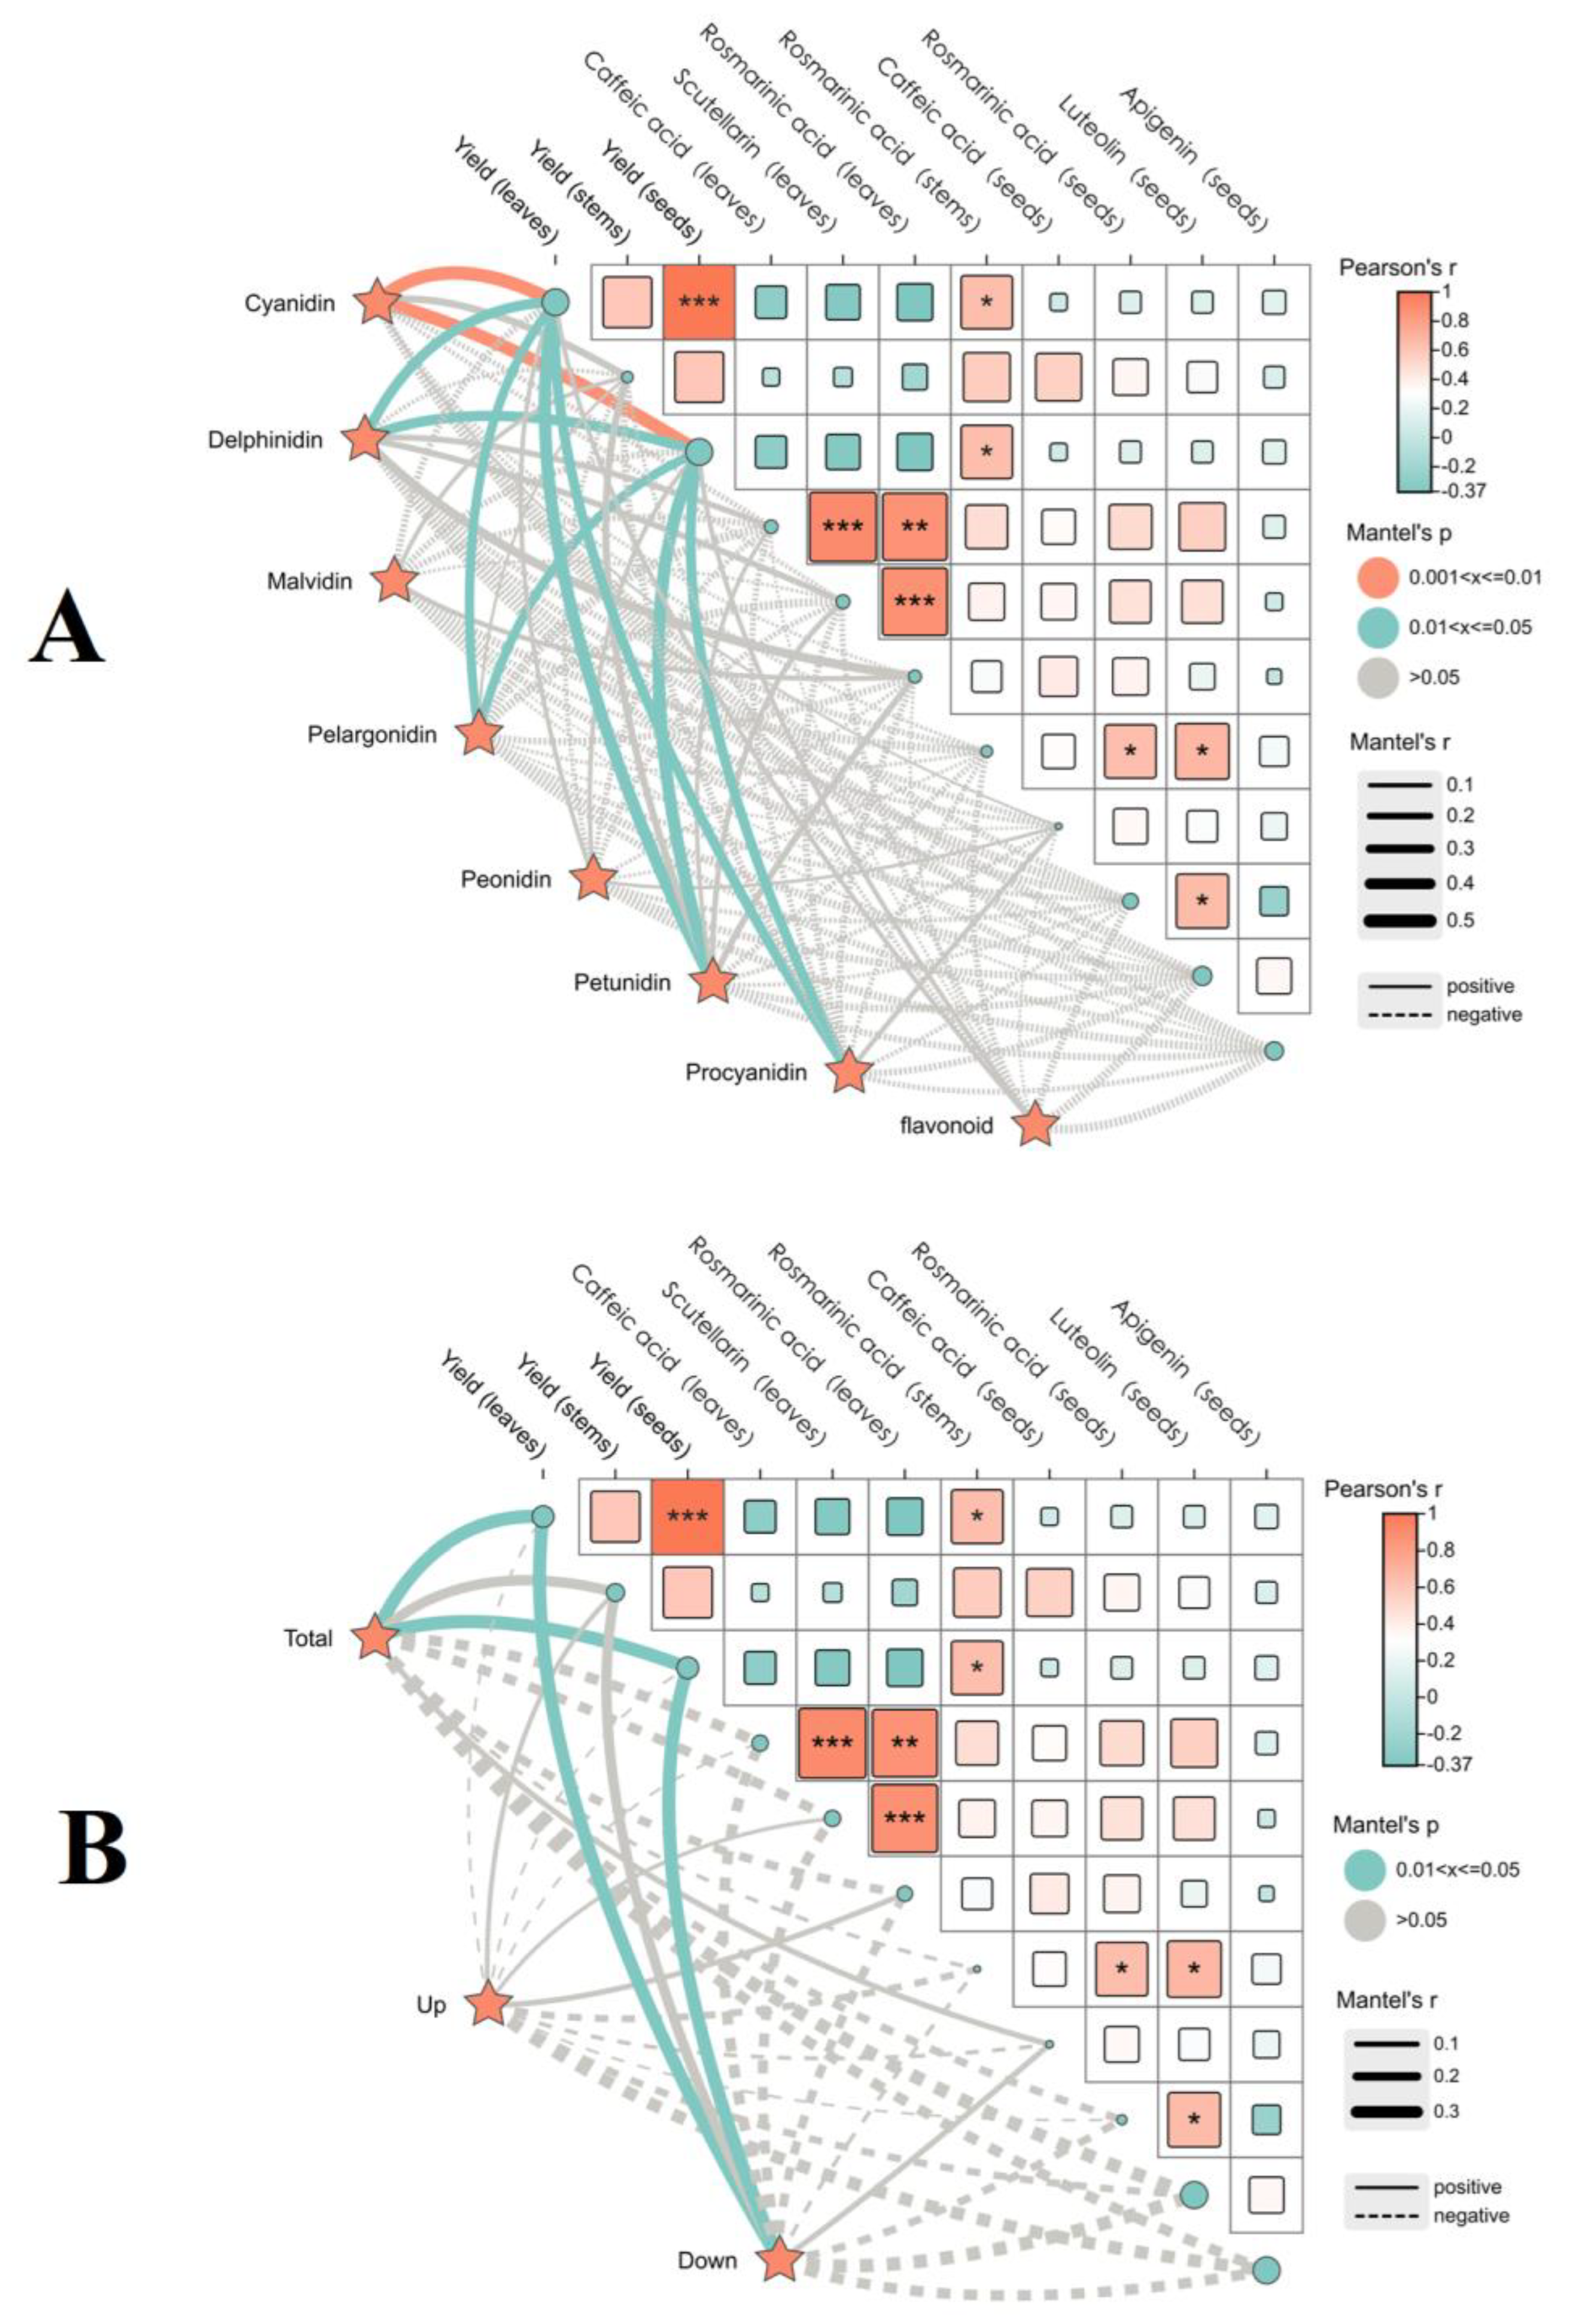
2.2.3. Correlation Between Anthocyanin Compounds and the Yield Quality of Two Varieties of P. frutescens Leaves Based on Leaf Color
2.3. Differences in Volatile Components of Two Varieties of P. frutescens Seeds Based on Leaf Color
2.3.1. Comparison of Volatile Component Contents in Two Varieties of P. frutescens Seeds Based on Leaf Color
2.3.2. Analysis of Differential Metabolites of Volatile Components in Two Varieties of P. frutescens Seeds Based on Leaf Color
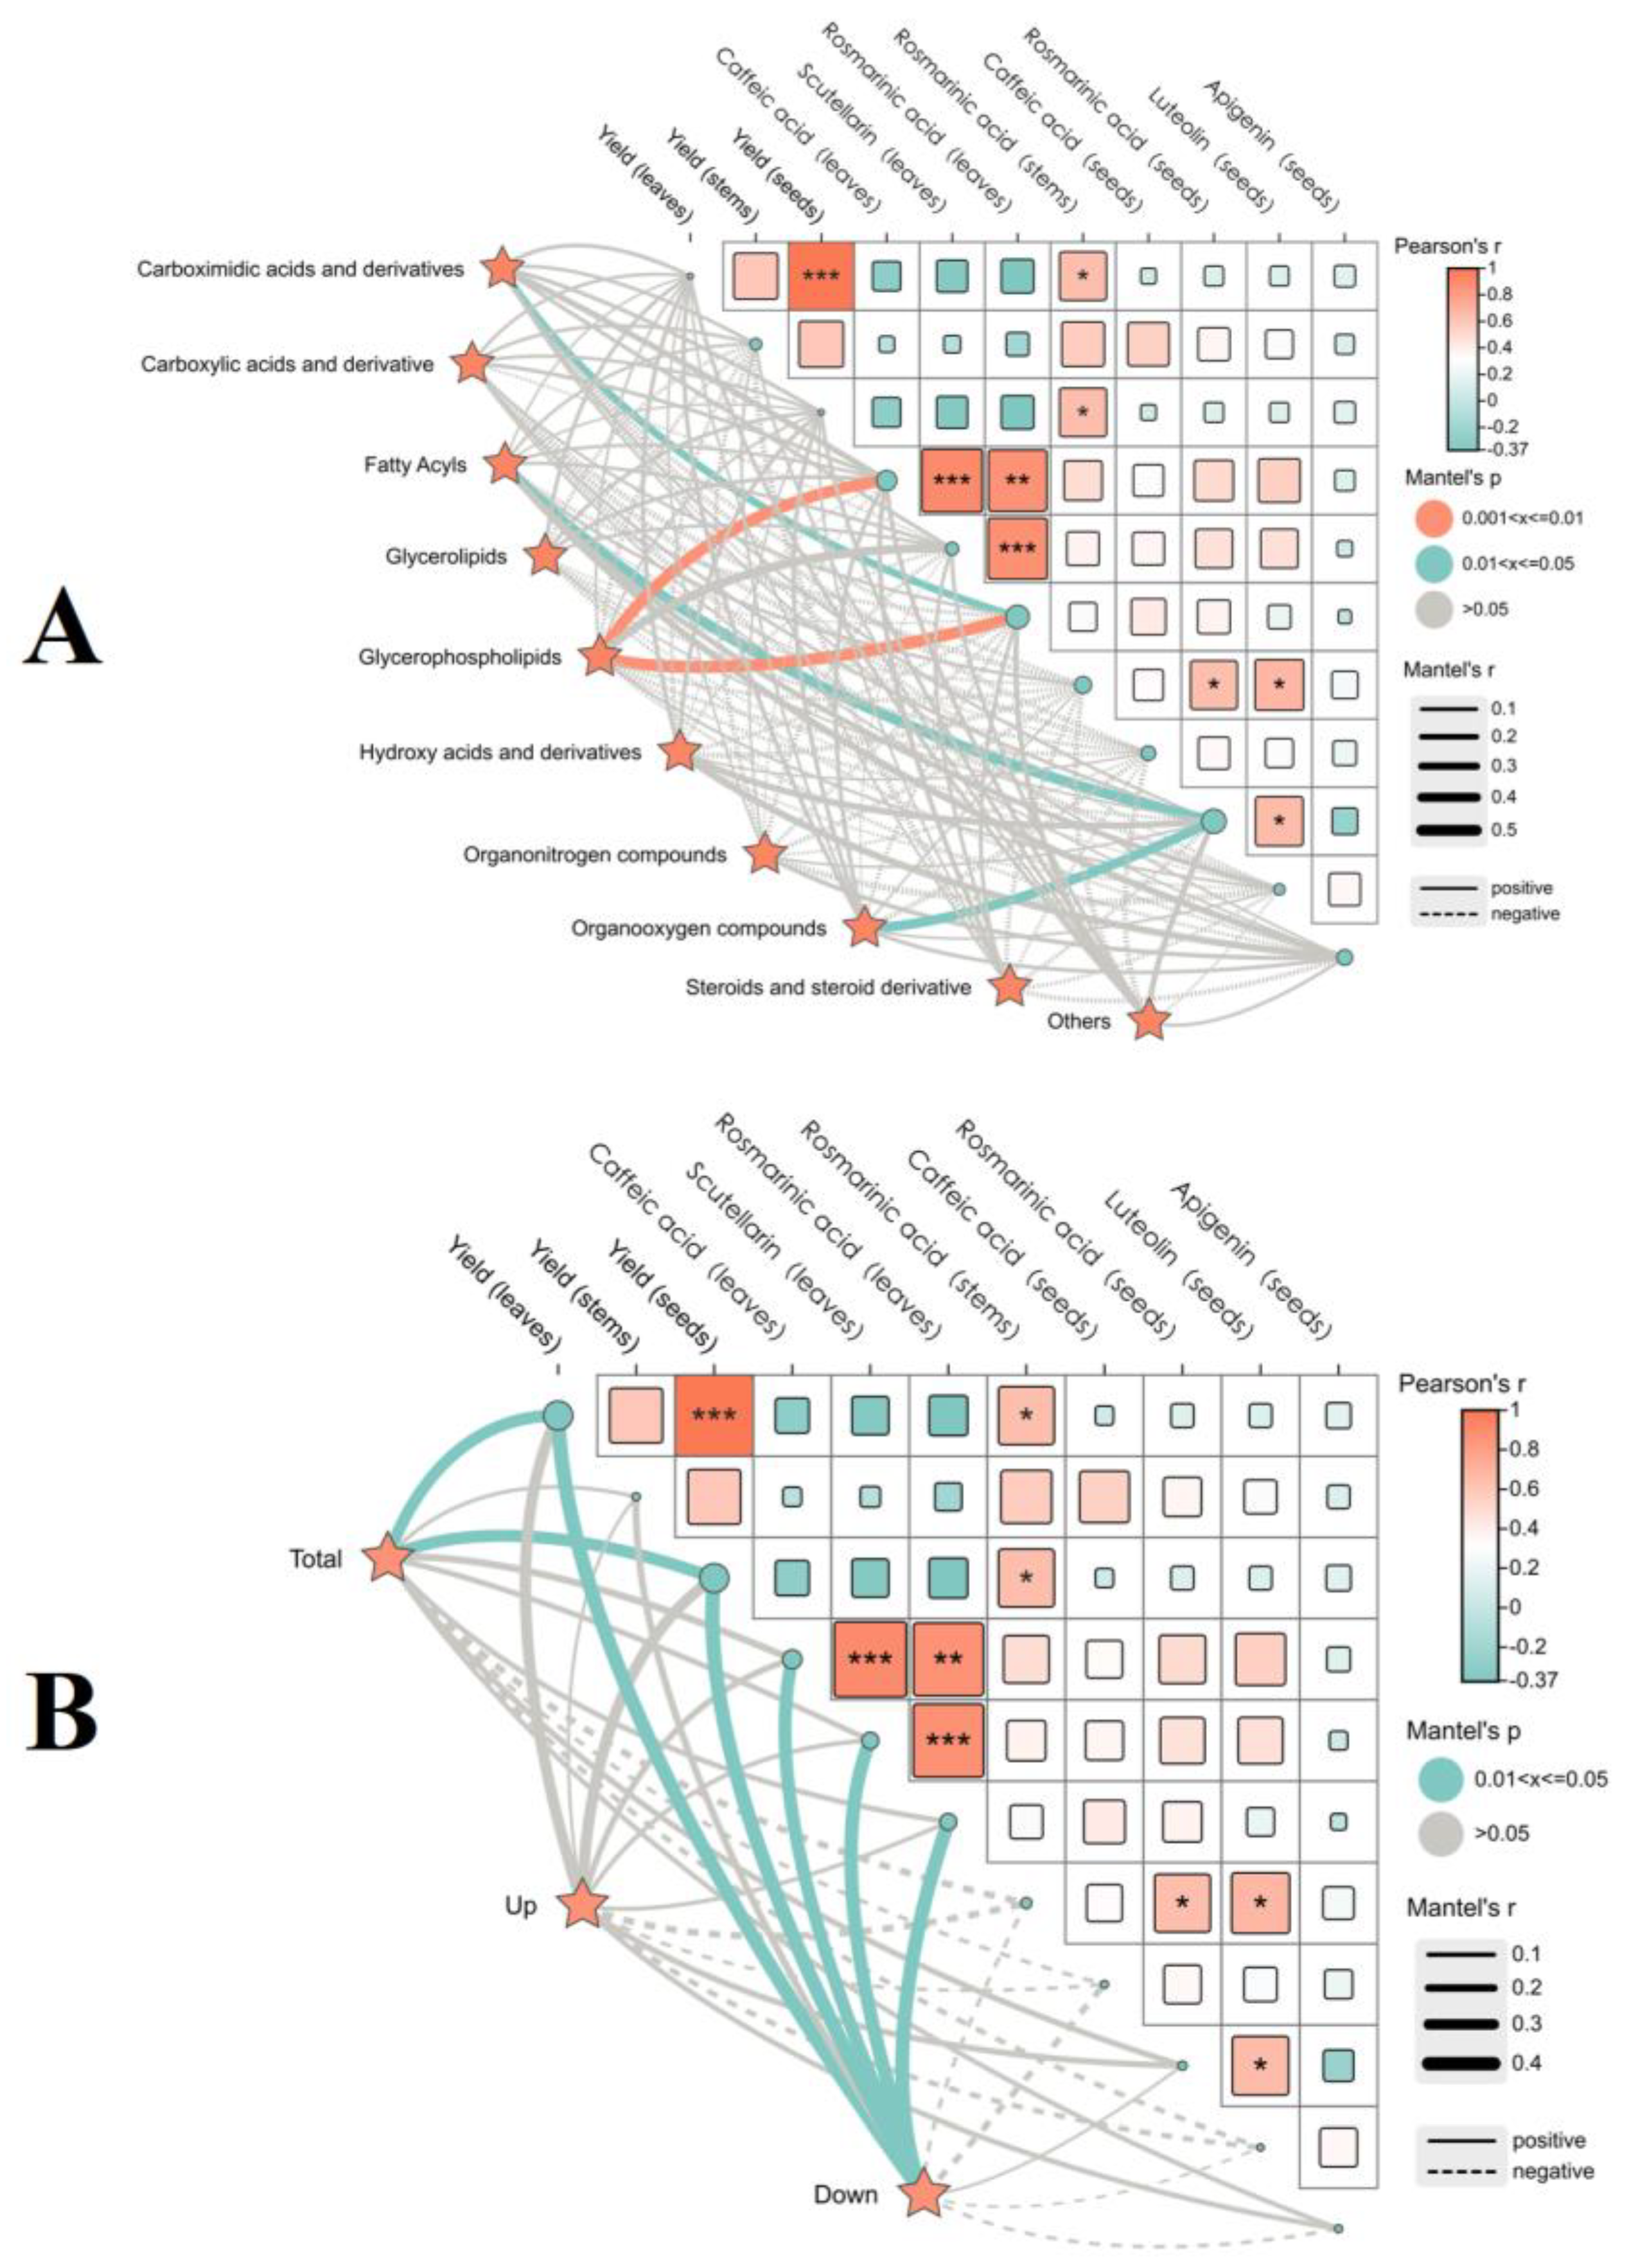
2.3.3. Correlation Between Volatile Components of Two Leaf Colors of P. frutescens and the Yield Quality of P. frutescens
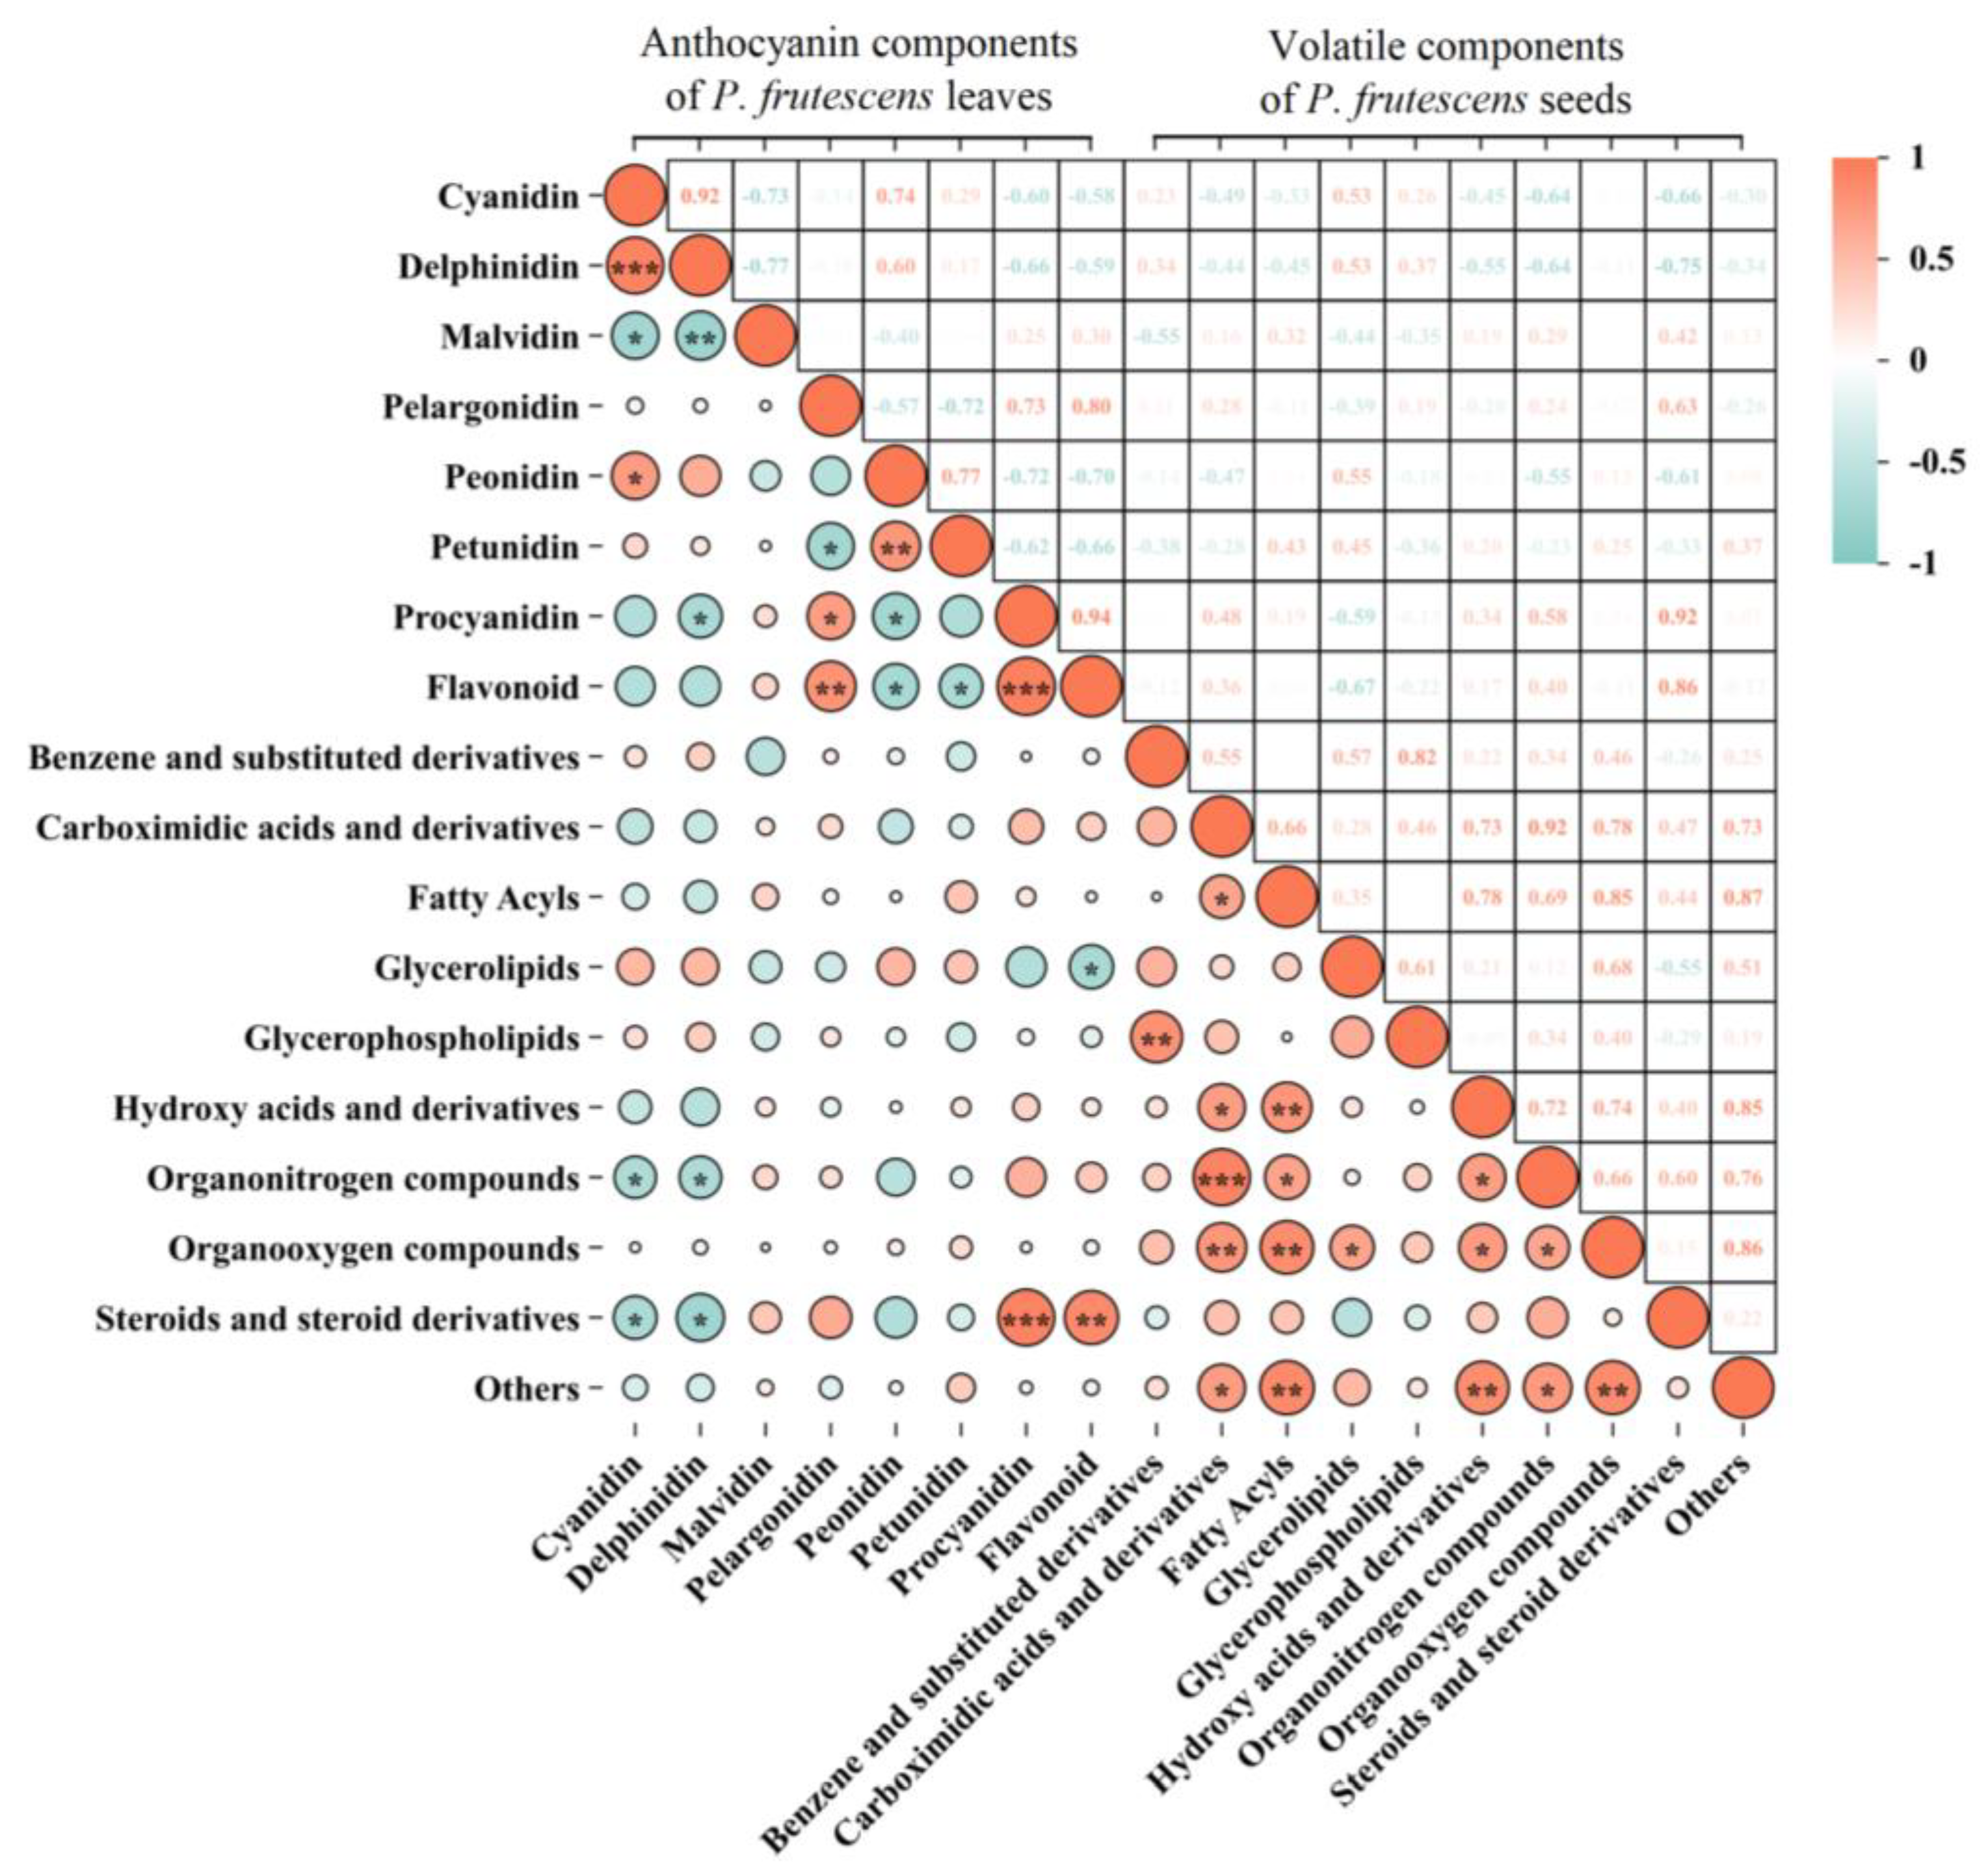
2.4. Correlation Between the Anthocyanin Components of P. frutescens Leaves and the Volatile Components of P. frutescens Seeds
3. Discussion
3.1. Significant Differences in Yield and Quality Exist Between the Two Leaf Color Varieties of P. frutescens
3.2. Anthocyanin Components of P. frutescens Leaves Are Closely Related to the Yield and Quality of P. frutescens
3.3. Volatile Components of P. frutescens Seeds Are Closely Related to the Yield and Quality of Purple P. frutescens
3.4. Accumulation of Anthocyanins in P. frutescens Leaves Is Closely Related to the Accumulation of Volatile Components in P. frutescens Seeds
4. Materials and Methods
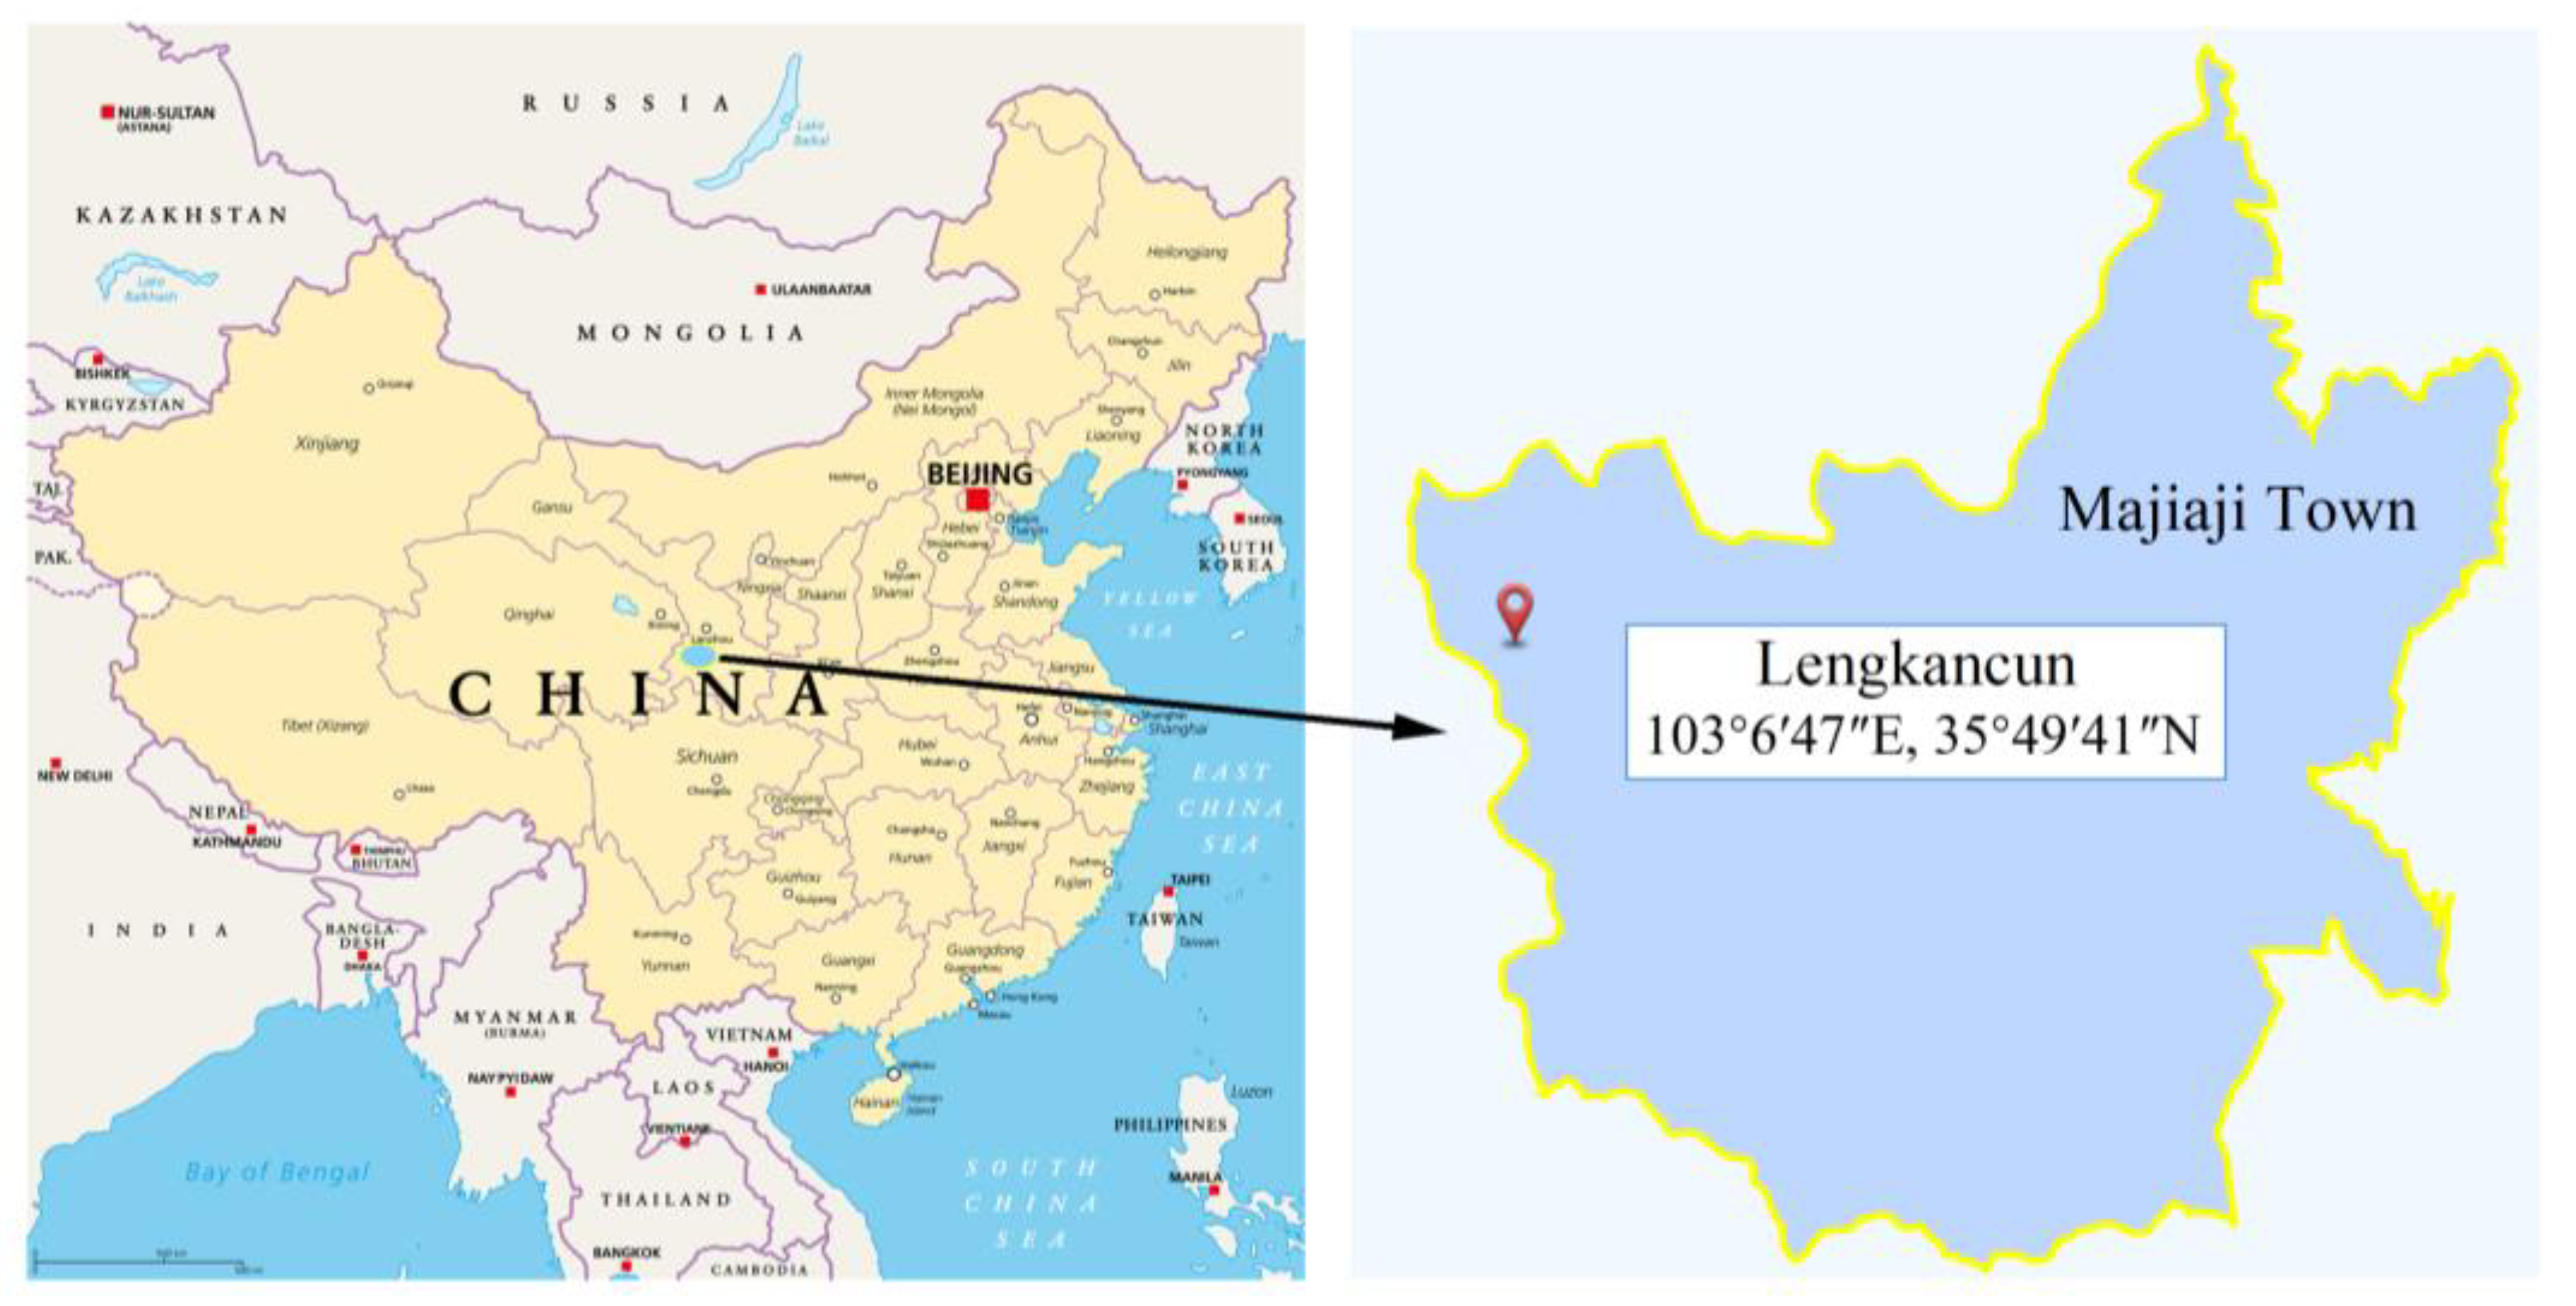
4.1. Overview of the Test Area
4.2. Plant Materials, Reagents, and Instruments
4.3. Experimental Design
4.4. Determination of Yield and Quality
4.4.1. Yield Determination
4.4.2. Quality Determination
4.5. Analysis of Metabolic Products
4.5.1. Analysis of Anthocyanin Components in P. frutescens Leaves
4.5.2. Analysis of Volatile Components in P. frutescens Seeds
4.6. Data Analysis
5. Conclusions
Author Contributions
Funding
Data Availability Statement
Conflicts of Interest
Appendix A

| Leaf Color Classification | Origin | ||||
|---|---|---|---|---|---|
| P1 | P2 | P3 | P4 | P5 | |
| Green-backed purple P. frutescens (L1) | Heilongjiang | Fujian | Hunan | Hebei | Gansu |
| Double-sided purple P. frutescens (L2) | Heilongjiang | Fujian | Hunan | Hebei | Gansu |
References
- Yu, H.; Qiu, J.F.; Ma, L.J.; Hu, Y.J.; Li, P.; Wan, J.B. Phytochemical and phytopharmacological review of Perilla frutescens L. (Labiatae), a traditional edible-medicinal herb in China. Food Chem. Toxicol. 2017, 108, 375–391. [Google Scholar] [CrossRef] [PubMed]
- Zhang, Y.; Shen, Q.; Leng, L.; Zhang, D.; Chen, S.; Shi, Y.; Ning, Z.; Chen, S. Incipient diploidization of the medicinal plant Perilla within 10,000 years. Nat. Commun. 2021, 12, 5508–5520. [Google Scholar] [CrossRef]
- Kwon, S.H.; Wang, Z.; Hwang, S.H.; Kang, Y.H.; Lee, J.Y.; Lim, S.S. Comprehensive evaluation of the antioxidant capacity of Perilla frutescens leaves extract and isolation of free radical scavengers using step-wise HSCCC guided by DPPH-HPLC. Int. J. Food Prop. 2017, 20, 921–934. [Google Scholar] [CrossRef]
- Ghimire, B.K.; Yoo, J.H.; Yu, C.Y.; Kim, S.H.; Chung, I.M. Profiling volatile and phenolic compound composition and characterization of the morphological and biological activities of Perilla frutescence Britton var. Japonica accessions. Acta Physiol. Plant. 2019, 41, 108. [Google Scholar] [CrossRef]
- Zhou, P.; Yin, M.; Dai, S.; Bao, K.; Song, C.; Liu, C.; Wu, Q. Multi-omics analysis of the bioactive constituents biosynthesis of glandular trichome in Perilla frutescens. BMC Plant Biol. 2021, 21, 277–291. [Google Scholar] [CrossRef]
- Ahmed, H.M. Ethnomedicinal, Phytochemical and Pharmacological Investigations of Perilla frutescens (L.) Britt. Molecules 2018, 24, 102. [Google Scholar] [CrossRef]
- Igarashi, M.; Miyazaki, Y. A Review on Bioactivities of Perilla: Progress in Research on the Functions of Perilla as Medicine and Food. Evid.-Based Complement. Altern. Med. 2013, 2013, 925342. [Google Scholar] [CrossRef]
- Lee, K.Y.; Rahman, M.S.; Kim, A.N.; Son, Y.; Gu, S.; Lee, M.H.; Kin, J.I.; Ha, T.J.; Kwak, D.; Kim, H.J.; et al. Effect of freeze-thaw pretreatment on yield and quality of perilla seed oil. LWT-Food Sci. Technol. 2020, 122, 109026. [Google Scholar] [CrossRef]
- Fan, Y.; Cao, X.; Zhang, M.; Wei, S.; Zhu, Y.; Ouyang, H.; He, J. Quantitative Comparison and Chemical Profile Analysis of Different Medicinal Parts of Perilla frutescens (L.) Britt. from Different Varieties and Harvest Periods. J. Agric. Food Chem. 2022, 70, 8838–8853. [Google Scholar] [CrossRef]
- Li, Y.; Zhang, Y.; Wang, Y.; Li, X.; Zhou, L.; Yang, J.; Guo, L. Metabolites and chemometric study of Perilla (Perilla frutescens) from different varieties and geographical origins. J. Food Sci. 2022, 87, 5240–5251. [Google Scholar] [CrossRef]
- Dossou, S.S.K.; Deng, Q.; Li, F.; Jiang, N.; Zhou, R.; Wang, L.; Li, D.; Tan, M.; You, J.; Wang, L. Comparative Metabolomics Analysis of Different Perilla Varieties Provides Insights into Variation in Seed Metabolite Profiles and Antioxidant Activities. Foods 2023, 12, 4370. [Google Scholar] [CrossRef] [PubMed]
- Chen, J.; Guo, L.; Yang, G.; Yang, A.; Zheng, Y.; Wang, L. Metabolomic profiling of developing perilla leaves reveals the best harvest time. Front. Plant Sci. 2022, 13, 989755. [Google Scholar] [CrossRef] [PubMed]
- Peiretti, P.G. Fatty Acid Content and Chemical Composition of Vegetative Parts of Perilla (Perilla frutescens L.) after Different Growth Lengths. Res. J. Med. Plants 2011, 5, 72–78. [Google Scholar] [CrossRef]
- Lee, K.Y.; Rahman, M.S.; Kim, A.N.; Jeong, E.J.; Kim, B.G.; Lee, M.H.; Kim, H.J.; Choi, S.G. Effect of superheated steam treatment on yield, physicochemical properties and volatile profiles of perilla seed oil. LWT-Food Sci. Technol. 2021, 135, 110240. [Google Scholar] [CrossRef]
- Guan, Z.; Li, S.; Lin, Z.; Yang, R.; Zhao, Y.; Liu, J.; Yang, S.; Chen, A. Identification and Quantitation of Phenolic Compounds from the Seed and Pomace of Perilla frutescens Using HPLC/PDA and HPLC–ESI/QTOF/MS/MS. Phytochem. Anal. 2014, 25, 508–513. [Google Scholar] [CrossRef]
- Su, X.; Yue, X.; Kong, M.; Xie, Z.; Yan, J.; Ma, W.; Wang, Y.; Zhao, J.; Zhang, X.; Liu, M. Leaf Color Classification and Expression Analysis of Photosynthesis-Related Genes in Inbred Lines of Chinese Cabbage Displaying Minor Variations in Dark-Green Leaves. Plants 2023, 12, 2124. [Google Scholar] [CrossRef]
- Wang, Z.; Xu, H.; Wang, F.; Sun, L.; Meng, X.; Li, Z.; Xie, C.; Jiang, H.; Ding, G.; Hu, X.; et al. EMS-induced missense mutation in TaCHLI-7D affects leaf color and yield-related traits in wheat. Theor. Appl. Genet. 2024, 137, 223–239. [Google Scholar] [CrossRef]
- Saini, R.K.; Keum, Y.S.; Rengasamy, K.R.R. Profiling of nutritionally important metabolites in green/red and green perilla (Perilla frutescens Britt.) cultivars: A comparative study. Ind. Crop Prod. 2020, 151, 112441. [Google Scholar] [CrossRef]
- Yang, Y.; Chen, X.; Xu, B.; Li, Y.; Ma, Y.; Wang, G. Phenotype and transcriptome analysis reveals chloroplast development and pigment biosynthesis together influenced the leaf color formation in mutants of Anthurium andraeanum ‘Sonate’. Front. Plant Sci. 2015, 6, 139. [Google Scholar] [CrossRef]
- Jin, H.M.; Dang, B.; Zhang, W.G.; Zheng, W.C.; Yang, X.J. Polyphenol and Anthocyanin Composition and Activity of Highland Barley with Different Colors. Molecules 2022, 27, 3411. [Google Scholar] [CrossRef]
- Zhao, Y.W.; Wang, C.K.; Huang, X.Y.; Hu, D.G. Anthocyanin stability and degradation in plants. Plant Signal Behav. 2021, 16, 1987767. [Google Scholar] [CrossRef] [PubMed]
- Karakaya, S.; Simsek, S.; Eker, A.T.; Pineda-Vadillo, C.; Dupont, D.; Perez, B.; Viadel, B.; Sanz-Buenhombre, M.; Rodriguez, A.G.; Kertész, Z.; et al. Stability and bioaccessibility of anthocyanins in bakery products enriched with anthocyanins. Food Funct. 2016, 7, 3488–3496. [Google Scholar] [CrossRef] [PubMed]
- Zhao, Y.; Jiang, C.; Lu, J.; Sun, Y.; Cui, Y. Research progress of proanthocyanidins and anthocyanidins. Phytother. Res. 2023, 37, 2552–2577. [Google Scholar] [CrossRef]
- Yang, S.; Yang, P.; Wang, W.; Wu, J.; Liao, X.; Xu, Z. A normalization strategy for cyanidin-3-diglucoside-5-glucoside recovery from red cabbage byproducts. J Clean. Prod. 2025, 494, 144965. [Google Scholar] [CrossRef]
- Taghavi, T.; Patel, H.; Rafie, R. Extraction Solvents Affect Anthocyanin Yield, Color, and Profile of Strawberries. Plants 2023, 12, 1833. [Google Scholar] [CrossRef]
- Song, S.; He, A.; Zhao, T.; Yin, Q.; Mu, Y.; Wang, Y.; Liu, H.; Nie, L.; Peng, S. Effects of shading at different growth stages with various shading intensities on the grain yield and anthocyanin content of colored rice (Oryza sativa L.). Field Crop Res. 2022, 283, 108555. [Google Scholar] [CrossRef]
- Lattanzio, V.; Lattanzio, V.M.T.; Cardinali, A. Role of phenolics in the resistance mechanisms of plants against fungal pathogens and insects. Phytochem. Adv. Res. 2006, 661, 23–67. [Google Scholar]
- Kołton, A.; Długosz-Grochowska, O.; Wojciechowska, R.; Czaja, M. Biosynthesis Regulation of Folates and Phenols in Plants. Sci. Hortic. 2022, 291, 110561. [Google Scholar] [CrossRef]
- Agati, G.; Azzarello, E.; Pollastri, S.; Tattini, M. Flavonoids as antioxidants in plants: Location and functional significance. Plant Sci. 2012, 196, 67–76. [Google Scholar] [CrossRef]
- Stamp, N. Out of the Quagmire of Plant Defense Hypotheses. Q. Rev. Biol. 2003, 78, 23–55. [Google Scholar] [CrossRef]
- Herms, D.A.; Mattson, W.J. The dilemma of plants: To grow or defend. Q. Rev. Biol. 1992, 67, 283–335. [Google Scholar] [CrossRef]
- Koricheva, J.; Nykänen, H.; Gianoli, E. Meta-analysis of Trade-offs among Plant Antiherbivore Defenses: Are Plants Jacks-of-All-Trades, Masters of All? Am. Nat. 2004, 163, E64–E75. [Google Scholar] [CrossRef] [PubMed]
- Kim, D.H.; Lee, J.H. Comparative evaluation of phenolic phytochemicals from perilla seeds of diverse species and screening for their tyrosinase inhibitory and antioxidant properties. S. Afr. J. Bot. 2019, 123, 341–350. [Google Scholar] [CrossRef]
- Trendafilova, A.; Ivanova, V.; Trusheva, B.; Kamenova-Nacheva, M.; Tabakov, S.; Simova, S. Chemical Composition and Antioxidant Capacity of the Fruits of European Plum Cultivar “Čačanska Lepotica” Influenced by Different Rootstocks. Foods 2022, 11, 2844. [Google Scholar] [CrossRef]
- Martín, J.; Kuskoski, E.M.; Sánchez, M.J.N.; Asuero, A.G. Antioxidant Capacity of Anthocyanin Pigments. Flavonoids 2017, 3, 205–255. [Google Scholar]
- Ha, T.J.; Lee, M.H.; Lee, J.H. Comparison of Antioxidant Activities and Volatile Components Using GC/MS from Leaves of Korean Purple Perilla (Perilla frutescens) Grown in a Greenhouse. Food Sci. Biotechnol. 2015, 24, 1979–1986. [Google Scholar] [CrossRef]
- Xie, J.; Li, X.; Li, W.; Ding, H.; Yin, J.; Bie, S.; Li, F.; Tian, C.; Han, L.; Yang, W.; et al. Characterization of the key volatile organic components of different parts of fresh and dried Perilla frutescens based on headspace-gas chromatography-ion mobility spectrometry and headspace solid phase microextraction-gas chromatography-mass spectrometry. Arab. J. Chem. 2023, 16, 104867. [Google Scholar] [CrossRef]
- Ghimire, B.K.; Yoo, J.H.; Yu, C.Y.; Chuang, I.M. GC–MS analysis of volatile compounds of Perilla frutescens Britton var. Japonica accessions: Morphological and seasonal variability. Asian Pac. J. Trop. Med. 2017, 10, 643–651. [Google Scholar] [CrossRef]
- Yang, L.; Xian, D.; Xiong, X.; Lai, R.; Song, J.; Zhong, J. Proanthocyanidins against Oxidative Stress: From Molecular Mechanisms to Clinical Applications. BioMed Res. Int. 2018, 2018, 8584136. [Google Scholar] [CrossRef]
- Sadowska-Bartosz, I.; Bartosz, G. Antioxidant Activity of Anthocyanins and Anthocyanidins: A Critical Review. Int. J. Mol. Sci. 2024, 25, 12001. [Google Scholar] [CrossRef]
- Lu, Y.; Yang, W.; Huang, D.; Liang, L.; Xu, C. Advances in understanding of the mechanisms regulating anthocyanin accumulation in peach. Sci. Hortic. 2025, 342, 114022. [Google Scholar] [CrossRef]
- Gaion, L.A.; Galati, V.C.; Cardoso, A.C.R.; Rossatto, D.R.; Carvalho, R.F. Shifting the anthocyanins from light to shade: What roles do these pigments play? Theor. Exp. Plant Phys. 2025, 37, 16. [Google Scholar] [CrossRef]
- Dare, A.P.; Wu, C.; Carvajal, J.I.; Nguyen, H.M.; Günther, C.S.; Hamiaux, C.; Bailey, S.; Deng, C.; Mengist, M.F.; Iorizzo, M.; et al. Haplotyped genome mapping and functional characterization of a blueberry anthocyanin acetyltransferase (AAT) controlling the accumulation of acylated anthocyanins. J. Exp. Bot. 2024, 76, 1607–1624. [Google Scholar] [CrossRef] [PubMed]
- Pan, C.; Liu, Y.; Tang, D.; Chen, J.; Yin, Z. Impact of Hormone on Growth and GA3 Regulation of Anthocyanin Biosynthesis in Suspension-Culture Cells of Cyclocarya paliurus. Biotechnol. Bioeng. 2025, 122, 948–962. [Google Scholar] [CrossRef]


| Ingredient to Be Tested | Regression Equations | Correlation Coefficient | Linear Range (μg·mL−1) |
|---|---|---|---|
| Caffeic acid (Leaves) | Y = 62.65X − 35.579 | 0.9995 | 2~12 |
| Scutellarin (Leaves) | Y = 23.286X − 4.4053 | 0.9995 | 2~12 |
| Rosmarinic acid (Leaves) | Y = 23.145X + 8.0847 | 0.9992 | 2~12 |
| Rosmarinic acid (Stems) | Y = 14.639X − 9.3247 | 0.9997 | 2~12 |
| Caffeic acid (Seeds) | Y = 21.012X + 2.9191 | 0.9996 | 2.5~37.5 |
| Rosmarinic acid (Seeds) | Y = 11.386X − 19.138 | 0.9993 | 10~150 |
| Luteolin (Seeds) | Y = 57.498X − 1.9701 | 0.9992 | 1~15 |
| Apigenin (Seeds) | Y = 20.444X + 0.7979 | 0.9992 | 0.5~7.5 |
Disclaimer/Publisher’s Note: The statements, opinions and data contained in all publications are solely those of the individual author(s) and contributor(s) and not of MDPI and/or the editor(s). MDPI and/or the editor(s) disclaim responsibility for any injury to people or property resulting from any ideas, methods, instructions or products referred to in the content. |
© 2025 by the authors. Licensee MDPI, Basel, Switzerland. This article is an open access article distributed under the terms and conditions of the Creative Commons Attribution (CC BY) license (https://creativecommons.org/licenses/by/4.0/).
Share and Cite
Huang, Z.; Zhang, X.; Fan, L.; Jin, X.; Wang, H.; Cheng, J.; Wang, C.; Fang, Q. Quantitative Comparison of Yield, Quality, and Metabolic Products of Different Medicinal Parts of Two Types of Perilla frutescens Cultivated in a New Location from Different Regions. Plants 2025, 14, 1486. https://doi.org/10.3390/plants14101486
Huang Z, Zhang X, Fan L, Jin X, Wang H, Cheng J, Wang C, Fang Q. Quantitative Comparison of Yield, Quality, and Metabolic Products of Different Medicinal Parts of Two Types of Perilla frutescens Cultivated in a New Location from Different Regions. Plants. 2025; 14(10):1486. https://doi.org/10.3390/plants14101486
Chicago/Turabian StyleHuang, Zhenbin, Xiang Zhang, Liangshuai Fan, Xiaojun Jin, Hongyan Wang, Jiali Cheng, Chenyue Wang, and Qing Fang. 2025. "Quantitative Comparison of Yield, Quality, and Metabolic Products of Different Medicinal Parts of Two Types of Perilla frutescens Cultivated in a New Location from Different Regions" Plants 14, no. 10: 1486. https://doi.org/10.3390/plants14101486
APA StyleHuang, Z., Zhang, X., Fan, L., Jin, X., Wang, H., Cheng, J., Wang, C., & Fang, Q. (2025). Quantitative Comparison of Yield, Quality, and Metabolic Products of Different Medicinal Parts of Two Types of Perilla frutescens Cultivated in a New Location from Different Regions. Plants, 14(10), 1486. https://doi.org/10.3390/plants14101486