
Mining Key Drought-Resistant Genes of Upland Cotton Based on RNA-Seq and WGCNA Analysis

 ,
, 
Abstract
1. Introduction
2. Experimental Methods
2.1. Planting and Treatment
2.2. Physiological Indicator Detection
2.3. Library Preparation, Quality Control, and Sequencing
2.4. Data Quality Control
2.5. Sequence Alignment to the Reference Genome
2.6. Gene Expression Quantification
2.7. Differential Expression Analysis
2.8. Differential Gene Enrichment Analysis
2.9. WGCNA
2.10. qRT-PCR Validation
3. Results
3.1. Identification of Drought Resistance of Jin and TM-1
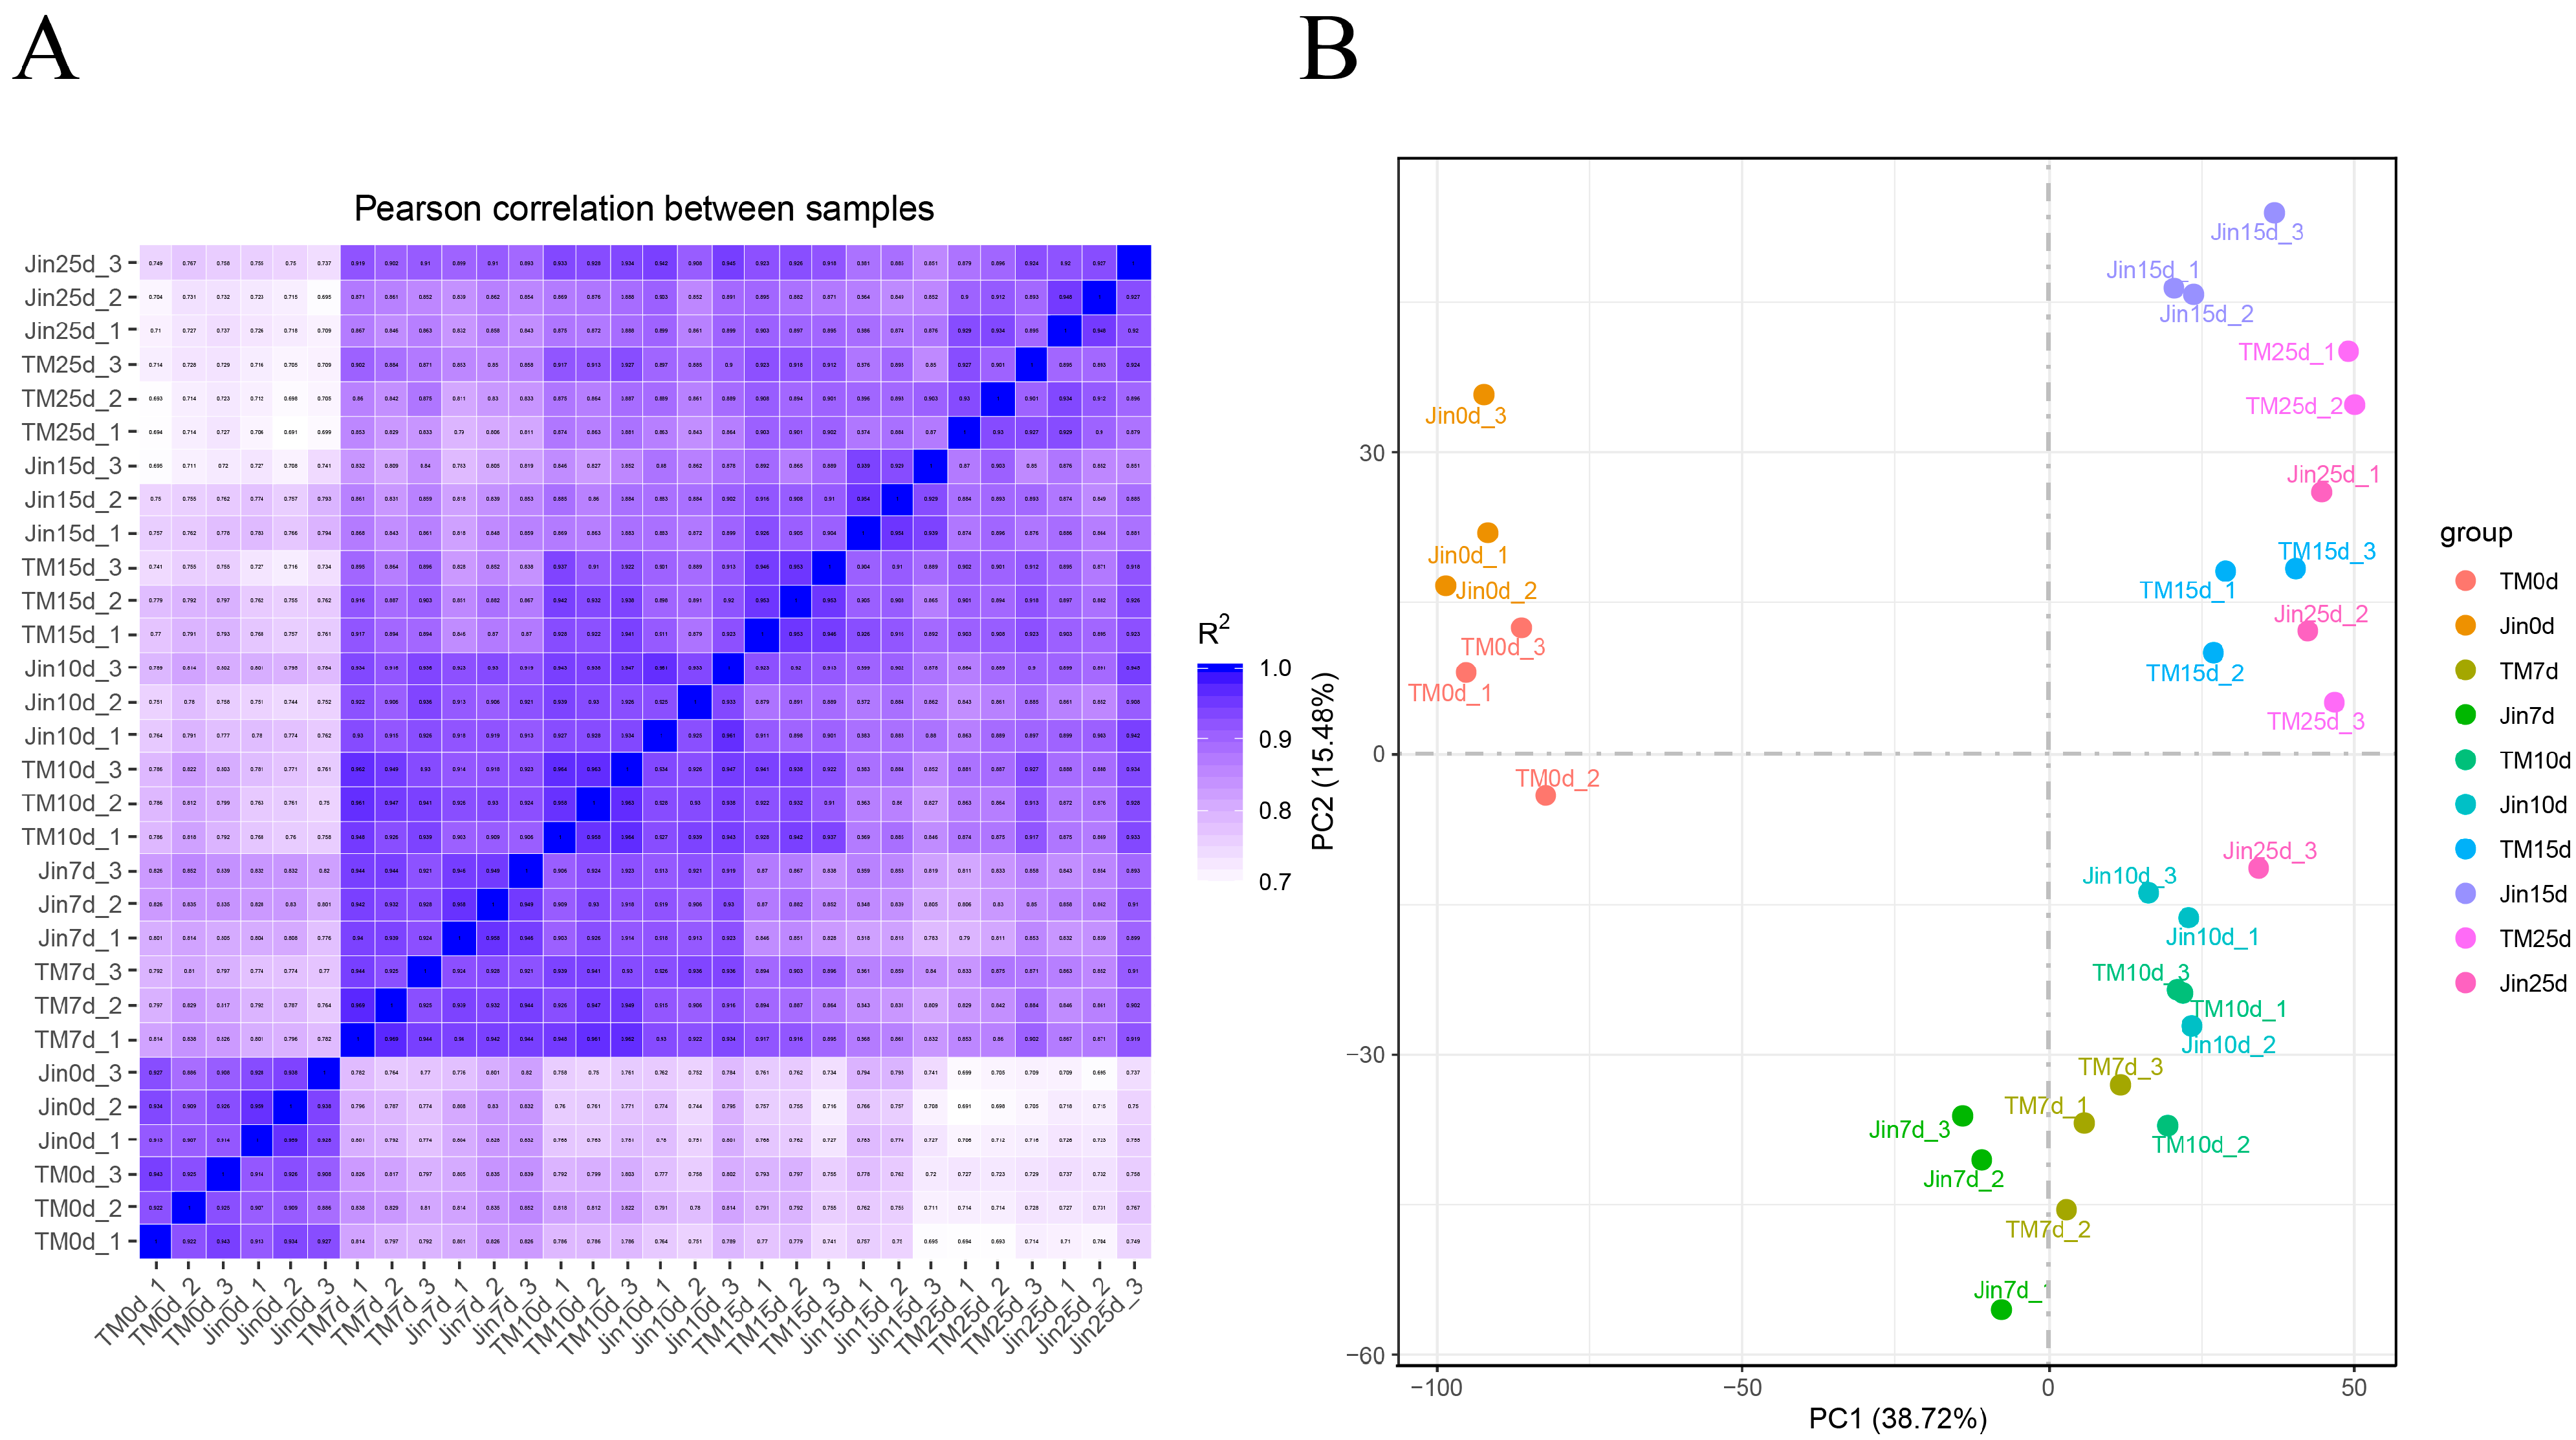
3.2. RNA-Seq Data Analysis
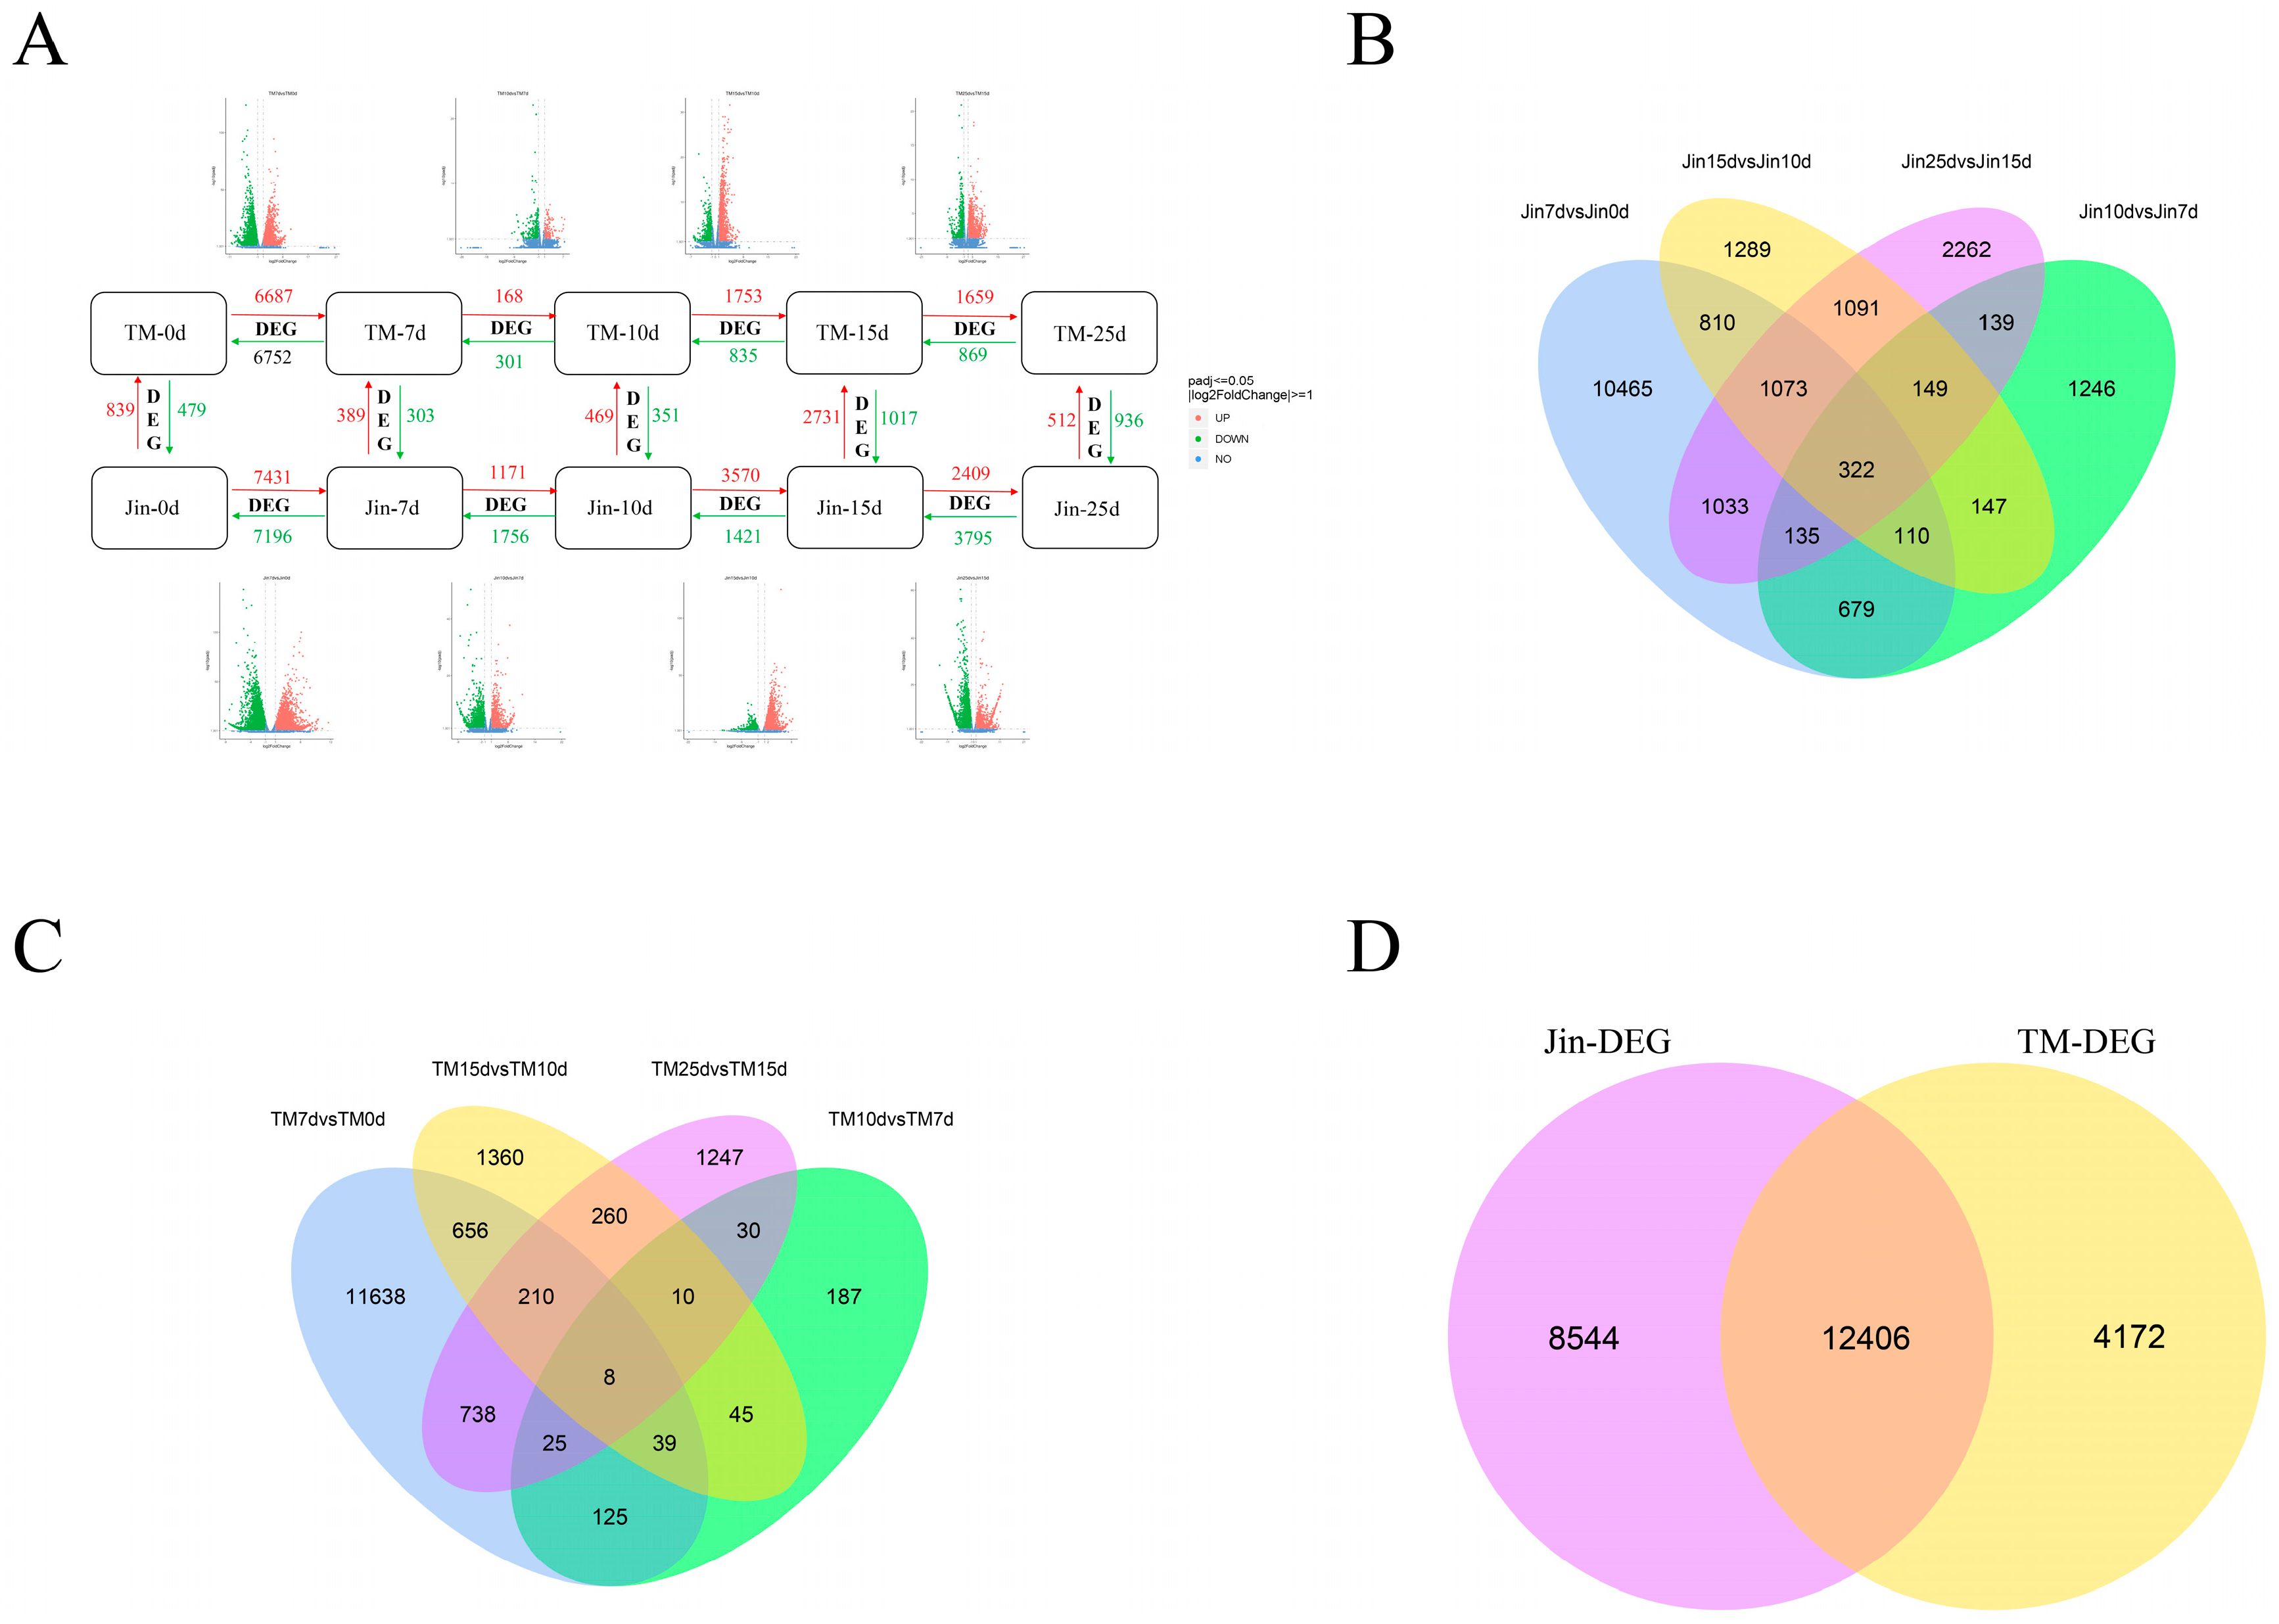
3.3. DEGs Analysis
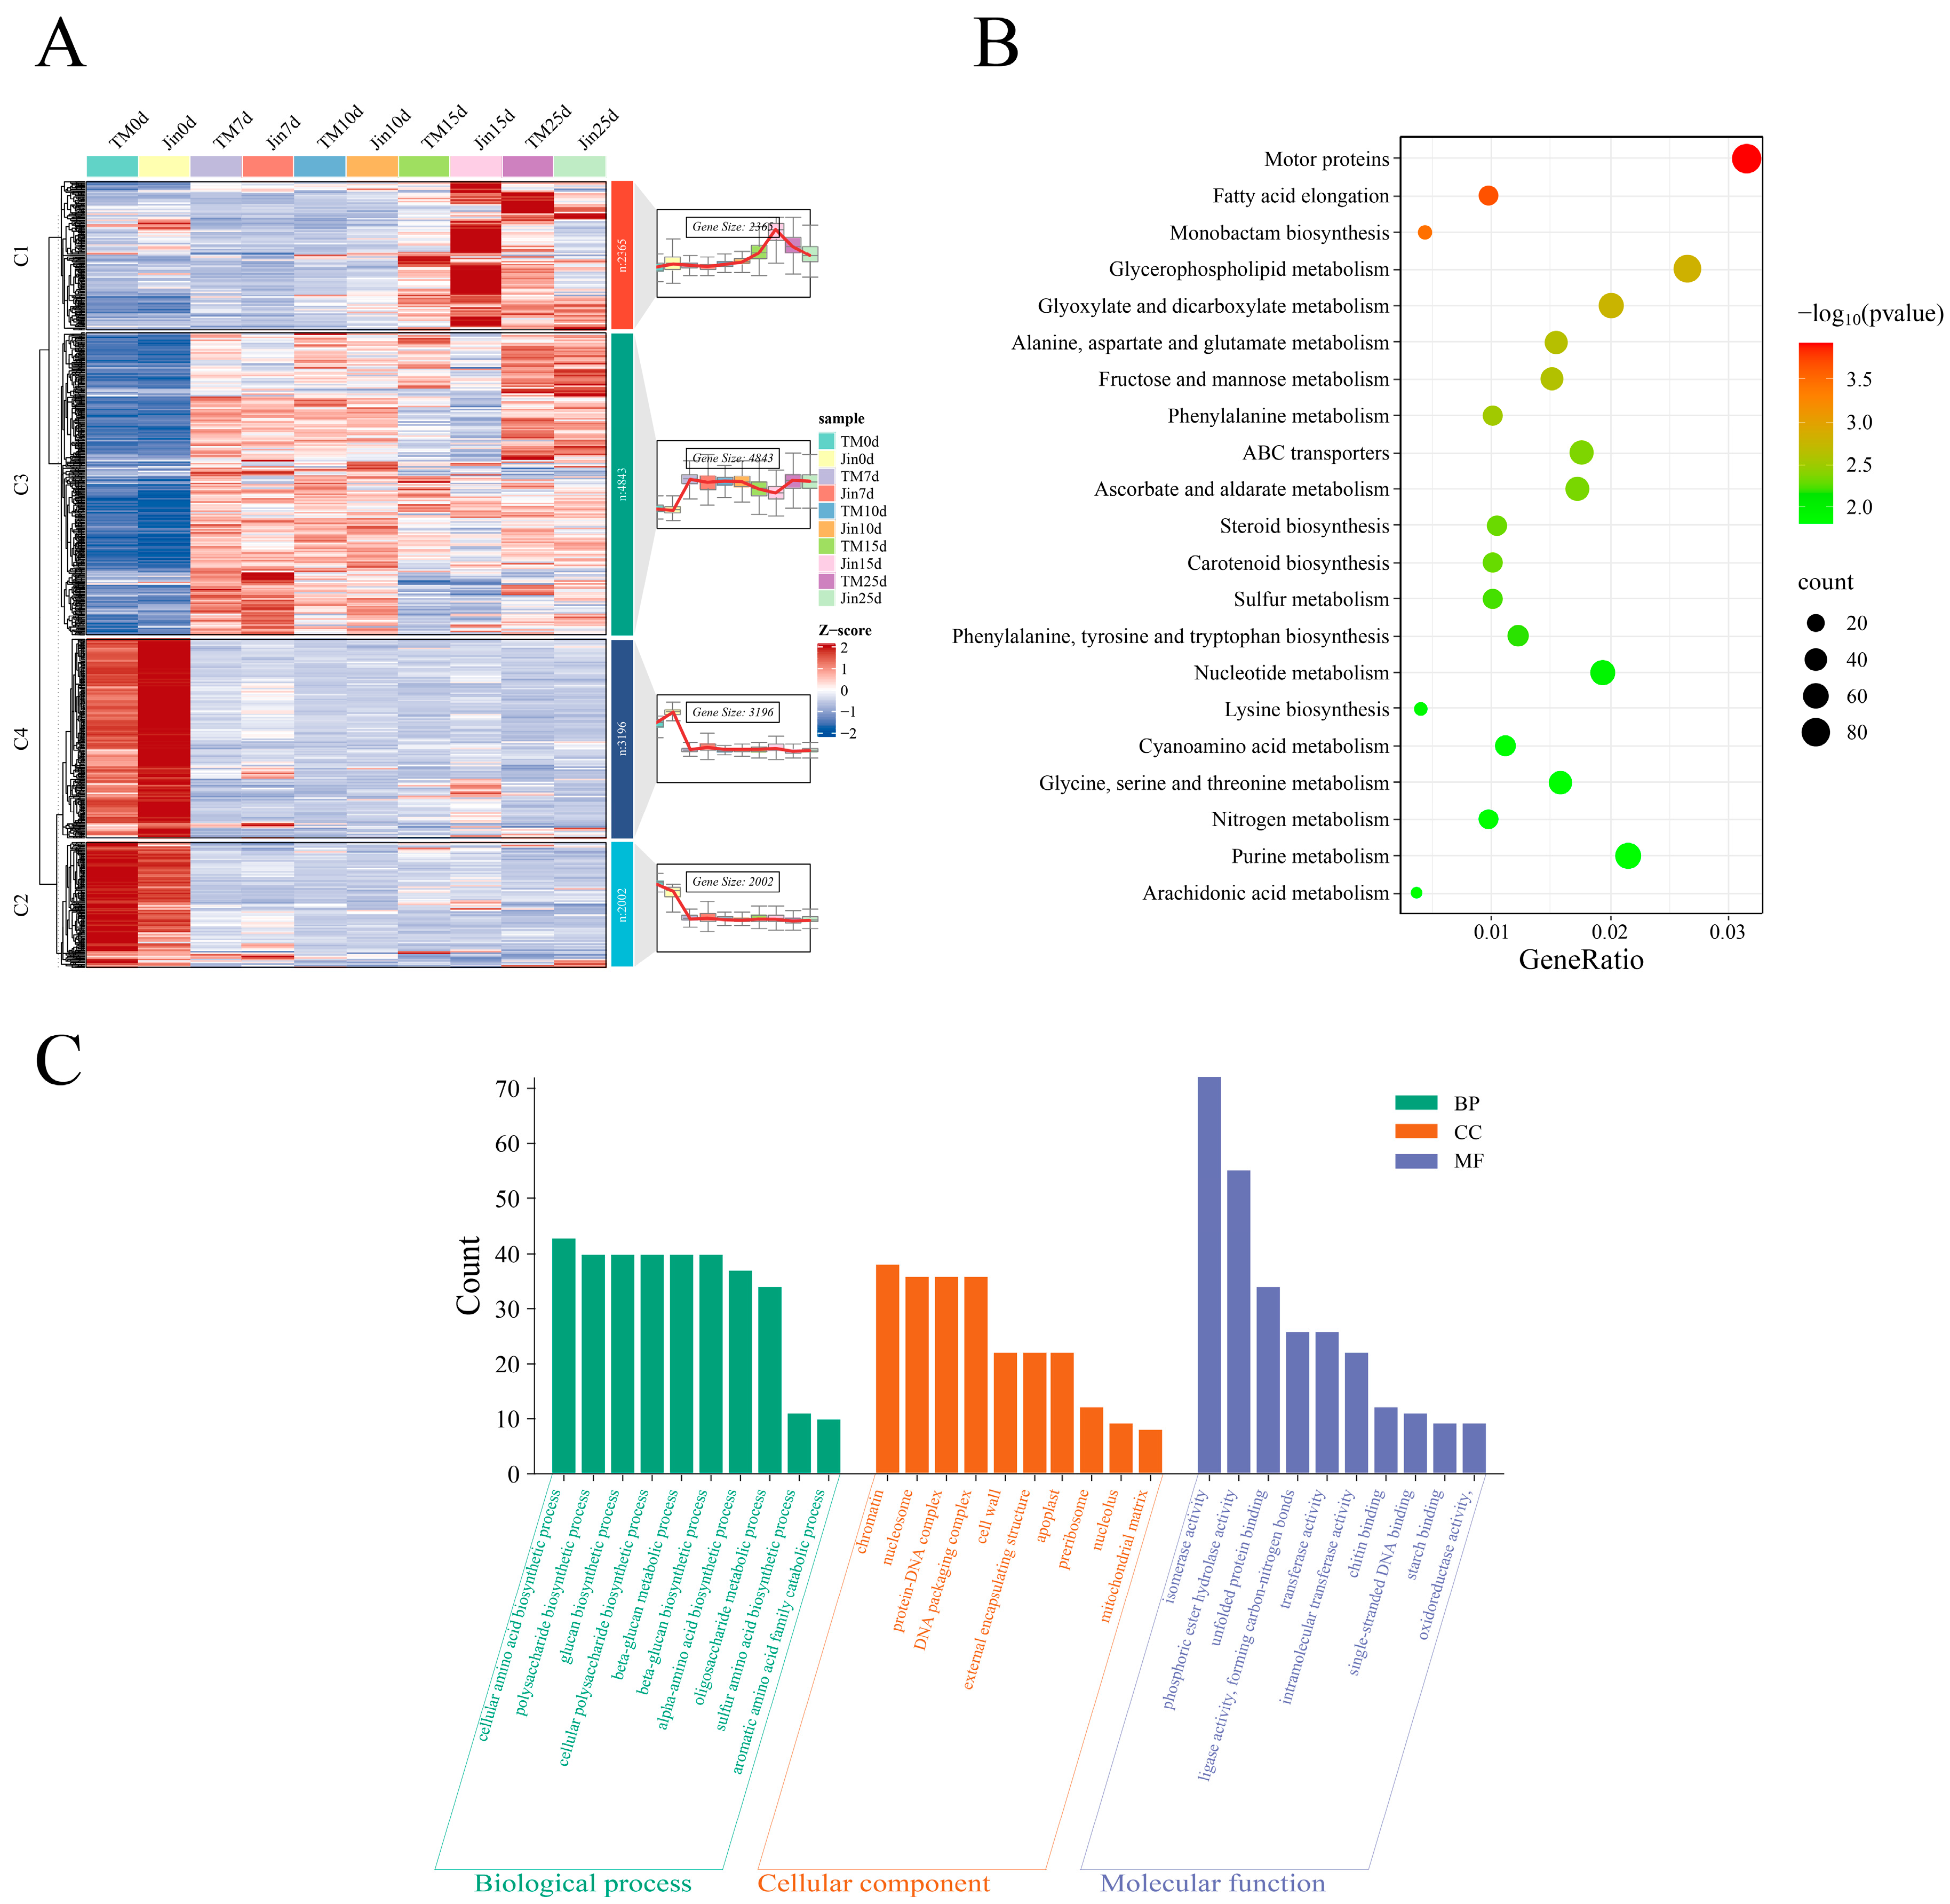
3.4. KEGG and GO Enrichment Analysis of Differentially Expressed Genes Shared by Jin and TM-1
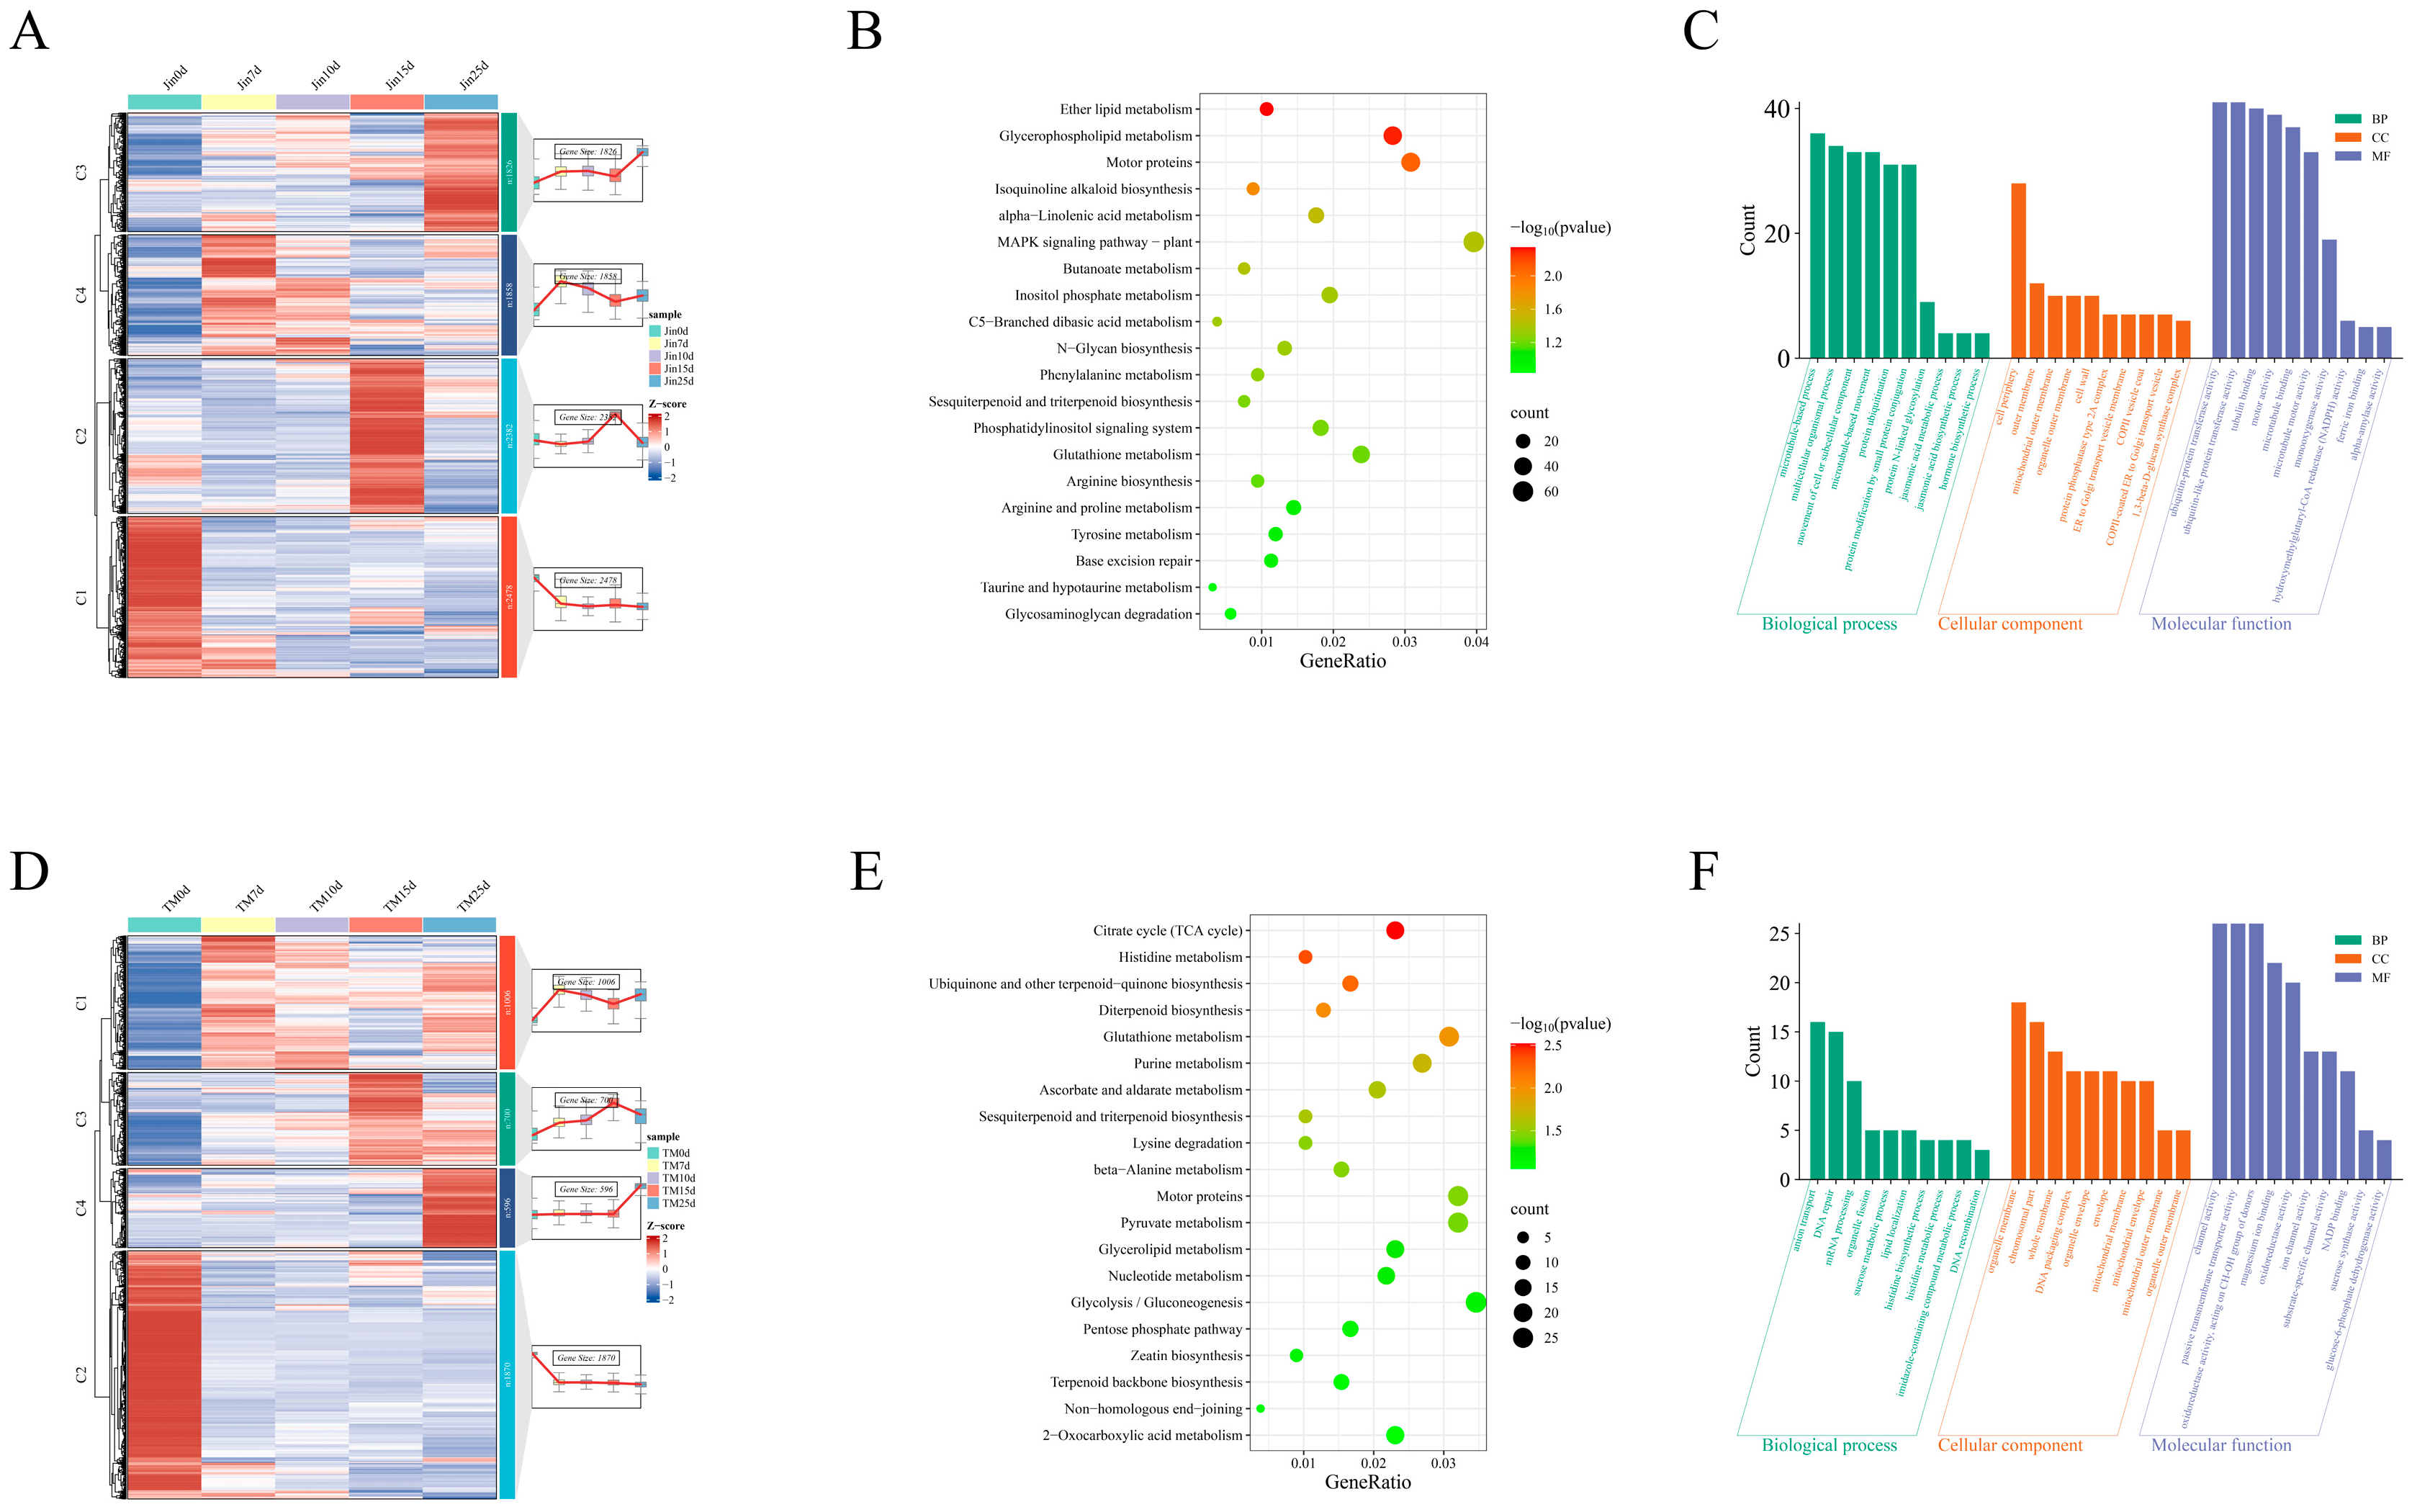
3.5. Jin- and TM-1-Specific DEGs KEGG and GO Enrichment Analysis
3.6. Transcription Factors Analysis
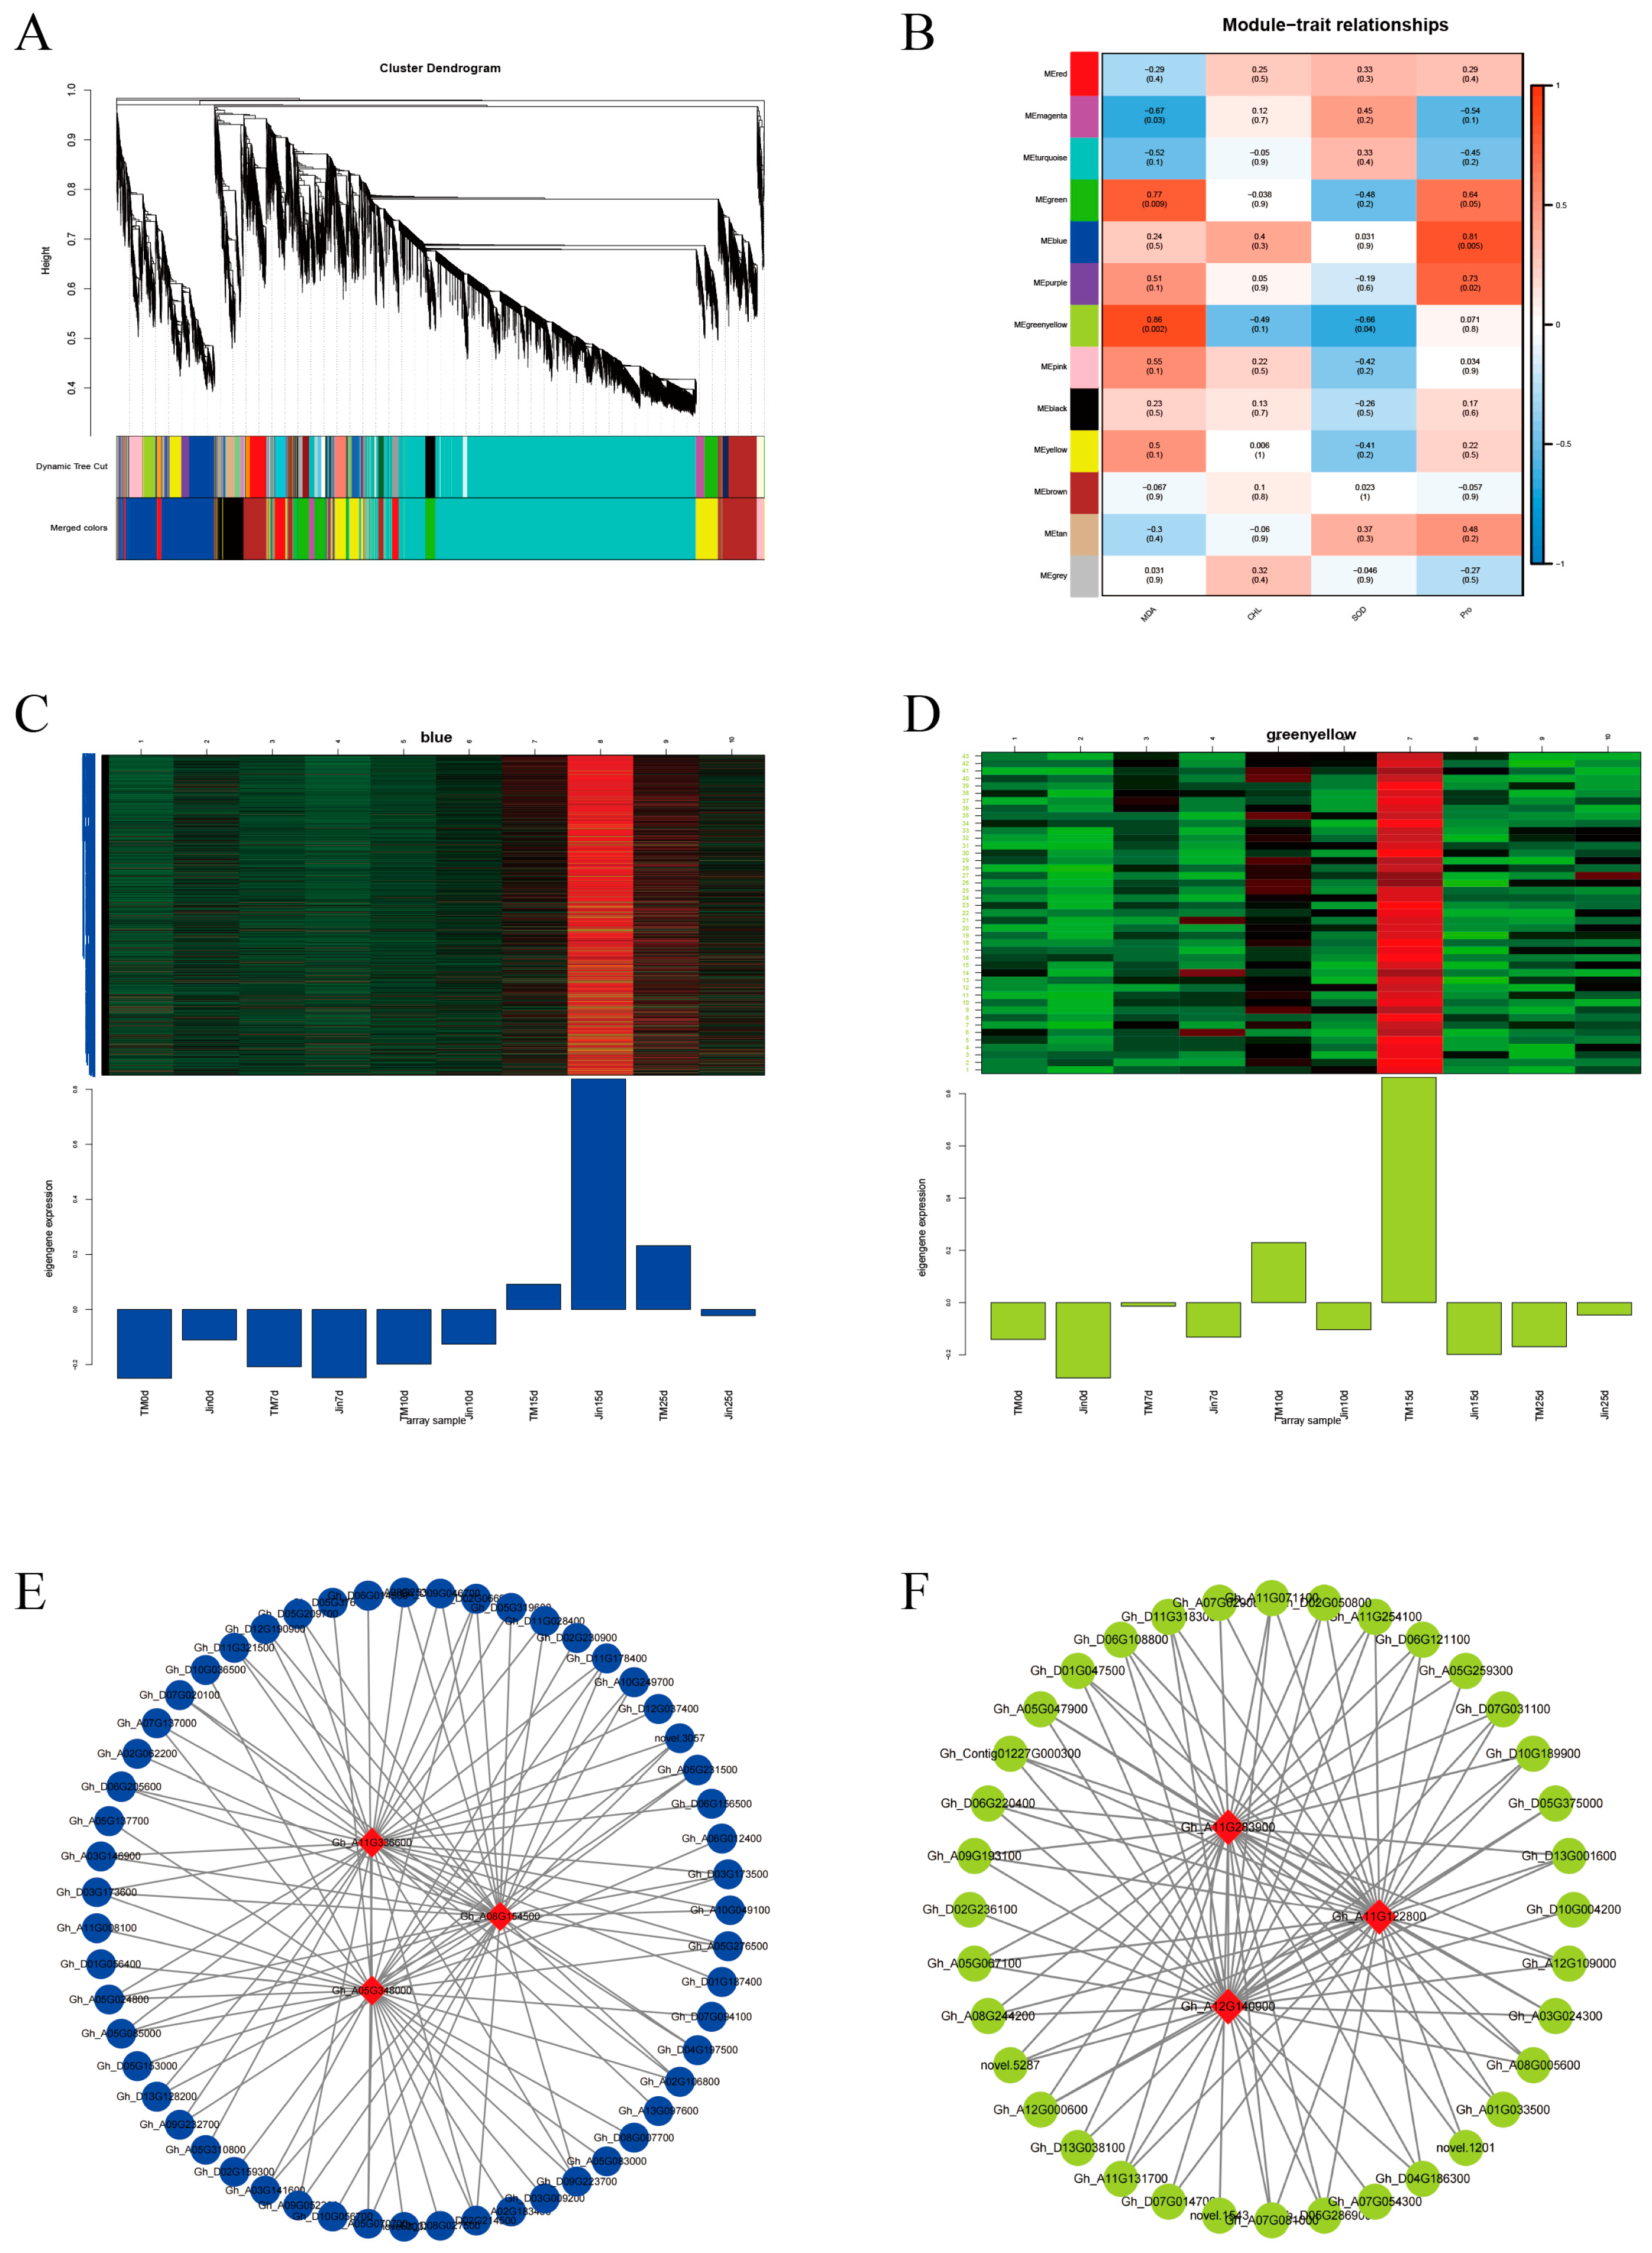
3.7. WGCNA
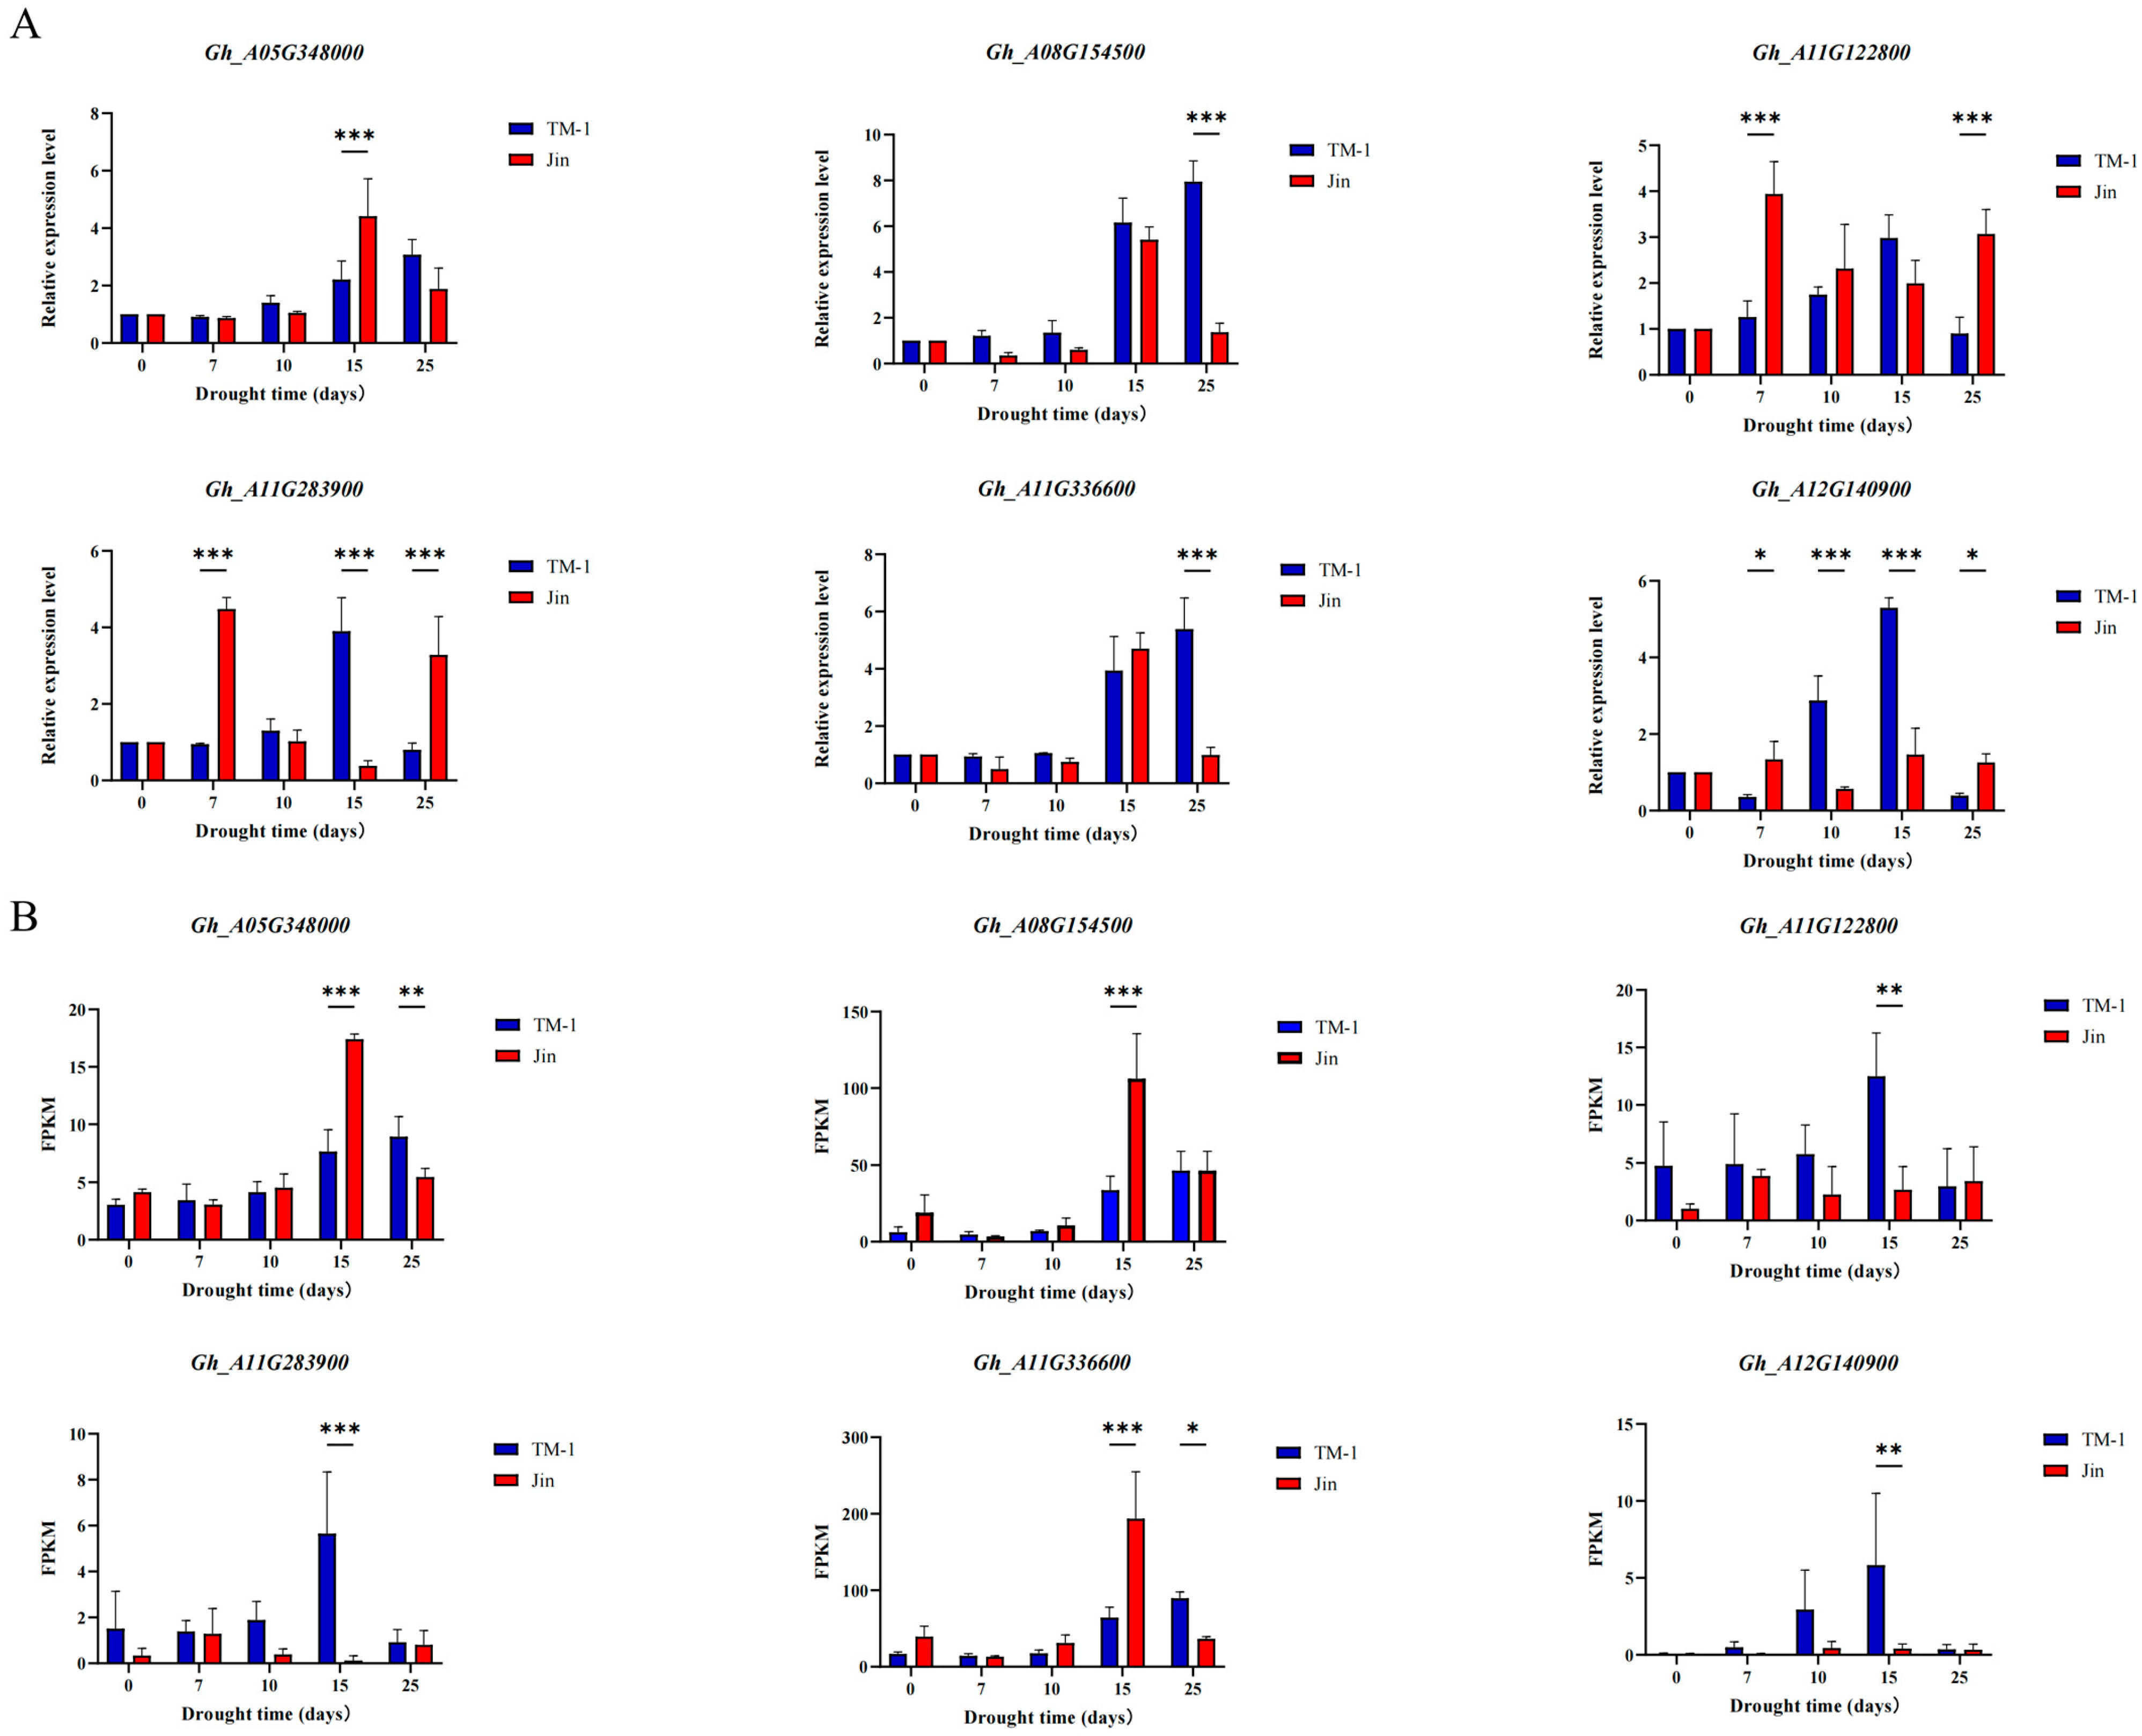
3.8. qRT-PCR
4. Discussion
4.1. Physiological Response and Molecular Regulatory Network Differentiation Between Drought-Tolerant and Drought-Sensitive Materials
4.2. WGCNA of Co-Expressed Modules and Functional Validation of Hub Genes
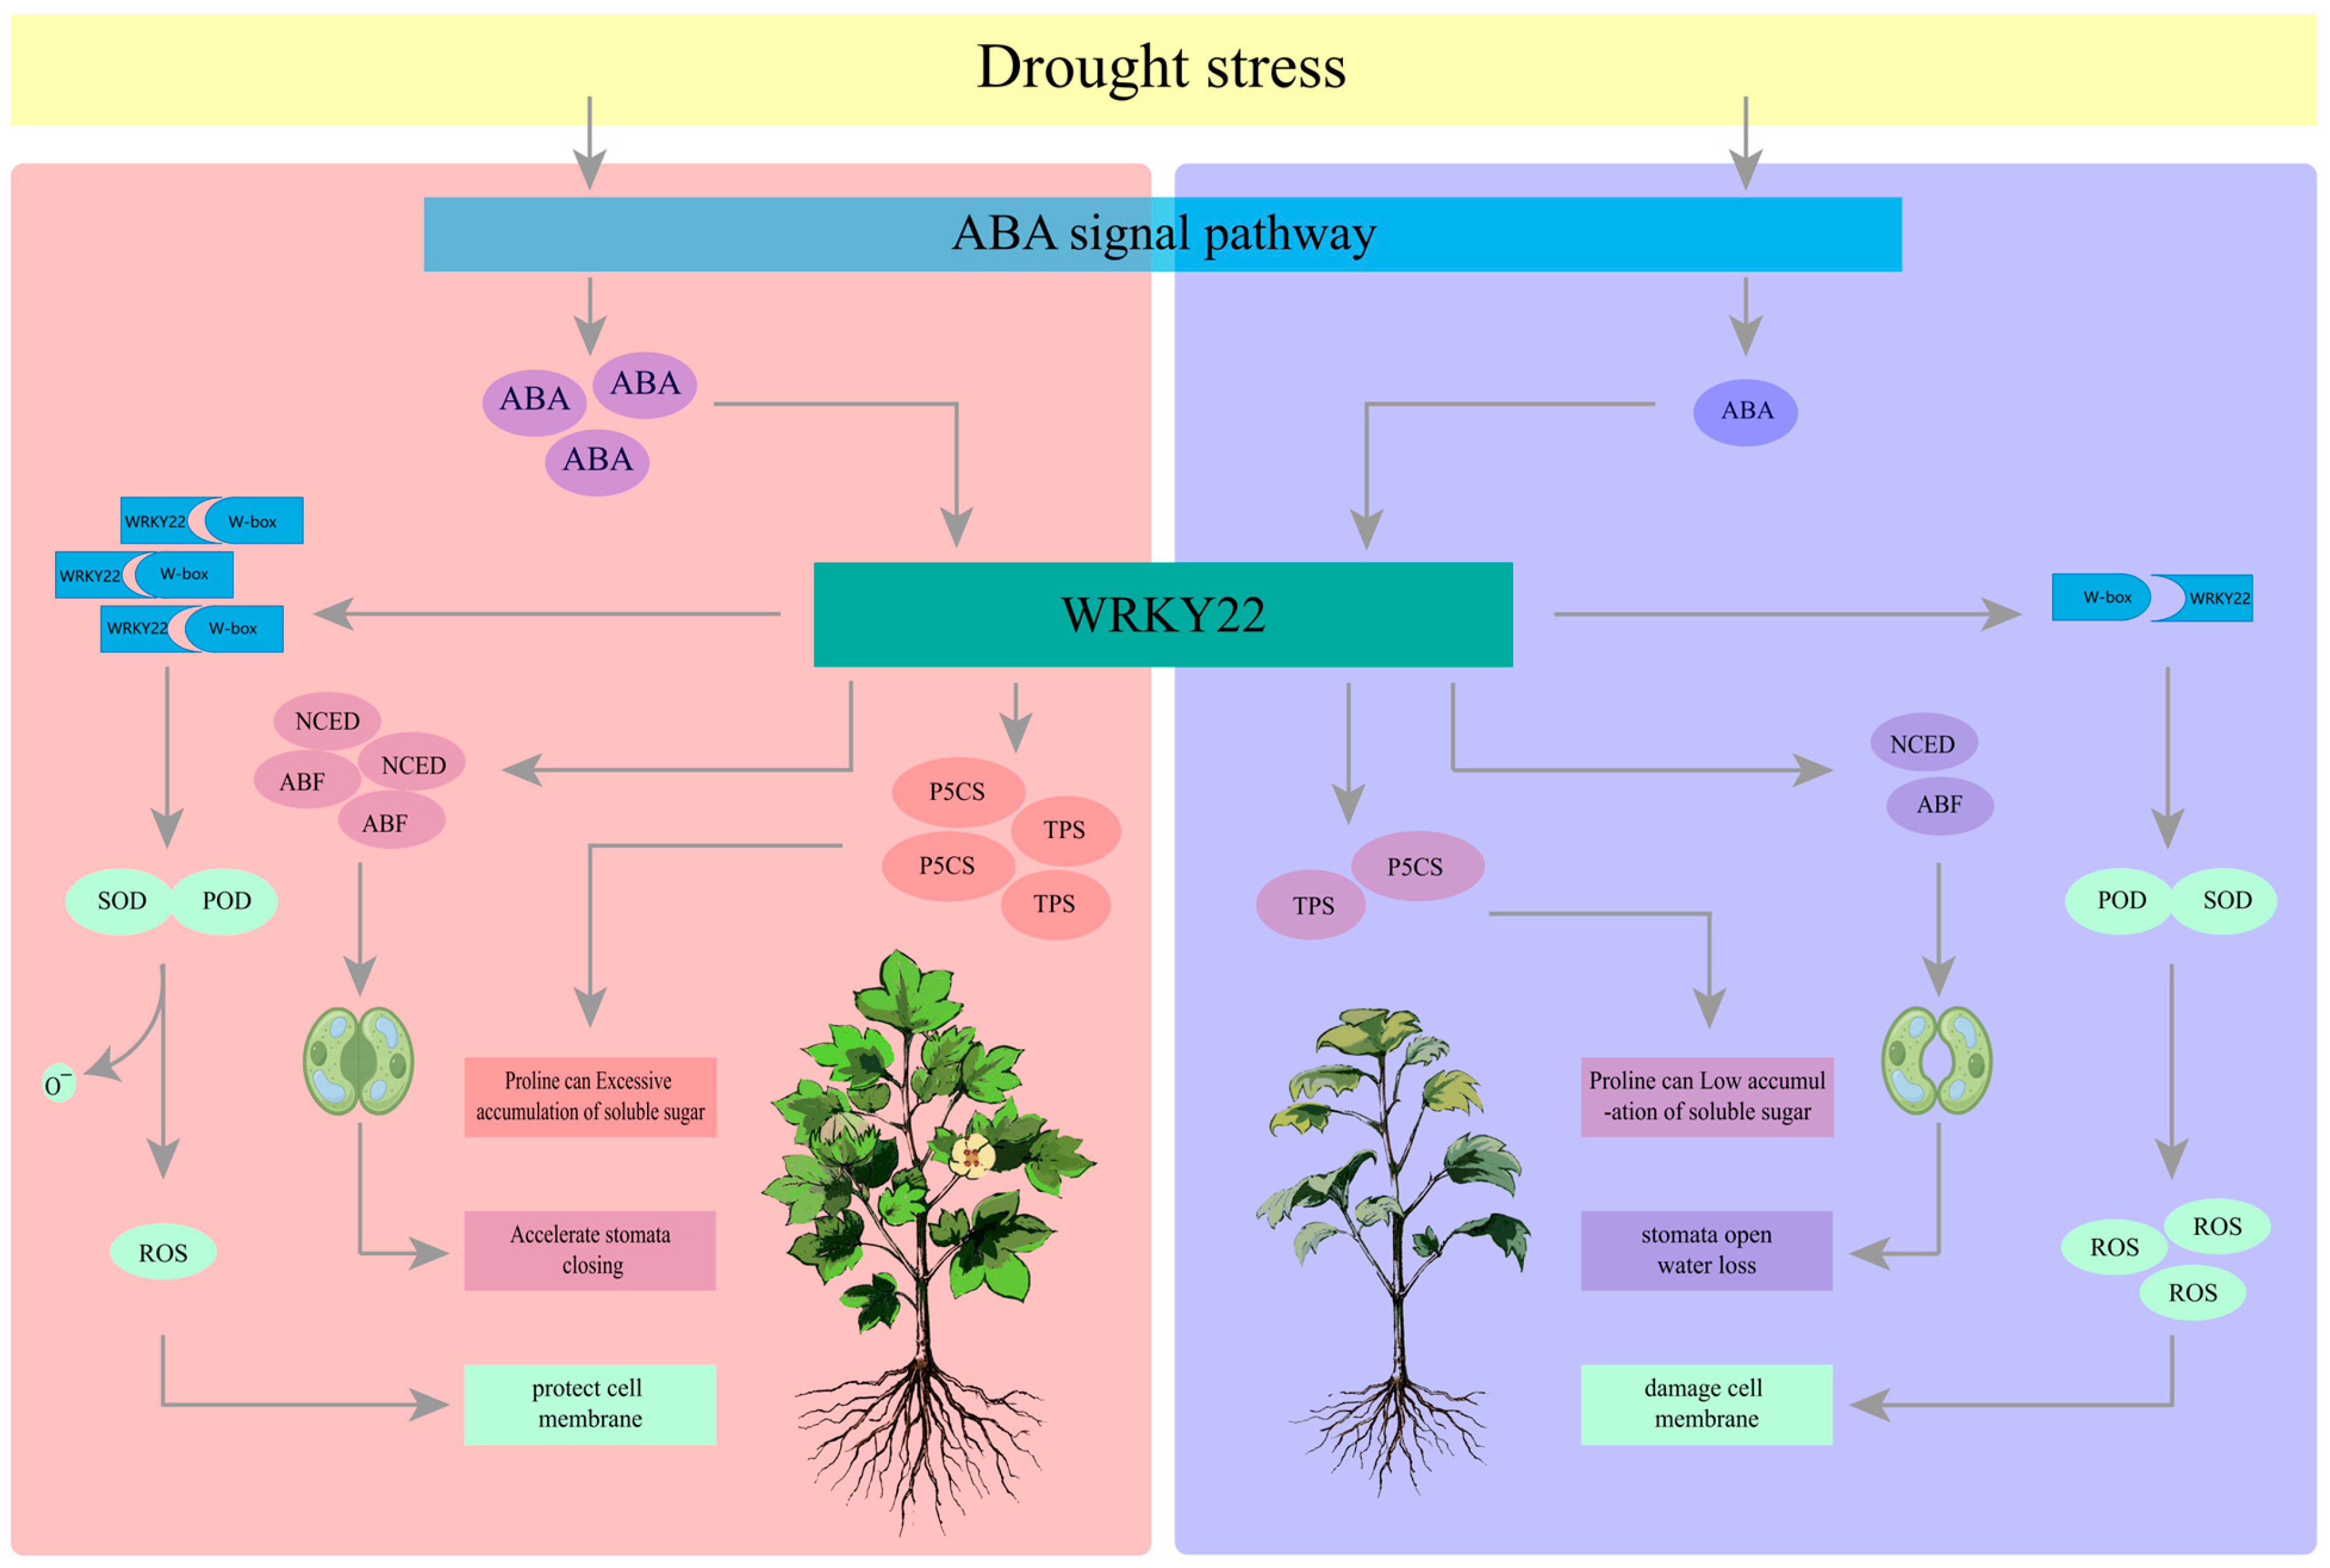
4.3. WRKY22 Enhances Cotton Drought Resistance Through a Multidimensional Regulatory Network
5. Conclusions
Supplementary Materials
Author Contributions
Funding
Data Availability Statement
Conflicts of Interest
References
- Xu, Z.; Yu, J.; Kohel, R.J.; Percy, R.G.; Beavis, W.D.; Main, D.; Yu, J.Z. Distribution and evolution of cotton fiber development genes in the fibreless Gossypium raimondii genome. Genomics 2015, 106, 61–69. [Google Scholar] [CrossRef] [PubMed]
- Huang, G.; Huang, J.-Q.; Chen, X.-Y.; Zhu, Y.-X. Recent advances and future perspectives in cotton research. Annu. Rev. Plant Biol. 2021, 72, 437–462. [Google Scholar] [CrossRef] [PubMed]
- Anwar, M.; Iqbal, M.Z.; Abro, A.A.; Memon, S.; Bhutto, L.A.; Memon, S.A.; Peng, Y. Inter-Specific Hybridization in Cotton (Gossypium hirsutum) for Crop Improvement. Agronomy 2022, 12, 3158. [Google Scholar] [CrossRef]
- Sun, F.; Yang, Y.; Wang, P.; Ma, J.; Du, X. Quantitative trait loci and candidate genes for yield-related traits of upland cotton revealed by genome-wide association analysis under drought conditions. BMC Genom. 2023, 24, 531. [Google Scholar] [CrossRef]
- Meshram, J.H.; Singh, S.B.; Raghavendra, K.; Waghmare, V. Drought stress tolerance in cotton: Progress and perspectives. In Climate Change and Crop Stress; Academic Press: Cambridge, MA, USA, 2022; pp. 135–169. [Google Scholar]
- Ullah, A.; Sun, H.; Yang, X.; Zhang, X. Drought coping strategies in cotton: Increased crop per drop. Plant Biotechnol. J. 2017, 15, 271–284. [Google Scholar] [CrossRef]
- Ul-Allah, S.; Rehman, A.; Hussain, M.; Farooq, M. Fiber yield and quality in cotton under drought: Effects and management. Agric. Water Manag. 2021, 255, 106994. [Google Scholar] [CrossRef]
- Abdelraheem, A.; Adams, N.; Zhang, J. Effects of drought on agronomic and fiber quality in an introgressed backcross inbred line population of Upland cotton under field conditions. Field Crops Res. 2020, 254, 107850. [Google Scholar] [CrossRef]
- Naikwade, P.V. Plant responses to drought stress: Morphological, physiological, molecular approaches, and drought resistance. In Plant Metabolites Under Environmental Stress; Apple Academic Press: Palm Bay, FL, USA, 2023; pp. 149–183. [Google Scholar]
- Impa, S.; Nadaradjan, S.; Jagadish, S. Drought stress induced reactive oxygen species and anti-oxidants in plants. In Abiotic Stress Responses in Plants: Metabolism, Productivity and Sustainability; Springer: New York, NY, USA, 2012; pp. 131–147. [Google Scholar]
- Anjum, S.A.; Xie, X.Y.; Wang, L.C.; Saleem, M.F.; Man, C.; Lei, W. Morphological, physiological and biochemical responses of plants to drought stress. Afr. J. Agric. Res. 2011, 6, 2026–2032. [Google Scholar]
- Yildiz-Aktas, L.; Dagnon, S.; Gurel, A.; Gesheva, E.; Edreva, A. Drought tolerance in cotton: Involvement of non-enzymatic ROS-scavenging compounds. J. Agron. Crop Sci. 2009, 195, 247–253. [Google Scholar] [CrossRef]
- Zulfiqar, F.; Ashraf, M. Proline alleviates abiotic stress induced oxidative stress in plants. J. Plant Growth Regul. 2023, 42, 4629–4651. [Google Scholar] [CrossRef]
- Luo, Q.; Ma, Y.; Xie, H.; Chang, F.; Guan, C.; Yang, B.; Ma, Y. Proline Metabolism in Response to Climate Extremes in Hairgrass. Plants 2024, 13, 1408. [Google Scholar] [CrossRef] [PubMed]
- Gill, S.S.; Anjum, N.A.; Gill, R.; Yadav, S.; Hasanuzzaman, M.; Fujita, M.; Mishra, P.; Sabat, S.C.; Tuteja, N. Superoxide dismutase—Mentor of abiotic stress tolerance in crop plants. Environ. Sci. Pollut. Res. 2015, 22, 10375–10394. [Google Scholar] [CrossRef] [PubMed]
- Hemati, A.; Moghiseh, E.; Amirifar, A.; Mofidi-Chelan, M.; Asgari Lajayer, B. Physiological effects of drought stress in plants. In Plant Stress Mitigators: Action and Application; Springer: Singapore, 2022; pp. 113–124. [Google Scholar]
- Zheng, J.; Zhang, Z.; Liang, Y.; Gong, Z.; Zhang, N.; Ditta, A.; Sang, Z.; Wang, J.; Li, X. Whole transcriptome sequencing reveals drought resistance-related genes in upland cotton. Genes 2022, 13, 1159. [Google Scholar] [CrossRef] [PubMed]
- Liu, R.; Shen, Y.; Wang, M.; Liu, R.; Cui, Z.; Li, P.; Wu, Q.; Shen, Q.; Chen, J.; Zhang, S.; et al. GhMYB102 promotes drought resistance by regulating drought-responsive genes and ABA biosynthesis in cotton (Gossypium hirsutum L.). Plant Sci. 2023, 329, 111608. [Google Scholar] [CrossRef]
- Doncheva, N.T.; Morris, J.H.; Gorodkin, J.; Jensen, L.J. Cytoscape StringApp: Network Analysis and Visualization of Proteomics Data. J. Proteome Res. 2019, 18, 623–632. [Google Scholar] [CrossRef]
- Yu, J.; Jung, S.; Cheng, C.H.; Lee, T.; Zheng, P.; Buble, K.; Crabb, J.; Humann, J.; Hough, H.; Jones, D.; et al. CottonGen: The Community Database for Cotton Genomics, Genetics, and Breeding Research. Plants 2021, 10, 2805. [Google Scholar] [CrossRef]
- Kim, D.; Langmead, B.; Salzberg, S.L. HISAT: A fast spliced aligner with low memory requirements. Nat. Methods 2015, 12, 357–360. [Google Scholar] [CrossRef]
- Liao, Y.; Smyth, G.K.; Shi, W. featureCounts: An efficient general purpose program for assigning sequence reads to genomic features. Bioinformatics 2014, 30, 923–930. [Google Scholar] [CrossRef]
- Love, M.I.; Huber, W.; Anders, S. Moderated estimation of fold change and dispersion for RNA-seq data with DESeq2. Genome Biol. 2014, 15, 550. [Google Scholar] [CrossRef]
- Robinson, M.D.; McCarthy, D.J.; Smyth, G.K. edgeR: A Bioconductor package for differential expression analysis of digital gene expression data. Bioinformatics 2010, 26, 139–140. [Google Scholar] [CrossRef]
- Benjamini, Y.; Hochberg, Y. Controlling the False Discovery Rate: A Practical and Powerful Approach to Multiple Testing. J. R. Stat. Soc. Ser. B Methodol. 1995, 57, 289–300. [Google Scholar] [CrossRef]
- Yu, G.; Wang, L.G.; Han, Y.; He, Q.Y. clusterProfiler: An R package for comparing biological themes among gene clusters. Omics 2012, 16, 284–287. [Google Scholar] [CrossRef] [PubMed]
- Wang, M.; Wang, Q.; Zhang, B. Evaluation and selection of reliable reference genes for gene expression under abiotic stress in cotton (Gossypium hirsutum L.). Gene 2013, 530, 44–50. [Google Scholar] [CrossRef]
- Swift, M.L. GraphPad Prism, Data Analysis, and Scientific Graphing. J. Chem. Inf. Comput. Sci. 1997, 37, 411–412. [Google Scholar] [CrossRef]
- Yang, P.; Azher Nawaz, M.; Li, F.; Bai, L.; Li, J. Brassinosteroids regulate antioxidant system and protect chloroplast ultrastructure of autotoxicity-stressed cucumber (Cucumis sativus L.) seedlings. Agronomy 2019, 9, 265. [Google Scholar] [CrossRef]
- Wang, Z.; Li, G.; Sun, H.; Ma, L.; Guo, Y.; Zhao, Z.; Gao, H.; Mei, L. Effects of drought stress on photosynthesis and photosynthetic electron transport chain in young apple tree leaves. Biol. Open 2018, 7, bio035279. [Google Scholar] [CrossRef]
- Wu, S.; Tian, J.; Ren, T.; Wang, Y. Osmotic adjustment and antioxidant system regulated by nitrogen deposition improve photosynthetic and growth performance and alleviate oxidative damage in dwarf bamboo under drought stress. Front. Plant Sci. 2022, 13, 819071. [Google Scholar] [CrossRef]
- Shang, C.; Liu, X.; Chen, G.; Li, G.; Hu, S.; Zheng, H.; Ge, L.; Long, Y.; Wang, Q.; Hu, X. SlWRKY81 regulates Spd synthesis and Na/K homeostasis through interaction with SlJAZ1 mediated JA pathway to improve tomato saline-alkali resistance. Plant J. 2024, 118, 1774–1792. [Google Scholar] [CrossRef]
- Xiong, H.; He, H.; Chang, Y.; Miao, B.; Liu, Z.; Wang, Q.; Dong, F.; Xiong, L. Multiple roles of NAC transcription factors in plant development and stress responses. J. Integr. Plant Biol. 2025, 67, 510–538. [Google Scholar] [CrossRef]
- Wang, Z.; Peng, Z.; Khan, S.; Qayyum, A.; Rehman, A.; Du, X. Unveiling the power of MYB transcription factors: Master regulators of multi-stress responses and development in cotton. Int. J. Biol. Macromol. 2024, 276, 133885. [Google Scholar] [CrossRef]
- Yang, L.; Jin, Y.; Huang, W.; Sun, Q.; Liu, F.; Huang, X. Full-length transcriptome sequences of ephemeral plant Arabidopsis pumila provides insight into gene expression dynamics during continuous salt stress. BMC Genom. 2018, 19, 717. [Google Scholar] [CrossRef] [PubMed]
- Chintakovid, N.; Maipoka, M.; Phaonakrop, N.; Mickelbart, M.V.; Roytrakul, S.; Chadchawan, S. Proteomic analysis of drought-responsive proteins in rice reveals photosynthesis-related adaptations to drought stress. Acta Physiol. Plant. 2017, 39, 240. [Google Scholar] [CrossRef]
- Alqurashi, M.; Chiapello, M.; Bianchet, C.; Paolocci, F.; Lilley, K.S.; Gehring, C. Early responses to severe drought stress in the Arabidopsis thaliana cell suspension culture proteome. Proteomes 2018, 6, 38. [Google Scholar] [CrossRef]
- ElSayed, A.; Rafudeen, M.; Golldack, D. Physiological aspects of raffinose family oligosaccharides in plants: Protection against abiotic stress. Plant Biol. 2014, 16, 1–8. [Google Scholar] [CrossRef] [PubMed]
- Iturriaga, G.; Cushman, M.A.F.; Cushman, J.C. An EST catalogue from the resurrection plant Selaginella lepidophylla reveals abiotic stress-adaptive genes. Plant Sci. 2006, 170, 1173–1184. [Google Scholar] [CrossRef]
- Michaeloudes, C.; Mercado, N.; Clarke, C.; Bhavsar, P.K.; Adcock, I.M.; Barnes, P.J.; Chung, K.F. Bromodomain and extraterminal proteins suppress NF-E2-related factor 2-mediated antioxidant gene expression. J. Immunol. 2014, 192, 4913–4920. [Google Scholar] [CrossRef]
- Campo, S.; Baldrich, P.; Messeguer, J.; Lalanne, E.; Coca, M.; San Segundo, B. Overexpression of a calcium-dependent protein kinase confers salt and drought tolerance in rice by preventing membrane lipid peroxidation. Plant Physiol. 2014, 165, 688–704. [Google Scholar] [CrossRef]
- Delauney, A.J.; Verma, D.P.S. Proline biosynthesis and osmoregulation in plants. Plant J. 1993, 4, 215–223. [Google Scholar] [CrossRef]
- Tenhaken, R. Cell wall remodeling under abiotic stress. Front. Plant Sci. 2015, 5, 771. [Google Scholar] [CrossRef]
- Gu, L.; Ma, Q.; Zhang, C.; Wang, C.; Wei, H.; Wang, H.; Yu, S. The cotton GhWRKY91 transcription factor mediates leaf senescence and responses to drought stress in transgenic Arabidopsis thaliana. Front. Plant Sci. 2019, 10, 1352. [Google Scholar] [CrossRef]
- Lin, L.; Wu, J.; Jiang, M.; Wang, Y. Plant mitogen-activated protein kinase cascades in environmental stresses. Int. J. Mol. Sci. 2021, 22, 1543. [Google Scholar] [CrossRef] [PubMed]
- Jiang, J.; Ma, S.; Ye, N.; Jiang, M.; Cao, J.; Zhang, J. WRKY transcription factors in plant responses to stresses. J. Integr. Plant Biol. 2017, 59, 86–101. [Google Scholar] [CrossRef] [PubMed]
- Bai, Y.; Zhang, T.; Zheng, X.; Li, B.; Qi, X.; Xu, Y.; Li, L.; Liang, C. Overexpression of a WRKY transcription factor McWRKY57-like from Mentha canadensis L. enhances drought tolerance in transgenic Arabidopsis. BMC Plant Biol. 2023, 23, 216. [Google Scholar] [CrossRef] [PubMed]
- Zhao, P.; Zhao, M.; Gao, X.; Shan, Y.; Li, F.; Tian, X.; Li, Z. GhWRKY1bD improves drought tolerance by co-regulation of ABA, ROS, and proline homeostasis in cotton (Gossypium hirsutum). Ind. Crops Prod. 2024, 220, 119179. [Google Scholar] [CrossRef]


Disclaimer/Publisher’s Note: The statements, opinions and data contained in all publications are solely those of the individual author(s) and contributor(s) and not of MDPI and/or the editor(s). MDPI and/or the editor(s) disclaim responsibility for any injury to people or property resulting from any ideas, methods, instructions or products referred to in the content. |
© 2025 by the authors. Licensee MDPI, Basel, Switzerland. This article is an open access article distributed under the terms and conditions of the Creative Commons Attribution (CC BY) license (https://creativecommons.org/licenses/by/4.0/).
Share and Cite
Zhang, H.; Zhang, W.; Tang, Y.; Guo, Y.; Wang, J.; Gao, W.; Zeng, Q.; Chen, Q.; Chen, Q. Mining Key Drought-Resistant Genes of Upland Cotton Based on RNA-Seq and WGCNA Analysis. Plants 2025, 14, 1407. https://doi.org/10.3390/plants14101407
Zhang H, Zhang W, Tang Y, Guo Y, Wang J, Gao W, Zeng Q, Chen Q, Chen Q. Mining Key Drought-Resistant Genes of Upland Cotton Based on RNA-Seq and WGCNA Analysis. Plants. 2025; 14(10):1407. https://doi.org/10.3390/plants14101407
Chicago/Turabian StyleZhang, Hu, Wen Zhang, Yu Tang, Yuantao Guo, Jinsheng Wang, Wenju Gao, Qingtao Zeng, Quanjia Chen, and Qin Chen. 2025. "Mining Key Drought-Resistant Genes of Upland Cotton Based on RNA-Seq and WGCNA Analysis" Plants 14, no. 10: 1407. https://doi.org/10.3390/plants14101407
APA StyleZhang, H., Zhang, W., Tang, Y., Guo, Y., Wang, J., Gao, W., Zeng, Q., Chen, Q., & Chen, Q. (2025). Mining Key Drought-Resistant Genes of Upland Cotton Based on RNA-Seq and WGCNA Analysis. Plants, 14(10), 1407. https://doi.org/10.3390/plants14101407