Article

Genome-Wide Investigation of Class III Peroxidase Genes in Brassica napus Reveals Their Responsiveness to Abiotic Stresses

1
School of Breeding and Multiplication (Sanya Institute of Breeding and Multiplication), College of Tropical Agriculture and Forestry, Hainan University, Sanya 572025, China
2
Department of Botany, University of Agriculture Faisalabad, Faisalabad 38000, Pakistan
*
Authors to whom correspondence should be addressed.
Plants 2024, 13(7), 942; https://doi.org/10.3390/plants13070942
Submission received: 2 November 2023 / Revised: 26 December 2023 / Accepted: 5 January 2024 / Published: 25 March 2024
(This article belongs to the Special Issue Recent Advances in Horticultural Plant Genomics)

Abstract

:
Brassica napus (B. napus) is susceptible to multiple abiotic stresses that can affect plant growth and development, ultimately reducing crop yields. In the past, many genes that provide tolerance to abiotic stresses have been identified and characterized. Peroxidase (POD) proteins, members of the oxidoreductase enzyme family, play a critical role in protecting plants against abiotic stresses. This study demonstrated a comprehensive investigation of the POD gene family in B. napus. As a result, a total of 109 POD genes were identified across the 19 chromosomes and classified into five distinct subgroups. Further, 44 duplicate events were identified; of these, two gene pairs were tandem and 42 were segmental. Synteny analysis revealed that segmental duplication was more prominent than tandem duplication among POD genes. Expression pattern analysis based on the RNA-seq data of B. napus indicated that BnPOD genes were expressed differently in various tissues; most of them were expressed in roots rather than in other tissues. To validate these findings, we performed RT-qPCR analysis on ten genes; these genes showed various expression levels under abiotic stresses. Our findings not only furnish valuable insights into the evolutionary dynamics of the BnPOD gene family but also serve as a foundation for subsequent investigations into the functional roles of POD genes in B. napus.

1. Introduction

Peroxidases are a large family of ubiquitous isozymes that play an important role in plant growth, development, and defense mechanisms [1] and have been categorized into hemoglobin peroxidases and non-hemoglobin peroxidases [2,3]. Non-hemoglobin peroxidases include (i) class I peroxidases, which are mainly involved in oxidative stress tolerance [4]; (ii) class II peroxidases, which are found in fungi and play an essential role in lignin metabolism [5]; and (iii) class III peroxidases, which are a plant-specific ubiquitous multigenic family and play pivotal roles in plant growth, development, and stress responses [6,7]. POD proteins have highly conserved amino acid residues essential for glycosylation and cysteine–histidine catalytic reactions [7] and are involved in different physiological and developmental processes, including cell wall metabolism, lignification, auxin metabolism, and tolerance and defense against biotic and abiotic stresses [8,9,10].
Previously, many functional studies have identified the role of PODs in the tolerance of crop plants to different environmental stresses [11,12,13]. For example, the overexpression of AtPrx64 is involved in aluminum tolerance in Nicotiana tabacum [11], whereas the overexpression of the cold-inducible peroxidase gene (RCI3) in Arabidopsis shows increases in dehydration and salt tolerances [12]. Similarly, the CrPrx and CrPrx1 genes from Catharanthus roseus are involved in germination and exhibit better cold tolerance in tobacco [13], while a mutant of TaPRX-2A in Triticum aestivum is involved in salinity tolerance [14]. In RNA-seq and microarrays, the expression profiles of several peroxidase (PRX) genes showed differential expressions under different stresses in wheat and maize, indicating the role of peroxidase in response to abiotic stresses [15,16]. These findings suggested that plant PODs are anticipated to be involved in abiotic stresses in multiple crop plants.
In recent years, genome-scale bioinformatics analyses of multigenic families, like peroxidases, have been greatly helpful in understanding the physiological roles and characteristics of these gene families. The POD gene family has been reported in numerous plant species, including Arabidopsis thaliana [17], Manihot esculenta [18], Pyrus pyrifolia [19], Zea mays [16], Oryza sativa [7], Citrus sinensis [20], Vitis vinifera [21], Glycine max [22], and Capsicum annuum L. [23]. Genetic evidence has indicated that POD serves as a family of enzymes responsive to abiotic stresses in diverse plant species [24].
Brassica napus is the second most abundant oilseed crop worldwide, contributing an estimated 12% of the world’s vegetable oil production [25], and this production is influenced by environmental stresses [26]. For example, seed survival and germination were reduced owing to heat stress or high temperatures, while low growth and development were reportedly caused by drought stress, which ultimately led to lower crop production. In previous studies, the POD gene family was involved in stress tolerance in different crops, including rice, maize, sorghum, and soybeans. Therefore, the present study selected the POD gene family for genome-wide identification in B. napus, using multi-omics analysis for the characterization, classification, structural diversification, genomic distribution, and identification of POD genes in response to multiple abiotic stresses.

2. Results

2.1. Characterization of BnPOD Gene Family

A total of 109 genes were identified in the B. napus genome, using Arabidopsis POD proteins as query sequences after removing redundant sequences. All the identified POD proteins were renamed based on their physical position in the B. napus genome ZA11 viz. BnAPOD01_BnCPOD109. The predicted protein length and MW of the POD genes in B. napus varies from 279 aa/31.8118 kDa to 568 aa/62.91441 kDa. The theoretical pI ranged from 4.4 (BnCPOD57) to 10.11 (BnAPOD13), while GRAVY ranged from −0.355 (BnAPOD18) to 0.244 (BnCPOD59). Moreover, the in silico subcellular localization of all the BnPOD-predicted proteins revealed a wide range of cellular compartmentalization, including extracellular spaces, chloroplasts, and mitochondria (Table S1). Detailed information about the predicted protein length, pI, MW, chromosomal location, and other related information is shown in Table S1.

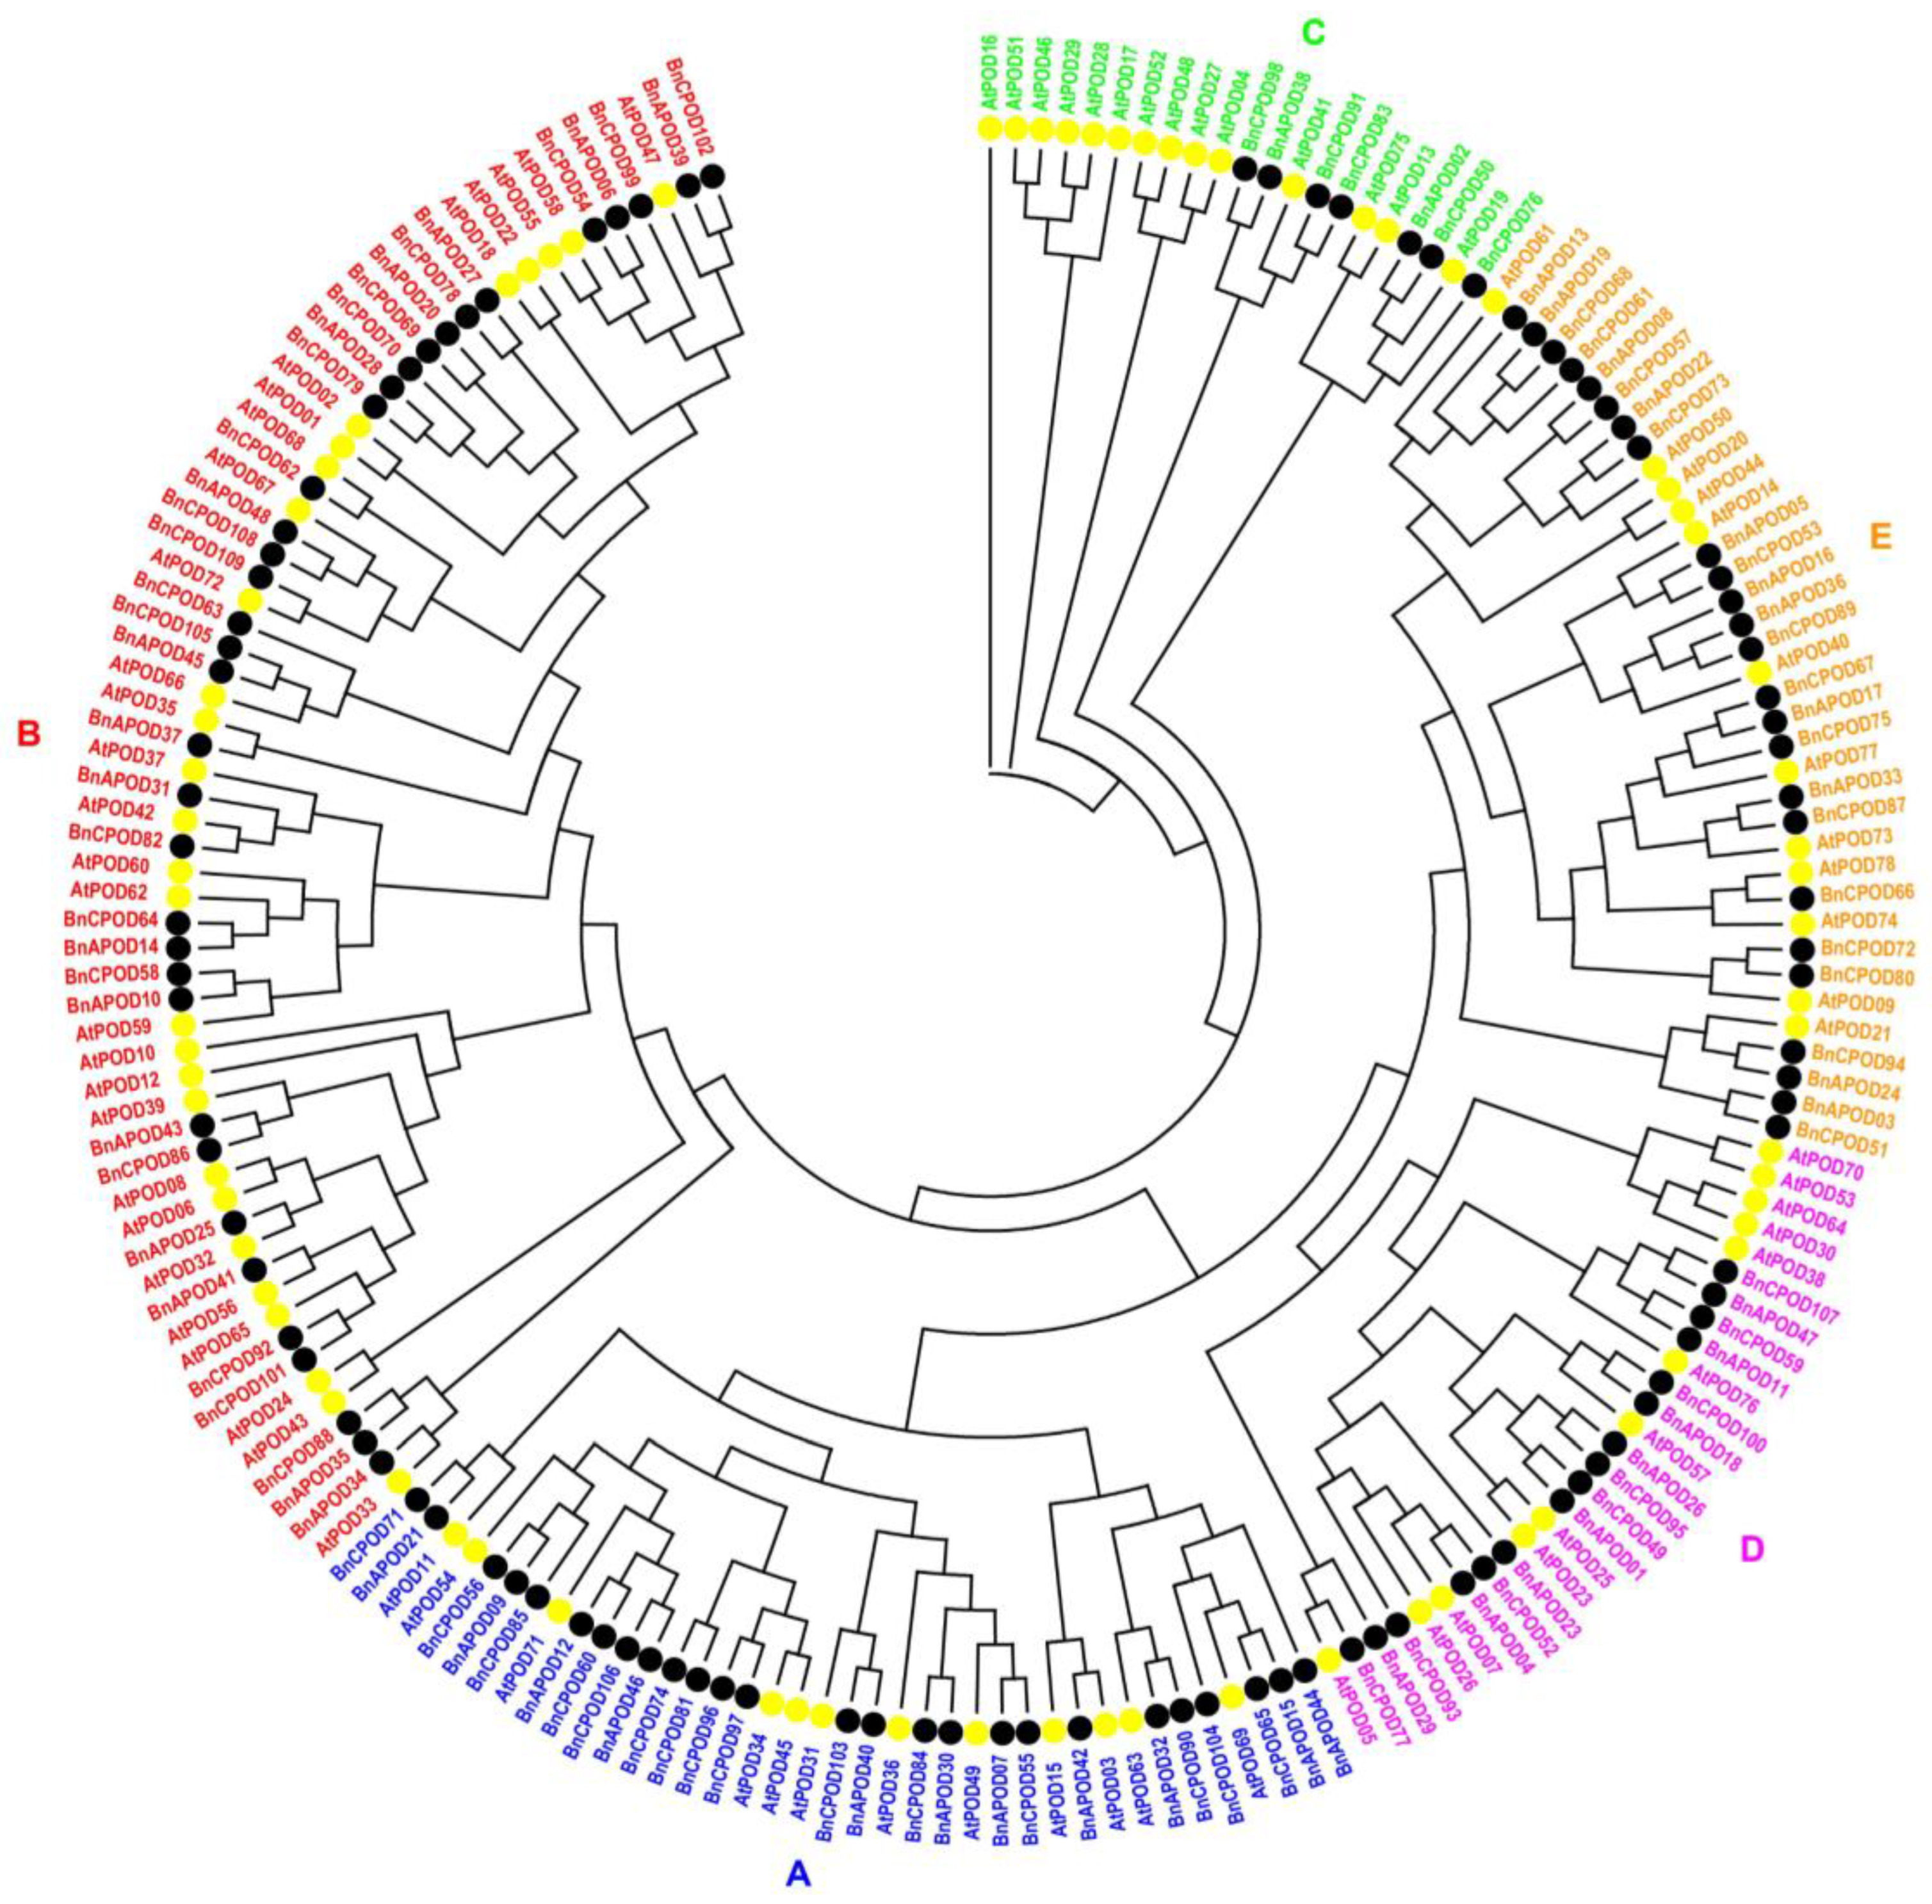
2.2. Phylogeny of POD Genes in B. napus

To determine the homology and similarity among the BnPOD proteins and with those in Arabidopsis, a phylogenetic tree was generated with a bootstrap set at 1000 replicates. The phylogenetic analyses showed that all the PODs were clustered into five phylogenetic subclades, namely from A to E (Figure 1), based on the gene structure. The large subclades, A and B, had 62 (35 BnPODs and 27 AtPODs) and 38 (26 BnPODs and 12 AtPODs) PODs, respectively, whereas 37 and 28 PODs were found in subclades E and D, respectively. Similarly, 21 PODs, including 7 BnPODs and 14 AtPODs, were found in subclade C (Figure 1). These findings suggested the diversification of POD proteins in B. napus.

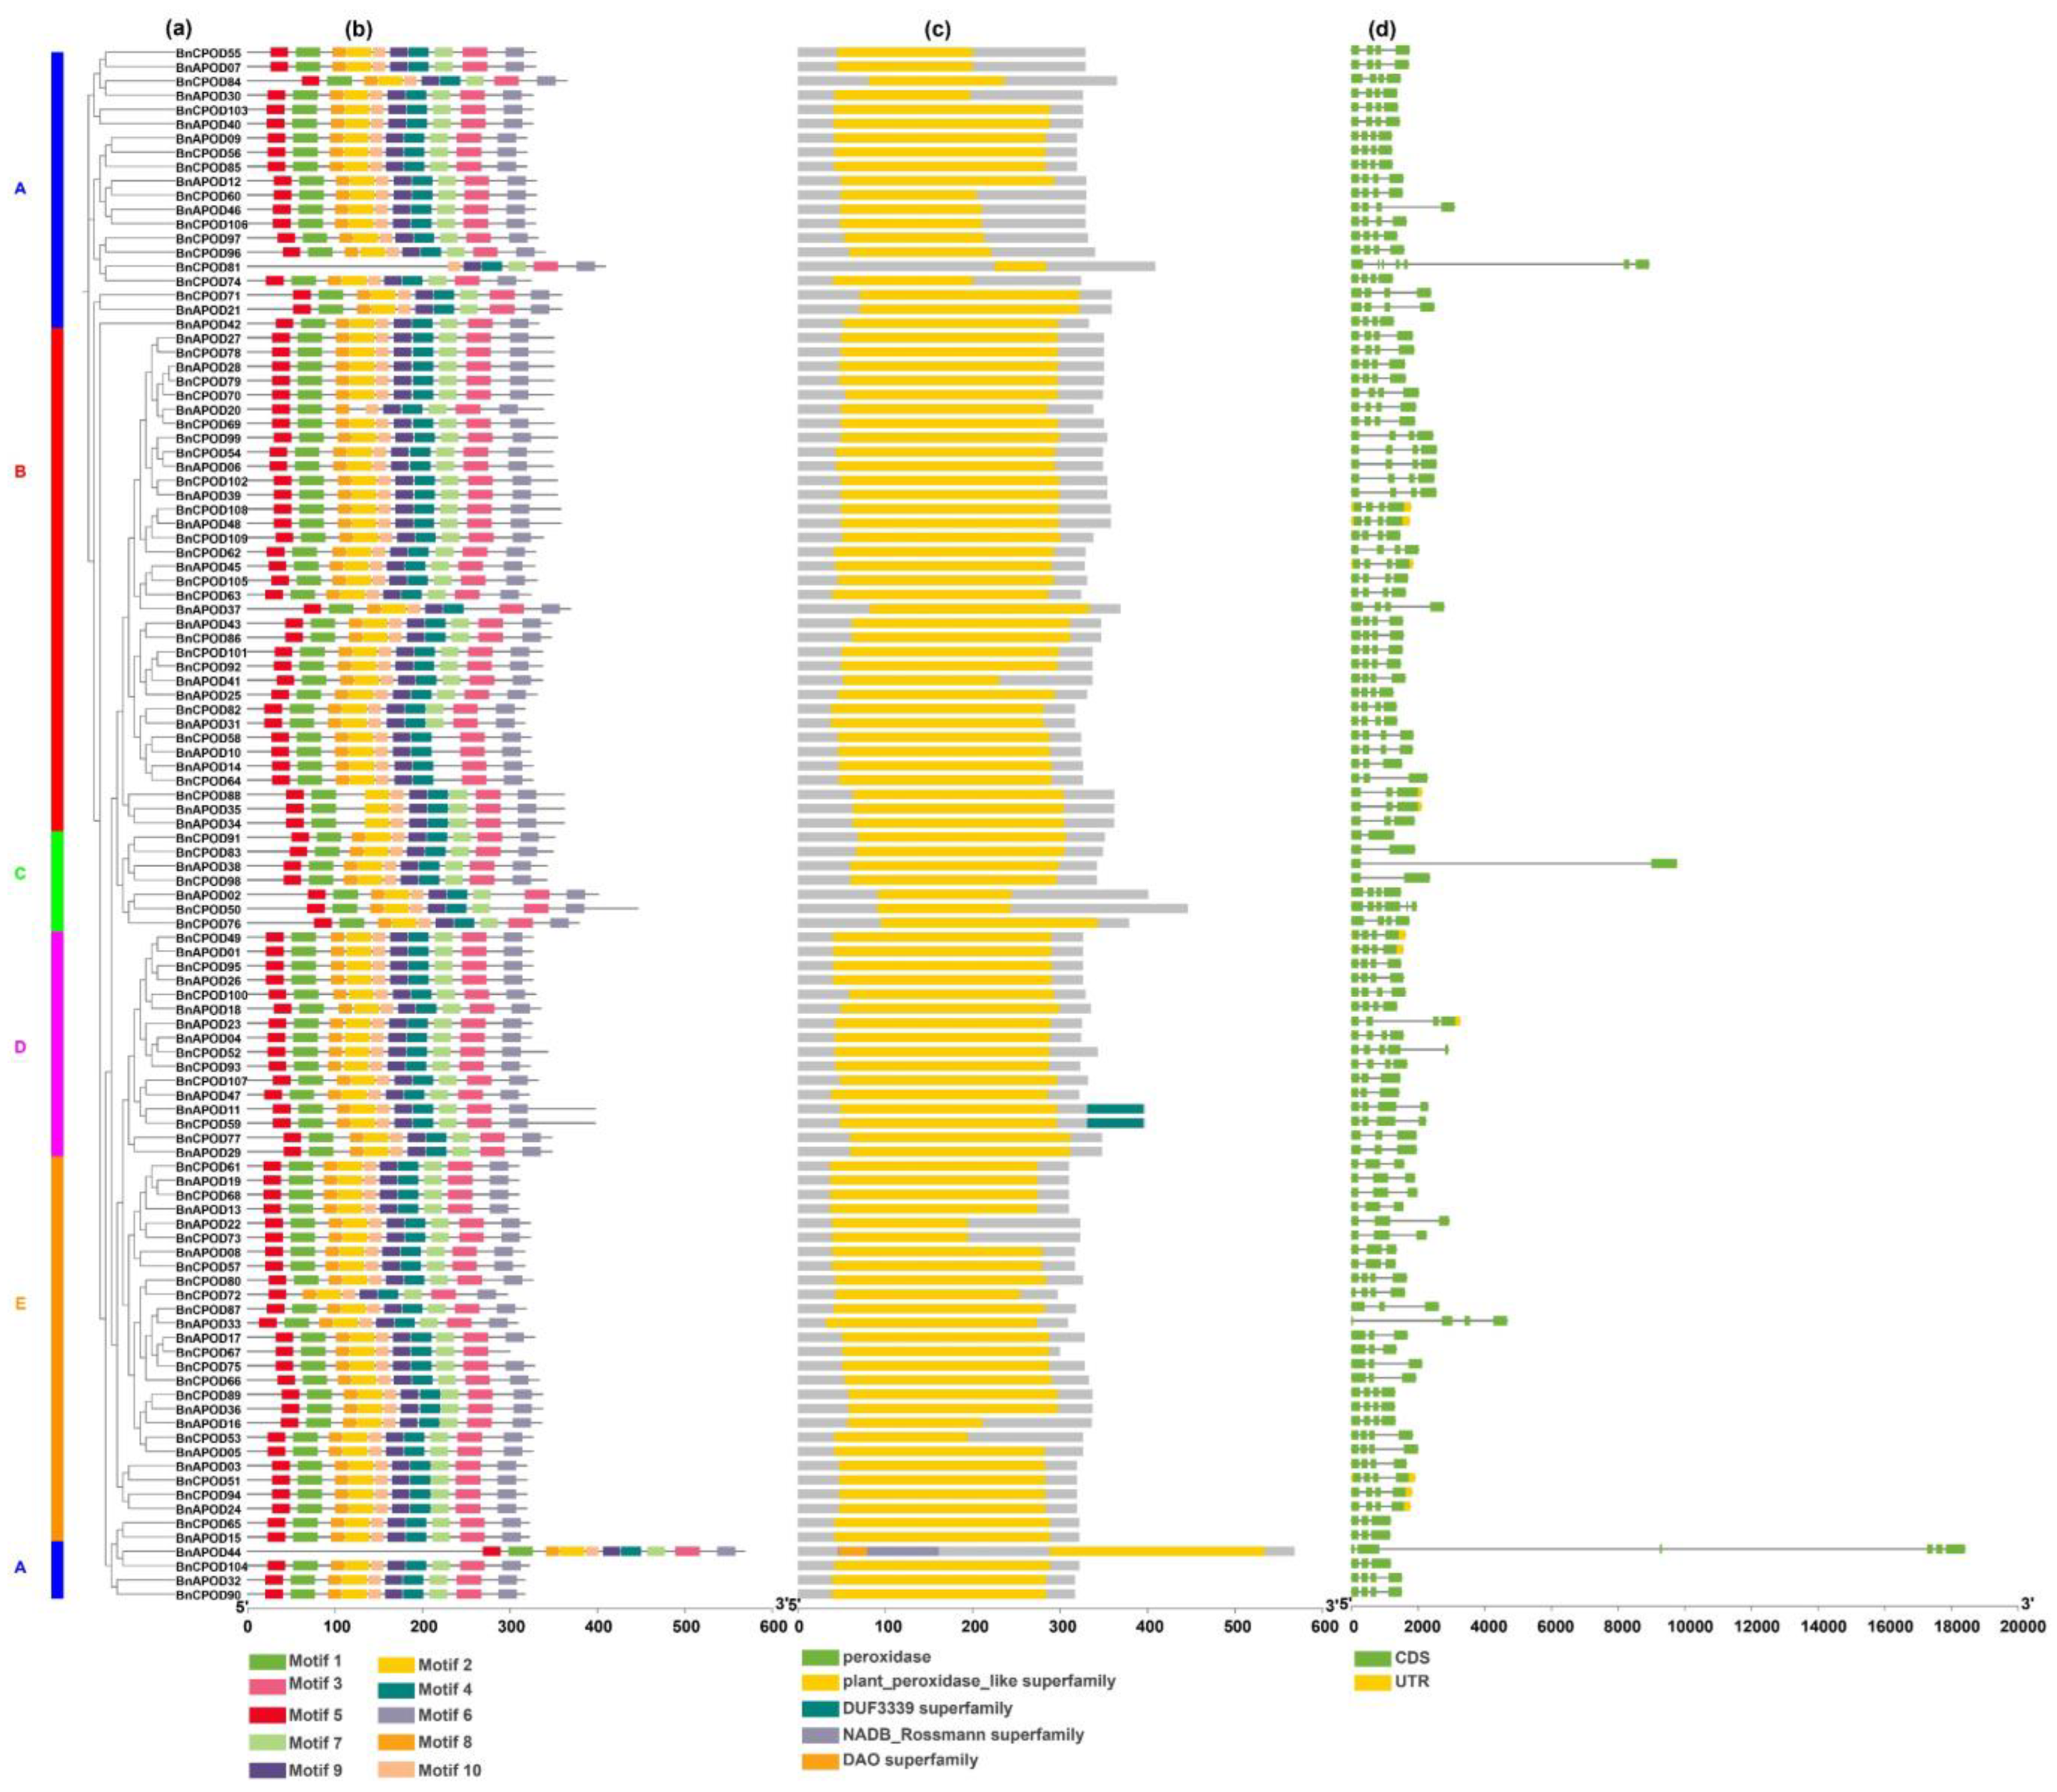
2.3. Gene Structural Analysis of BnPOD Proteins

For this purpose, we used all the identified BnPOD genes for the detection of the exon–intron organization and conserved protein domains (Figure 2d). The exon–intron analysis revealed that the number of exons in BnPODs ranged from 2 to 7 among all the phylogenetic clades. For example, BnCPOD81 had seven exons in clade A, while BnAPOD14, BnAPOD15, BnCPOD57, and BnCPOD65 had three exons (Figure 2d). Similarly, BnAPOD33 and BnCPOD80 had four exons in clades B and E, whereas BnAPOD38, BnCPOD83, BnCPOD91, and BnCPOD98 had two exons, but BnCPOD50 had six exons in clade C. Generally, POD genes in the same subgroup show similar exon–intron features, providing evidence of their phylogenetic relationship (Figure 2d).
Furthermore, motif analysis was performed using the MEME database in accordance with the phylogenetic relationship. As a result, BnPODs that clustered in the same clade shared common motif compositions, indicating functional similarity among the members of the same BnPOD subclade. The InterProScan annotation of the MEME motif analyses revealed that eight motifs (motifs 1–4, 6, 7, 9, and 10) were noted as POD protein motifs, which are characteristic features of the peroxidase gene family. At least six motifs (1–4 and 7–10) were annotated as Heme peroxidases and were found in 95% of the sequences (Table 1 and Figure 2b). The cis-regulatory elements are involved in gene expression regulation. We used 2 kb long promoter sequences of all the BnPODs to scan the different types of regulatory elements, using the PlantCARE database.
All the identified promoters were classified into two categories: (i) hormone-responsive and (ii) stress-responsive elements. Among the hormone-responsive elements, we identified ABRE (abscisic-acid-responsive element), the CGTCA/TGACG motif (methyl-jasmonate-responsive element), the TGA element (auxin-responsive element), and the TCA element (salicylic-acid-responsive element) (Figure 3 and Table S2). Similarly, among the stress-related responsive elements were LTR (low-temperature-responsive element), G-box (pathogen-inducible element/positive regulator of senescence), the WUN motif (wound-responsive element), MBS (MYB binding site in drought inducibility), TC-rich repeats (defense and stress responses), and STRE (stress-responsive element) (Figure 3 and Table S2). These findings indicate the diverse roles of class III peroxidase genes based on their gene structure.

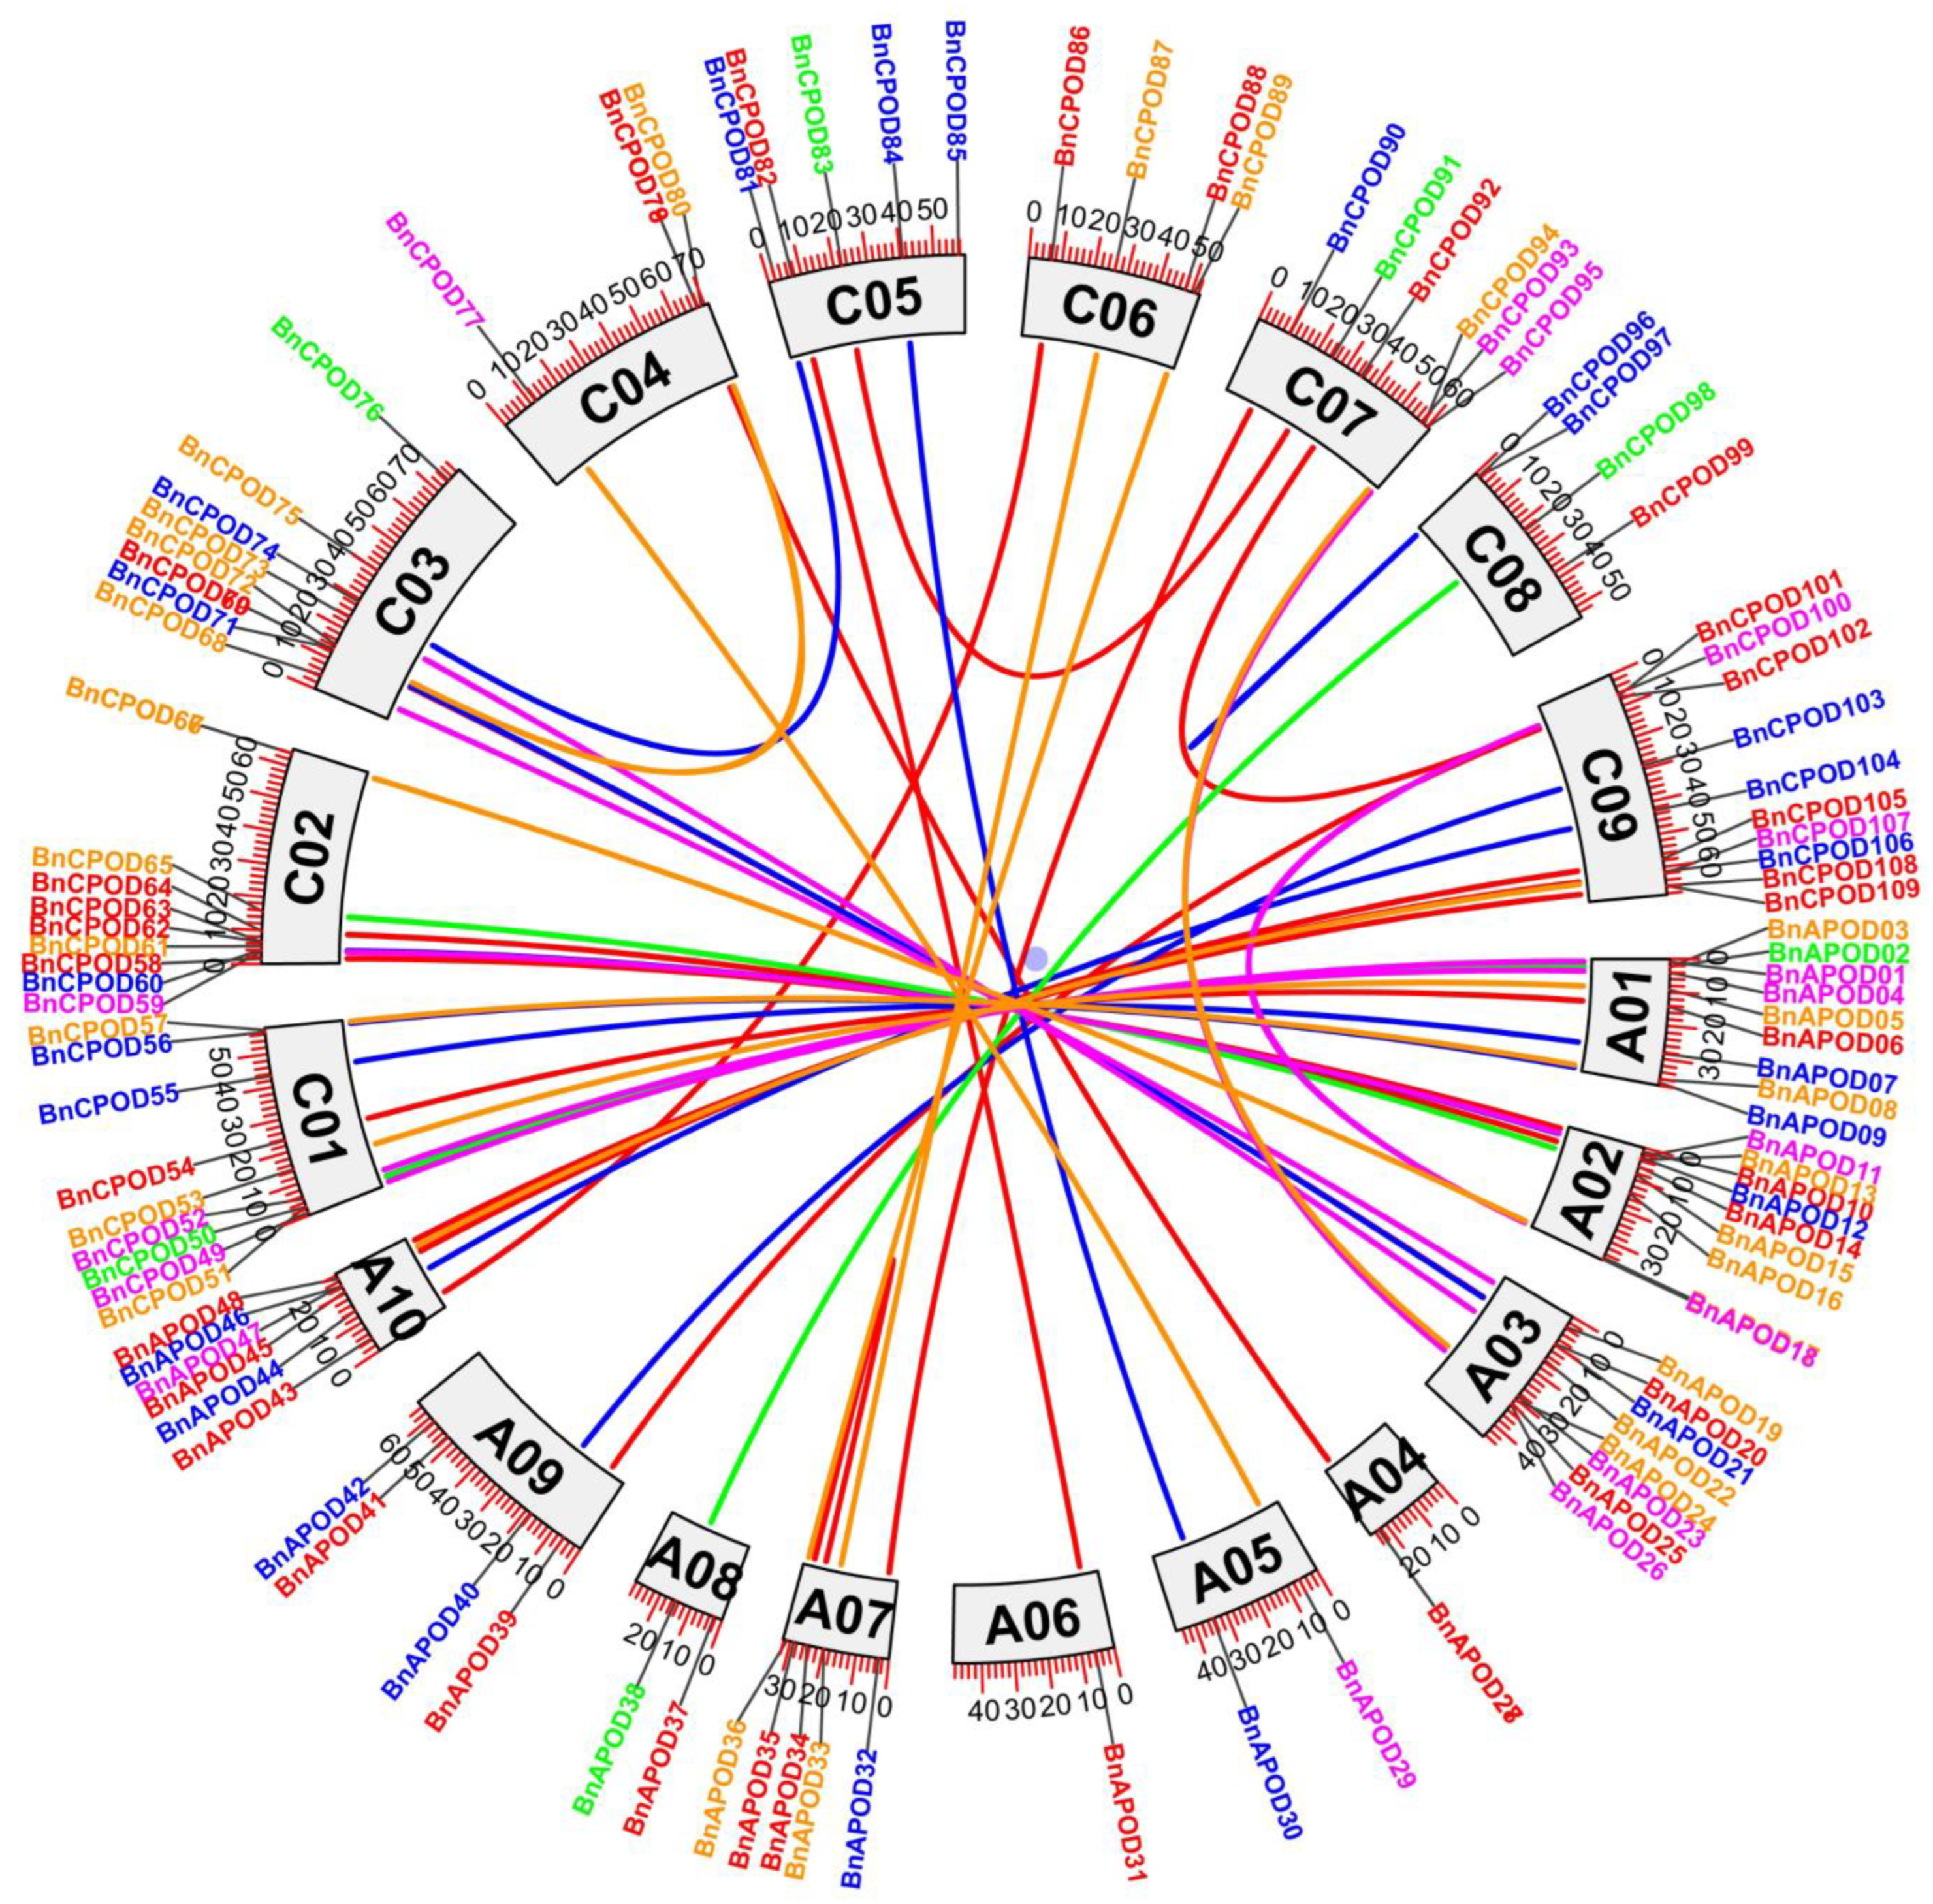
2.4. Chromosomal Distribution and Duplication Events of POD Genes

The BnPOD genes were unevenly distributed in all the chromosomes in the B. napus genome. For example, chromosomes C02 and C09 had 10 BnPODs; A01, A02, C01, and C03 had 9 BnPODs each; A10/C07 had 6 BnPODs; A07/C05 had 5 BnPODs; A09, C04, C06, and C08 had 4 BnPODs; A04, A05, and A08 had 2 BnPODs; and A06 had only 1 BnPOD (Table S1). Moreover, the expansion of a gene family occurs owing to the duplication events arising at the whole genome, and we identified duplicate gene pairs among the BnPODs based on sequence similarity. As a result, 44 duplicate events corresponding to 109 BnaPODs were identified with >80% sequence similarity. Gene pairs were selected as tandemly duplicated if the sequence was found within a 100 kb window of the duplicated genomic region. According to these criteria, the BnAPOD35BnAPOD34 and BnCPOD97BnCPOD96 gene pairs were identified as tandemly duplicated (Table S3 and Figure 4). The remaining 43 BnPODs, including BnCPOD55BnAPOD07, BnCPOD84BnAPOD30, BnCPOD100BnAPOD18, BnAPOD04BnCPOD52, and BnCPOD107BnAPOD47, were identified as segmentally duplicated (Table S3). C09, A01, A02, A03, A10, C01, C02, and C03 had undergone the highest number of segmental duplication events, indicating their key contribution to the expansion of the BnPOD family in B. napus (Figure 4).
The Ka, Ks, and Ka/Ks values are key indicators of selection pressures. In general, a Ka/Ks ratio of >1 refers to positive selection; a Ka/Ks ratio of <1 refers to purifying selection, and a Ka/Ks ratio equal to 1 refers to neutral selection. The Ka/Ks ratio varies between 0.05 and 0.65, indicating that all the BnPOD gene pairs exhibited negative or purifying selection (Ka/Ks < 1) (Table S3). These findings demonstrated that the purifying or negative selection was involved in maintaining the conservation of the BnPOD gene structure during the domestication or evolution process. Further, we estimated the divergence time between duplication events, and the results showed that the estimated divergence time ranged from 0.86 to 32.67 million years ago (MYA), with an average of ~6.15 MYA (Table S3). The syntenic relationships between different chromosome segments of different species provide a source of information about the origin of gene family members. For this purpose, we performed synteny analysis between POD genes from the B. napus, B. rapa, B. oleracea, and Arabidopsis genomes (Table S4 and Figure 5). Our results revealed that 55 BnPODs were placed in 106 colinear blocks with B. oleracea, 49 BnPODs in 102 colinear blocks in B. rapa, and 94 BnPODs in 127 colinear blocks in the Arabidopsis genome (Table S4 and Figure 5).

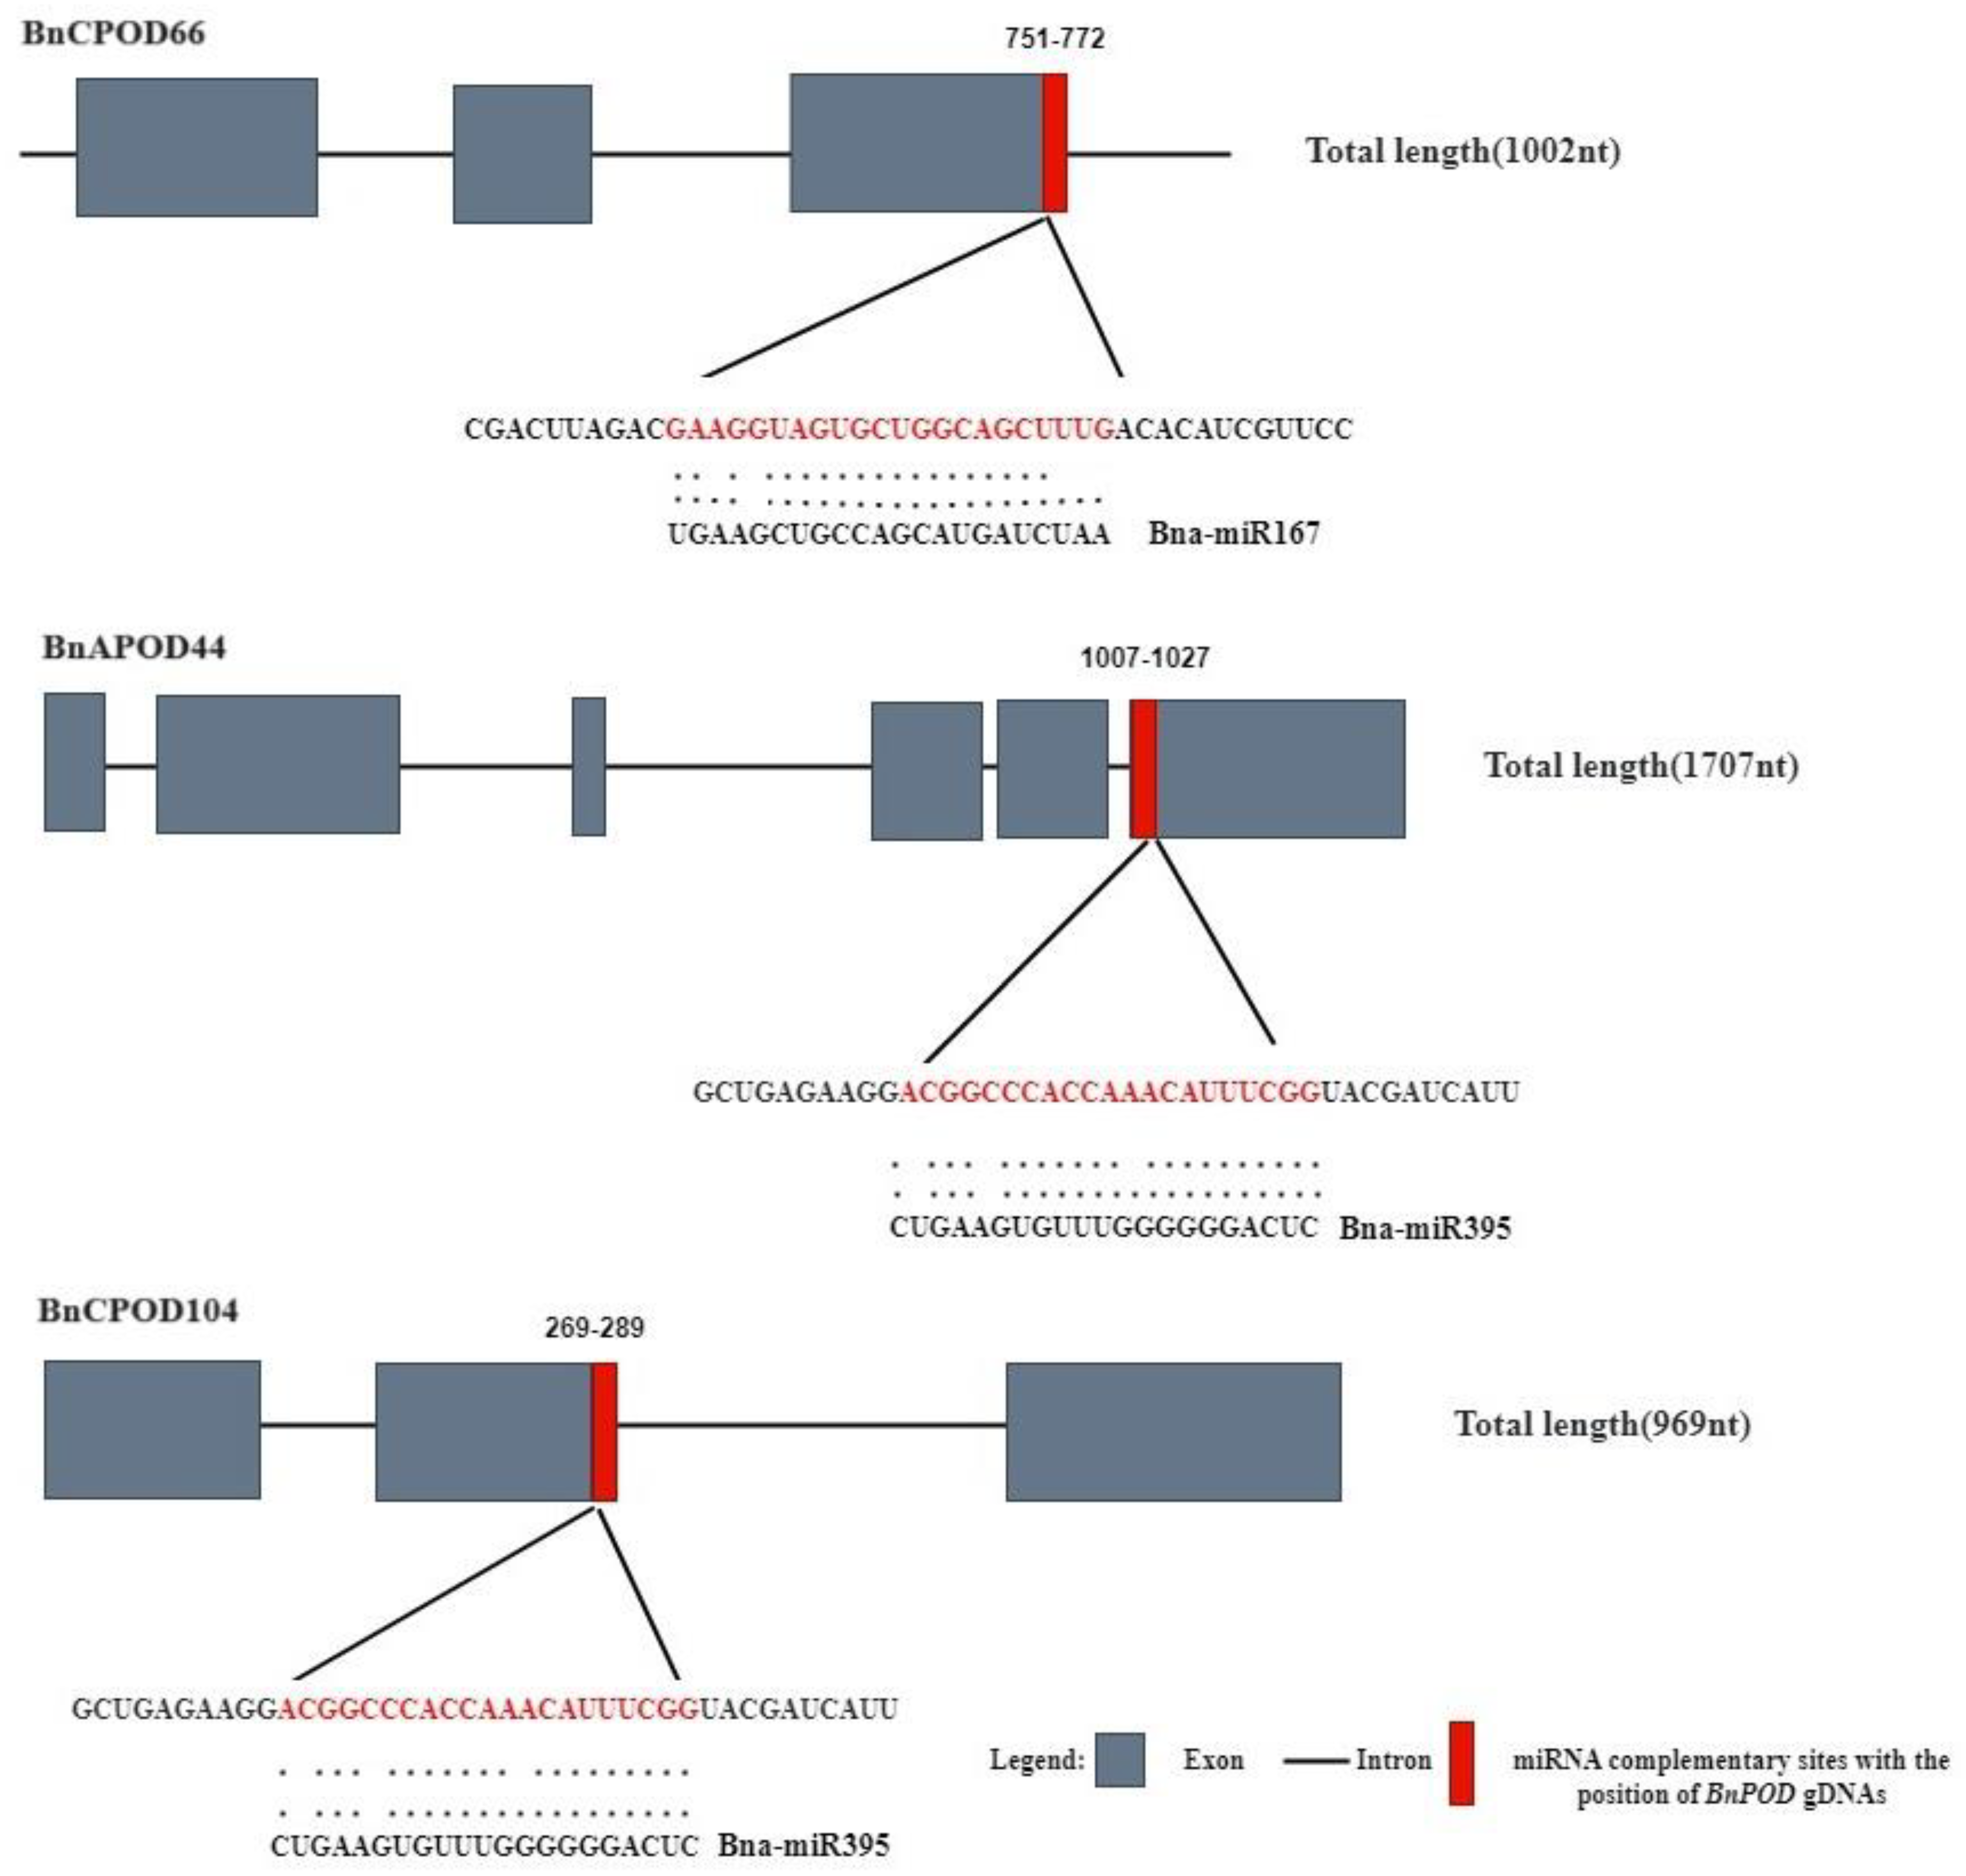
2.5. miRNA-Mediated BnPOD Regulation

In recent years, various studies have unveiled the importance of miRNA-mediated gene expression regulation in response to biotic and abiotic stresses. In this study, we identified two putative miRNAs targeting three BnPOD genes. The results showed that members of the Bn-miR167 family targeted BnCPOD66 and members of the Bn-miR395 family targeted BnAPOD44 and BnCPOD104 (Table S5 and Figure 6).

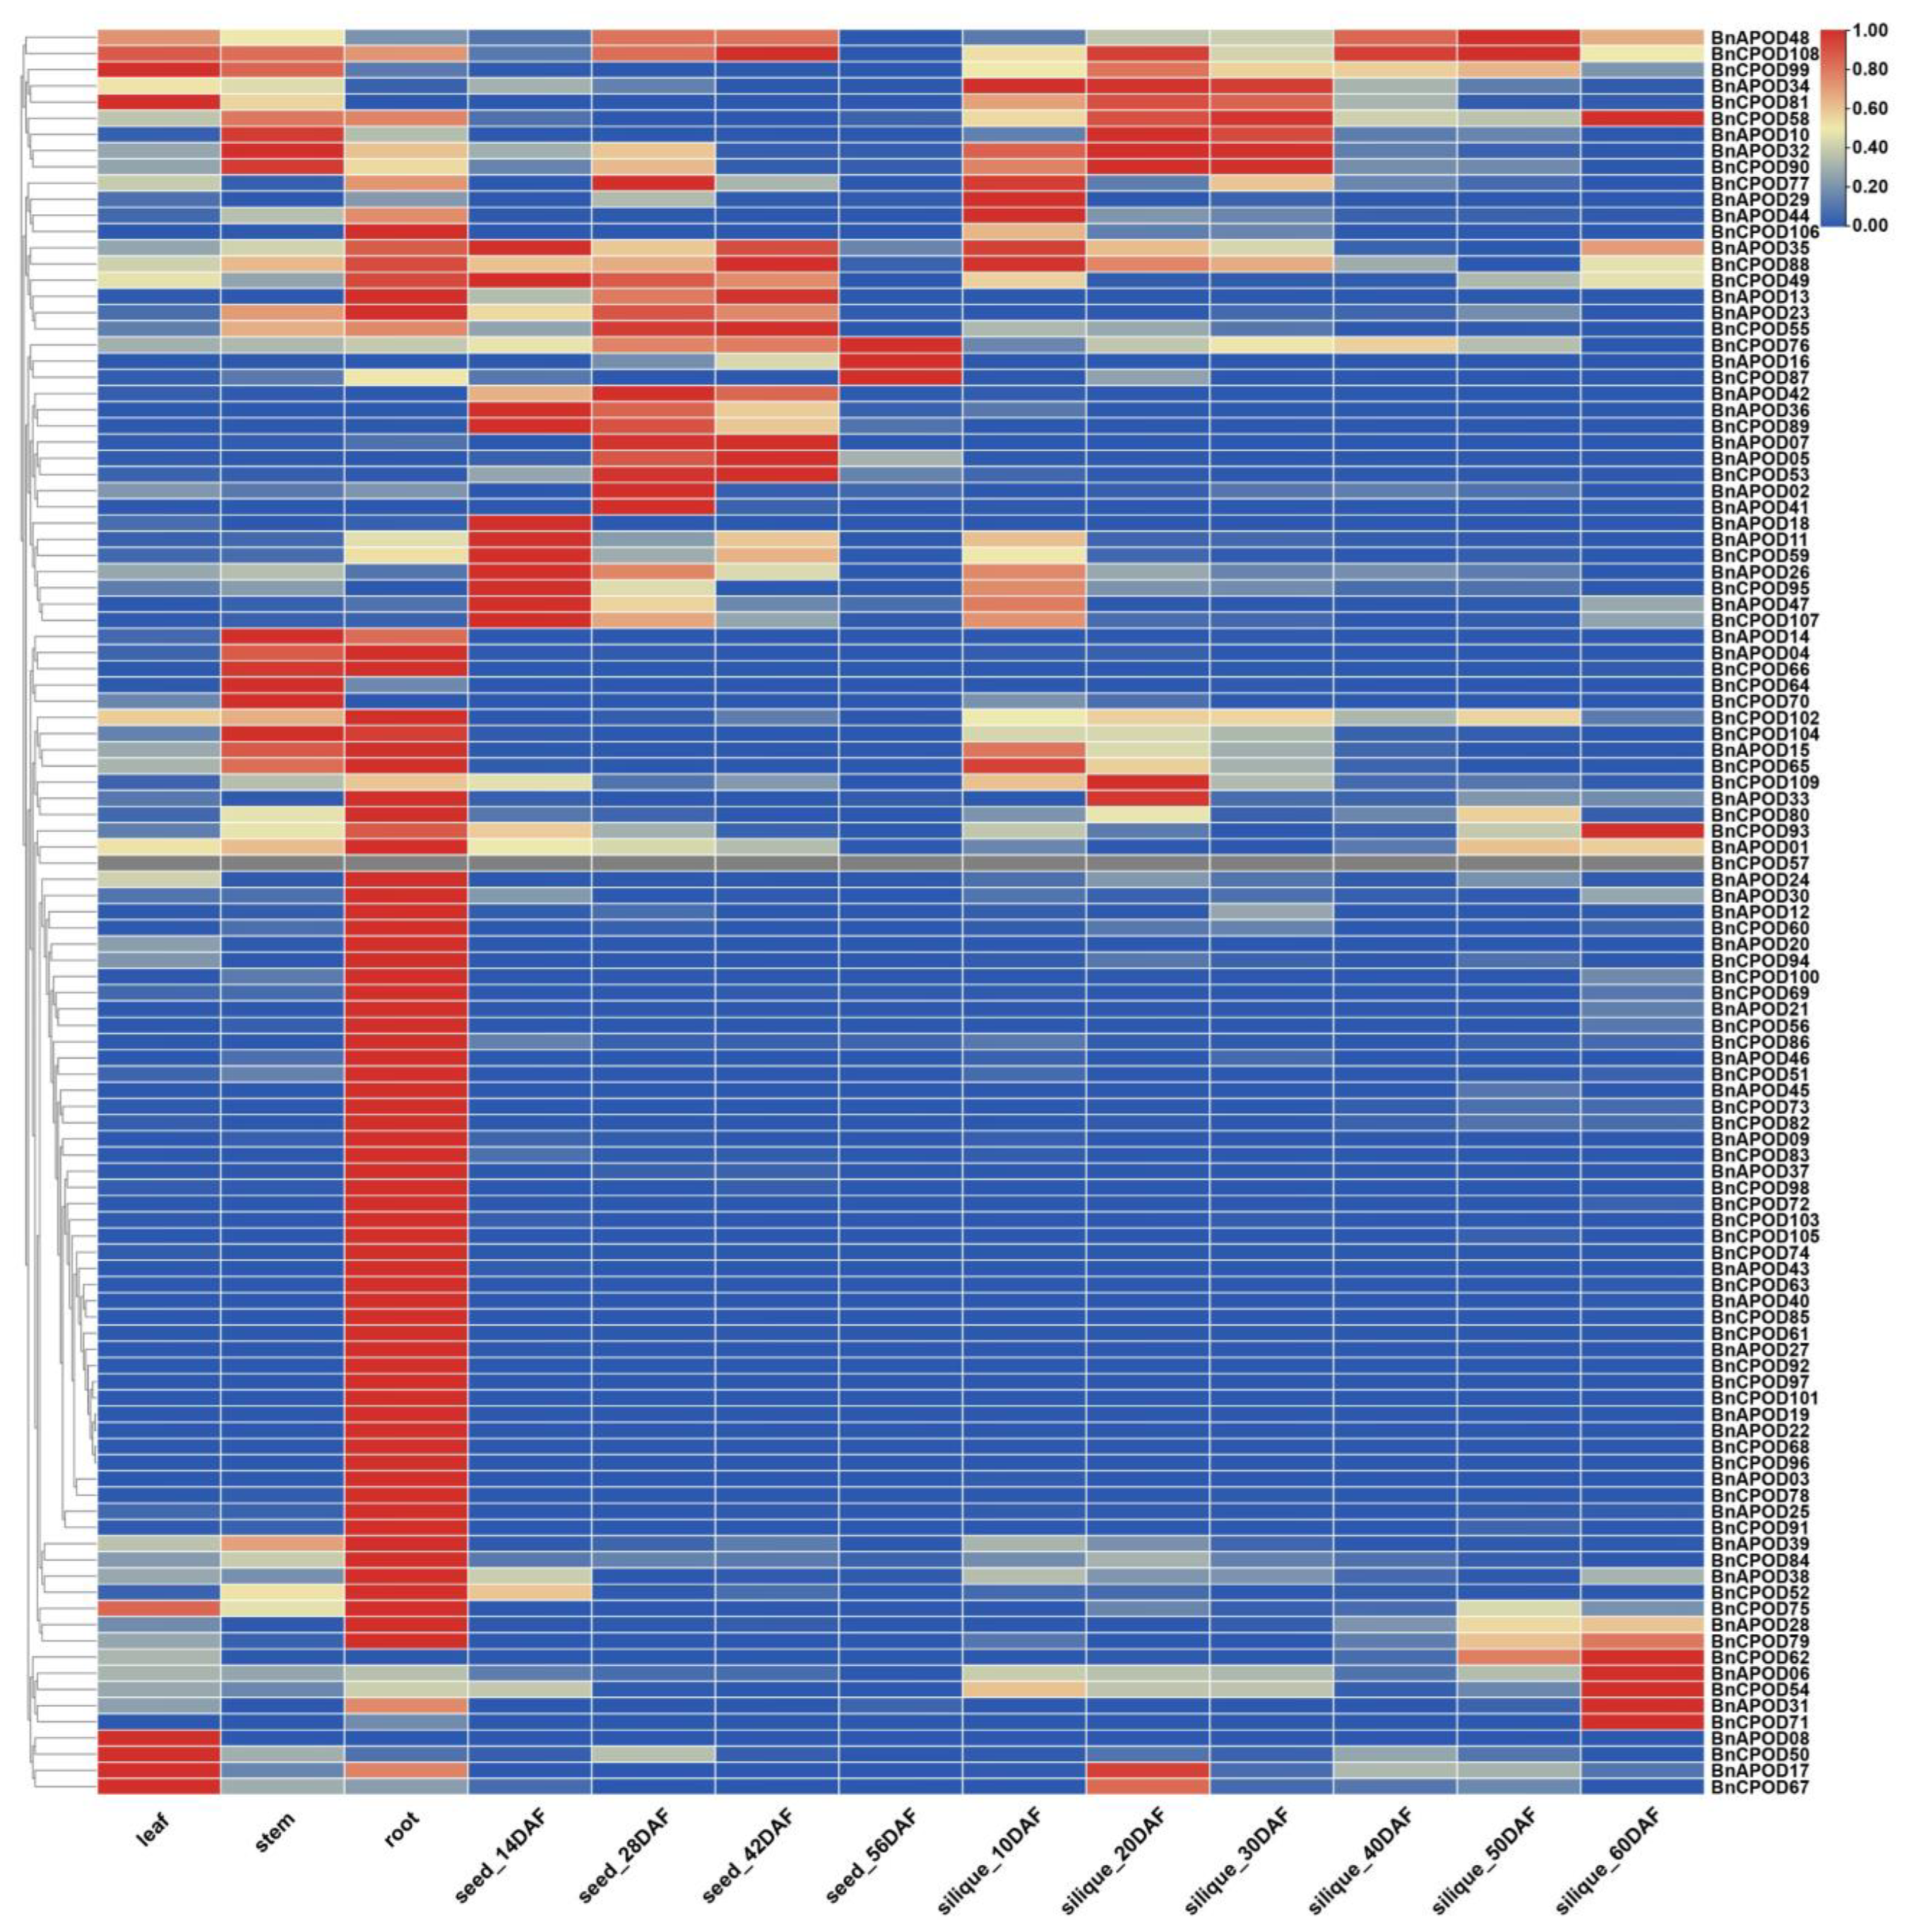
2.6. Expression Profiling of BnPOD Genes in Various Tissues

The expression patterns of the BnPODs genes in different tissues, including the leaves, stems, roots, and seeds at 14 DAF (days after flowering), 28 DAF, 42 DAF, and 56 DAF and the siliquae at 10 DAF, 20 DAF, 30 DAF, 40 DAF, 50 DAF, and 60 DAF, were investigated. The analysis of the RNA-seq revealed spatial expression patterns of BnPODs in different tissues. For instance, most genes were expressed in roots compared with other tissues. The expressions of BnCPOD50, BnAPOD17, and BnCPOD87 were confined to leaves, but BnCPOD62, BnAPOD06, BnCPOD51, BnAPOD31, and BnCPOD71 were expressed only in 60 DAF siliquae. The expressions of BnAPOD18, BnAPOD11, BnCPOD59, BnAPOD26, BnCPOD95, BnAPOD47, and BnCPOD107 were higher in seeds at 14 DAF, while BnCPOD76, BnAPOD16, and BnCPOD87 were expressed in 56 DAF seeds (Figure 7). This temporal expression pattern indicated that the dynamic roles of the candidate BnPODs might play an important role in the growth and developmental processes of B. napus.

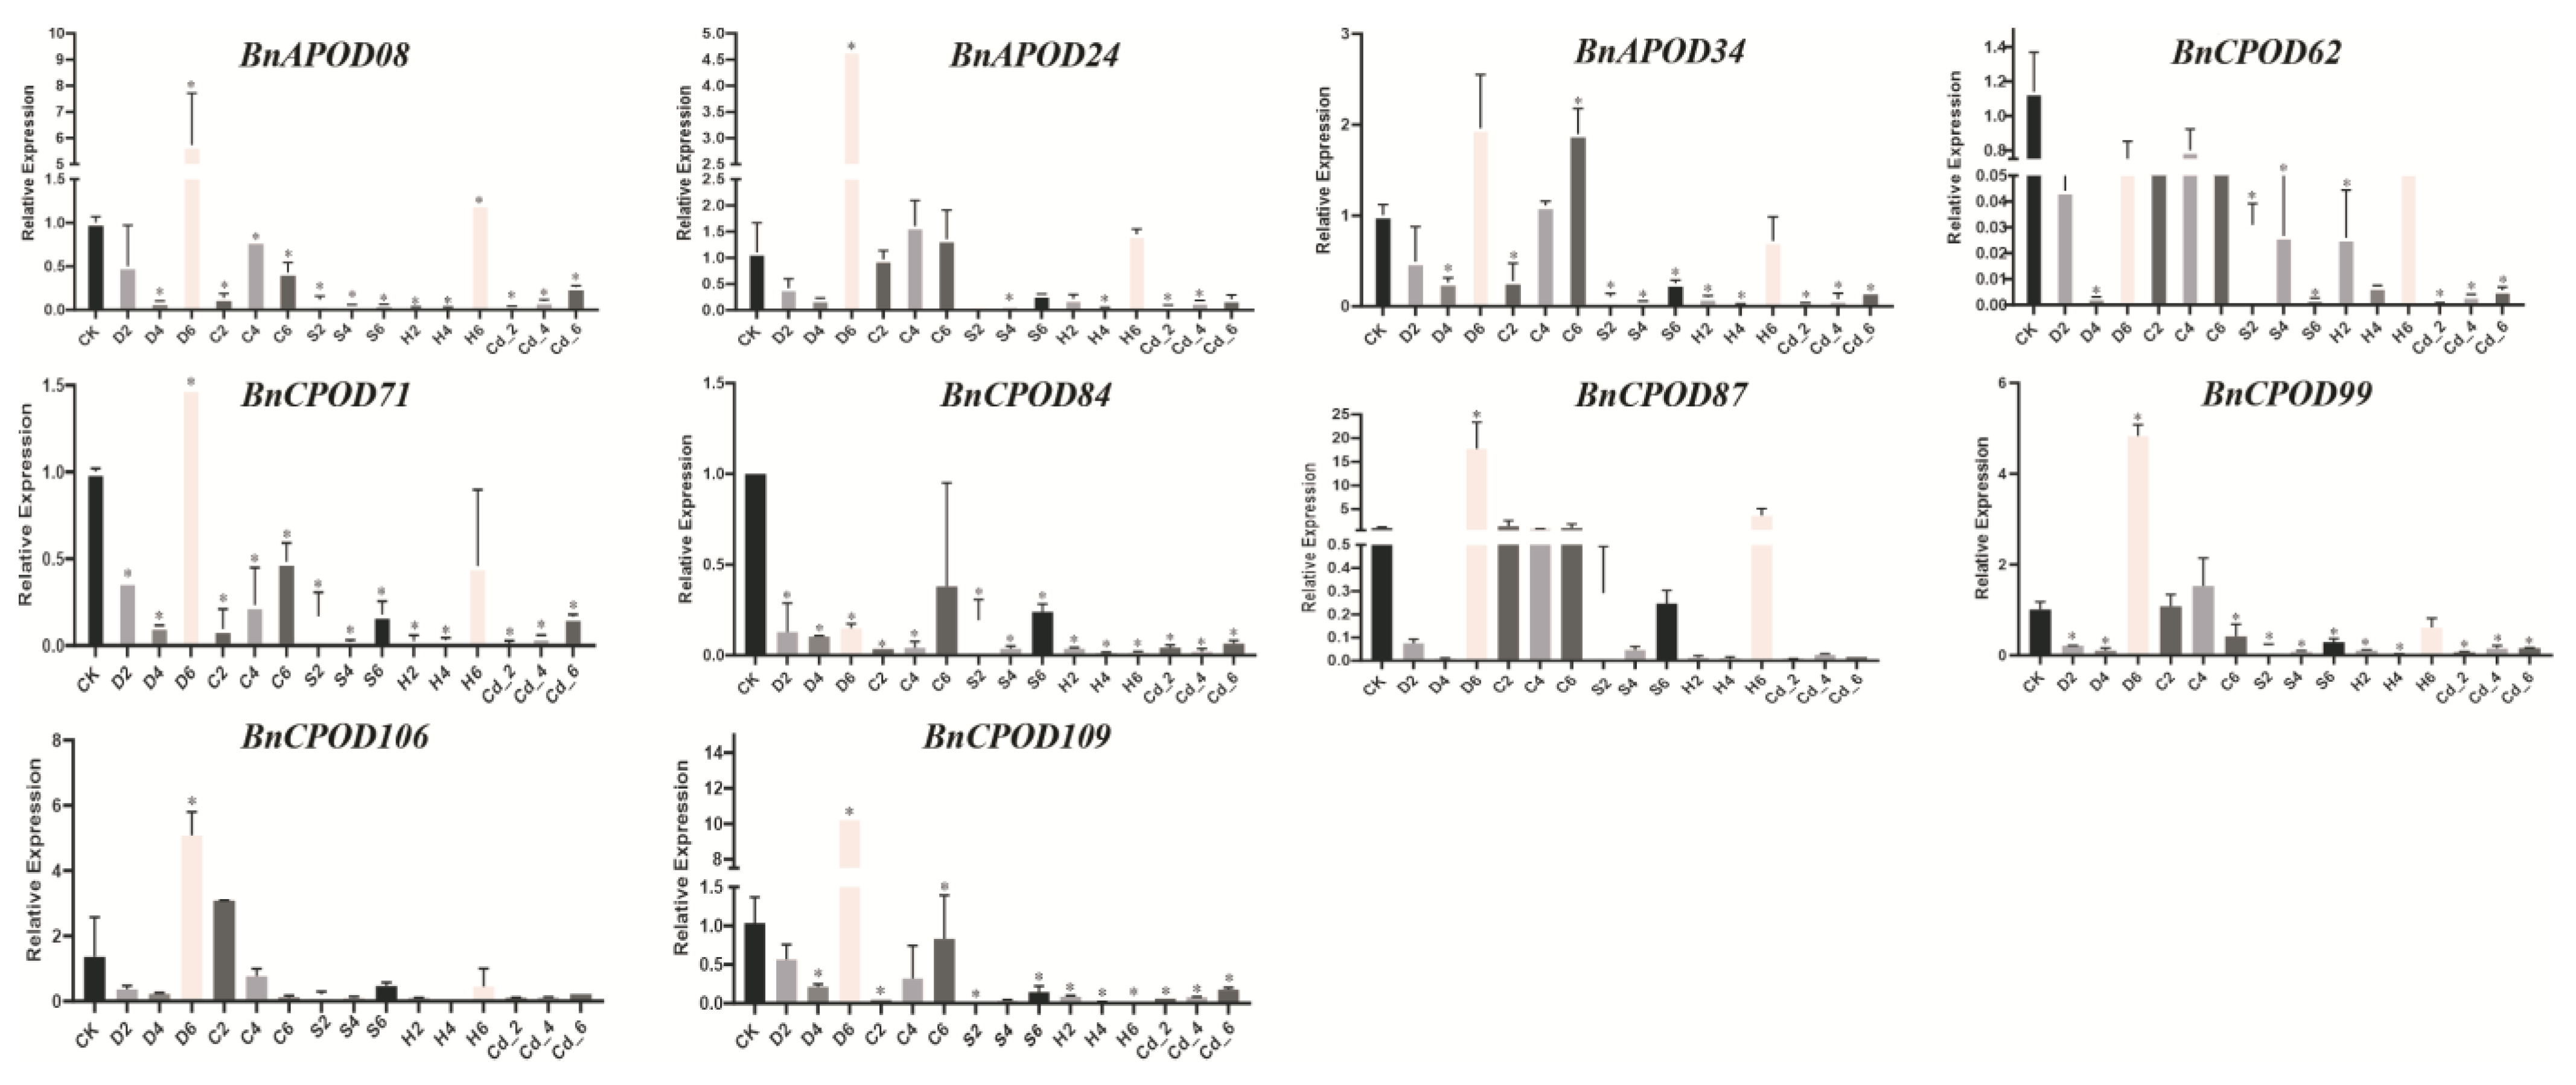
2.7. Expression Patterns of BnPODs during Abiotic Stresses

We selected POD genes according to the RNA-seq expression profile; for example, BnAPOD24, BnAPOD34, and BnCPOD99 were highly expressed in all the tissues; BnCPOD62 and BnCPOD84 were expressed in partial tissues, such as roots, leaves, stems, and siliquae; and BnAPOD08 was highly expressed in leaf tissues. To investigate the expressions of the above BnPODs in B. napus during abiotic stresses (salinity, drought, heat, cold, and cadmium chloride), these tissues were analyzed at 0 h, 2 h, 4 h, and 6 h. With RT-qPCR, the expressions of ten selected BnPODs were examined under the applied abiotic stresses. The expression patterns of all the BnPODs were significantly changed under the applied stresses. For instance, under drought stress, all the BnPODs were initially downregulated at 2 h and 4 h but significantly upregulated at 6 h except for BnCPOD62 and BnCPOD84. Under cold stress, only BnAPOD34 was upregulated at 6 h, but BnAPOD24 and BnCPOD99 were upregulated at 4 h. Although BnCPOD87 and BnCPOD106 were upregulated at 2 h, they were downregulated in other time intervals. Likewise, under heat stress, the expressions of BnAPOD08, BnAPOD24, and BnCPOD87 were upregulated at 6 h. However, it is interesting that all the selected genes were downregulated under the salt and heavy-metal stresses (Figure 8). Our results indicate that PODs might play a pivotal role in tolerance to applied abiotic stresses.

3. Discussion

Brassica napus is an allotetraploid crop and is susceptible to environmental stresses, including cold, heat, salt, drought, and heavy metals [27], which negatively influence the growth and final production [28]. Class III peroxidases (PODs) play critical roles in regulating plant physiology, particularly responses to abiotic stresses [24]. Consequently, the systematic genome-wide characterization of the POD genes in different crops is essential to clarify their biological roles in plants, particularly in growth and defense responses. The POD gene family has been extensively studied in different plant species, such as A. thaliana [17], Saccharum officinarum [29], O. sativa [7], N. tabacum [30], Z. mays [16], Betula pendula [31], P. bretschneideri [19], and M. esculenta [18], while the comprehensive identification of PODs in B. napus is still lacking.
In this study, we identified a total of 109 POD genes in B. napus, which is more than those reported in A. thaliana (73) [17] and M. esculenta (91) [18] but fewer than those in O. sativa (138) [7] and G. max (124) [22]. This higher number of POD genes in B. napus might be owing to its allopolyploid nature. We first analyzed the physical locations of the BnPODs in B. napus throughout the A and C genomes. We found that all the BnPODs are unevenly distributed in all the chromosomes, which is consistent with their chromosomal distributions in A. thaliana [17], S. officinarum [29], O. sativa [7], N. tabacum [30], and Z. mays [16]. Gene duplication, such as segmental duplication, tandem duplication, and whole-genome duplication, is responsible for the evolution and expansion of the gene family [18]. Next, 44 paralogous POD genes were identified in B. napus, indicating that segmental duplication contributed to the BnPOD expansion. Accumulated evidence has demonstrated that duplication events have been important for gene expansion in the POD family. The results of our study are consistent with POD expansion in O. sativa [7], P. pyrifolia [19], G. max [22], and M. esculenta [18].
Various cis-regulatory elements have been identified and can regulate the expression of stress-related genes [32]. We found multiple cis-acting elements in the upstream regions of the BnPOD family, including hormone-responsive and stress-responsive elements. Similar findings have also been reported for V. vinifera POD genes [21]. Antioxidant genes, such as SOD, CAT, and APX, regulate the underlying stress-tolerant mechanisms [33,34,35]. For instance, PODs significantly play an important role in mitigating different abiotic stresses [11,12,36]. In this study, we selected a few BnPOD genes for various abiotic stresses, which are located on ChrA02, A06, C02, C03, C04, C05, and C09. The phylogeny analysis of the selected genes revealed that BnAPOD08 and BnCPOD87 belong to subclade E; BnAPOD34, BnCPOD62, and BnCPOD109 belong to subclade B; and BnCPOD71, BnCPOD84, BnCPOD99, and BnCPOD106 belong to subclade A (Figure 2).
Notably, BnPOD genes showed large variations in their expression profile patterns, revealing their roles in different stress responses and defense responses in B. napus. Meanwhile, individual POD genes are usually sensitive to one specific external stress, and few genes are widely responsive to various biotic and abiotic stresses. For example, all the selected BnPOD genes are responsive to all the applied stresses, including cold, drought, salt, and heavy metals. Previous studies have suggested that the overexpression of POD genes, such as AtPrx22, AtPrx39, and AtPrx69, in A. thaliana is involved in cold tolerance [37]; also, POD family genes play a role in stresses in Populus and G. max [22,38] under drought, heat [39], salinity, and cadmium stresses. In summary, the expression patterns of the BnPODs under various abiotic stresses are complex and diverse and may be related to the functional diversity of the POD gene family members. These results provide useful insights into the potential capabilities of BnPODs under various abiotic stresses.

4. Materials and Methods

4.1. Mining of BnPOD Family in B. napus

POD protein sequences of A. thaliana were retrieved from the TAIR database (https://www.arabidopsis.org/, accessed on 2 August 2023) [40] and used as a query sequence in the B. napus genome, using the BlastP tool (https://blast.ncbi.nlm.nih.gov/Blast.cgi, accessed on 2 August 2023). After the removal of duplications, the non-redundant protein sequences were subjected to SMART (http://smart.emblheidelberg.de/, accessed on 2 August 2023) and NCBI conserved-domain searches (https://www.ncbi.nlm.nih.gov/Structure/cdd/wrpsb.cgi, accessed on 4 August 2023). The final POD proteins were renamed according to their physical positions in the B. napus genome. Furthermore, the physicochemical properties of the BnPOD proteins, including the protein length (aa), theoretical isoelectric point (pI), molecular weight (kilodaltons; kDa), and grand average of hydropathicity (GRAVY) were computed using ProtParam (http://web.expasy.org/protparam/, accessed on 6 August 2023). WoLF PSORT (https://wolfpsort.hgc.jp/, accessed on 9 August 2023) was used to predict the in silico subcellular localizations of all the deduced POD proteins [41].

4.2. Phylogeny of B. napus POD Proteins

To draw the phylogenetic tree of the POD proteins, the protein sequences of B. napus and A. thaliana were first aligned using MEGA software (Version 11) [42], and the maximum likelihood tree was then generated using iq-tree software (http://www.iqtree.org, accessed on 14 August 2023). The bootstrap values were set at 1000 replicates. The generated phylogeny was further modified using ITOL (https://itol.embl.de/, accessed on 15 August 2023) [43].

4.3. Gene Structural Analysis of B. napus POD Proteins

The intron and exon organizations within the BnPOD genes were predicted using TBtools (version 2.003) [44]. For the identification of the conserved motifs within the BnPODs, we used MEME Suite (https://meme-suite.org, accessed on 19 August 2023) [45], with the number of motifs set at 10.
For the identification of the cis-regulatory elements within the promoters of the BnPOD genes, a 2 kb sequence upstream from the start codons was submitted to the PlantCARE website (http://bioinformatics.psb.ugent.be/webtools/plantcare/html/, accessed on 25 August 2023) [46].

4.4. Gene Duplication and Evolutionary Analysis of BnPOD

We analyzed the duplication events of the BnaPOD gene family using MCScanX (https://github.com/wyp1125/MCScanX, accessed on 26 August 2023), and visualized them in Circos, as described by Waseem et al. [47]. Furthermore, the Ka and Ks substitutions between the gene pairs were also calculated as described by Aslam et al. [48]. The divergence time (T, MYA; millions of years ago) was calculated as follows: T = Ks/2R (where R = 1.5 × 10⁻⁸ and is synonymous with the number of substitutions per site per year) [49]. Moreover, the syntenic relationship among B. napus, B. rapa, B. oleracea, and Arabidopsis thaliana was assessed using MCScanX and visualized in TBtools.

4.5. Prediction of Putative miRNAs Targeting BnPOD Genes

To predict the potential targets of BnPOD genes by miRNAs, the psRNATarget database (http://plantgrn.noble.org/psRNATarget/, accessed on 27 August 2023) [50] was employed with default parameters, including the number of expectations being set at 3. The interaction network between the predicted miRNAs and their corresponding BnPOD genes was visualized in Cytoscape (version 3.10.1) [51,52].

4.6. Expression Analysis of BnPOD Genes in Different Tissues

The expression data of the BnPOD genes were retrieved from the BnPIR database (http://cbi.hzau.edu.cn/bnapus/index.php, accessed on 3 September 2023) [53]. We evaluated the temporal and spatial expression data of the 109 BnPOD genes using RNA-seq data for various B. napus tissues, including the roots, stems, leaves, seeds, and siliquae [34], as well as at different developmental stages.

4.7. Plant Materials and Abiotic Stresses

We conducted a controlled laboratory experiment to investigate the BnPOD gene responses under various abiotic stresses. Plants of B. napus var. 383-5 were grown in a hydroponic solution, using the full Hoagland solution (2.5 mM Ca(NO3)2, 2 mM KCl, 1 mM MgSO4, 0.5 mM NH4H2PO4, 0.5 mM CaCl2, 25 µM H3BO3, 5 µM MnSO4, 0.8 µM ZnSO4, 0.3 µM CuSO4, 0.1 µM (NH4)6Mo7O24, and 100 µM EDTA, 2NaFe), with continuous aeration [54]. Other experimental conditions, including a 14 h light and 10 h dark cycle, were maintained. Subsequently, the plants were exposed to various abiotic stresses, including NaCl (150 mM), CdCl2 (cadmium chloride, 2.5 mM), cold stress at 8 °C, heat stress at 42 °C, and drought stress. For the drought stress, the plants were subjected to a drought stress with a 15% PEG-6000 solution. Each stress treatment was carried out with three independent biological replicates. The samples were collected at 0 h, 2 h, 4 h, and 6 h. All the samples were immediately frozen in liquid nitrogen and stored at −80 °C for the subsequent analysis.

4.8. RNA Isolation and Real-Time Quantitative PCR Expression Analysis

The total RNA was extracted from the collected samples, using an RNAprep Pure Plant Kit (Lot no. Q5510, Tiangen, Beijing, China) following the manufacturer’s protocol. The concentration of the extracted RNA samples was measured using a NanoDrop (2000 C spectrophotometer from Thermo Fisher Scientific, Waltham, MA, USA). DNase I treatment was used to remove the genomic DNA [55]. The first complementary strand of DNA (cDNA) was synthesized using HiScript 1st strand cDNA synthesis kit (V22.1, Vazyme Biotech Co., Ltd., Sanya, China). The cDNA of samples was assessed by RT-qPCR using ChamQTM SYBR RT-qPCR Master Mix (Vazyme Biotech Co., Ltd., Sanya, China). The expression level of the Actin was used as internal control. The RT-qPCR was performed with three independent biological replicates. The relative expression level of BnPODs was calculated using the 2−ΔΔCT method [56]. The primers used in this study are listed in Table S6.

5. Conclusions

This research provides the first comprehensive genome-wide analysis of the POD family genes in B. napus. We identified 109 POD family genes from the BnPIR database of B. napus. Then, we studied their basic classification, gene structure, motif distribution and duplication events. Additionally, RT-qPCR analysis revealed that the selected BnPOD genes were significantly expressed under abiotic stresses, suggesting that these genes can be potential candidates for B. napus crop improvement. In the future, attempts to increase the stress tolerance of B. napus will require knowledge of the specific peroxidases that are up-regulated by stresses. In summary, our discoveries offer valuable perspectives into the functional dimensions of POD family genes, which open the way for upcoming investigations in economically significant B. napus crops.

Supplementary Materials

The following supporting information can be downloaded at https://www.mdpi.com/article/10.3390/plants13070942/s1: Table S1: Characteristics of PODs in Brassica napus; Table S2: Identification of different cis-regulatory elements in promoters of BnaPODs; Table S3: Parameters related to gene duplication and evolution of BnPODs in B. napus; Table S4: Collinearity analysis among Brassica napus, Brassica rapa, Brassica oleracea, and Arabidopsis thaliana; Table S5: BnaPOD–miRNA prediction using psRNATarget server; Table S6: List of all the primers used in this study.

Author Contributions

O.U.S. conceived the study design and analyzed the results. O.U.S. and L.U.K. performed all the bioinformatics analyses. M.I. and M.W. reviewed the data. O.U.S., S.B. and M.W. drafted the manuscript. W.U.K., J.P. and L.Z. managed the multiple stresses and seedling protection, and M.W., M.I. and P.L. revised the manuscript. P.L. and M.W. supervised and provided funding for the whole research work. All authors have read and agreed to the published version of the manuscript.

Funding

This work was supported by grants from the China NSFC Research Fund for International Young Scientists (grant number: 32250410291), Key Research Program of Hainan Province (grant number: ZDYF2022XDNY185), and Special Project for the Academician Team Innovation Center of Hainan Province (grant number: YSPTZX202206).

Data Availability Statement

The authors confirm that the data supporting the findings of this study are available within the article and its Supplementary Materials.

Acknowledgments

The authors thank all the editors and reviewers for their valuable and insightful comments on this manuscript.

Conflicts of Interest

The authors have no conflicts of interest to declare, either financial or non-financial.

References

  1. Hiraga, S.; Sasaki, K.; Ito, H.; Ohashi, Y.; Matsui, H. A Large Family of Class III Plant Peroxidases. Plant Cell Physiol. 2001, 42, 462–468. [Google Scholar] [CrossRef]
  2. Hiraga, S.; Ichinose, C.; Onogi, T.; Niki, H.; Yamazoe, M. Bidirectional Migration of SeqA-Bound Hemimethylated DNA Clusters and Pairing of oriC Copies in Escherichia coli: Migration of SeqA-DNA Complex and oriC. Genes Cells 2000, 5, 327–341. [Google Scholar] [CrossRef] [PubMed]
  3. Koua, D.; Cerutti, L.; Falquet, L.; Sigrist, C.J.A.; Theiler, G.; Hulo, N.; Dunand, C. PeroxiBase: A Database with New Tools for Peroxidase Family Classification. Nucleic Acids Res. 2009, 37, D261–D266. [Google Scholar] [CrossRef]
  4. Zámocký, M.; Furtmüller, P.G.; Obinger, C. Evolution of Structure and Function of Class I Peroxidases. Arch. Biochem. Biophys. 2010, 500, 45–57. [Google Scholar] [CrossRef] [PubMed]
  5. Piontek, K.; Smith, A.T.; Blodig, W. Lignin Peroxidase Structure and Function. Biochem. Soc. Trans. 2001, 29, 111–116. [Google Scholar] [CrossRef]
  6. Mathé, C.; Barre, A.; Jourda, C.; Dunand, C. Evolution and Expression of Class III Peroxidases. Arch. Biochem. Biophys. 2010, 500, 58–65. [Google Scholar] [CrossRef] [PubMed]
  7. Passardi, F.; Longet, D.; Penel, C.; Dunand, C. The Class III Peroxidase Multigenic Family in Rice and Its Evolution in Land Plants☆,☆☆. Phytochemistry 2004, 65, 1879–1893. [Google Scholar] [CrossRef] [PubMed]
  8. Herrero, J.; Fernández-Pérez, F.; Yebra, T.; Novo-Uzal, E.; Pomar, F.; Pedreño, M.Á.; Cuello, J.; Guéra, A.; Esteban-Carrasco, A.; Zapata, J.M. Bioinformatic and Functional Characterization of the Basic Peroxidase 72 from Arabidopsis Thaliana Involved in Lignin Biosynthesis. Planta 2013, 237, 1599–1612. [Google Scholar] [CrossRef]
  9. Pandey, V.P.; Awasthi, M.; Singh, S.; Tiwari, S.; Dwivedi, U.N. A Comprehensive Review on Function and Application of Plant Peroxidases. Biochem. Anal. Biochem. 2017, 6, 308. [Google Scholar] [CrossRef]
  10. Passardi, F.; Tognolli, M.; De Meyer, M.; Penel, C.; Dunand, C. Two Cell Wall Associated Peroxidases from Arabidopsis Influence Root Elongation. Planta 2006, 223, 965–974. [Google Scholar] [CrossRef]
  11. Wu, Y.; Yang, Z.; How, J.; Xu, H.; Chen, L.; Li, K. Overexpression of a Peroxidase Gene (AtPrx64) of Arabidopsis Thaliana in Tobacco Improves Plant’s Tolerance to Aluminum Stress. Plant Mol. Biol. 2017, 95, 157–168. [Google Scholar] [CrossRef] [PubMed]
  12. Llorente, F.; López-Cobollo, R.M.; Catalá, R.; Martínez-Zapater, J.M.; Salinas, J. A Novel Cold-inducible Gene from Arabidopsis, RCI3, Encodes a Peroxidase That Constitutes a Component for Stress Tolerance. Plant J. 2002, 32, 13–24. [Google Scholar] [CrossRef] [PubMed]
  13. Jaggi, M.; Kumar, S.; Sinha, A.K. Overexpression of an Apoplastic Peroxidase Gene CrPrx in Transgenic Hairy Root Lines of Catharanthus Roseus. Appl. Microbiol. Biotechnol. 2011, 90, 1005–1016. [Google Scholar] [CrossRef]
  14. Su, P.; Yan, J.; Li, W.; Wang, L.; Zhao, J.; Ma, X.; Li, A.; Wang, H.; Kong, L. A Member of Wheat Class III Peroxidase Gene Family, TaPRX-2A, Enhanced the Tolerance of Salt Stress. BMC Plant Biol. 2020, 20, 392. [Google Scholar] [CrossRef]
  15. Sečenji, M.; Lendvai, Á.; Miskolczi, P.; Kocsy, G.; Gallé, Á.; Szűcs, A.; Hoffmann, B.; Sárvári, É.; Schweizer, P.; Stein, N.; et al. Differences in Root Functions during Long-Term Drought Adaptation: Comparison of Active Gene Sets of Two Wheat Genotypes: Adaptation of Wheat Root Genes to Drought. Plant Biol. 2010, 12, 871–882. [Google Scholar] [CrossRef]
  16. Wang, Y.; Wang, Q.; Zhao, Y.; Han, G.; Zhu, S. Systematic Analysis of Maize Class III Peroxidase Gene Family Reveals a Conserved Subfamily Involved in Abiotic Stress Response. Gene 2015, 566, 95–108. [Google Scholar] [CrossRef] [PubMed]
  17. Tognolli, M.; Penel, C.; Greppin, H.; Simon, P. Analysis and Expression of the Class III Peroxidase Large Gene Family in Arabidopsis Thaliana. Gene 2002, 288, 129–138. [Google Scholar] [CrossRef] [PubMed]
  18. Wu, C.; Ding, X.; Ding, Z.; Tie, W.; Yan, Y.; Wang, Y.; Yang, H.; Hu, W. The Class III Peroxidase (POD) Gene Family in Cassava: Identification, Phylogeny, Duplication, and Expression. Int. J. Mol. Sci. 2019, 20, 2730. [Google Scholar] [CrossRef]
  19. Cao, Y.; Han, Y.; Meng, D.; Li, D.; Jin, Q.; Lin, Y.; Cai, Y. Structural, Evolutionary, and Functional Analysis of the Class III Peroxidase Gene Family in Chinese Pear (Pyrus bretschneideri). Front. Plant Sci. 2016, 7, 1874. [Google Scholar] [CrossRef]
  20. Li, Q.; Dou, W.; Qi, J.; Qin, X.; Chen, S.; He, Y. Genome-wide Analysis of the CIII Peroxidase Family in Sweet Orange (Citrus Sinensis) and Expression Profiles Induced by Xanthomonas Citri Subsp. Citri and Hormones. J. Genet. 2020, 99, 10. [Google Scholar] [CrossRef]
  21. Xiao, H.; Wang, C.; Khan, N.; Chen, M.; Fu, W.; Guan, L.; Leng, X. Genome-Wide Identification of the Class III POD Gene Family and Their Expression Profiling in Grapevine (Vitis vinifera L). BMC Genom. 2020, 21, 444. [Google Scholar] [CrossRef] [PubMed]
  22. Aleem, M.; Riaz, A.; Raza, Q.; Aleem, M.; Aslam, M.; Kong, K.; Atif, R.M.; Kashif, M.; Bhat, J.A.; Zhao, T. Genome-Wide Characterization and Functional Analysis of Class III Peroxidase Gene Family in Soybean Reveal Regulatory Roles of GsPOD40 in Drought Tolerance. Genomics 2022, 114, 45–60. [Google Scholar] [CrossRef] [PubMed]
  23. González-Gordo, S.; Muñoz-Vargas, M.A.; Palma, J.M.; Corpas, F.J. Class III Peroxidases (POD) in Pepper (Capsicum annuum L.): Genome-Wide Identification and Regulation during Nitric Oxide (NO)-Influenced Fruit Ripening. Antioxidants 2023, 12, 1013. [Google Scholar] [CrossRef] [PubMed]
  24. Almagro, L.; Gómez Ros, L.V.; Belchi-Navarro, S.; Bru, R.; Ros Barceló, A.; Pedreño, M.A. Class III Peroxidases in Plant Defence Reactions. J. Exp. Bot. 2009, 60, 377–390. [Google Scholar] [CrossRef] [PubMed]
  25. Ayadi, J.; Debouba, M.; Rahmani, R.; Bouajila, J. Brassica Genus Seeds: A Review on Phytochemical Screening and Pharmacological Properties. Molecules 2022, 27, 6008. [Google Scholar] [CrossRef]
  26. Lohani, N.; Jain, D.; Singh, M.B.; Bhalla, P.L. Engineering Multiple Abiotic Stress Tolerance in Canola, Brassica napus. Front. Plant Sci. 2020, 11, 3. [Google Scholar] [CrossRef]
  27. Song, J.-M.; Guan, Z.; Hu, J.; Guo, C.; Yang, Z.; Wang, S.; Liu, D.; Wang, B.; Lu, S.; Zhou, R.; et al. Eight High-Quality Genomes Reveal Pan-Genome Architecture and Ecotype Differentiation of Brassica napus. Nat. Plants 2020, 6, 34–45. [Google Scholar] [CrossRef]
  28. Mehmood, S.S.; Lu, G.; Luo, D.; Hussain, M.A.; Raza, A.; Zafar, Z.; Zhang, X.; Cheng, Y.; Zou, X.; Lv, Y. Integrated Analysis of Transcriptomics and Proteomics Provides Insights into the Molecular Regulation of Cold Response in Brassica napus. Environ. Exp. Bot. 2021, 187, 104480. [Google Scholar] [CrossRef]
  29. Shang, H.; Fang, L.; Qin, L.; Jiang, H.; Duan, Z.; Zhang, H.; Yang, Z.; Cheng, G.; Bao, Y.; Xu, J.; et al. Genome-Wide Identification of the Class III Peroxidase Gene Family of Sugarcane and Its Expression Profiles under Stresses. Front. Plant Sci. 2023, 14, 1101665. [Google Scholar] [CrossRef]
  30. Cheng, L.; Ma, L.; Meng, L.; Shang, H.; Cao, P.; Jin, J. Genome-Wide Identification and Analysis of the Class III Peroxidase Gene Family in Tobacco (Nicotiana Tabacum). Front. Genet. 2022, 13, 916867. [Google Scholar] [CrossRef]
  31. Cai, K.; Liu, H.; Chen, S.; Liu, Y.; Zhao, X.; Chen, S. Genome-Wide Identification and Analysis of Class III Peroxidases in Betula Pendula. BMC Genom. 2021, 22, 314. [Google Scholar] [CrossRef]
  32. Ijaz, U. Plant Cis-Regulatory Elements: Methods of Identification and Applications. Asian J. Agric. Biol. 2020, 8, 207–222. [Google Scholar] [CrossRef]
  33. Khan, W.U.; Khan, L.U.; Chen, D.; Chen, F. Comparative Analyses of Superoxide Dismutase (SOD) Gene Family and Expression Profiling under Multiple Abiotic Stresses in Water Lilies. Horticulturae 2023, 9, 781. [Google Scholar] [CrossRef]
  34. Raza, A.; Su, W.; Gao, A.; Mehmood, S.S.; Hussain, M.A.; Nie, W.; Lv, Y.; Zou, X.; Zhang, X. Catalase (CAT) Gene Family in Rapeseed (Brassica napus L.): Genome-Wide Analysis, Identification, and Expression Pattern in Response to Multiple Hormones and Abiotic Stress Conditions. Int. J. Mol. Sci. 2021, 22, 4281. [Google Scholar] [CrossRef]
  35. Zaman, Q.U.; Hussain, M.A.; Khan, L.U.; Hui, L.; Khan, D.; Khokhar, A.A.; Cui, J.; Raza, A.; Wang, H.-F. Genome-Wide Identification and Expression Profiling of APX Gene Family under Multifactorial Stress Combinations and Melatonin-Mediated Tolerance in Pitaya. Sci. Hortic. 2023, 321, 112312. [Google Scholar] [CrossRef]
  36. Kumar, S.; Jaggi, M.; Sinha, A.K. Ectopic Overexpression of Vacuolar and Apoplastic Catharanthus Roseus Peroxidases Confers Differential Tolerance to Salt and Dehydration Stress in Transgenic Tobacco. Protoplasma 2012, 249, 423–432. [Google Scholar] [CrossRef]
  37. Kim, B.H.; Kim, S.Y.; Nam, K.H. Genes Encoding Plant-Specific Class III Peroxidases Are Responsible for Increased Cold Tolerance of the Brassinosteroid-Insensitive 1 Mutant. Mol. Cells 2012, 34, 539–548. [Google Scholar] [CrossRef] [PubMed]
  38. Ren, L.-L.; Liu, Y.-J.; Liu, H.-J.; Qian, T.-T.; Qi, L.-W.; Wang, X.-R.; Zeng, Q.-Y. Subcellular Relocalization and Positive Selection Play Key Roles in the Retention of Duplicate Genes of Populus Class III Peroxidase Family. Plant Cell 2014, 26, 2404–2419. [Google Scholar] [CrossRef]
  39. Li, X.; Ma, W.; Jiang, Y. Expression Patterns of Heat Shock Protein Genes and Antioxidase Genes in Apis cerana cerana (Hymenoptera: Apidae) under Heat Stress. J. Entomol. Sci. 2023, 58, 95–103. [Google Scholar] [CrossRef]
  40. Rhee, S.Y. The Arabidopsis Information Resource (TAIR): A Model Organism Database Providing a Centralized, Curated Gateway to Arabidopsis Biology, Research Materials and Community. Nucleic Acids Res. 2003, 31, 224–228. [Google Scholar] [CrossRef]
  41. Horton, P.; Park, K.-J.; Obayashi, T.; Fujita, N.; Harada, H.; Adams-Collier, C.J.; Nakai, K. WoLF PSORT: Protein Localization Predictor. Nucleic Acids Res. 2007, 35, W585–W587. [Google Scholar] [CrossRef] [PubMed]
  42. Tamura, K.; Stecher, G.; Kumar, S. MEGA11: Molecular Evolutionary Genetics Analysis Version 11. Mol. Biol. Evol. 2021, 38, 3022–3027. [Google Scholar] [CrossRef] [PubMed]
  43. Letunic, I.; Bork, P. Interactive Tree Of Life (iTOL) v4: Recent Updates and New Developments. Nucleic Acids Res. 2019, 47, W256–W259. [Google Scholar] [CrossRef]
  44. Chen, C.; Chen, H.; Zhang, Y.; Thomas, H.R.; Frank, M.H.; He, Y.; Xia, R. TBtools: An Integrative Toolkit Developed for Interactive Analyses of Big Biological Data. Mol. Plant 2020, 13, 1194–1202. [Google Scholar] [CrossRef]
  45. Bailey, T.L.; Boden, M.; Buske, F.A.; Frith, M.; Grant, C.E.; Clementi, L.; Ren, J.; Li, W.W.; Noble, W.S. MEME SUITE: Tools for Motif Discovery and Searching. Nucleic Acids Res. 2009, 37, W202–W208. [Google Scholar] [CrossRef]
  46. Lescot, M. PlantCARE, a Database of Plant Cis-Acting Regulatory Elements and a Portal to Tools for in Silico Analysis of Promoter Sequences. Nucleic Acids Res. 2002, 30, 325–327. [Google Scholar] [CrossRef]
  47. Waseem, M.; Aslam, M.M.; Shaheen, I. The DUF221 Domain-Containing (DDP) Genes Identification and Expression Analysis in Tomato under Abiotic and Phytohormone Stress. GM Crops Food 2021, 12, 586–599. [Google Scholar] [CrossRef] [PubMed]
  48. Aslam, M.M.; Fritschi, F.B.; Di, Z.; Wang, G.; Li, H.; Lam, H.; Waseem, M.; Weifeng, X.; Zhang, J. Overexpres-sion of LaGRAS Enhances Phosphorus Acquisition via Increased Root Growth of Phosphorus-deficient White Lupin. Physiol. Plant. 2023, 175, e13962. [Google Scholar] [CrossRef]
  49. Koch, M.A.; Haubold, B.; Mitchell-Olds, T. Comparative Evolutionary Analysis of Chalcone Synthase and Al-cohol Dehydrogenase Loci in Arabidopsis, Arabis, and Related Genera (Brassicaceae). Mol. Biol. Evol. 2000, 17, 1483–1498. [Google Scholar] [CrossRef]
  50. Dai, X.; Zhao, P.X. psRNATarget: A Plant Small RNA Target Analysis Server. Nucleic Acids Res. 2011, 39, W155–W159. [Google Scholar] [CrossRef]
  51. Franz, M.; Lopes, C.T.; Huck, G.; Dong, Y.; Sumer, O.; Bader, G.D. Cytoscape.Js: A Graph Theory Library for Visualisation and Analysis. Bioinformatics 2016, 32, 309–311. [Google Scholar] [CrossRef] [PubMed]
  52. Shannon, P.; Markiel, A.; Ozier, O.; Baliga, N.S.; Wang, J.T.; Ramage, D.; Amin, N.; Schwikowski, B.; Ideker, T. Cytoscape: A Software Environment for Integrated Models of Biomolecular Interaction Networks. Genome Res. 2003, 13, 2498–2504. [Google Scholar] [CrossRef] [PubMed]
  53. Song, J.; Liu, D.; Xie, W.; Yang, Z.; Guo, L.; Liu, K.; Yang, Q.; Chen, L. BnPIR: Brassica napus Pan-genome Information Resource for 1689 Accessions. Plant Biotechnol. J. 2021, 19, 412–414. [Google Scholar] [CrossRef] [PubMed]
  54. Hammer, P.A.; Tibbitts, T.W.; Langhans, R.W.; McFarlane, J.C. Base-Line Growth Studies of ‘Grand Rapids’ Lettuce in Controlled Environments1. J. Am. Soc. Hort. Sci. 1978, 103, 649–655. [Google Scholar] [CrossRef]
  55. Huang, Z.; Fasco, M.J.; Kaminsky, L.S. Optimization of DNase I Removal of Contaminating DNA from RNA for Use in Quantitative RNA-PCR. BioTechniques 1996, 20, 1012–1020. [Google Scholar] [CrossRef] [PubMed]
  56. Livak, K.J.; Schmittgen, T.D. Analysis of Relative Gene Expression Data Using Real-Time Quantitative PCR and the 2−ΔΔCT Method. Methods 2001, 25, 402–408. [Google Scholar] [CrossRef]
Figure 1. The phylogenetic tree of B. napus and A. thaliana POD proteins. The maximum likelihood phylogenetic tree was constructed using MEGA 11 with 1000 bootstrap replicates. The phylogenetic tree was clustered into 5 subclades (A–E). A distinct color represents each subclade.
Plants 13 00942 g001
Figure 2. Gene structure of POD genes in B. napus. (a) The phylogenetic tree shows all the BnPOD genes in the five subclades. (b) Conserved motif analysis conducted using MEME Suite. A total of 10 motifs were predicted. (c) The domain organization of BnPODs. (d) Exon–intron organization of BnPODs. The A, B, C, D and E represent each subclades.
Plants 13 00942 g002
Figure 3. The analysis of the BnPOD promoter regions. The 2 kb sequences of the BnPOD gene-promoter regions were extracted from and analyzed using the PlantCARE database.
Plants 13 00942 g003
Figure 4. Circos plot of POD gene duplication in B. napus. The different colors represent the genes found in different (A–E subclades) subgroups, and the lines in the middle show segmental and tandem duplications between different chromosomes.
Plants 13 00942 g004
Figure 5. Dual synteny plots between (a) B. napus and A. thaliana, (b) B. napus and B. rapa, and (c) B. napus and B. oleracea genomes, with orthologous POD genes shown with red connecting lines.
Plants 13 00942 g005
Figure 6. A network illustration of the regulatory associations among the putative miRNAs and BnPOD genes. The red color indicates the miRNA complimentary site with the position of BnPODs gDNAs.
Plants 13 00942 g006
Figure 7. Tissue/organ-specific expression patterns of BnPOD genes in B. napus according to in silico RNA-seq data. DAF; days after flowering.
Plants 13 00942 g007
Figure 8. Expression patterns of selected BnPODs subjected to different abiotic stresses. The data are presented with ±standard errors. Statistically significant differences are denoted by asterisks * p ≤ 0.05. CK, control; D, drought; C, cold; S, salt; H, heat; Cd, cadmium; numbers 2, 4, and 6 indicate time intervals of 2 h, 4 h, and 6 h, respectively. The samples at 0 h were used as a control (CK).
Plants 13 00942 g008
Table 1. Sequences of ten predicted MEME motifs with InterProScan annotations.
MotifSequenceInterProScan Annotation
Motif-1DPRJAAALLRLHFHDCFVNGCDASVLLDSHeme peroxidases
Motif-2AACPGVVSCADILALAARDSVVLAGGPSWHeme peroxidases
Motif-3DPGTPNTFDNSYFKNLRQGKGLLQSDQALHeme peroxidases
Motif-4KDLVALSGAHTIGFAHCGSFTBRLHeme peroxidases
Motif-5AQLSPGFYDKSCPNAESIVRN-
Motif-6FFRAFAKAMVKMGNIGVLTGSQHeme peroxidases
Motif-7GDPDPTLBPTYAAQLRKKCPRHeme peroxidases
Motif-8SLRGFEVIDDIKAALE-
Motif-9PSPFDNVSQLITKFAAKGLNVHeme peroxidases
Motif-10VPLGRRDGRVSNASEHeme peroxidases
Disclaimer/Publisher’s Note: The statements, opinions and data contained in all publications are solely those of the individual author(s) and contributor(s) and not of MDPI and/or the editor(s). MDPI and/or the editor(s) disclaim responsibility for any injury to people or property resulting from any ideas, methods, instructions or products referred to in the content.

