Abstract
The GLK gene family plays a crucial role in the regulation of chloroplast development and participates in chlorophyll synthesis. However, the precise mechanism by which GLK contributes to citrus’s chlorophyll synthesis remains elusive. The GLK gene family causes variations in the photosynthetic capacity and chlorophyll synthesis of different citrus varieties. In this study, we identified tissue-specific members and the key CcGLKs involved in chlorophyll synthesis. A total of thirty CcGLK transcription factors (TFs) were discovered in the citrus genome, distributed across all nine chromosomes. The low occurrence of gene tandem duplication events and intronic variability suggests that intronic variation may be the primary mode of evolution for CcGLK TFs. Tissue-specific expression patterns were observed for various GLK family members; for instance, CcGLK12 and CcGLK15 were specifically expressed in the skin, while CcGLK30 was specific to the ovary, and CcGLK10, CcGLK6, CcGLK21, CcGLK2, CcGLK18, CcGLK9, CcGLK28, and CcGLK8 were specifically expressed in the leaves. CcGLK4, CcGLK5, CcGLK11, CcGLK23, CcGLKl7, CcGLK26, and CcGLK20 may participate in the regulation of the ALA, prochlorophylate, protoporphyrin IX, Mg-protoporphyrin IX, Chl b, T-Chl, MG-ProtoIX ME, and POR contents in citrus.
1. Introduction
Studies have shown that photosynthetic capacity and fruit quality are influenced by the transcription factor GLK (Golden 2-like), which exerts regulatory control over chloroplast development and chlorophyll synthesis [1]. The GLK transcription factor regulates chloroplast development and the formation of photosynthetic organs in Arabidopsis [2]. Previous studies have reported that GLK family transcription factors play a crucial role in regulating chloroplast development and chlorophyll accumulation in rice, peach, and other plants [3,4,5]. Additionally, GLK is involved in modulating various activities of the chlorophyll synthases, including δ-aminoacetobulinate dehydratase (ALAD), porphyrinogen deaminase (PGBD), protoporphyrinogen oxidase (PROTOX), etc. [6]. The induction of GLK leads to an upregulation in the production of diethylene protochlorophylates, chlorophyll a (Chl a), and chlorophyll b (Chl b) [7].
An overexpression of the GLK gene in tomato (Solanum lycopersicum) can increase its plastid number and pigment content [8]; GLK is essential for chloroplast development [9], while ZmGLK1 and ZmGLK2 regulate the transition from plastids to chloroplasts in maize’s vascular bundle sheath cells and mesophyll cells, respectively [10,11]. A deficiency in GLK leads to disturbed leaf chloroplast development [12], but an overexpression of GLK enhances chloroplast biogenesis and photosynthesis even in nonphotosynthetic organs such as roots and fruits [1,13]. Moreover, GLK plays a role in regulating multiple activities related to chlorophyll synthesis genes including δ-aminoacetobulinate dehydratase (ALAD), porphyrinogen deaminase (PGBD), protoporphyrinogen oxidase (PROTOX), magnesium chelatase (MGCH), magnesium protoporphyrin cyclase (MPECYC), and proprodol oxidoreductase (POR), which are regulated by the transcription factors MYB7 and GLK [5,6].
2. Results and Analysis
2.1. Chlorophyll Synthesis Precursor Content and Precursor Synthase Activity
The levels of the key precursor for chlorophyll synthesis were determined, revealing elevated concentrations of biledochromatogen, uroporphyrinogen III, fecal porphyrinogen III, Chl a, Chl b, and T-Chl. Additionally, variations in the growth period of different precursors were observed. The results showed that ALA, uroporphyrin III, Chl a, Chl b, and T-Chl exhibited rapid increases from D3 to D27, followed by slower increments from D37 to D47. PBG, fecal porphyrinogen III prochlorate protoporphyrin IX, and Mg-protoporphyrin IX showed continuous or rapid increases from D27 to D47 (Figure 1).
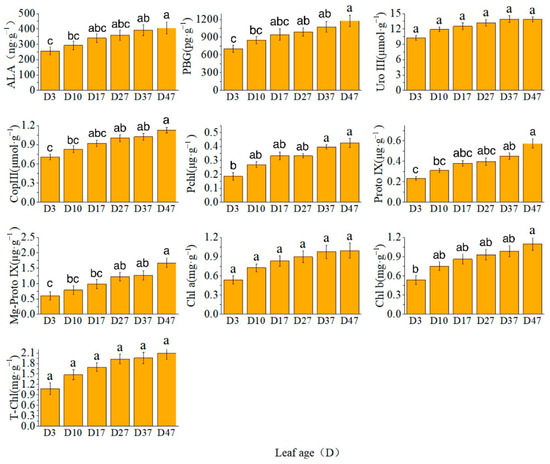
Figure 1.
Content of chlorophyll and its precursors. Different letters above the bar chart indicate significant differences between different treatments (p < 0.05).
The activity of glutamyl-tRNA reductase (Glu-tRNA) exhibited a rapid increase from D3 to D27, reaching a plateau thereafter. Conversely, the activities of uroporphyrinogen decarboxylase (UROD) and magnesium protoporphyrin IX methyltransferase (ChlM) showed a rapid increase from D27 to D47. However, the content of magnesium protoporphyrin IX monomethyl ester cyclase (Mg-ProtoIX ME) remained relatively unchanged (Figure 2).
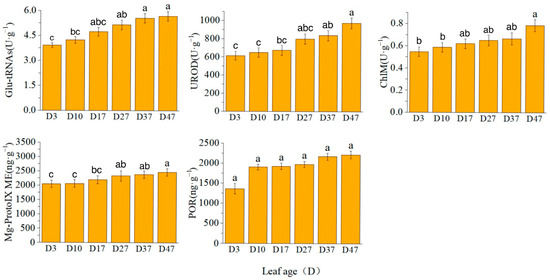
Figure 2.
Chlorophyll synthase activity/content. Different letters above the bar chart indicate significant differences between different treatments (p < 0.05).
2.2. Expression Levels of Key Genes for Chlorophyll Synthesis
The expression levels of CAO, CHLD, PORA, PORB, and PORC exhibited a continuous increase. Notably, CHLM played a regulatory role in the synthesis of magnesium protoporphyrin IX mono-methyl ester cyclase (Mg-ProtoIX ME), which was consistent with the observed changes in enzyme content and gene expression during each time period. Specifically, CHLH expression showed a rapid increase from D17 to D27, GUN4 expression increased from D3 to D27, and HEMA1 expression increased from D17 to D37 (Figure 3).
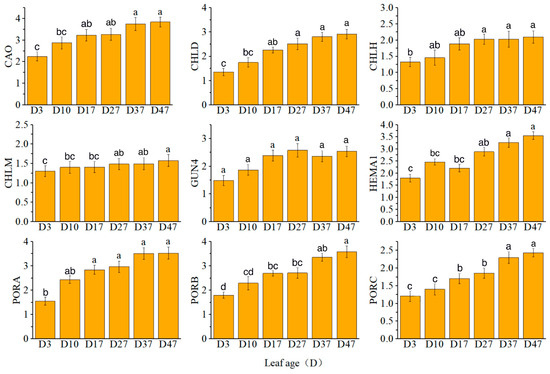
Figure 3.
Relative expression levels of key genes in chlorophyll synthesis. Different letters above the bar chart indicate significant differences between different treatments (p < 0.05).
2.3. Identification and Basic Physical and Chemical Properties of the CcGLK Proteins
A total of 30 eligible GLK protein sequences, designated CcGLK1~CcGLK30, were obtained. Through motif composition and phylogenetic analysis, the 30 CcGLKs were classified into three subfamilies. Additionally, their fundamental physicochemical properties were predicted and analyzed (Table 1). The transcription factors exhibited amino acid lengths ranging from 122 to 496, molecular weights ranging from 14,435.59 to 54,724.06, isoelectric points ranging from 5.57 to 10.46, instability coefficients ranging from 27.46 to 70.95, and hydrophobicity indices varying between −1.057 and −0.246.

Table 1.
Physical and chemical properties of CcGLKs.
2.4. Phylogeny, Conserved Motifs, and Gene Structure of CcGLKs
Based on its evolutionary relationships and a motif analysis, the GLK family is classified into three distinct groups. Subfamily I comprised 13 members, while subfamilies II and III consisted of 10 and 7 members, respectively (Figure 4).
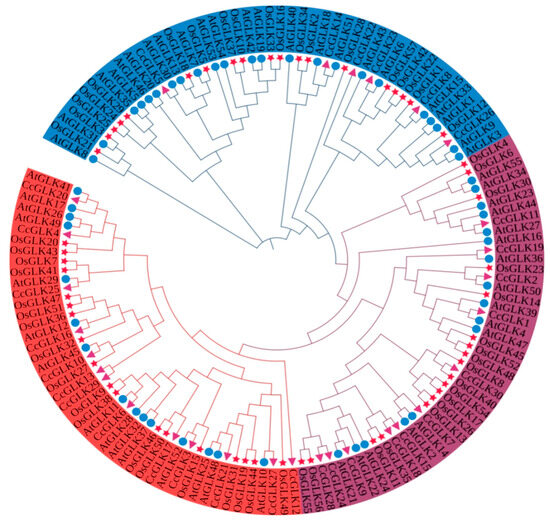
Figure 4.
GLK gene phylogenetic tree based on protein sequences of three species. Blue represents Group I, purple represents Group II, and red represents Group III. Circles of different colors represent different subgroups. △ represents Citrus, ☆ represents Oryza, and ○ represents Arabidopsis.
The conserved motifs of the 30 CcGLK proteins were analyzed using the online tool MEME, resulting in a total of 20 identified motifs (Figure 5A,B). The functional annotation of these motifs was performed using the CDD tool, revealing five putative functional annotations, namely Myb-CC-LHEQLE, Myb DNA binding, the Myb-CC-LHEQLE superfamily, the SANT superfamily, and Myb SHAQKYF. Notably, all CcGLKs exhibit structural conservation, with the presence of Myb DBD, Myb SHAQKYF, and the SANT superfamily throughout.
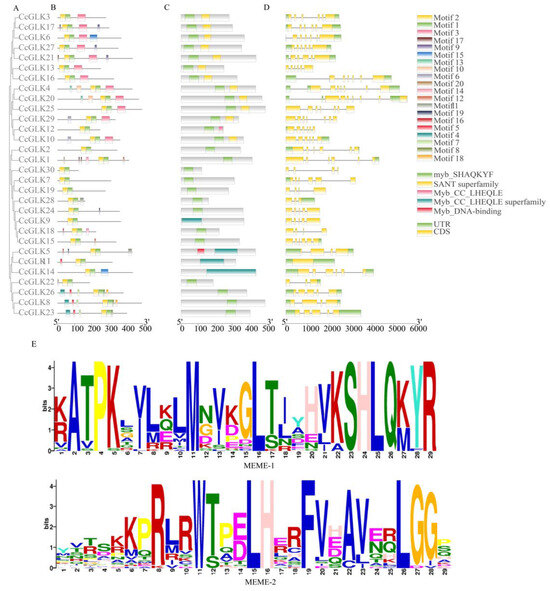
Figure 5.
(A) Protein evolution analysis, (B) conservative motifs, (C) conservative domains, (D) gene structure, and (E) conservative domain sequences. Exons, introns, and Untranslated Regions (UTRs) are represented by yellow rounded rectangles, black lines, and green rounded rectangles, respectively.
In the analysis of gene structure, a distinct distribution of intron regions was observed in the CcGLK gene (ranging from 0 to 8), and, generally, the CcGLKs that clustered together exhibited comparable exon/intron architectures (Figure 5D), encompassing both their intron count and exon length. Alterations in the intron count may represent a pivotal factor contributing to evolutionary diversification in terms of the gene’s structure and functionality.
To further assess the similarity between the citrus GLK domains, we aligned the 30 CcGLKs’ domain sequences using GeneDoc (Figure 6). The results revealed that the Myb DBD in CcGLKs contained an HLH structure with two highly conserved regions. The first helix consistently contained a 14-amino acid sequence PELHRR, while the second helix features an NI/VASHLQ motif at its beginning. These helices were separated by loops consisting of 22 amino acids.
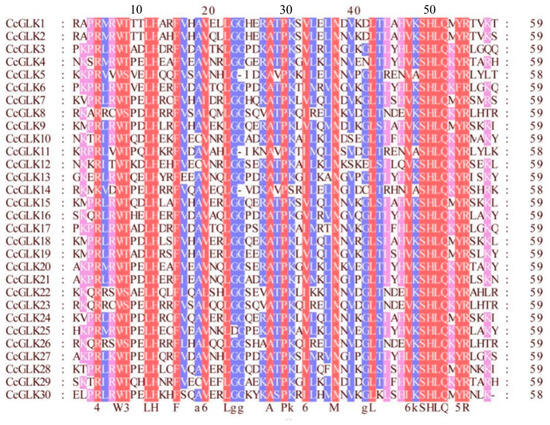
Figure 6.
Multiple sequence alignment of Citrus GLK’s conservative domain. The same sequence is displayed in the same color.
2.5. Chromosome Position, Collinearity Analysis, and Gene Duplication of CcGLKs
The distribution of GLK genes was non-uniform across chromosomes (Chr), with chromosome 2 harboring the highest number of CcGLK TFs (6), while only one GLK gene was present on chromosome 1 (Figure 7).
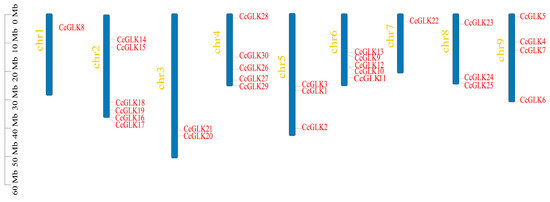
Figure 7.
Chromosome positions.
The gene duplication events in the Citrus genome were estimated through collinearity analysis, revealing that only two tandem duplication events occurred during their evolution. These events involved four genes (CcGLK15, CcGLK18, CcGLK28, CcGLK9) located on Chr 2, Chr 4, and Chr 6 (Figure 8A). The Ka/Ks values of the collinearity pairs were less than 1 (Table 2), indicating that the evolutionary trajectory of the CcGLK TFs has not been strongly influenced by purifying selection.
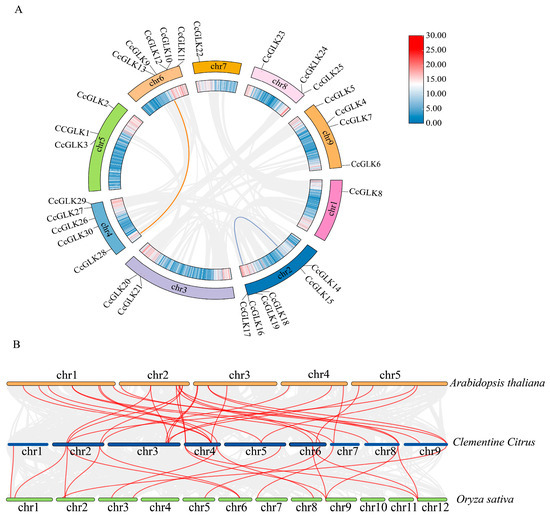
Figure 8.
Collinearity analysis of Citrus GLK. (A) GLK gene replication event. The gray line represents all autosomes in the citrus genome, while the blue and red lines represent CcGLK gene replication events. (B) Collinearity analysis of Citrus and two model plants. The yellow chromosome represents Arabidopsis, the green chromosome represents rice, and the blue chromosome represents citrus.
Table 2.
Ka and Ks values of collinear CsGLK gene pairs.
To further investigate the evolutionary mechanism of citrus CcGLKs, we constructed a comparative collinear map of Citrus with two model plants: Arabidopsis and rice. The results revealed that there were 30 homologs between Citrus and Arabidopsis (Table 3), as well as 18 between Citrus and rice (Table 4). Notably, 10 CcGLKs exhibited collinearity with both Arabidopsis and rice, suggesting their existence predates the divergence of monocots and dicots. Furthermore, the number of CcGLK-OsGLK pairs was found to be lower than that of the CcGLK-AtGLK pairs, indicating an earlier divergence between the common ancestor of rice and dicots compared to the divergence between Citrus and Arabidopsis.
Table 3.
Arabidopsis–Citrus GLK homologous pairs.
Table 4.
Rice–Citrus GLK homologous pairs.
2.6. Citrus GLK Expression Pattern
In order to investigate the tissue-specific expression patterns of the GLK gene family members, we generated expression profiles based on transcriptome sequencing data from five different tissues. Subsequently, a clustering analysis was performed to identify members with similar expression patterns (Figure 8). The results showed that CcGLK4, CcGLK20, CcGLK25, CcGLK16, CcGLK17, CcGLK7, CcGLK5, CcGLK11, and CcGLK26 exhibited relatively high expression levels in all four tissues [log2(FKPM + 1) > 3]. Conversely, low expression levels were observed for CcGLK30, CcGLK19, CcGLK18, CcGLK15, CcGLK9, CcGLK28, CcGLK24, and CcGLK29 across all four tissues [log2(FKPM + 1) < 1]. Notably, the pericarp specifically expressed CcGKL12 and CcGKL15, the ovary specifically expressed CcGLK30, and the leaves specifically expressed CcGLK10, CcGLK6, CcGLK21, CcGLK2, CcGLK18, CcGLK9, CcGLK28, and CcGLK8.
The highly expressed GLK members [log2(FPKM + 1) ≥ 5] were screened out to analyze whether they have similar expression patterns in the variety ‘Kanpei’. The results are shown in Figure 9; the highly expressed GLK members in Clementine also had high expression levels in ‘Kanpei’, and, at leaf maturity (D47), CcGLK2, CcGLK5, CcGLK11, CcGLK21, CcGLK23, and CcGLK25 all had relatively high expression levels.
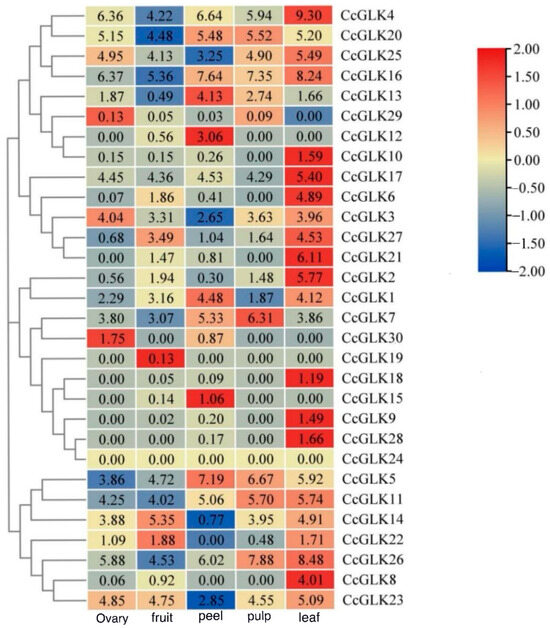
Figure 9.
Expression patterns of CcGLKs in different tissues.
Meanwhile, the expression of the CitGLKs exhibited temporal fluctuations across different growth stages. The expression levels of CcGLK2, CcGLK5, CcGLK11, CcGLK16, CcGLK20, CcGLK21, and CcGLK25 displayed oscillations during growth. However, they consistently demonstrated higher expression levels. Conversely, the expression levels of CitGLK4 and CitGLK17 were elevated from D3 to D17 but declined from D37 to D47 (Figure 10).
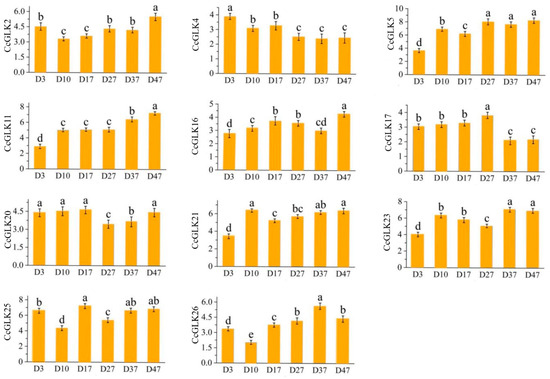
Figure 10.
Relative expression levels of CcGLKs at different leaf growth stages. Different letters above the bar chart indicate significant differences between different treatments (p < 0.05).
2.7. Correlation Analysis
The correlation analysis between the CcGLKs and chlorophyll precursors, as well as precursor synthase, revealed that CcGLK4 exhibited a negative correlation with protochlorophylls, protoporphyrin IX, and Mg-protoporphyrin IX. On the other hand, CcGLK5 and CcGLK11 displayed positive correlations with protochlorophyllin, protoporphyrin IX, and Mg-protoporphyrin IX. Additionally, both CcGLK11 and CcGLK23 showed positive correlations with the leaves’ Chl b and T-Chl content. Moreover, there was a positive correlation observed between CcGLK26 and ALA content. Furthermore, the content of Mg-ProtoIX ME demonstrated a positive correlation with CcGLK17 while the POR content exhibited a positive correlation with CcGLK20 (Figure 11).
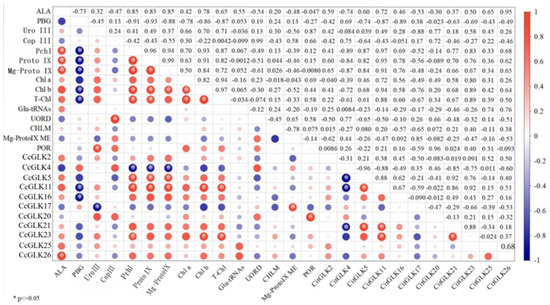
Figure 11.
Correlation between CcGLKs and chlorophyll precursors and precursor synthases.
3. Materials and Methods
3.1. Test Materials
In this experiment, ‘Kanpei’ {[(C. unshiu × C. sinensis) × C. sinensis] × C. reticulata} was used as the material, which was grafted on Ziyang xiangcheng. The growth conditions were optimal, with no presence of diseases or insect pests. Cultivation management and growth practices remained consistent throughout the study period. Sampling commenced on the third day after summer buds began to emerge, with whole shoots being collected every seven days during the early stage of budding, specifically targeting the second to third leaves from the base of each branch. During the middle and late stages of summer bud emergence, sampling was conducted every ten days. A total of six sampling time points were included in this study. The first 2–3 leaves were collected from the base of the branch, washed with tap water, moistened with deionized water, and subsequently dried (Figure 12). After thorough mixing, the sample was randomly divided into two portions. One portion was utilized for chlorophyll and precursor content determination, while the other part was rapidly frozen using liquid nitrogen and stored at −80 °C in a refrigerator for subsequent analysis of its enzyme activity and gene expression.
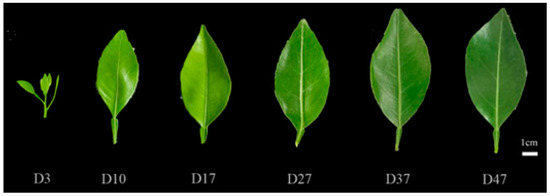
Figure 12.
Leaf growth of ‘Kanpei’ at different leaf ages.
3.2. GLK Gene Family Members and Prediction of Their Physicochemical Properties
Arabidopsis gene family protein sequences were downloaded from Plant TFDB V5.0 (http://planttfdb.gao-lab.org/index.php, accessed on 15 April 2022). Hidden Markov models (HMMs) were constructed using HMMER 3.0 software (http://hmmer.org/, accessed on 17 April 2022), and HMMER 3.0 software was employed to search for GLK family protein sequences in the citrus proteome (http://citrus.hzau.edu.cn/orange/index.php, version2, accessed on 17 April 2022). The CD Search website was utilized to examine the domains of all candidate GLK proteins in citrus. Finally, only those sequences with an intact MYB DNA-binding domain were retained and designated as CcGLK1~30 in Citrus clementina.
3.3. Chromosomal Distribution, Gene Duplication, and Collinearity Analysis of CcGLKs
The chromosomal distribution of GLK genes was retrieved from gff3 files in the Citrus pan-genome breeding database (http://citrus.hzau.edu.cn/index.php, accessed on 20 April 2022) and visualized using Map Inspect. Gene duplications in CcGLK TFs were analyzed using MC Scan X with default parameters. Additionally, collinearity profiles between citrus, Arabidopsis, and rice were constructed using TBtools software 2022.
3.4. Determination of Chlorophyll Synthesis Precursor Content and Key Precursor Synthases’ Activity
The chlorophyll content was determined using the method described by Moran and Porath [14]. A 0.5 g sample of the leaves was cut and placed in a 15 mL centrifuge tube, followed by the addition of 10 mL of 95% ethanol (v/v) and 5 mL of an 80% acetone solution. The mixture was kept in the dark for 24 h until the leaves turned white. OD values of 663 nm, 645 nm, and 470 nm were measured using an enzyme calibration system (Thermo Fisher Scientific, multiskan go, Waltham, MA, USA). We calculated the concentration of each pigment in the leaves (mg·g−1) according to the following equations:
Chl a content = 12.21 × OD663 − 2.81 × OD645.
Chl b content = 20.13 × OD645 − 5.03 × OD663.
Carotenoid content = (1000 × OD474 − 3.27a − 104b)/229 (a and b indicate the content of Chl a and Chl b, respectively).
T-Chl content = Chl a + Chl b.
The determination of Proto-IX, Mg-Proto IX, and Pchlide content was performed as described by Liu et al. [15]. A 0.3 g leaf sample was weighed, appropriate liquid nitrogen was added to it, and then it was ground. Then, 10 mL extraction solutions were added (acetone/ammonia water = 9:1), homogenized thoroughly, and then centrifuged at 12,000 rpm for 10 min. The OD of the supernatant was measured at 575 nm, 590 nm, and 628 nm, respectively. The content was calculated using the following equations:
Proto-IX content = 0.18016 × OD575 − 0.04036 × OD628 − 0.04515 × OD590.
Mg-Proto IX content = 0.06077 × OD590 − 0.01937 × OD575 − 0.003423 × OD628.
Pchlide content = 0.03563 × OD628 + 0.007225 × OD590 − 0.02955× OD575.
A Plant Glu-tRNAs ELISA Kit (catalog number: ZK-8377), plant Magnesium protoporphyrin IX methyltransferase (ChlM) ELISA Kit (catalog number: ZK-8381), and plant uroporphyrinogen decarboxylase (UROD) ELISA Kit (catalog number: ZK-8383) (Shanghai Zhen Ke Biological Technology Co., Ltd., Shanghai, China) were used to extract enzymes and determine the activity of key precursor synthases.
3.5. Characterization, Phylogenetic, and Physicochemical Properties Analysis of CcGLKs
MEGA was used to construct a phylogenetic tree based on the neighbor joining (N–J) method, with a bootstrap value of 1000. The tree was beautified using the Evolview website (http://120.202.110.254:8220/evolview, accessed on 16 April 2022). The specific conserved domains in the MAPK family were searched on NCBI (https://www.ncbi.nlm.nih.gov, accessed on 1 July 2021) and the conserved domains were predicted by InterProScan (http://www.ebi.ac.uk/Tools/InterProScan/1, accessed on 1 July 2021). MEME was used to identify conserved motifs and TB tools software was used to visualize the evolution motifs and e genetic structures of the GLK family in cultivated strawberry. Subcellular localization analysis was performed using WOLF PSORT (https://www.genscript.com/wolf-psort.html/, accessed on 5 July 2021).
3.6. The Analysis of the Expression Patterns of CcGLKs
Based on a transcriptomic data analysis, the expression of CcGLKs in various tissues (ovary, fruit, peel, pulp, leaf) was assessed and quantified as fragments per million kilobase (FPKM). To facilitate hierarchical clustering log2(FPKM + 1) was employed. The results were visualized using TBtools.
The expression changes of GLK members were analyzed by quantifying the GLK members in leaves (log2(FPKM + 1) ≥ 5) under different growth periods of ‘Kanpei’. CcGLK29, which exhibited the lowest expression in Period 1 (D3), was selected as the reference gene for normalization. The relative gene expression values were calculated using the 2−∆∆Ct method, and the primer sequences are listed in Table 5.
Table 5.
The primer sequences of CcGLKs.
3.7. Data Processing and Analysis
A significance analysis was performed using SPSS 23.0 software (p < 0.05), and the results were visualized using OriginPro 2022 software.
4. Discussion
Leaves are an important source organ of plants, controlling the production of photosynthetic products for flowers, fruits, shoots, and other plant structures. Optimal leaf growth is crucial to ensure an adequate supply of photosynthetic products for plant development and to achieve high-quality and high-yield fruit production. This study investigates the photosynthetic characteristics, chlorophyll precursor content, key enzyme activity, and gene expression in ‘Kanpei’ leaves while also identifying the expression patterns of the GLK genes across different tissues (ovary, fruit, peel, pulp, and leaf) and growth stages.
4.1. Differences in Key Precursor Content and Gene Expression of Chlorophyll Synthesis
Chl a and Chl b have key roles in the process of photosynthesis. Previous studies have demonstrated a positive correlation between the augmentation of photosynthetic activity and an increase in the content of Chl a and Chl b [16]. In this study, we found that a relatively low content of chlorophyll and its weak photosynthetic capacity may be caused by a low content of PBG, uroporphyrinogen III, fecal porphyrinogen III, and Mg-protoporphyrin IX.
At the molecular level, there is significant variation in the expression of the crucial genes involved in chlorophyll synthesis among different varieties. Glu-tRNA serves as a rate-limiting enzyme in the biosynthesis of tetrapyrrole precursor ALA, and its three Arabidopsis orthologs (HEMA1, HEMA2, and HEMA3) collectively encode isoforms of GluTR. The suppression of HEMA1 through antisense expression leads to reduced levels of Chl and ALA in plants [17]. Therefore, HEMA1 is considered to play a major role in the biosynthesis of the tetrapyrrole precursor ALA. This study found that the Glu-tRNA in ‘Kanpei’ may promote the synthesis of ALA in ‘Kanpei’. CHLH, GUN4, and CHLD encode magnesium chelatase (MgCh), which is involved in the synthesis of the chlorophyll precursor Mg-protoporphyrin IX [18]. Previous studies have found that POR is involved in the biosynthesis of Chl a [18]. The expression levels of three POR homologs in ‘Kanpei’ exhibited distinct temporal patterns, potentially contributing to the observed high Chl a content. CAO is a gene catalyzing the conversion of Chl a to Chl b [19]. As leaf age increased, the expression of the CAO gene exhibited a gradual increase, consequently resulting in a growth rate of the Chl a content in the leaves that was lower than that of Chl b.
4.2. Identification and Expression Analysis of GLK Genes in Citrus
The GLK-conserved motif SHAQKYF, which is present in plants and yeast, functions as a transcriptional activator by binding to an I-box located in the DNA-binding domain at the C terminus [20]. In addition to two conserved binding domains, Group I contains a unique Myb-CC-LHEQLE domain within its Myb-CC region, representing potential functional diversity. This domain exhibits a highly conserved LHEQLE sequence that responds to various abiotic stresses such as phosphate starvation signals [21]. Members of the GLK gene family possess both the highly conserved HLH region (DNA-binding domain) and the GCT cassette (involved in dimerization) [11]. In many well-characterized transcription regulators, the HLH domain binds DNA and facilitates dimerization [22,23].
The DNA-binding domain sequences belong to the GARP family of transcription factors [24]. Additionally, both regions of the HLH DNA-binding domain exhibit conservation [25]. In this study, we identified both conserved regions of the HLH structure; however, it should be noted that the conserved sequences in citrus are not identical. Through multiple sequence alignment analysis, we observed a high degree of conservation in the second helix region (VK/VASHLQ) of the CcGLK gene. Conversely, various variants were found in the first helix region, with L and H being relatively conserved. These findings suggest that functional divergence within the citrus GLK gene family may primarily arise from variations in the first helix region. Similar observations regarding the functional diversity resulting from sequence variation have also been reported in maize studies [25].
Multigene families often arise from gene duplication, with amplification mechanisms including fragmentation/tandem duplication, retrotransposition, and genome polyploidization [26,27]. This study identified only two instances of gene duplication events (CcGLK15-CcGLK18, CcGLK28-CcGLK9) in the GLK family, suggesting that gene duplication may not be the primary driver of GLK family members’ evolution. The frequent loss and insertion of new introns play a crucial role in gene evolution. In eukaryotes, there is a significant reduction in their intron numbers during evolution [28], while an analysis of segmental duplication events in rice indicated more lost than acquired introns [29]. Our study revealed substantial variability in the intron distribution within the CcGLK gene, ranging from 0 to 8, implying that intron variation had been a key factor driving its evolutionary history since its origin. Gene structural variation was not solely reflected by changes in the exon number but also by alterations in exon length. These variations suggested that the elongation and termination of transcription could modify gene structure, lead to s gain or loss of domains, and potentially affect protein function.
According to classical theory, gene duplication results in two possibilities for each copy of a gene: the original features are retained by one copy through negative selection and the remaining copies become pseudogenes without selection [30]. CcGLK15, CcGLK18, and CcGLK28 exhibited little or no expression in any tissue or organ, suggesting that they are either pseudogenes or silent paralogs. Furthermore, most members of these genes belong to Group II.
The GLK gene plays a crucial role in plant chloroplast development. However, this study reveals that GLK also exhibited relatively high expression levels in non-photosynthetic organs. In the tissue-specific expression analysis of maize GLK genes (ZmGLK2, ZmGLK9, ZmGLK28, ZmGLK35, ZmGLK44) in roots, these genes may be implicated in stress responses [25]. Similarly, within the non-photosynthetic organ pulp, higher expression levels of CcGLK4, CcGLK5, CcGLK7, CcGLK11, CcGLK20, CcGLK16, and CcGLK9 were observed, suggesting their potential involvement in regulating fruit’s development, maturity, or nutrient accumulation [1,31,32].
Several members of the GLK gene family exhibited significant expression levels across various leaf growth stages, including CcGLK2, CcGLK5, CcGLK11, CcGLK16, CcGLK20, CcGLK21, CcGLK23, and CcGLK25. These genes potentially play a crucial role in chlorophyll biosynthesis.
The induction of GLK has been demonstrated to upregulate three key processes [7]. Firstly, it promotes the generation of diethylene chlorophylate through a three-step reaction catalyzed by magnesium protoporphyrin IX monomeyl ester cyclase (CRD 1). Secondly, it enhances NADPH production for Chl a synthesis via DOLase (PORA, PORB, and PORC). Lastly, it facilitates the oxidation of chlorophyll A by chlorophyll A oxidase (CAO) to yield chlorophyll b. In this study, CcGLK5, CcGLK11, CcGLK17, CcGLK20, and CcGLK23 exhibited significantly positive correlations with prochlorophylates, protoporphyrin IX, Mg-protoporphyrin IX, Chl b, and T-Chl contents, as well as the Mg-ProtoIX ME and POR enzymes. Previous research demonstrated that GLK induced a substantial upregulation of HEMA1, CHLH, GUN4, CRD1, and CAO. However, it did not affect other steps preceding protoporphyrin IX formation. Additionally, the expression levels of two other subunits of magnesium chelatase (CHLD and CHLI) remained unchanged. These findings contrast with those reported by Matsumoto and Stephenson [33,34], indicated that GLK regulated the activity of magnesium protoporphyrin IX through its transcriptional regulation of CHLH and GUN4. Similar results were also observed in our study, where 30% of the identified CcGLK members showed significant positive correlation with prochlorophylls, protoporphyrin IX, Mg-protoporphyrin IX, and Chl b.
5. Conclusions
In this study, we investigated the variations in the photosynthetic capacity and chlorophyll synthesis of ‘Kanpei’ at different leaf ages, while also exploring the citrus GLK gene family to identify the tissue-specific members and key GLKs involved in chlorophyll synthesis.
A total of 30 CcGLK transcription factors (TFs) were identified in the Clementine genome, which were further classified into three subgroups and distributed across nine chromosomes. The presence of the GLK gene family predates the divergence between monocots and dicots. The relatively low occurrence of gene tandem duplication events and intronic variability suggests that intronic variation may represent the primary mode of evolution for CcGLK TFs. The expression of GLK family members was tissue-specific, with CcGLK12 and CcGLK15 specifically expressed in the peel, CcGLK30 specifically expressed in the ovary, and CcGLK10, CcGLK6, CcGLK21, CcGLK2, CcGLK18, CcGLK9, CcGLK28, and CcGLK8 specifically expressed in the leaf. Correlation analysis between the expression of individual CcGLKs and chlorophyll precursors, and precursor synthases indicated that CcGLK4, CcGLK5, CcGLK11, CcGLK23, CcGLK17, CcGLK26, and CcGLK20 may be key members involved in the regulation of ALA, protoporphyrin IX, Mg-protoporphyrin IX, Chl b, T-Chl, Mg-ProtoIX ME, and POR synthesis.
Author Contributions
Conceptualization, B.X. and Z.W.; Visualization, B.X., H.C., J.Y., J.W., W.W. and X.W.; Data Curation, H.C., J.Y., B.X., J.Y., J.W., M.Z., L.L., J.H. and S.H.; Writing—Original Draft Preparation, H.C., Q.M., J.Y., B.X. and G.S.; Writing—Review and Editing, B.X. and Z.W. All authors have read and agreed to the published version of the manuscript.
Funding
This study was funded by the National Key R&D Program of China (2021YFD1600802-02) and the Science and Technology Department of Sichuan Province, China (2021ZHCG0084).
Data Availability Statement
All the data generated or analyzed during this study are included in this published article.
Conflicts of Interest
The authors declare no conflicts of interest.
References
- Powell, A.L.T.; Nguyen, C.V.; Hill, T.; Cheng, K.L.; Figueroa-Balderas, R.; Aktas, H.; Ashrafi, H.; Pons, C.; Fernandez-Munoz, R.; Vicente, A.; et al. Uniform ripening Encodes a Golden 2-like Transcription Factor Regulating Tomato Fruit Chloroplast Development. Science 2012, 336, 1711–1715. [Google Scholar] [CrossRef] [PubMed]
- Waters, M.T.; Langdale, J.A. The making of a chloroplast. Embo J. 2009, 28, 2861–2873. [Google Scholar] [CrossRef] [PubMed]
- Yasumura, Y.; Moylan, E.C.; Langdale, J.A. A conserved transcription factor mediates nuclear control of organelle biogenesis in anciently diverged land plants. Plant Cell 2005, 17, 1894–1907. [Google Scholar] [CrossRef] [PubMed]
- Waters, M.T.; Moylan, E.C.; Langdale, J.A. GLK transcription factors regulate chloroplast development in a cell-autonomous manner. Plant J. 2008, 56, 432–444. [Google Scholar] [CrossRef] [PubMed]
- Chen, M.; Liu, X.; Shenghui, J.; Binbin, W. Transcriptomic and functional analyses reveal that PpGLK1 Regulates Chloroplast Development in Peach (Prunus persica). Front. Plant Sci. 2018, 9, 34. [Google Scholar] [CrossRef] [PubMed]
- Ampomah Dwamena, C.; Thrimawithana, A.H.; Dejnoprat, S.; Lewis, D.; Espley, R.V.; Allan, A.C. A kiwifruit (Actinidia deliciosa) R2R3-MYB transcription factor modulates chlorophyll and carotenoid accumulation. New Phytol. 2019, 221, 309–325. [Google Scholar] [CrossRef]
- Waters, M.T.; Wang, P.; Korkaric, M.; Capper, R.G.; Saunders, N.J.; Langdale, J.A. GLK Transcription Factors Coordinate Expression of the Photosynthetic Apparatus in Arabidopsis. Plant Cell 2009, 21, 1109–1128. [Google Scholar] [CrossRef]
- Pan, Y.; Bradley, G.; Pyke, K.; Ball, G.; Lu, C.; Fray, R.; Marshall, A.; Jayasuta, S.; Baxter, C.; van Wijk, R.; et al. Network Inference Analysis Identifies an APRR2-Like Gene Linked to Pigment Accumulation in Tomato and Pepper Fruits. Plant Physiol. 2013, 161, 1476–1485. [Google Scholar] [CrossRef]
- Adhikari, N.D.; Froehlich, J.E.; Strand, D.D.; Buck, S.M.; Kramer, D.M.; Larkin, R.M. GUN4-Porphyrin complexes bind the ChlH/GUN5 subunit of Mg-Chelatase and promote chlorophyll biosynthesis in arabidopsis. Plant Cell 2011, 23, 1449–1467. [Google Scholar] [CrossRef]
- Hall, L.N.; Rossini, L.; Cribb, L.; Langdale, J.A. GOLDEN 2: A novel transcriptional regulator of cellular differentiation in the maize leaf. Plant Cell 1998, 10, 925–936. [Google Scholar] [CrossRef]
- Rossini, L.; Cribb, L.; Martin, D.J.; Langdale, J.A. The maize golden2 gene defines a novel class of transcriptional regulators in plants. Plant Cell 2001, 13, 1231–1244. [Google Scholar] [CrossRef] [PubMed]
- Wang, P.; Fouracre, J.; Kelly, S.; Karki, S.; Gowik, U.; Aubry, S.; Shaw, M.K.; Westhoff, P.; Slamet-Loedin, I.H.; Quick, W.P.; et al. Evolution of GOLDEN2-LIKE gene function in C-3 and C-4 plants. Planta 2013, 237, 481–495. [Google Scholar] [CrossRef] [PubMed]
- Kobayashi, K.; Obayashi, T.; Masuda, T. Role of the G-box element in regulation of chlorophyll biosynthesis in Arabidopsis roots. Plant Signal. Behav. 2012, 7, 922–926. [Google Scholar] [CrossRef] [PubMed]
- Moran, R.; Porath, D. Chlorophyll determination in intact tissues using n,n-dimethylformamide. Plant Physiol. 1980, 65, 478–479. [Google Scholar] [CrossRef] [PubMed]
- Liu, J.; Wang, J.; Yao, X.; Zhang, Y.; Li, J.; Wang, X.; Xu, Z.; Chen, W. Characterization and fine mapping of thermo-sensitive chlorophyll deficit mutant1 in rice (Oryza sativa L.). Breed Sci. 2015, 65, 161–169. [Google Scholar] [CrossRef]
- Westbeek, M.; Pons, T.L.; Atkin, C. Analysis of differences in photosynthetic nitrogen use efficiency of alpine and lowland Poa species. Oecologia 1999, 120, 19–26. [Google Scholar] [CrossRef]
- Kumar, A.M.; Soll, D. Antisense HEMA1 RNA expression inhibits heme and chlorophyll biosynthesis in arabidopsis. Plant Physiol. 2000, 122, 49–56. [Google Scholar] [CrossRef]
- Tanaka, R.; Kobayashi, K.; Masuda, T. Tetrapyrrole Metabolism in Arabidopsis thaliana. Arab. Book 2011, 9, e0145. [Google Scholar] [CrossRef]
- Oster, U.; Tanaka, R.; Tanaka, A.; Rudiger, W. Cloning and functional expression of the gene encoding the key enzyme for chlorophyll b biosynthesis (CAO) from Arabidopsis thaliana. Plant J. Cell Mol. Biol. 2000, 21, 305–310. [Google Scholar] [CrossRef]
- Rose, A.; Meier, I.; Wienand, U. The tomato I-box binding factor LeMYBI is a member of a novel class of myb-like proteins. Plant J. Cell Mol. Biol. 1999, 20, 641–652. [Google Scholar] [CrossRef] [PubMed]
- Rubio, V. A conserved MYB transcription factor involved in phosphate starvation signaling both in vascular plants and in unicellular algae. Genes Dev. 2001, 15, 2122–2133. [Google Scholar] [CrossRef]
- Massari, M.E.; Murre, C. Helix-Loop-Helix Proteins: Regulators of Transcription in Eucaryotic Organisms. Mol. Cell. Biol. 2000, 20, 429–440. [Google Scholar] [CrossRef]
- Yang, Z.; Zhou, Y.; Wang, X.; Gu, S.; Yu, J.; Liang, G.; Yan, C.; Xu, C. Genomewide comparative phylogenetic and molecular evolutionary analysis of tubby-like protein family in Arabidopsis, rice, and poplar. Genomics 2008, 92, 246–253. [Google Scholar] [CrossRef]
- Hosoda, K.; Imamura, A.; Katoh, E.; Hatta, T.; Tachiki, M.; Yamada, H.; Mizuno, T.; Yamazaki, T. Molecular structure of the GARP family of plant Myb-related DNA binding motifs of the Arabidopsis response regulators. Plant Cell 2002, 14, 2015–2029. [Google Scholar] [CrossRef]
- Liu, F.; Xu, Y.; Han, G.; Zhou, L.; Ali, A.; Zhu, S.; Li, X. Molecular Evolution and Genetic Variation of G2-Like Transcription Factor Genes in Maize. PLoS ONE 2016, 11, e0161763. [Google Scholar] [CrossRef] [PubMed]
- Zhang, J. Evolution by gene duplication: An update. Trends Ecol. Evol. 2003, 18, 292–298. [Google Scholar] [CrossRef]
- Passardi, F.; Longet, D.; Penel, C.; Dunand, C. The class III peroxidase multigenic family in rice and its evolution in land plants. Phytochemistry 2004, 65, 1879–1893. [Google Scholar] [CrossRef] [PubMed]
- Rogozin, I.B.; Carmel, L.; Csuros, M.; Koonin, E.V. Origin and evolution of spliceosomal introns. Biol. Direct 2012, 7, 1–28. [Google Scholar] [CrossRef] [PubMed]
- Lin, H.; Zhu, W.; Silva, J.C.; Gu, X.; Buell, C.R. Intron gain and loss in segmentally duplicated genes in rice. Genome Biol. 2006, 7, R41. [Google Scholar] [CrossRef]
- Prince, V.E.; Pickett, F.B. Splitting pairs: The diverging fates of duplicated genes. Nat. Rev. Genet. 2002, 3, 827–837. [Google Scholar] [CrossRef] [PubMed]
- Li, L.; Zhu, B.; Fu, D.; Luo, Y. RIN transcription factor plays an important role in ethylene biosynthesis of tomato fruit ripening. J. Sci. Food Agric. 2011, 91, 2308–2314. [Google Scholar] [CrossRef]
- Li, G.; Chen, D.; Tang, X.; Liu, Y. Heterologous expression of kiwifruit (Actinidia chinensis) GOLDEN2-LIKE homolog elevates chloroplast level and nutritional quality in tomato (Solanum lycopersicum). Planta 2018, 247, 1351–1362. [Google Scholar] [CrossRef] [PubMed]
- Matsumoto, F.; Obayashi, T.; Sasaki-Sekimoto, Y.; Ohta, H.; Takamiya, K.-i.; Masuda, T. Gene expression profiling of the tetrapyrrole metabolic pathway in Arabidopsis with a mini-array system. Plant Physiol. 2004, 135, 2379–2391. [Google Scholar] [CrossRef] [PubMed]
- Stephenson, P.G.; Terry, M.J. Light signalling pathways regulating the Mg-chelatase branchpoint of chlorophyll synthesis during de-etiolation in Arabidopsis thaliana. Photochem. Photobiol. Sci. 2008, 7, 1243–1252. [Google Scholar] [CrossRef] [PubMed]
Disclaimer/Publisher’s Note: The statements, opinions and data contained in all publications are solely those of the individual author(s) and contributor(s) and not of MDPI and/or the editor(s). MDPI and/or the editor(s) disclaim responsibility for any injury to people or property resulting from any ideas, methods, instructions or products referred to in the content. |
© 2024 by the authors. Licensee MDPI, Basel, Switzerland. This article is an open access article distributed under the terms and conditions of the Creative Commons Attribution (CC BY) license (https://creativecommons.org/licenses/by/4.0/).