Abstract
Leaf color mutants are ideal materials for studying chlorophyll metabolism, chloroplast development, and photosynthesis in plants. We discovered a novel eggplant (Solanum melongena L.) mutant yl20 (yellow leaf 20) that exhibits yellow leaves. In this study, we compared the leaves of the mutant yl20 and wild type (WT) plants for cytological, physiological, and transcriptomic analyses. The results showed that the mutant yl20 exhibits abnormal chloroplast ultrastructure, reduced chlorophyll and carotenoid contents, and lower photosynthetic efficiency compared to the WT. Transcriptome data indicated 3267 and 478 differentially expressed genes (DEGs) between WT and yl20 lines in the cotyledon and euphylla stages, respectively, where most DEGs were downregulated in the yl20. Gene Ontology (GO) analysis revealed the “plastid-encoded plastid RNA polymerase complex” and the “chloroplast-related” terms were significantly enriched. Kyoto Encyclopedia of Genes and Genomes (KEGG) analysis demonstrated that the significantly enriched DEGs were involved in flavone and flavonol biosynthesis, porphyrin and chlorophyll metabolism, etc. We speculated that these DEGs involved in significant terms were closely related to the leaf color development of the mutant yl20. Our results provide a possible explanation for the altered phenotype of leaf color mutants in eggplant and lay a theoretical foundation for plant breeding.
1. Introduction
Leaf color variation arises from the mutations in genes associated with chloroplast development and chlorophyll metabolism, which further influences chlorophyll biosynthesis, photosynthesis, photomorphogenesis, and related signal transduction pathways [1]. The green color of the leaves is primarily attributed to substantial chlorophyll accumulation [2]. Chlorophyll accumulation is regulated by 27 genes encoding 15 enzymes that participate in the chlorophyll biosynthesis pathway [3,4]. Mutation to a cytochrome P-like gene alters the leaf color by affecting the chlorophyllbiosynthesis pathways in Brassica napus [5,6]. Transcriptome investigations can increase our understanding and provide novel insights into the mechanisms underlying leaf color formation [7,8]. For instance, a previous study focusing on the chlorophyll biosynthesis pathway reported a downregulation of most differentially expressed genes (DEGs) in the cucumber virescent leaf mutant, inhibiting chlorophyll synthesis [9]. These changes in the ratio of carotenoids to chlorophyll are the main factors driving the golden leaf coloration in Ginkgo biloba L. mutants [10].
Chloroplast formation is a pivotal prerequisite for heterotrophic to autotrophic transformation in plants [11]. The functions of chloroplast-related genes are generally divided into three categories: transcription/translation, photosynthesis, and metabolite synthesis [12]. Leaf color mutants offer a valuable genetic resource for investigating the process of chloroplast development. The etiolated/albino appearance of the leaf color mutant eal1 of maize is associated with changes in the levels of photosynthetic pigments and chloroplast development [13]. A pakchoi (Brassica rapa L. ssp. chinensis) mutant pylm, which has yellow leaves, also exhibits reduced total chlorophyll content and impaired chloroplast development [14]. A spontaneous B. napus (rapeseed) mutant ytg, which shows a delayed greening phenotype and retarded growth, was found to express BnaA02.YTG1, which encoded a chloroplast-localized tetratricopeptide repeat protein that participated in chloroplast RNA editing events [15].
Leaf color mutants are ideal reference materials for studying chloroplast structure and chlorophyll metabolism. Maintaining a normal chlorophyll level and a functioning chloroplast structure are essential for photosynthetic efficiency in plants [16], which directly influences plant growth and development [17,18]. Proteomic analysis of yellow and green G. biloba leaves can help identify the differentially expressed proteins related to energy metabolism, photosynthesis, and carbon fixation [19]. Over the past few decades, yellow leaf mutants of various crops, such as cucumber [7,20], maize [21], rice [22], wheat [23,24], and pakchoi [25], have been identified. Eggplant (Solanum melongena L.) is a popular vegetable crop, especially in Asia, Africa, the Mediterranean coast, and south-central Europe. The yellow leaf mutant chl861-2 of eggplant has been found to exhibit significantly lower levels of total chlorophyll, chlorophyll a (Chl a), and chlorophyll b (Chl b) and net photosynthetic rate (Pn) than the wild-type (WT) plant [26]. However, the molecular mechanisms underlying the leaf color mutations in eggplant are not yet well known. In the present study, we obtained a stable heritable yellow leaf mutant line yl20 through multi-generation inbreeding of eggplant. Our analyses revealed that a recessive nuclear gene regulated the leaf color in the mutant line.
To elucidate the mechanisms underlying leaf color formation and variation in eggplant, we analyzed and compared the cytological, physiological, and transcriptomic characters of the mutant and WT lines. Our results of the comparative analysis of the chloroplast structure, chlorophyll and carotenoid content, and transcriptomic data of mutant and WT lines can be used as a reference to further elucidate the mechanisms underlying leaf color formation in eggplant, laying a theoretical foundation for crop breeding.
2. Materials and Methods
2.1. Plant Material
The yellow leaf mutant yl20 line (Y) is a spontaneous leaf color mutant obtained from the green leaf WT line (G) of eggplant. In 2020, several yellow leaf mutants were found in homologous green leaf lines, and then the mutants were self-crossbred to obtain a homozygous yellow leaf line. This mutant was developed by the Institute of Cash Crops at the Hebei Academy of Agriculture and Forestry Sciences. The mutant plants exhibited yellow leaves in the cotyledon stage (YC), but two leaf color phenotypes (yellow young leaves and light-green mature leaves) in the euphylla stage (the young leaf (yellow) was designated YE) (Figure 1). The WT plants harbored green leaves in both the cotyledon (GC) and euphylla stages (the young leaf (green) was designated GE). The seeds were planted in seedling trays in a greenhouse on 4 January 2022. Later, 5–6 seedlings in the euphylla stage were transplanted into a plastic tunnel. We collected leaf samples of GC, YC, GE and YE from yl20 and WT, respectively, to research the physiological characteristics, chloroplast structure, and transcriptome sequencing analysis. All samples were collected at 9 am, transferred immediately frozen in liquid nitrogen, and stored at −80 °C until use.
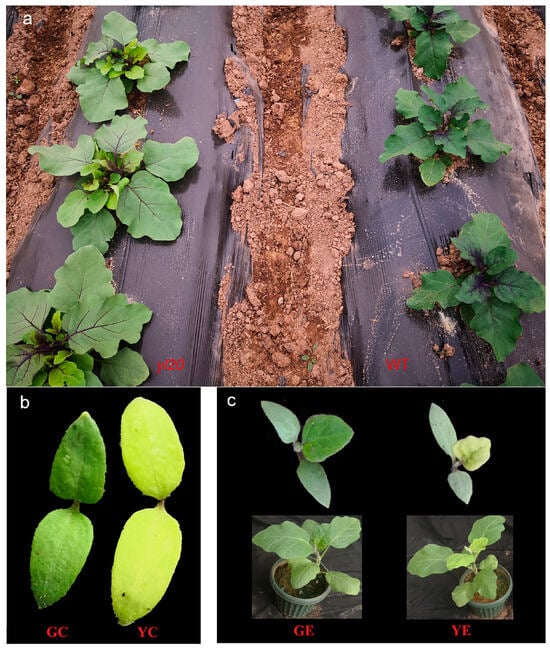
Figure 1.
Phenotypes of the leaf color mutant yl20 and the WT plant. (a) Field phenotype. (b) Cotyledon stage. (c) euphylla stage. YC, yellow leaves of yl20 in the cotyledon stage. YE, yellow young leaves of yl20 in the euphylla stage. GC, normal green leaves of WT in cotyledon stage. GE, normal green leaves of WT in the euphylla stage.
2.2. Transmission Electron Microscopy
The dissected leaf samples from the yl20 and WT lines were cut into smaller sections, approximately 1.0 mm × 1.0 mm × 1.0 mm in size. The samples were fixed in 4% glutaraldehyde for 24 h at 4 °C, washed thrice with 0.1 M phosphate buffer for 15 min each time, and fixed in 1% OsO4 for 7 h. Then, the samples were washed thrice with 0.1 M phosphate buffer for 15 min each time. Then, the samples were dehydrated, embedded, and polymerized [27]. For ultrastructural observations, 60 nm thick sections were cut using a Leica EMUC7 ultramicrotome (Leica Microsystems GmbH, Wentzler, Germany) and stained. Finally, the chloroplast ultrastructure was observed and photographed using a HITACHI HT7800 transmission electron microscope (HITACHI, Tokyo, Japan).
2.3. Biological and Physiological Characteristics
The number of leaves, leaf area, stem diameter, plant height, root length, plant weight and root weight were measured in the GE and YE. The seedlings were obtained 60 days after sowing, and 20 seedlings of each sample were measured. Leaf area was measured by a handheld laser leaf area meter (CI-203, CID Instruments Co., Ltd., Camas, WA, USA). Stem diameter was measured by a vernier caliper.
The chlorophyll and carotenoid contents of leaves were measured in the GC, YC, GE and YE. The leaf samples were obtained at 30 and 90 days after sowing. For chlorophyll extraction, 0.3 g fresh leaf samples were extracted using previously described methods [25]. The supernatants were collected to assess Chl a, Chl b, total chlorophyll, and carotenoid contents using an ultraviolet-visible spectrophotometer (UV-7500, Shanghai MAPADA Instruments Co., Ltd., Shanghai, China). The Pn of the third true leaf in the four euphylla stage of yl20 and WT were measured using a portable photosynthesis meter (LSPro-SD, ADC BioScientific Ltd., Hoddesdon, UK) in 10:00 am [28].
2.4. RNA Extraction and Transcriptome Sequencing
Total RNA was extracted from each sample using the DP441 Kit (Tiangen, Beijing, China), following the manufacturer’s instructions. The RNA was sequenced using the Illumina NovaSeq 6000 high-throughput sequencing platform (Illumina, San Diego, CA, USA) available at the Shanghai Majorbio Bio-pharm Technology Co., Ltd. (Shanghai, China).
2.5. Transcriptome and Differential Gene Expression Analyses
Raw reads were first filtered to obtain clean reads, which were then aligned to the eggplant reference genome (http://eggplant-hq.cn/Eggplant/home/index (accessed on 6 May 2022)) using TopHat software (Version V2.1.1) [29]. A given gene’s expression level was analyzed using the RSEM software (Version V1.3.3) and estimated by the transcripts per million reads (TPM) method. PCA analysis was obtained using the sklearn package in Python. The DEGs were analyzed using the DESeq2 software (Version 1.24.0) [30]. Transcripts that met the threshold criteria of |log2 (fold-change)| > 2 and q-value < 0.05 were considered DEGs. Heatmaps were obtained using the astcluster package in R. GO analysis were obtained using Goatools software (Version 0.6.5), and the Kyoto Encyclopedia of Genes and Genomes (KEGG) enrichment was performed using KOBAS software (Version 2.1.1). The GO terms and KEGG pathways were considered significantly enriched if corrected p (p-adjust) < 0.05. Volcano plot map, Venn diagram analysis and network analysis were conducted using the online platform of Majorbio Cloud. Platform (https://www.majorbio.com) (accessed on 18 May 2022).
2.6. Real-Time Quantitative PCR
The total RNA of leaves was extracted using Trizol and detected by 1% agarose gel electrophoresis. Reverse transcription was performed using the HiScript Q RT SuperMix for qPCR (Vazyme, Nanjing, China). Gene-specific primers were designed using Primer Premier V5.0 and actin as the reference gene (Supplementary Table S1). Then, quantitative real-time PCR (qRT-PCR) was performed using an ABI 7500 Real-Time PCR system (Applied Biosystems, Waltham, MA, USA) with the SYBR Green Supermix (Vazyme Biotech, Nanjing, China). The qRT-PCR conditions were set as follows: 95 °C for 5 min, followed by 40 cycles of 95 °C for 5 s, 50 °C for 30 s, and 72 °C for 40 s.
2.7. Statistical Analysis
Statistical analyses were conducted using SPSS (IBM SPSS Statistics ver.25.0; IBM Corp., Armonk, NY, USA). Duncan’s multiple range test was conducted to compare the differences between means. Differences with p < 0.05 were considered statistically significant. Relative expression levels of genes were calculated using the 2−∆∆Ct method [31]. All data were averaged over three replicates.
3. Results
3.1. Phenotypic Characteristics
The naturally occurring yl20 mutant of eggplant exhibited yellow YC and YE. However, at later stages of growth and development, the leaves gradually turned green. In contrast, the WT line had normal green GC and GE (Figure 1).
3.2. Ultrastructure Observation
We compared the chloroplast ultrastructure of the green leaves of WT lines and the yellow leaves of yl20 lines. The green leaves (Figure 2a–d) exhibited a lower degree of damage, with complete cell structure, no plasmolysis, complete chloroplast structure, a small amount of starch grains intracellularly, and regular arrangement of grana lamellae. In contrast, the young yellow leaves (Figure 2e,f) exhibited a relatively higher degree of damage, with chloroplasts almost disintegrated, damaged and blurred membrane structure, disorganized lamellar structure, grana almost disappeared, and slightly expanded lamellar structure. The mature yellow leaves exhibited a higher degree of damage (Figure 2g,h), with damaged membrane structure, uneven and irregularly arranged grana lamella, and almost absent grana.
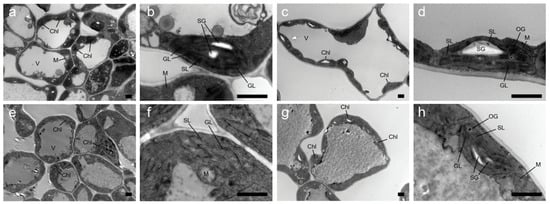
Figure 2.
The ultrastructure of chloroplasts from the leaf color mutant yl20 and WT. Chloroplasts ultrastructure of leaf at young leaf (a,b,e,f) and mature leaf (c,d,g,h) in WT (a–d) and yl20 (e–h). Bar = 20 μm Chl: chloroplast, V: vacuole, SG: starch grain, GL: granum thylakoid, SL: stromal lamella, OG: osmophilic gramules, M: mitochondria.
3.3. Biological and Physiological Characteristics
Seven different biological trait parameters were detected between GE and YE. The results showed that the stem diameter, plant height, plant weight, and root weight levels of YE were significantly lower than those of GE. The leaf number and leaf area levels were significantly higher than those of GE (Table S2).
The physiological datasets (Table 1) showed that the mutant samples exhibited significantly lower levels of total chlorophyll, Chl a, Chl b, and carotenoids than the WT samples in both cotyledon and euphylla stages. The Chl a/Chl b ratio was higher in the mutant samples in the cotyledon stage, but the ratio was higher in the WT samples in the euphylla stage. The mutant samples exhibited a lower chlorophyll/carotenoid ratio than the WT samples at all stages.

Table 1.
Comparison of chlorophyll and carotenoid contents of leaves in the leaf color mutant yl20 and the WT.
3.4. Transcriptome Analysis
A total of 12 RNA samples from the WT and mutant leaves in the cotyledon and euphylla stages were sequenced. After removing the low-quality reads, a total of 599,789,020 clean reads were obtained and mapped to the reference genome of eggplant (Supplementary Table S3). The Q20 and Q30 percentage values were >90%, and the mapping ratio was >96% (Supplementary Table S3). The principal component analysis indicated that the three biological repeats for each of the 12 samples were relatively clustered in the ordinal space (Supplementary Figure S1). The first (PC1) and the second principal components (PC2) accounted for 56.94% and 15.79% of the variation in the data, respectively. Taken together, these findings confirmed that the data were reliable and suitable for subsequent analyses.
3.5. Identification of DEGs
To assess the variations in gene expression, we used the TPM values to identify DEGs. We assessed the DEGs among the four groups: GC, GE, YC, and YE. We detected 3267 DEGs between the GC and YC groups (the GC and YC groups were the contrast and test groups, respectively). Between the GE and YE groups, 478 DEGs were identified (Figure 3). Thus, compared to the cotyledon stage, significantly fewer DEGs (14.63% of those in the cotyledon stage) were identified in the euphylla stage. Moreover, most DEGs were downregulated in the mutant samples in both cotyledon and euphylla stages (Figure 3).
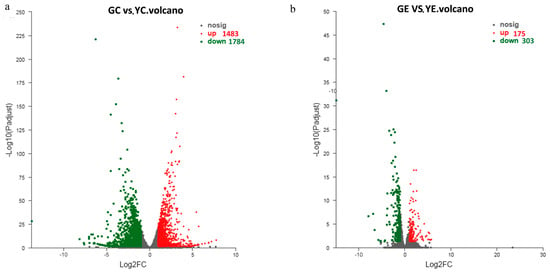
Figure 3.
Volcano plot map of differentially expressed genes (DEGs) in the leaf color mutant yl20 and the WT. (a) The DEGs number in the cotyledon stage. (b) The DEGs number in the euphylla stage. YC, yellow leaves of yl20 in the cotyledon stage. YE, yellow young leaves of yl20 in the euphylla stage. GC, normal green leaves of WT in cotyledon stage. GE, normal green leaves of WT in the euphylla stage.
3.6. GO Functional Analysis
Next, the identified DEGs were subjected to GO enrichment analysis. The biological functions of the DEGs were classified according to the GO database. In the cotyledon stage, a total of 79 GO terms were enriched (Supplementary Table S4), which were then divided into three categories: Biological process (BP; 41.1%), molecular function (MF; 48.7%), and cellular component (CC; 10.2%). The top 20 terms that were significantly enriched are listed in Figure 4a. The “plastid-encoded plastid RNA polymerase complex” (GO:0000427; p-adjust = 0.000462) was the most significant term. In the euphylla stage, the DEGs were enriched in 10 terms spanning the three categories: BP (4.10%), MF (5.74%), and CC (90.16%) (Figure 4b). The “chloroplast rRNA processing” (GO:1901259; p-adjust = 0.000666) and “chloroplast nucleoid” (GO:0042644; p-adjust = 0.000666) were the most significant terms.
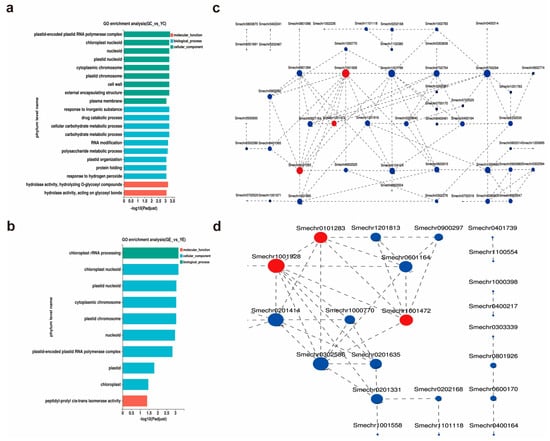
Figure 4.
GO classification and PPI network of DEGs in the leaf color mutant yl20 and the WT. (a) Analysis of GO terms enriched for the 3267 DEGs in the cotyledon stage. (b) Analysis of GO terms enriched for the 478 DEGs in the euphylla stage. (c) Analysis of PPI networks of the 74 DEGs associated with chloroplast in the cotyledon stage. (d) Analysis of PPI networks of the 43 DEGs associated with chloroplast in the euphylla stage. YC, yellow leaves of yl20 in the cotyledon stage. In the constructed networks, the size of a circle indicated the significance of the corresponding gene, with larger circles representing more important genes. Red circles represent the common DEGs between cotyledon and euphylla stages, and the blue circles represent the unique genes of the respective stages. YE, yellow young leaves of yl20 in the euphylla stage. GC, normal green leaves of WT in cotyledon stage. GE, normal green leaves of WT in the euphylla stage.
Since cytological observations revealed marked chloroplast damage in the mutant, we focused on the chloroplast-related GO terms. Among the 79 terms enriched in the cotyledon stage, four terms, comprising 74 genes, were related to chloroplast: “chloroplast nucleoid”, “chloroplast organization”, “chloroplast stroma”, and “chloroplast rRNA processing”. Of these 10 terms enriched in the euphylla stage, three terms, comprising 43 genes, were related to chloroplast: “chloroplast rRNA processing”, “chloroplast nucleoid”, and “chloroplast”. To further explore the gene interaction and identify the chloroplast-related core genes, expression interaction (protein–protein interaction (PPI)) networks of the 74 and 43 DEGs associated with chloroplast development were constructed. The PPI networks showed Smechr1001928 (Fln2), Smechr0101283 (CITRX), and Smechr1001472 (SODF2) as common DEGs between the cotyledon and euphylla stages. Moreover, these three DEGs were significantly downregulated in the mutant than WT in both growth stages (Supplementary Table S5). Of these three DEGs, the circle associated with Smechr1001928 was the largest in both growth stages, indicating that it might play a key role in yellow leaf formation (Figure 4c,d).
3.7. KEGG Functional Analysis
KEGG analysis was used to identify the enriched biological pathways. In the cotyledon stage, the upregulated and downregulated DEGs were significantly enriched in 6 and 11 pathways, respectively (Figure 5a,b). In the euphylla stage, the upregulated and downregulated DEGs were significantly enriched in four and two pathways, respectively (Figure 5a,b). The “porphyrin and chlorophyll metabolism” pathway was common between both growth stages, indicating that this pathway might be crucially related to leaf color mutation. Furthermore, nine and four DEGs in the cotyledon and euphylla stages, respectively, were associated with this pathway. Of these, three DEGs, Smechr0400217 (POR), Smechr0702754 (HemC), and Smechr100398 (POR), were common in both growth stages (Figure 6, Table 2).
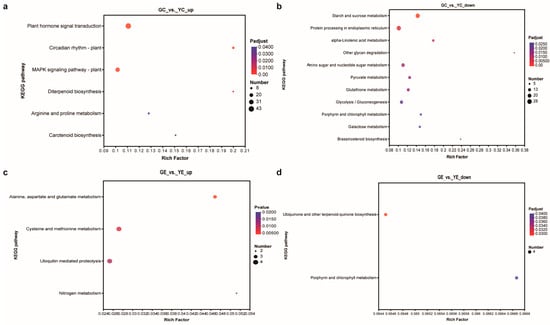
Figure 5.
The KEGG pathways enrichment analysis of DEGs in the leaf color mutant yl20 and the WT. (a) Analysis of KEGG pathways enriched for the upregulated DEGs in the cotyledon stage. (b) Analysis of KEGG pathways enriched for the downregulated DEGs in the cotyledon stage. (c) Analysis of KEGG pathways enriched for the upregulated DEGs in the euphylla stage. (d) Analysis of KEGG pathways enriched for the downregulated DEGs in the euphylla stage. YC, yellow leaves of yl20 in the cotyledon stage. YE, yellow young leaves of yl20 in the euphylla stage. GC, normal green leaves of WT in cotyledon stage. GE, normal green leaves of WT in the euphylla stage.
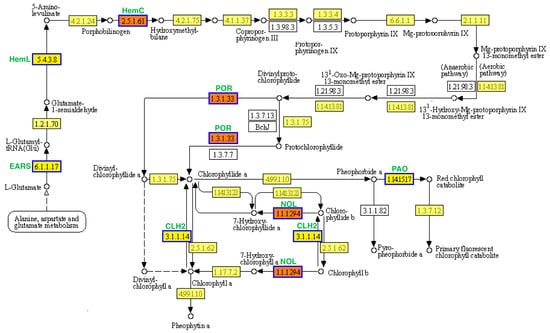
Figure 6.
Porphyrin and chlorophyll metabolism pathway analysis of DEGs in the leaf color mutant yl20 and the WT. Yellow boxes represents annotated genes, white boxes represent unknown genes, and red boxes represent the genes involved in both cotyledom and euphylla stages. The solid arrows represent the direct action and the dashed arrows represent the indirect action.

Table 2.
The DEGs of ‘porphyrin and chlorophyll metabolism’ pathway in the leaf color mutant yl20 and the WT.
3.8. Venn Analysis
Venn diagram analysis of the two group DEGs (Figure 7a) showed that 305 DEGs were in common between GE_vs._YE and GC_vs._YC. The heat map showed that most of those DEGs underwent downregulated expression in yl20 compared with WT (Figure 7b). By analyzing the 305 DEGs, we found 12 significantly enriched GO terms, and 10 of which were contained in CC and two in BP (Figure 7c, Supplementary Table S6). Further analysis of these terms revealed that 5 were related to plastids and 2 chloroplasts. KEGG analysis of the 305 DEGs indicated their relevance to 58 pathways in total. The top two significantly enriched pathways were ‘flavone and flavonol biosynthesis’ and ‘porphyrin and chlorophyll metabolism’ (Figure 7d, Supplementary Table S7).
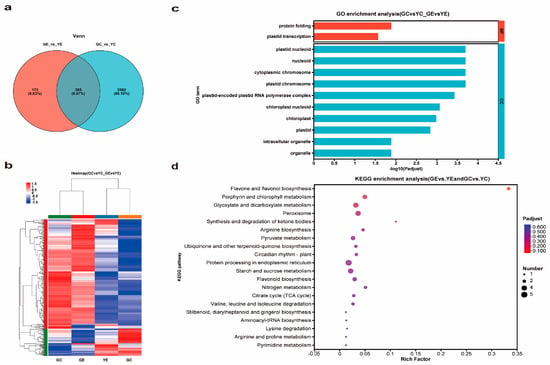
Figure 7.
DEGs and function analysis. (a) Venn diagram analysis of DEGs. (b) Heat map analysis of 305 DEGs. (c) GO analysis of 305 DEGs. (d) KEGG analysis of 305 DEGs.
3.9. qRT-PCR
To validate the reliability of transcriptomic sequencing data, we performed qRT-PCR analysis of the identified DEGs related to chlorophyll and chloroplast. The qRT-PCR results aligned well with the RNA-sequencing results (Supplementary Figure S2).
4. Discussion
Leaf color development is a complex and sensitive process regulated by various genes and metabolic pathways, such as chlorophyll biosynthesis and degradation, carotenoid synthesis and degradation, chloroplast development [32], and photosynthesis [33]. Leaf color mutants serve as excellent models for investigating the underlying mechanisms of leaf color alter. Though several studies have focused on the leaf color development process, the mechanisms underlying leaf color development in plants remain unclear.
4.1. Chlorophyll Metabolism
Chlorophyll synthesis is a highly regulated process, and several chlorophyll metabolism models have been established. Being the key photosynthetic pigment in plants, changes in chlorophyll content lead to substantial leaf color development [34]. In the present study, we detected significantly lower chlorophyll and carotenoid contents in yellow leaves than in green leaves, underscoring the phenotypic variation between WT and yl20 lines.
In plants, chlorophyll (Chl a plus Chl b) is potentially the most abundant and important tetrapyrrole [35]. Research has shown that the chlorophyll synthesis process comprises 16 steps, beginning with glutamyl-tRNA (Glu-tRNA) and ending with Chl b. It has been found that this process requires 16 enzymes encoded by more than 20 genes [36]. In Arabidopsis, chlorophyll synthesis is mediated by 15 enzymes encoded by 27 genes. Any alterations in the expression profile of these genes might lead to chlorophyll metabolic disorders and a yellow leaf phenotype in plants [37]. In the present study, we divided the chlorophyll synthesis process into seven key steps. The first step was the conversion of Glu-tRNA to δ-Aminolevulinic acid (ALA), and the second step was the conversion of ALA to porphyrinogen III. These reactions occur in anaerobic conditions. The third step was the conversion of porphyrinogen III to protoporphyrin IX. In the fourth step, protoporphyrin IX receives magnesium (Mg) ions and forms Mg-protoporphyrin. The fifth step was the conversion of Mg-protoporphyrin to protochlorophylide a. The sixth step was the conversion of protochlorophylide a to chlorophylide a. The final step involved the transformation of chlorophylide a into Chl a, which is interconverible with Chl b.
Previous studies have found that suppressing porphobilinogen deaminases (HemC) expression in transgenic tobacco leads to reduced urinary porphyrin 3 (PBGD) activity, restricting the transformation of PBG into Urogen III, resulting in a decreased chlorophyll content and light-green color of leaves [38]. Protochlorophyllide oxidoreductase (POR) is a light-dependent enzyme involved in chlorophyll biosynthesis and is essential for photosynthesis [2]. POR regulates the greening process during the development of heterotrophic cotyledons to true leaves of autotrophic seedlings. Reduced POR levels lead to delayed greening of etiolated seedlings [39]. Thus, regulation of POR expression is central to the chlorophyll biosynthetic pathway and seedling greening. For instance, POR overexpression leads to a higher chlorophyll content in transgenic tobacco [40]. Another study demonstrated that NYC1 encodes Chl b reductase, which catalyzes the degradation of Chl b to 7-hydroxymethyl Chl a [41]. The NYC1-like (NOL) protein is closely related to NYC1, and its overexpression drastically reduces Chl b levels [42,43].
In the present study, we identified nine chlorophyll metabolism-related DEGs between yl20 and WT in the cotyledon stage, all of which were downregulated in the mutant samples. We observed a four-fold higher expression of chlorophyll biosynthesis gene POR and the chlorophyllase gene CLH in green leaves than in yellow leaves in the cotyledon stage. Furthermore, in the euphylla stage, we identified four chlorophyll metabolism-related DEGs, all of which were downregulated in the mutant line. Previous studies have shown that the CLH1 and CLH2 genes in Arabidopsis are highly homologous to the CLH genes in eggplant. Notably, the deletion of CLH1 and CLH2 in Arabidopsis does not impact chlorophyll degradation. These findings indicated that downregulation of chlorophyll biosynthesis genes hinders chlorophyll synthesis. Thus, the lower chlorophyll content in the yl20 might be attributed to impaired expression of these genes. Moreover, decreasing total chlorophyll content results in relative elevation of carotenoid content. In addition, NOL/NYL downregulation leads to restricted conversion of Chl b to Chl a, resulting in a relative increase in Chl b content. Taken together, the relatively high carotenoid and Chl b contents in the yl20 mutant might be responsible for its yellow leaf phenotype.
4.2. Chloroplast Development
When seedlings are exposed to light, chlorophyll synthesis commences, and the cotyledons turn green [44]. Meanwhile, the etioplasts of cotyledons develop into chloroplasts, enabling the seedlings to become photoautotrophic [45]. Eventually, plant seedlings develop morphological traits required for photosynthesis in the presence of incident light, such as chloroplast-rich cotyledons and shortened hypocotyls. This mode of development is termed photomorphogenesis [46]. In leaves, starch is formed in the chloroplasts during the day from photo-assimilated CO2 [47]. Disrupted chloroplast function often leads to a severe phenotype, such as albino or pale green [48]. By observing the chloroplast ultrastructure, we found that the chloroplast was apoptotic in yl20. Through transcriptome analysis, we found many genes related to cell component of chloroplast were downregulated in yl20. Then we speculate that the yellow leaf formation was possibility produced by a reduction in the synthesis of proteins able to form the lipoprotein complex present in the chloroplast.
Chloroplast transcription machinery is complex and primarily regulates chloroplast development [49]. Generally, chloroplast-encoded genes are transcribed by either plastid-encoded polymerase (PEP) or nuclear-encoded polymerase (NEP) [11]. In a previous study, a set of maize (Zea mays) mutants lacking PEP-associated proteins were found to exhibit similar ivory/virescent pigmentation and corresponding reductions in their plastid ribosomes and photosynthetic complexes [50]. The DEGs identified in the present study were also enriched to PEP, the photomorphogenesis term, and starch and sucrose metabolism in the cotyledon stage. These genes were downregulated in the yl20 mutant, which might have led to the yellow leaf formation in the cotyledon.
Fructokinase-like proteins (FLNs) are phosphofructokinase-B (PfkB)-type carbohydrate kinases that act as part of the PEP complex [51]. Thioredoxinz (TRXz), regulates PEP-dependent chloroplast transcription and is essential for proper chloroplast development [52]. OsFLN1 and HSA1/OsFLN2 interact with rice TRXz (OsTRXz) to regulate chloroplast development, and OsTRXz knockout resulted in an albino phenotype similar to that of fln1 mutants [53]. In Arabidopsis, the fln2–4 mutant [54] is similar to other group of delayed greening mutants, such as YS1 [55] and dg1 [56]. Previous studies have shown that, on sucrose-containing medium, the fln2–4 mutant in Arabidopsis, which usually displays an albino phenotype, can develop greenish true leaves, while the fln2–1 and fln2–2 mutants still exhibited pale-green cotyledons and delayed greening [50]. The fln mutants exhibit severe phenotypes [50]. The fln1 mutants exhibit an albino phenotype. In contrast, the fln2 plants display chlorosis prior to leaf expansion but undergo delayed greening, remain autotrophic, can grow to maturity, and provide viable seeds [50]. As the fln2–4 mutant retains partially PEP activity, exogenous sucrose application leads to the development of the plastids in the fln2 mutants into fully functional chloroplasts, enabling them to eventually develop the green phenotype [50]. In the present study, abnormal chloroplast structure was detected in the yellow leaf mutant. Moreover, we identified Fln2 as one of the DEGs between the mutant and WT lines. This gene interacts with other genes and impacts chloroplast development. Fln2 was downregulated in yl20, potentially contributing to the yellow color leaf and delayed plant growth, similar to the fln2 mutant of Arabidopsis [50]. Thereby, Fln2 might be crucially involved in the leaf color development in the yl20 mutant. Our findings provided novel insights into the molecular mechanisms underlying leaf color regulation in eggplants.
Supplementary Materials
The following supporting information can be downloaded at: https://www.mdpi.com/article/10.3390/plants13060855/s1.
Author Contributions
The authors confirm contribution to the paper as follows: study conception and design: Y.W., X.P. and B.L.; data collection: B.L., J.Z., X.G. and X.S.; analysis and interpretation of results: B.L., J.Z. and P.T.; draft manuscript preparation: B.L. and P.T.; figures modification: B.L. All authors have read and agreed to the published version of the manuscript.
Funding
This work was supported by HAAFS Agriculture Science and Technology Innovation Project (2022KJCXZX-JZS-2), S&T Program of Hebei (21326309D), Hebei Open-field Vegetable Innovation Team of Modern Agro-industry Technology Research System (HBCT202414020), Basic Research Funds of Hebei Academy of Agriculture and Forestry Sciences (2021050202).
Data Availability Statement
The mRNA sequencing data were deposited in the NCBI sequence read archive (SRA) under the accession number PRJNA793301.
Acknowledgments
We thank Xiao Han and Xinze Zhao for providing technical assistance.
Conflicts of Interest
The authors declare that they have no conflicts of interest.
References
- Zhao, Y.; Wang, M.L.; Zhang, Y.Z.; Du, L.F.; Pan, T. A chlorophyll-reduced seedling mutant in oilseed rape, Brassica napus, for utilization in F1 hybrid production. Plant Breed. 2010, 119, 131–135. [Google Scholar] [CrossRef]
- Fu, M.; Zhou, Z.; Yang, X.; Liu, Z.; Zheng, J.; Huang, X.; Wang, L.; Ye, J.; Zhang, W.; Liao, Y.; et al. Comparative transcriptome and microbial community sequencing provide insight into yellow-leaf phenotype of Camellia japonica. BMC Plant Biol. 2021, 21, 416. [Google Scholar] [CrossRef]
- Nagata, N.; Tanaka, R.; Satoh, S.; Tanaka, A. Identification of a vinyl reductase gene for chlorophyll synthesis in Arabidopsis thaliana and implications for the evolution of Prochlorococcus species. Plant Cell 2005, 17, 233–240. [Google Scholar] [CrossRef]
- Tanaka, Y.; Sasaki, N.; Ohmiya, A. Biosynthesis of plant pigments: Anthocyanins, betalains and carotenoids. Plant J. 2008, 54, 733–749. [Google Scholar] [CrossRef]
- Yang, M.; Wan, S.; Chen, J.; Chen, W.; Wang, Y.; Li, W.; Wang, M.; Guan, R. Mutation to a cytochrome P(450)-like gene alters the leaf color by affecting the heme and chlorophyll biosynthesis pathways in Brassica napus. Plant J. 2023, 116, 432–445. [Google Scholar] [CrossRef]
- Liu, T.; Kawochar, M.A.; Liu, S.; Cheng, Y.; Begum, S.; Wang, E.; Zhou, T.; Liu, T.; Cai, X.; Song, B. Suppression of the tonoplast sugar transporter, StTST3.1, affects transitory starch turnover and plant growth in potato. Plant J. 2023, 113, 342–356. [Google Scholar] [CrossRef]
- Ding, Y.; Yang, W.; Su, C.; Ma, H.; Pan, Y.; Zhang, X.; Li, J. Tandem 13-Lipoxygenase Genes in a Cluster Confers Yellow-Green Leaf in Cucumber. Int. J. Mol. Sci. 2019, 20, 3102. [Google Scholar] [CrossRef]
- Liu, X.; Yu, H.; Han, F.; Li, Z.; Fang, Z.; Yang, L.; Zhuang, M.; Lv, H.; Liu, Y.; Li, Z.; et al. Differentially Expressed Genes Associated with the Cabbage Yellow-Green-Leaf Mutant in the ygl-1 Mapping Interval with Recombination Suppression. Int. J. Mol. Sci. 2018, 19, 2936. [Google Scholar] [CrossRef]
- Zhang, K.; Li, Y.; Zhu, W.; Wei, Y.; Njogu, M.K.; Lou, Q.; Li, J.; Chen, J. Fine Mapping and Transcriptome Analysis of Virescent Leaf Gene v-2 in Cucumber (Cucumis sativus L.). Front. Plant Sci. 2020, 11, 570817. [Google Scholar] [CrossRef]
- Li, W.; Yang, S.; Lu, Z.; He, Z.; Ye, Y.; Zhao, B.; Wang, L.; Jin, B. Cytological, physiological, and transcriptomic analyses of golden leaf coloration in Ginkgo biloba L. Hortic. Res. 2018, 5, 12. [Google Scholar] [CrossRef]
- Liu, X.; Zhang, X.; Cao, R.; Jiao, G.; Hu, S.; Shao, G.; Sheng, Z.; Xie, L.; Tang, S.; Wei, X.; et al. CDE4 encodes a pentatricopeptide repeat protein involved in chloroplast RNA splicing and affects chloroplast development under low-temperature conditions in rice. J. Integr. Plant Biol. 2021, 63, 1724–1739. [Google Scholar] [CrossRef]
- Kirchhoff, H. Chloroplast ultrastructure in plants. New Phytol. 2019, 223, 565–574. [Google Scholar] [CrossRef]
- Li, C.; Wang, J.; Hu, Z.; Xia, Y.; Huang, Q.; Yu, T.; Yi, H.; Lu, Y.; Wang, J.; Cao, M. A valine residue deletion in ZmSig2A, a sigma factor, accounts for a revertible leaf-color mutation in maize. Crop J. 2021, 9, 1330–1343. [Google Scholar] [CrossRef]
- Zhang, K.; Liu, Z.; Shan, X.; Li, C.; Tang, X.; Chi, M.; Feng, H. Physiological properties and chlorophyll biosynthesis in a Pak-choi (Brassica rapa L. ssp. chinensis) yellow leaf mutant, pylm. Acta Physiol. Plant. 2016, 39, 22. [Google Scholar] [CrossRef]
- Zhang, J.; Sui, C.; Liu, H.; Chen, J.; Han, Z.; Yan, Q.; Liu, S.; Liu, H. Effect of chlorophyll biosynthesis-related genes on the leaf color in Hosta (Hosta plantaginea Aschers) and tobacco (Nicotiana tabacum L.). BMC Plant Biol. 2021, 21, 45. [Google Scholar] [CrossRef]
- Xie, S.; Nie, L.; Zheng, Y.; Wang, J.; Zhao, M.; Zhu, S.; Hou, J.; Chen, G.; Wang, C.; Yuan, L. Comparative Proteomic Analysis Reveals That Chlorophyll Metabolism Contributes to Leaf Color Changes in Wucai (Brassica campestris L.) Responding to Cold Acclimation. J. Proteome Res. 2019, 18, 2478–2492. [Google Scholar] [CrossRef]
- Reinbothe, C.; El Bakkouri, M.; Buhr, F.; Muraki, N.; Nomata, J.; Kurisu, G.; Fujita, Y.; Reinbothe, S. Chlorophyll biosynthesis: Spotlight on protochlorophyllide reduction. Trends Plant Sci. 2010, 15, 614–624. [Google Scholar] [CrossRef]
- Wang, P.; Grimm, B. Organization of chlorophyll biosynthesis and insertion of chlorophyll into the chlorophyll-binding proteins in chloroplasts. Photosynth. Res. 2015, 126, 189–202. [Google Scholar] [CrossRef]
- Liu, X.; Yu, W.; Wang, G.; Cao, F.; Cai, J.; Wang, H. Comparative Proteomic and Physiological Analysis Reveals the Variation Mechanisms of Leaf Coloration and Carbon Fixation in a Xantha Mutant of Ginkgo biloba L. Int. J. Mol. Sci. 2016, 17, 1794. [Google Scholar] [CrossRef]
- Song, M.; Wei, Q.; Wang, J.; Fu, W.; Qin, X.; Lu, X.; Cheng, F.; Yang, K.; Zhang, L.; Yu, X.; et al. Fine Mapping of CsVYL, Conferring Virescent Leaf through the Regulation of Chloroplast Development in Cucumber. Front. Plant Sci. 2018, 9, 432. [Google Scholar] [CrossRef]
- Roth, R.; Sawers, R.J.; Munn, H.L.; Langdale, J.A. Plastids undifferentiated, a nuclear mutation that disrupts plastid differentiation in Zea mays L. Planta 2001, 213, 647–658. [Google Scholar] [CrossRef]
- Liu, W.; Fu, Y.; Hu, G.; Si, H.; Zhu, L.; Wu, C.; Sun, Z. Identification and fine mapping of a thermo-sensitive chlorophyll deficient mutant in rice (Oryza sativa L.). Planta 2007, 226, 785–795. [Google Scholar] [CrossRef]
- Wu, H.; Shi, N.; An, X.; Liu, C.; Fu, H.; Cao, L.; Feng, Y.; Sun, D.; Zhang, L. Candidate Genes for Yellow Leaf Color in Common Wheat (Triticum aestivum L.) and Major Related Metabolic Pathways according to Transcriptome Profiling. Int. J. Mol. Sci. 2018, 19, 1594. [Google Scholar] [CrossRef]
- Rong, W.; Wang, X.; Wang, X.; Massart, S.; Zhang, Z. Molecular and Ultrastructural Mechanisms Underlying Yellow Dwarf Symptom Formation in Wheat after Infection of Barley Yellow Dwarf Virus. Int. J. Mol. Sci. 2018, 19, 1187. [Google Scholar] [CrossRef]
- Zhang, K.; Mu, Y.; Li, W.; Shan, X.; Wang, N.; Feng, H. Identification of two recessive etiolation genes (py1, py2) in pakchoi (Brassica rapa L. ssp. chinensis). BMC Plant Biol. 2020, 20, 68. [Google Scholar] [CrossRef]
- Liu, F.Z.; Zhang, Y.; Yang, J.K.; Chen, Y.H.; Shu, J.S.; Li, S.P.; Chen, L.L. Characterization and Genetic Analysis of a Yellowing Mutant of Eggplant Leaf Color. Acta Hortic. Sin. 2020, 47, 2340–2348. [Google Scholar] [CrossRef]
- Guan, H.; Xu, X.; He, C.; Liu, C.; Liu, Q.; Dong, R.; Liu, T.; Wang, L. Fine Mapping and Candidate Gene Analysis of the Leaf-Color Gene ygl-1 in Maize. PLoS ONE 2016, 11, e0153962. [Google Scholar] [CrossRef]
- Alvarado-Sanabria, O.; Garcés-Varón, G.; Restrepo-Díaz, H. Physiological Response of Rice Seedlings (Oryza sativa L.) Subjected to Different Periods of Two Night Temperatures. J. Stress Physiol. Biochem. 2017, 13, 35–43. [Google Scholar]
- Kim, D.; Pertea, G.; Trapnell, C.; Pimentel, H.; Kelley, R.; Salzberg, S.L. TopHat2: Accurate alignment of transcriptomes in the presence of insertions, deletions and gene fusions. Genome Biol. 2013, 14, R36. [Google Scholar] [CrossRef]
- Anders, S.; Huber, W. Differential expression analysis for sequence count data. Genome Biol. 2010, 11, R106. [Google Scholar] [CrossRef]
- Schmittgen, T.D.; Livak, K.J. Analyzing real-time PCR data by the comparative C(T) method. Nat. Protoc. 2008, 3, 1101–1108. [Google Scholar] [CrossRef]
- Yao, G.; Zhang, H.; Leng, B.; Cao, B.; Shan, J.; Yan, Z.; Guan, H.; Cheng, W.; Liu, X.; Mu, C. A large deletion conferring pale green leaves of maize. BMC Plant Biol. 2023, 23, 360. [Google Scholar] [CrossRef]
- Fukuyama, K. Structure and function of plant-type ferredoxins. Photosynth. Res. 2004, 81, 289–301. [Google Scholar] [CrossRef]
- Chen, T.; Zhang, Y.; Zhao, L.; Zhu, Z.; Lin, J.; Zhang, S.; Wang, C. Physiological character and gene mapping in a new green- revertible albino mutant in rice. J. Genet. Genom. 2007, 34, 331–338. [Google Scholar] [CrossRef]
- Reinbothe, S.; Reinbothe, C. The regulation of enzymes involved in chlorophyll biosynthesis. Eur. J. Biochem. 1996, 237, 323–343. [Google Scholar] [CrossRef]
- Zhang, H.; Li, X.; Yang, Y.; Hu, K.; Zhou, X.; Wen, J.; Yi, B.; Shen, J.; Ma, C.; Fu, T.; et al. BnaA02.YTG1, encoding a tetratricopeptide repeat protein, is required for early chloroplast biogenesis in Brassica napus. Crop J. 2022, 10, 597–610. [Google Scholar] [CrossRef]
- Meier, S.; Tzfadia, O.; Vallabhaneni, R.; Gehring, C.; Wurtzel, E.T. A transcriptional analysis of carotenoid, chlorophyll and plastidial isoprenoid biosynthesis genes during development and osmotic stress responses in Arabidopsis thaliana. BMC Syst. Biol. 2011, 5, 77. [Google Scholar] [CrossRef]
- Xue, Y.; Li, X.; Mao, M.; He, Y.; Owusu Adjei, M.; Zhou, X.; Hu, H.; Liu, J.; Li, X.; Ma, J. AbhemC encoding porphobilinogen deaminase plays an important role in chlorophyll biosynthesis and function in albino Ananas comosus var. bracteatus leaves. PeerJ 2021, 9, e11118. [Google Scholar] [CrossRef]
- Reinbothe, S.; Pollmann, S.; Springer, A.; James, R.J.; Tichtinsky, G.; Reinbothe, C. A role of Toc33 in the protochlorophyllide-dependent plastid import pathway of NADPH: Protochlorophyllide oxidoreductase (POR) A. Plant J. 2005, 42, 1–12. [Google Scholar] [CrossRef]
- Zhang, S.; Heyes, D.J.; Feng, L.; Sun, W.; Johannissen, L.O.; Liu, H.; Levy, C.W.; Li, X.; Yang, J.; Yu, X.; et al. Structural basis for enzymatic photocatalysis in chlorophyll biosynthesis. Nature 2019, 574, 722–725. [Google Scholar] [CrossRef]
- Lai, B.; Hu, B.; Qin, Y.H.; Zhao, J.T.; Wang, H.C.; Hu, G.B. Transcriptomic analysis of Litchi chinensis pericarp during maturation with a focus on chlorophyll degradation and flavonoid biosynthesis. BMC Genom. 2015, 16, 225. [Google Scholar] [CrossRef]
- Sato, Y.; Morita, R.; Katsuma, S.; Nishimura, M.; Tanaka, A.; Kusaba, M. Two short-chain dehydrogenase/reductases, NON-YELLOW COLORING 1 and NYC1-LIKE, are required for chlorophyll b and light-harvesting complex II degradation during senescence in rice. Plant J. 2009, 57, 120–131. [Google Scholar] [CrossRef]
- Jia, T.; Ito, H.; Tanaka, A. The Chlorophyll b Reductase NOL Participates in Regulating the Antenna Size of Photosystem II in Arabidopsis Thaliana. Procedia Chem. 2015, 14, 422–427. [Google Scholar] [CrossRef]
- Von Arnim, A.; Deng, X.W. Light Control of Seedling Development. Annu. Rev. Plant Physiol. Plant Mol. Biol. 1996, 47, 215–243. [Google Scholar] [CrossRef]
- Shimada, H.; Mochizuki, M.; Ogura, K.; Froehlich, J.E.; Osteryoung, K.W.; Shirano, Y.; Shibata, D.; Masuda, S.; Mori, K.; Takamiya, K. Arabidopsis cotyledon-specific chloroplast biogenesis factor CYO1 is a protein disulfide isomerase. Plant Cell 2007, 19, 3157–3169. [Google Scholar] [CrossRef]
- Han, X.; Huang, X.; Deng, X.W. The Photomorphogenic Central Repressor COP1: Conservation and Functional Diversification during Evolution. Plant Commun. 2020, 1, 100044. [Google Scholar] [CrossRef]
- Bürgy, L.; Eicke, S.; Kopp, C.; Jenny, C.; Lu, K.J.; Escrig, S.; Meibom, A.; Zeeman, S.C. Coalescence and directed anisotropic growth of starch granule initials in subdomains of Arabidopsis thaliana chloroplasts. Nat. Commun. 2021, 12, 6944. [Google Scholar] [CrossRef]
- Albrecht, V.; Simková, K.; Carrie, C.; Delannoy, E.; Giraud, E.; Whelan, J.; Small, I.D.; Apel, K.; Badger, M.R.; Pogson, B.J. The cytoskeleton and the peroxisomal-targeted snowy cotyledon3 protein are required for chloroplast development in Arabidopsis. Plant Cell 2010, 22, 3423–3438. [Google Scholar] [CrossRef]
- Yu, Q.B.; Huang, C.; Yang, Z.N. Nuclear-encoded factors associated with the chloroplast transcription machinery of higher plants. Front. Plant Sci. 2014, 5, 316. [Google Scholar] [CrossRef]
- Williams-Carrier, R.; Zoschke, R.; Belcher, S.; Pfalz, J.; Barkan, A. A major role for the plastid-encoded RNA polymerase complex in the expression of plastid transfer RNAs. Plant Physiol. 2014, 164, 239–248. [Google Scholar] [CrossRef]
- Gilkerson, J.; Perez-Ruiz, J.M.; Chory, J.; Callis, J. The plastid-localized pfkB-type carbohydrate kinases FRUCTOKINASE-LIKE 1 and 2 are essential for growth and development of Arabidopsis thaliana. BMC Plant Biol. 2012, 12, 102. [Google Scholar] [CrossRef]
- Arsova, B.; Hoja, U.; Wimmelbacher, M.; Greiner, E.; Ustün, S.; Melzer, M.; Petersen, K.; Lein, W.; Börnke, F. Plastidial thioredoxin z interacts with two fructokinase-like proteins in a thiol-dependent manner: Evidence for an essential role in chloroplast development in Arabidopsis and Nicotiana benthamiana. Plant Cell 2010, 22, 1498–1515. [Google Scholar] [CrossRef]
- He, L.; Zhang, S.; Qiu, Z.; Zhao, J.; Nie, W.; Lin, H.; Zhu, Z.; Zeng, D.; Qian, Q.; Zhu, L. FRUCTOKINASE-LIKE PROTEIN 1 interacts with TRXz to regulate chloroplast development in rice. J. Integr. Plant Biol. 2018, 60, 94–111. [Google Scholar] [CrossRef]
- Huang, C.; Yu, Q.B.; Lv, R.H.; Yin, Q.Q.; Chen, G.Y.; Xu, L.; Yang, Z.N. The reduced plastid-encoded polymerase-dependent plastid gene expression leads to the delayed greening of the Arabidopsis fln2 mutant. PLoS ONE 2013, 8, e73092. [Google Scholar] [CrossRef]
- Zhou, W.; Cheng, Y.; Yap, A.; Chateigner-Boutin, A.L.; Delannoy, E.; Hammani, K.; Small, I.; Huang, J. The Arabidopsis gene YS1 encoding a DYW protein is required for editing of rpoB transcripts and the rapid development of chloroplasts during early growth. Plant J. 2009, 58, 82–96. [Google Scholar] [CrossRef]
- Chi, W.; Ma, J.; Zhang, D.; Guo, J.; Chen, F.; Lu, C.; Zhang, L. The pentratricopeptide repeat protein DELAYED GREENING1 is involved in the regulation of early chloroplast development and chloroplast gene expression in Arabidopsis. Plant Physiol. 2008, 147, 573–584. [Google Scholar] [CrossRef][Green Version]
Disclaimer/Publisher’s Note: The statements, opinions and data contained in all publications are solely those of the individual author(s) and contributor(s) and not of MDPI and/or the editor(s). MDPI and/or the editor(s) disclaim responsibility for any injury to people or property resulting from any ideas, methods, instructions or products referred to in the content. |
© 2024 by the authors. Licensee MDPI, Basel, Switzerland. This article is an open access article distributed under the terms and conditions of the Creative Commons Attribution (CC BY) license (https://creativecommons.org/licenses/by/4.0/).