Abstract
This study utilized the platform for ensemble forecasting of species distributions, biomod2, to predict and quantitatively analyze the distribution changes of Zelkova schneideriana Hand.-Mazz. under different climate scenarios (SSP1-2.6 and SSP5-8.5) based on climate and land-use data. This study evaluated the geographic range changes in future distribution areas and the results indicated that, under both SSP1-2.6 and SSP5-8.5 scenarios, the distribution area of Zelkova schneideriana would be reduced, showing a trend towards migration to higher latitudes and elevations. Particularly, in the more extreme SSP5-8.5 scenario, the contraction of the distribution area was more pronounced, accompanied by more significant migration characteristics. Furthermore, the ecological structure within the distribution area of Zelkova schneideriana also experienced significant changes, with an increasing degree of fragmentation. The variables of Bio6 (minimum temperature of the coldest month), Bio2 (mean diurnal temperature range), Bio15 (precipitation seasonality), and elevation exhibited important influences on the distribution of Zelkova schneideriana, with temperature being particularly significant. Changes in land use, especially the conversion of cropland, had a significant impact on the species’ habitat. These research findings highlight the distributional pressures faced by Zelkova schneideriana in the future, emphasizing the crucial need for targeted conservation measures to protect this species and similar organisms.
1. Introduction
Understanding the dynamic changes in species distribution is crucial for biodiversity conservation and ecosystem management in the context of global climate change [1]. Climate change is one of the main driving forces behind species distribution and biodiversity change [2,3,4], and it has profound impacts on the structure, function, and ecological traits of species [5,6,7]. Climate change will alter the suitable habitats for plants, with some plants showing spatial distribution patterns that involve migrating towards higher latitudes and elevations to track their ecological niches [8,9,10]. However, some studies have also found that certain plants migrate towards lower elevations and latitudes to adapt to changing conditions [11]. The IPBES (Intergovernmental Science-Policy Platform for Biodiversity and Ecosystem Services) global assessment report indicates that land-use change is a significant factor threatening species survival, as it causes landscape changes and fragmentation of distribution areas, leading to habitat degradation, habitat isolation, and disruption of species interactions [12,13]. These changes ultimately determine the abundance, occurrence, and connectivity of biological populations [14]. Research has found that climate change and land-use change will collectively impact biodiversity and geographical distribution patterns [15,16,17].
Zelkova schneideriana Hand.-Mazz., a woody plant of the Ulmaceae family and the Zelkova genus, is characterized by its dense, durable qualities and aesthetically pleasing grain patterns, rendering it suitable for premium hardwood applications. Furthermore, its broad canopy, graceful silhouette, and rich seasonal foliage variations make it a preferred choice for ornamental landscaping purposes [18,19,20]. Zelkova schneideriana is primarily distributed in the subtropical regions of China [21]. Research conducted by Shao and Zhang on the Zelkova schneideriana communities in Jiangsu, China, demonstrated that Zelkova schneideriana is the most important dominant species, exhibiting limited competitive interactions with other tree species [22]. Building upon this, research conducted by Zhou et al. revealed that the Zelkova schneideriana predominantly occurs in two forest ecosystems within China’s subtropical regions: deciduous broad-leaved forests and mixed bamboo and broad-leaved forests, covering 19 provinces nationwide [23]. However, excessive human logging and weak natural regeneration capacity have resulted in a continuous decrease in its distribution [24,25]. Currently, it is classified as a second-level protected wild plant in China and considered a vulnerable species in the IUCN Red List for China (https://www.iucnredlist.org/species/131155456/131155458 (accessed on 11 December 2023)). In recent years, the changes in the distribution range of Zelkova schneideriana have received focused attention due to its value and rarity. Research conducted by Sun et al. suggested that human activity intensity and future climate change will cause a northward shift in the distribution of Zelkova schneideriana, leading to a reduction in the distribution area. Precipitation was identified as the main factor influencing its distribution [26]. Additionally, Zhou et al. conducted a further study on the changes in the distribution range of Zelkova schneideriana based on more accurate records of its natural distribution. The results similarly indicated a northward shift in the distribution range of Zelkova schneideriana in the future, with temperature identified as the dominant factor affecting the distribution change [23]. However, these studies did not consider the impact of land utilization changes on the distribution of Zelkova schneideriana, nor did they explore the changes in the internal structure of the distribution area.
To comprehensively assess the potential risks of future distribution changes in Zelkova schneideriana, it is necessary to not only study the integrated impacts of climate and land-use changes [27] but also consider the spatial characteristics of the distribution area’s internal structure. The use of large-scale indicators that characterize geographical distribution changes cannot accurately evaluate their responses to climate and land-use changes [28]. Currently, landscape indicators have been developed and applied to comprehensively capture the structural changes of species within their distribution areas, thereby aiding in the elucidation of species’ ecological responses within complex landscapes [17,29].
Therefore, this study aims to (1) predict the distribution range of Zelkova schneideriana under future climate scenarios based on climate change and land-use data. (2) Quantify the internal structural changes within the distribution area of Zelkova schneideriana. (3) Evaluate the differences in distribution area changes of Zelkova schneideriana under different climate scenarios. (4) Analyze the factors influencing the changes in the distribution area of Zelkova schneideriana.
2. Results
2.1. Accuracy of the Model’s Predicted Results
The research results indicate that the optimal TSS (True Skill Statistic) value for the TSS threshold model is 0.805, and the AUC (Area Under Curve) value is 0.956 (Table 1). These values, exceeding 0.8, demonstrate the high predictive accuracy of the ensemble model for the distribution range of Zelkova schneideriana. Furthermore, the model effectively simulates the distribution of Zelkova schneideriana under climate change conditions.

Table 1.
Results of the validation of TSS and AUC values for the model.
2.2. Changes in the Distribution Area of Zelkova schneideriana
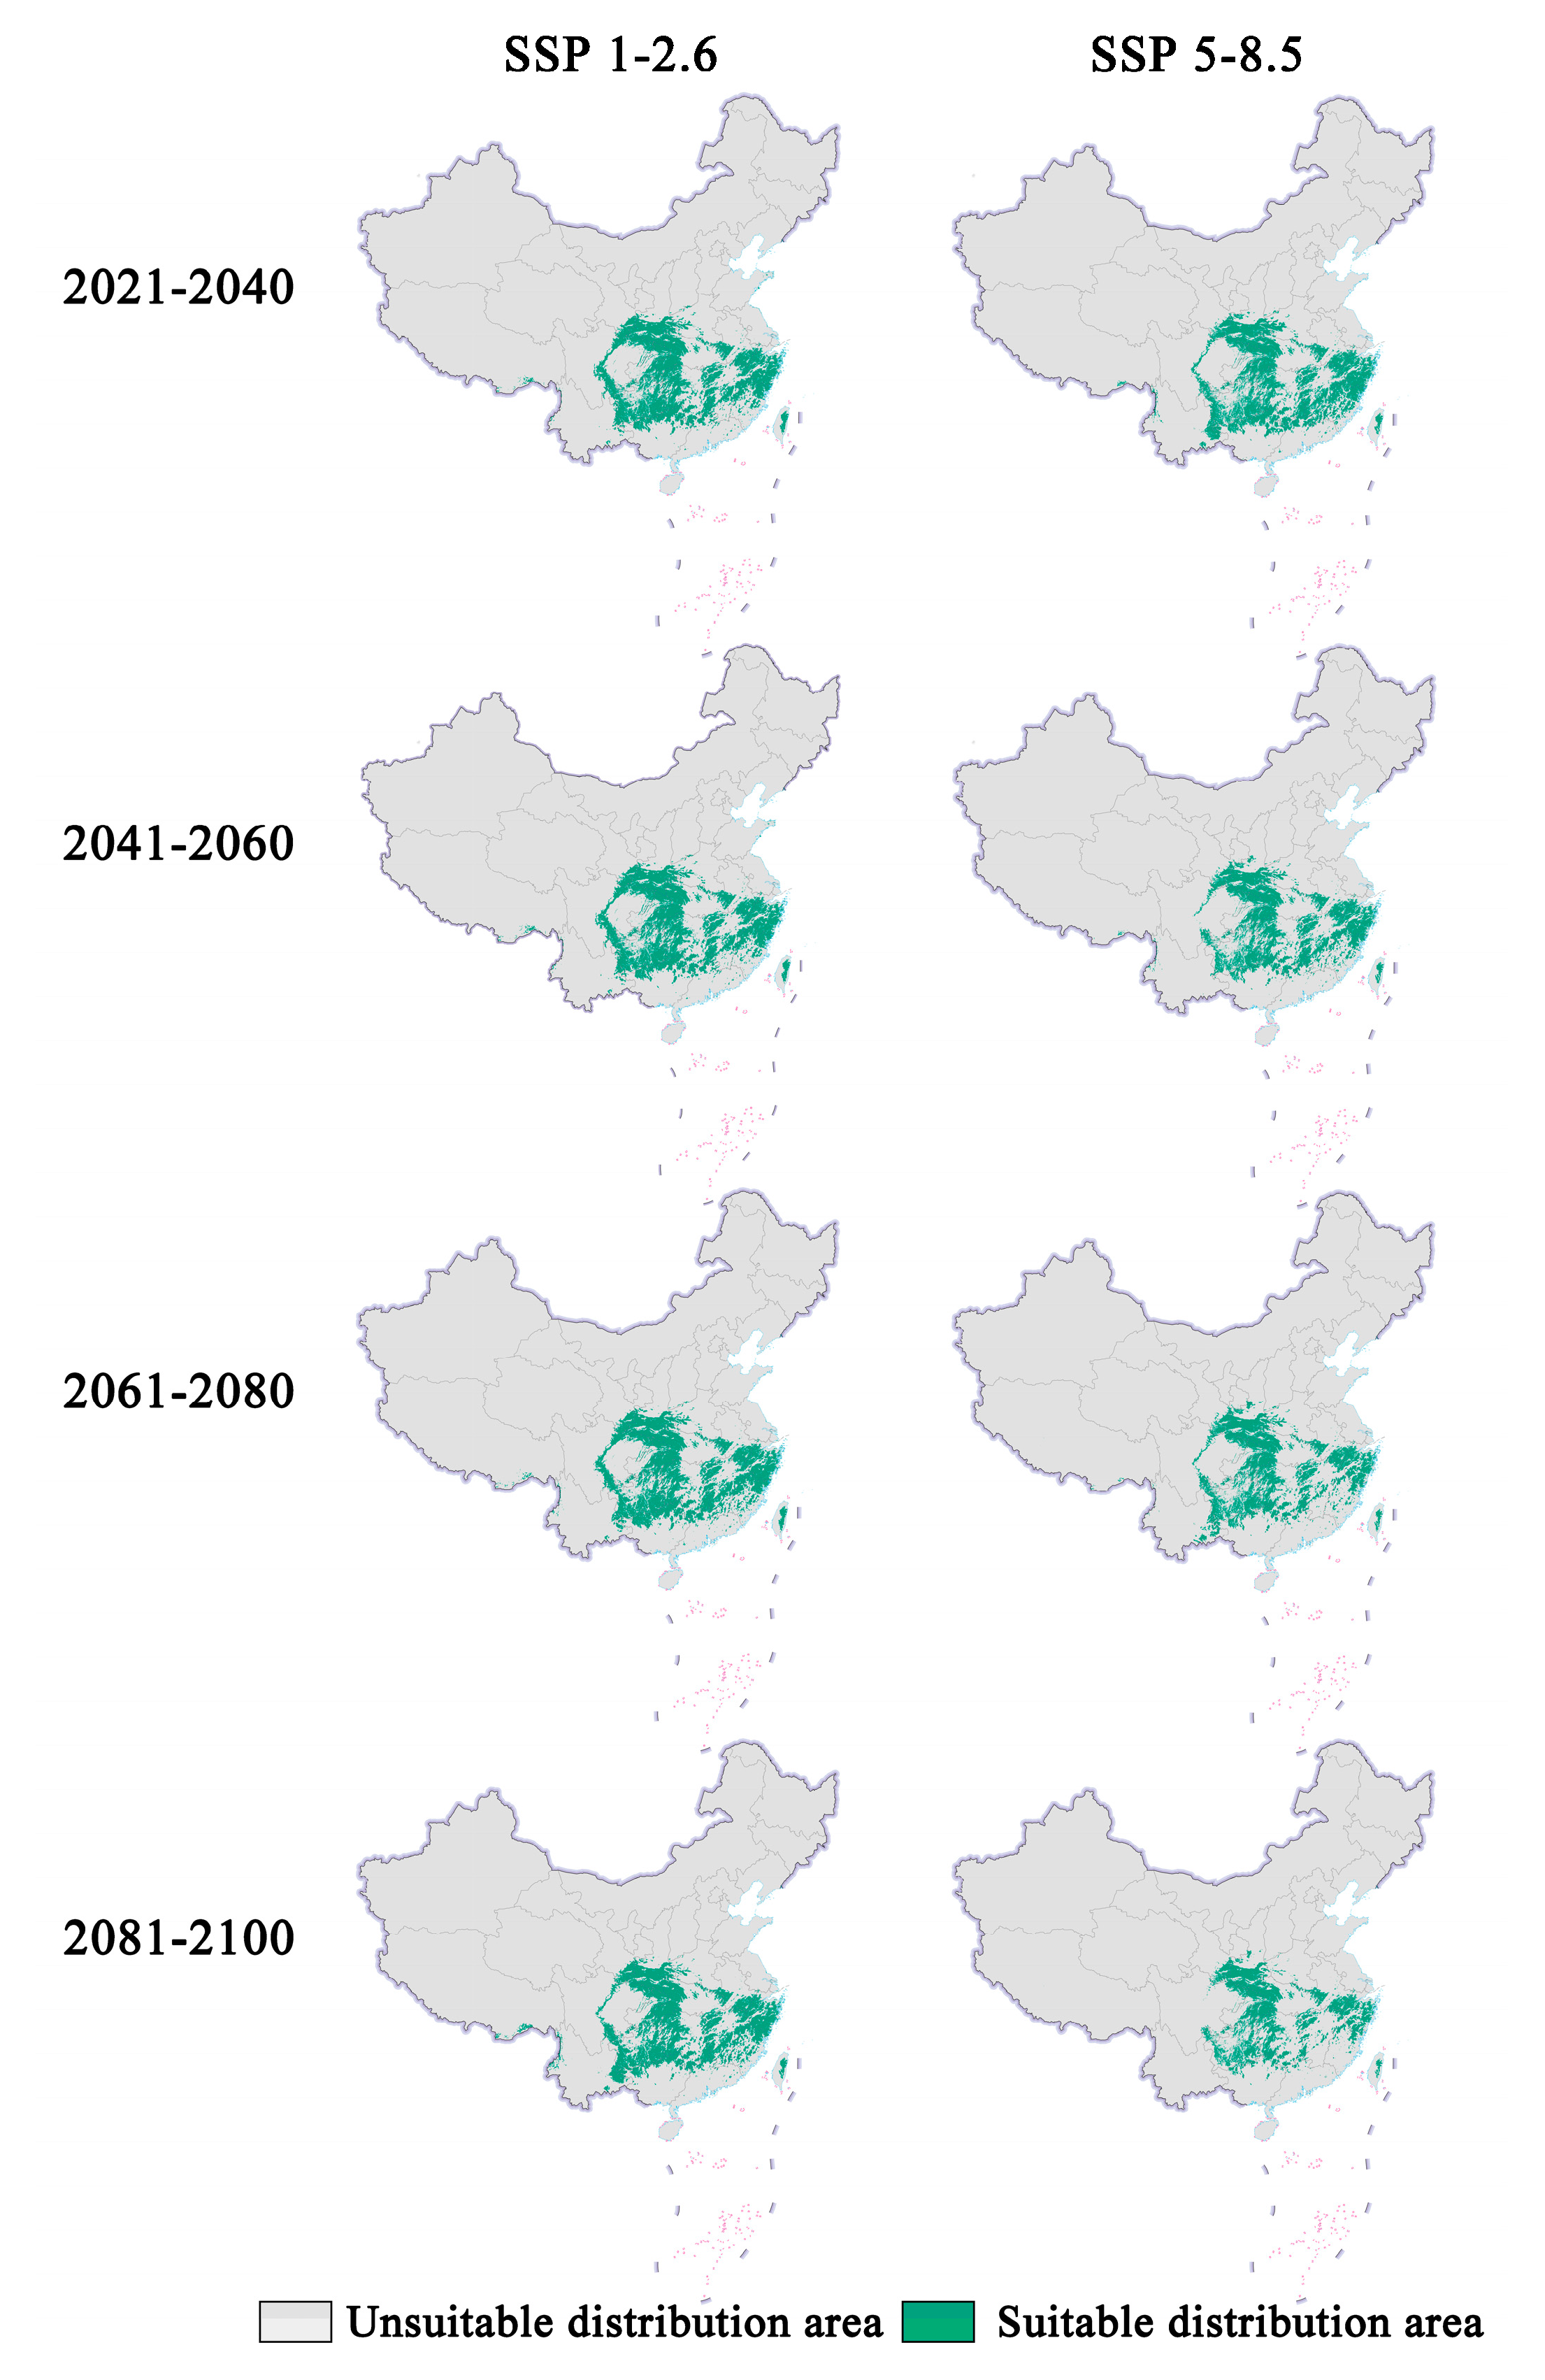
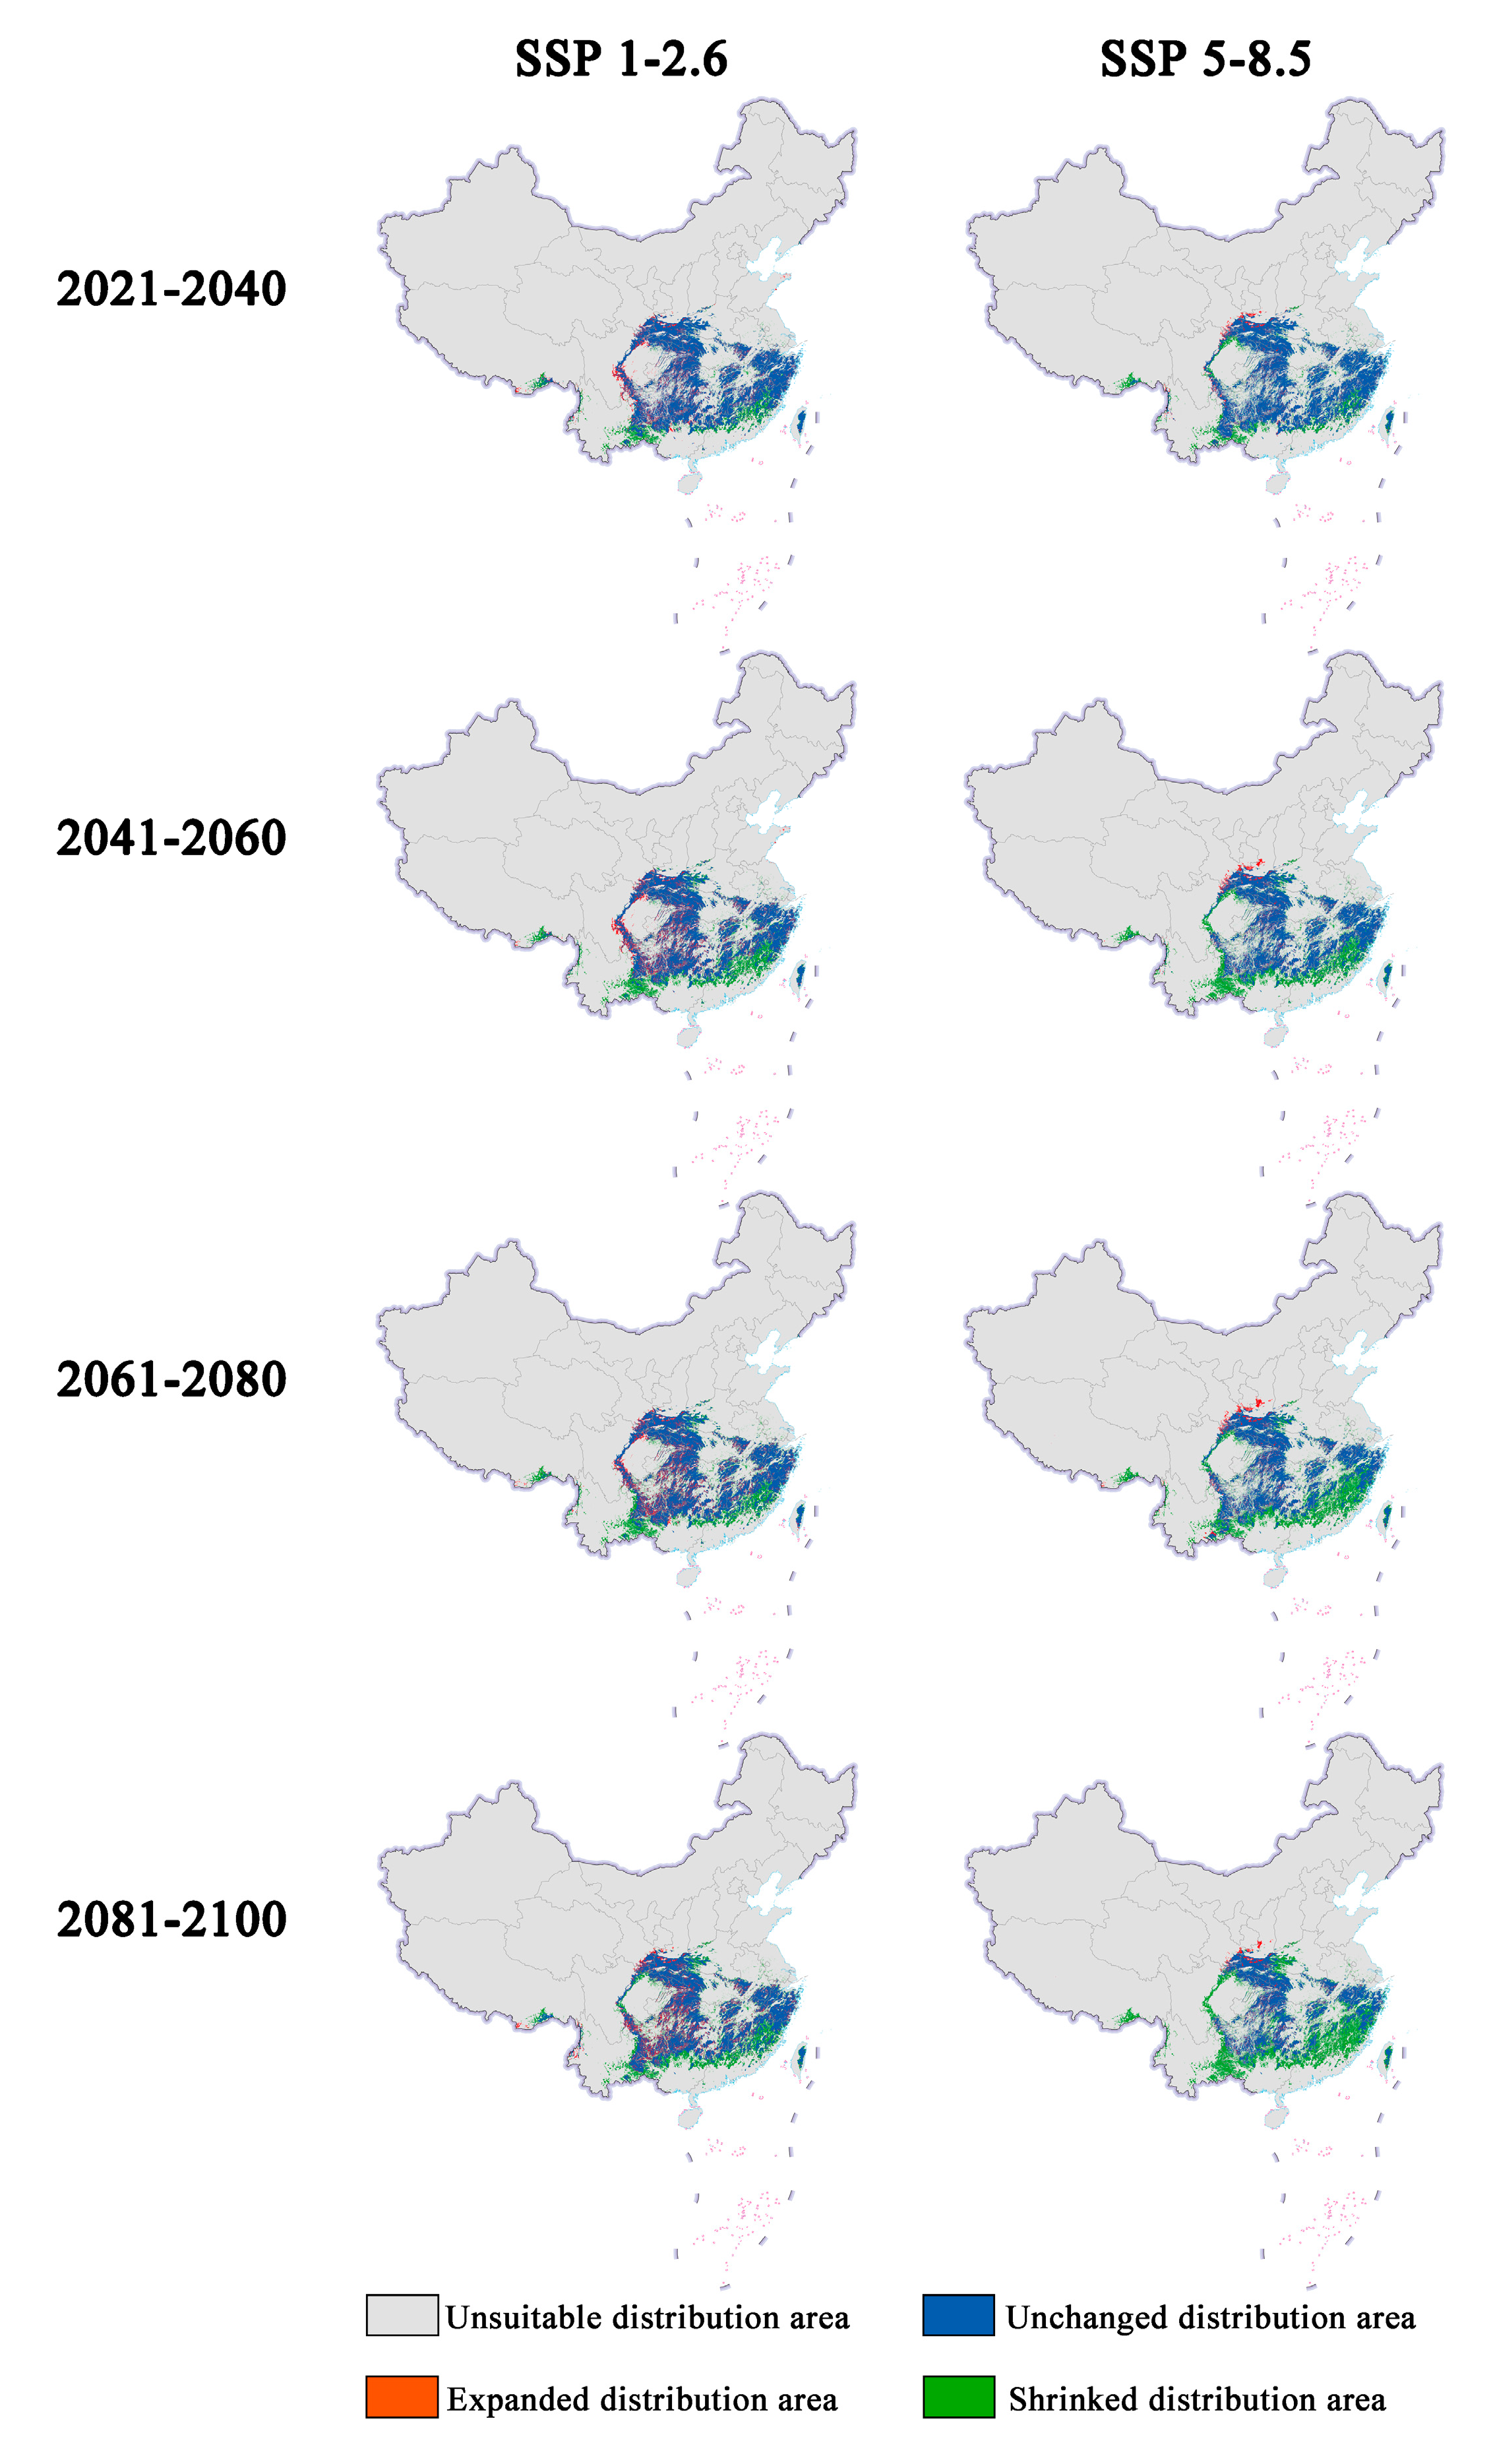
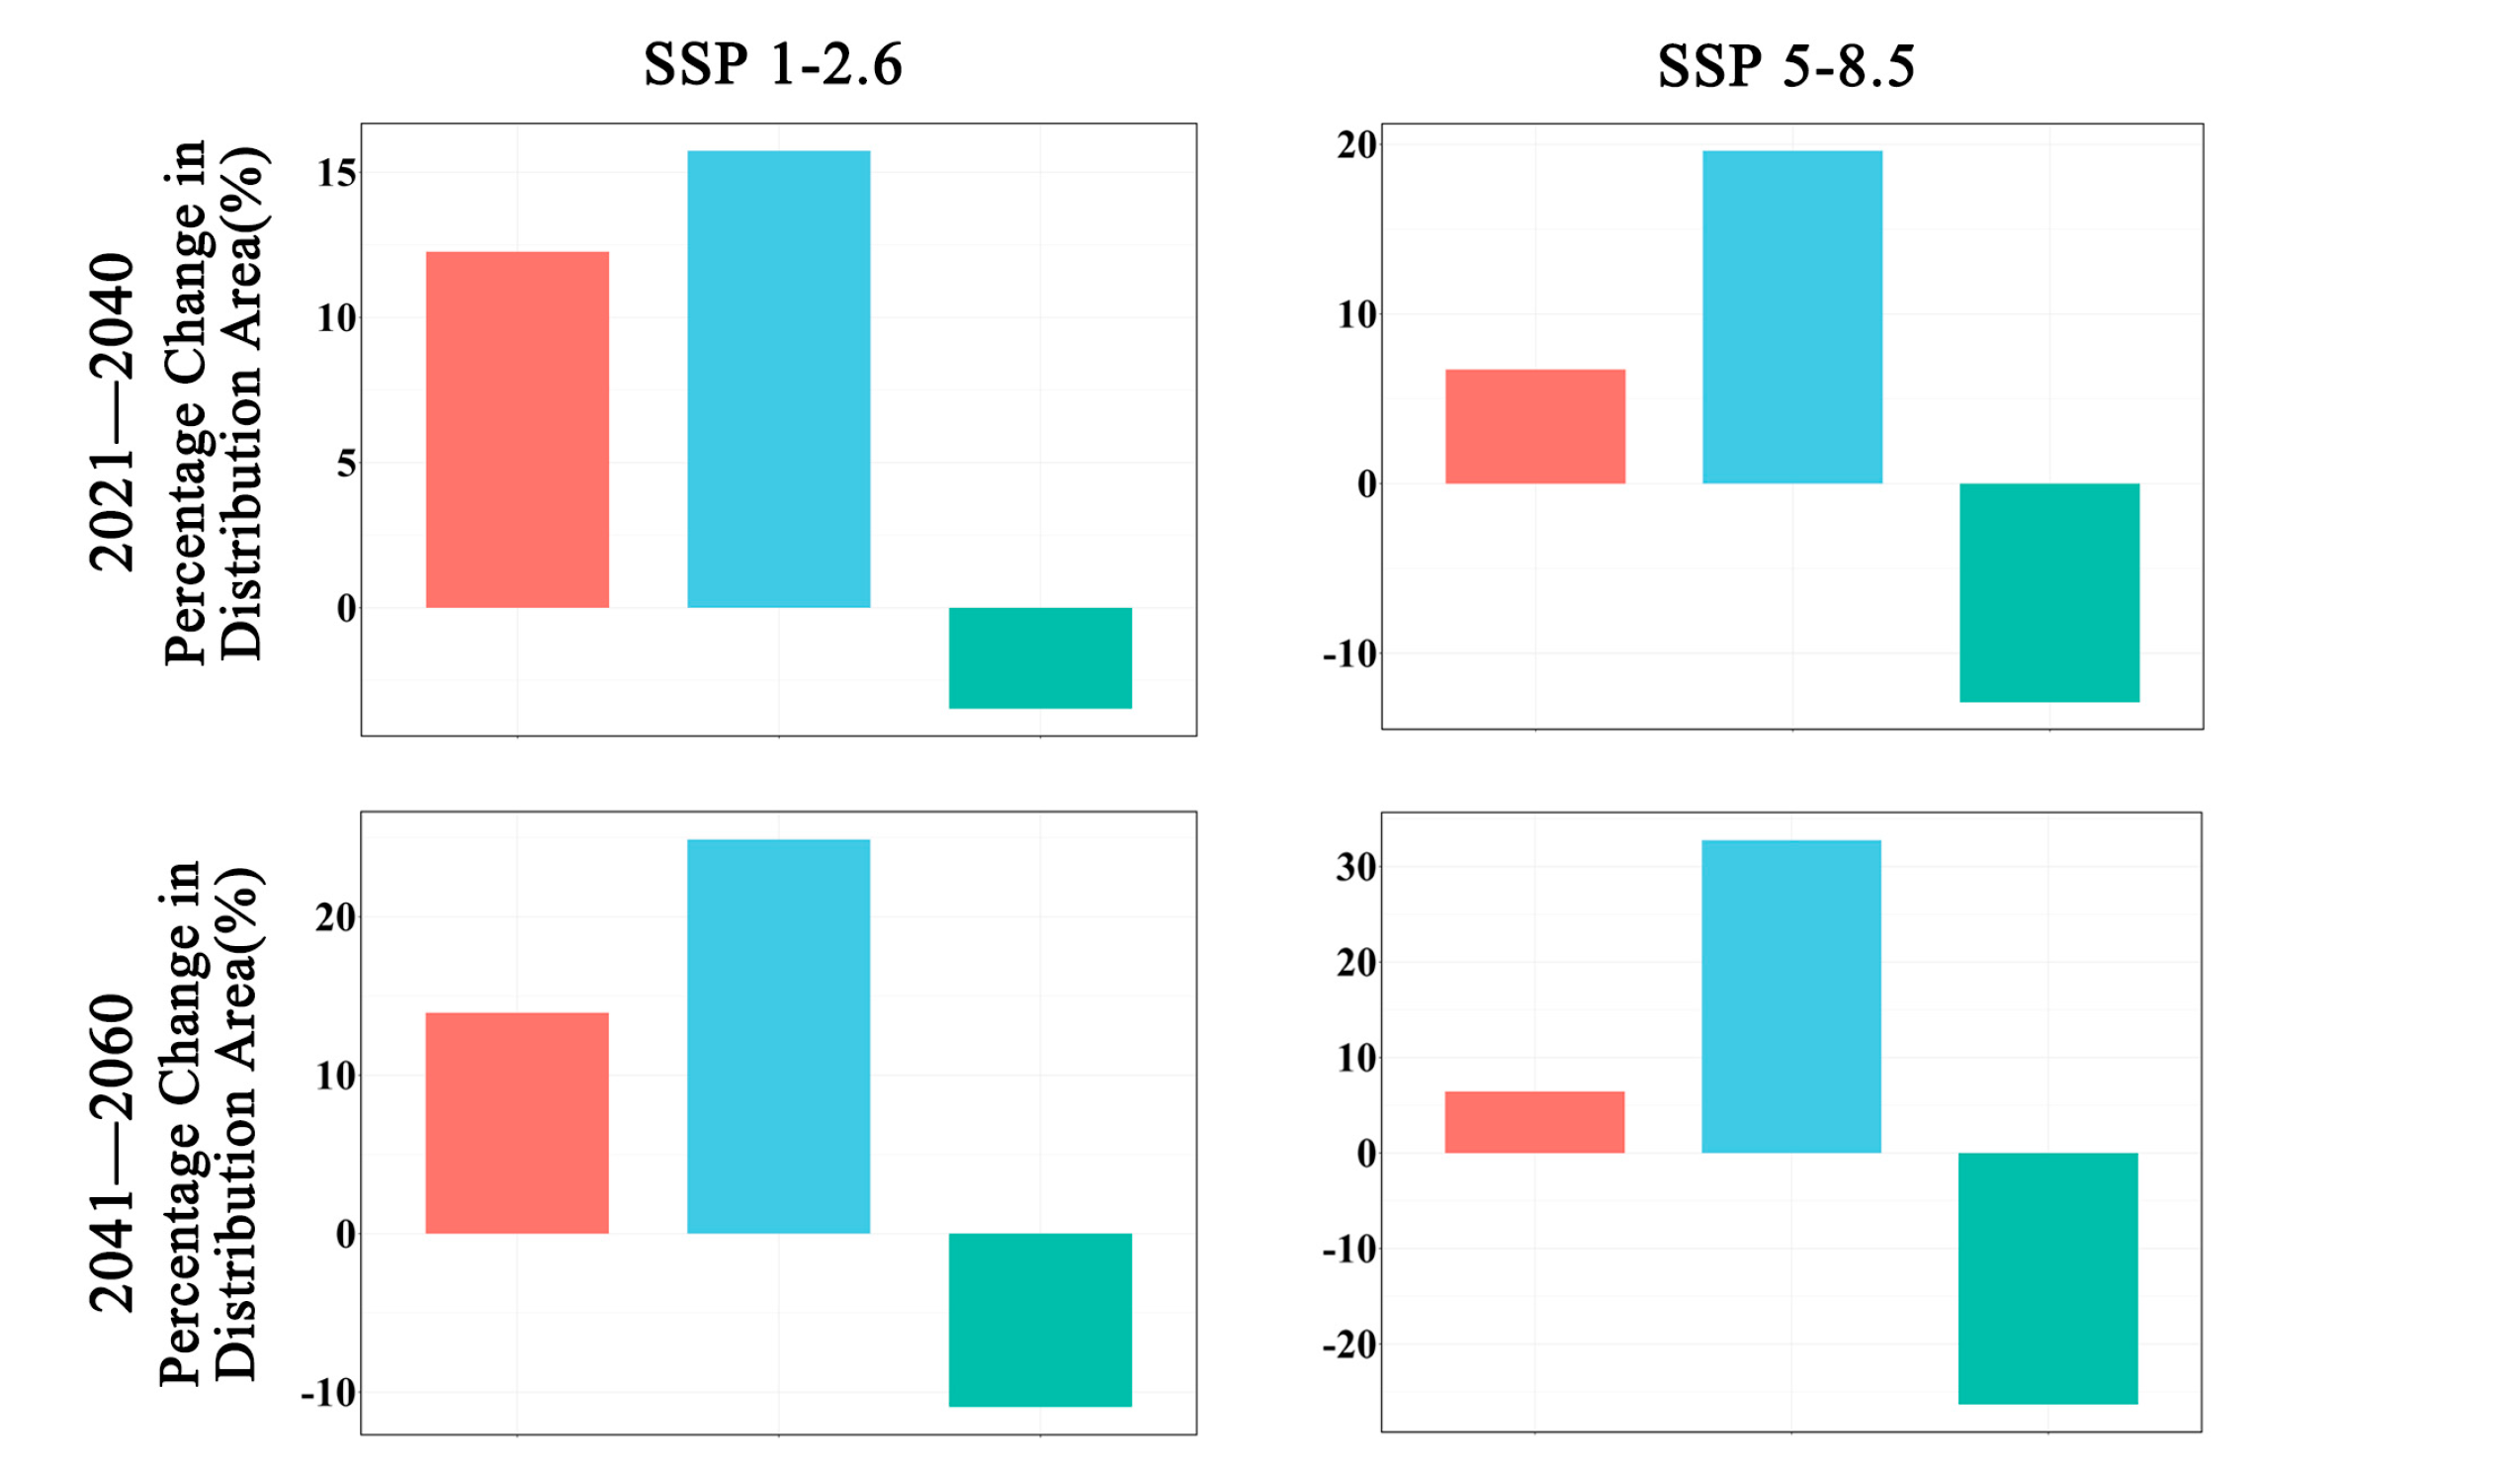
In future climate scenarios, the distribution area of Zelkova schneideriana is predicted to contract (Figure 1, Figure 2 and Figure 3). Under the SSP1-2.6 scenario, the contraction trend is relatively moderate, with a noticeable expansion (>10%) and contraction (>15%) of the distribution range. However, under the SSP5 8.5 scenario, the changes in the distribution area are more severe. Compared to the SSP1-2.6 scenario, the expansion trend is slowed (<10%), while the contraction trend intensifies. By 2081, the contraction is projected to reach close to 50%, posing a severe issue for the distribution of Zelkova schneideriana.
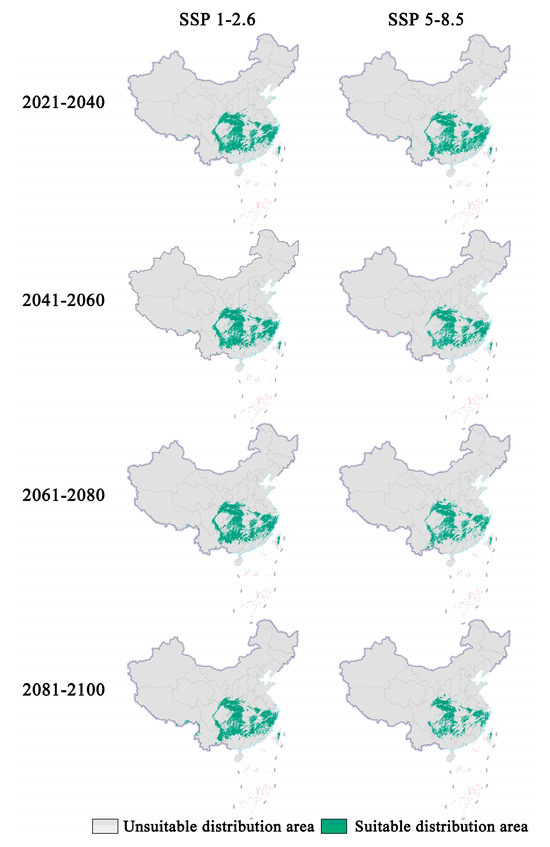
Figure 1.
Prediction of future distribution areas of Zelkova schneideriana under different climate change scenarios in China. (Based on the standard map production of the Ministry of Natural Resources of the People’s Republic of China (bzdt.ch.mnr.gov.cn (accessed on 1 March 2024)), GS (2023) 2763; the base map boundaries remain unaltered. The same applies below.).
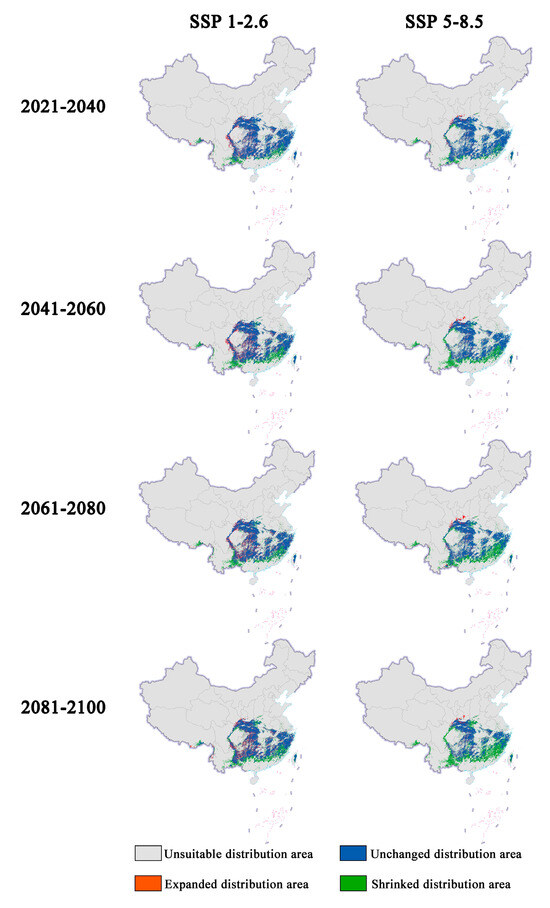
Figure 2.
Changes in future distribution areas of Zelkova schneideriana under different climate change scenarios in China.
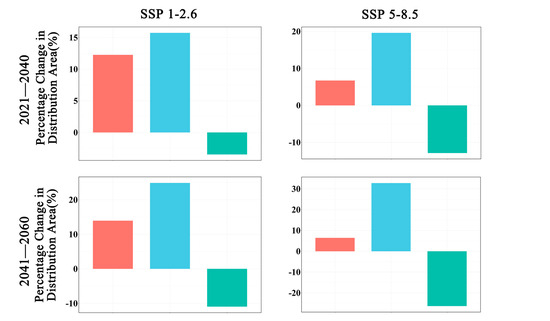
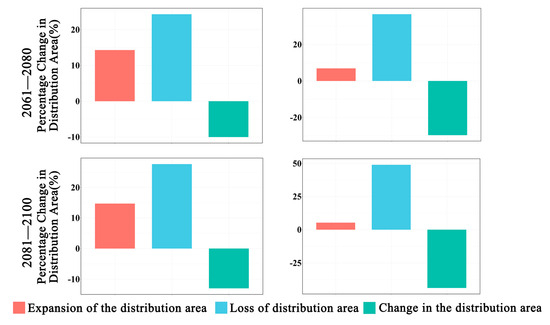
Figure 3.
Changes in the distribution area of Zelkova schneideriana.
2.3. Changes in the Latitude and Elevation of the Distribution Area of Zelkova schneideriana
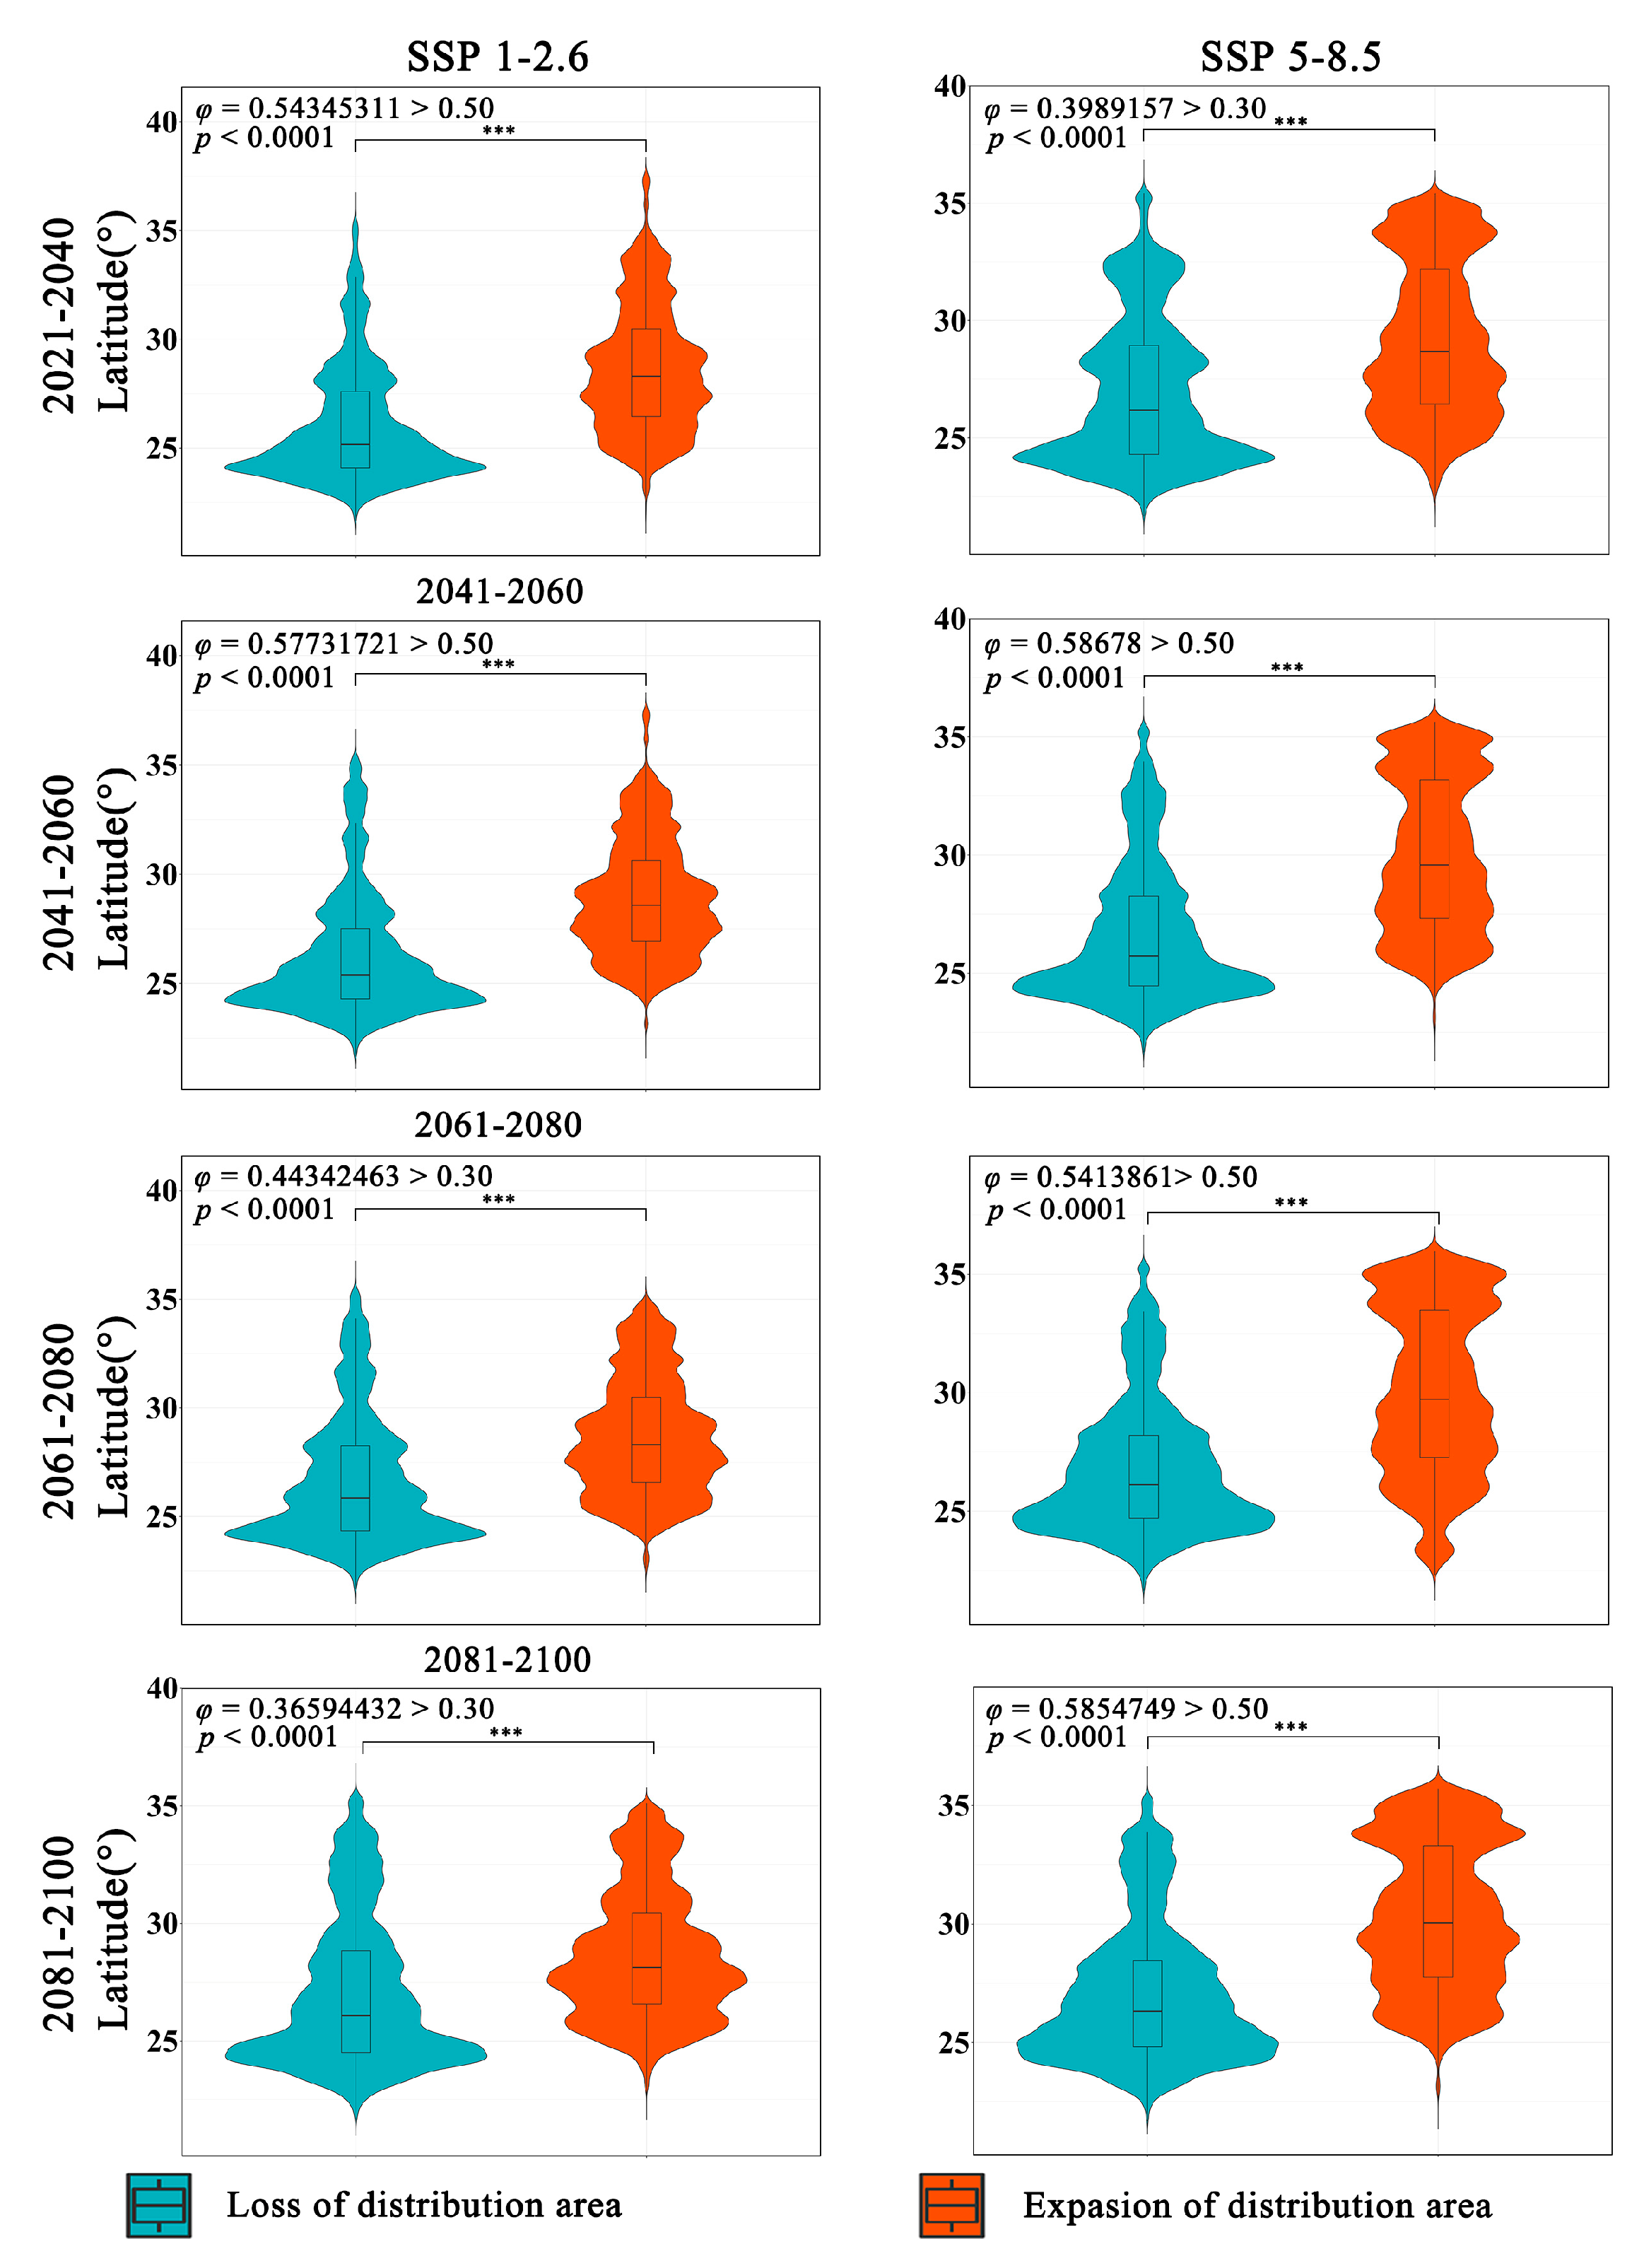
The latitudinal range of the expansion and contraction of the distribution of Zelkova schneideriana varies significantly regardless of climate scenarios (Figure 4). The contraction of Zelkova schneideriana distribution is concentrated in lower latitudes, with an increasing density of distribution at lower latitudes as time progresses. Conversely, the expansion area shows the opposite trend, with a higher density of distribution concentrated at higher latitudes and an increasing density of distribution at higher latitudes as time progresses. The differences between the SSP5-8.5 climate scenario and the SSP1-2.6 climate scenario are more pronounced in terms of distribution. Also, the latitudinal distribution density is not uniform. Both the statistically significant test (p < 0.0001) and the effect size measurement (φ > 0.3) indicate that this variation is not only statistically significant but also ecologically important.
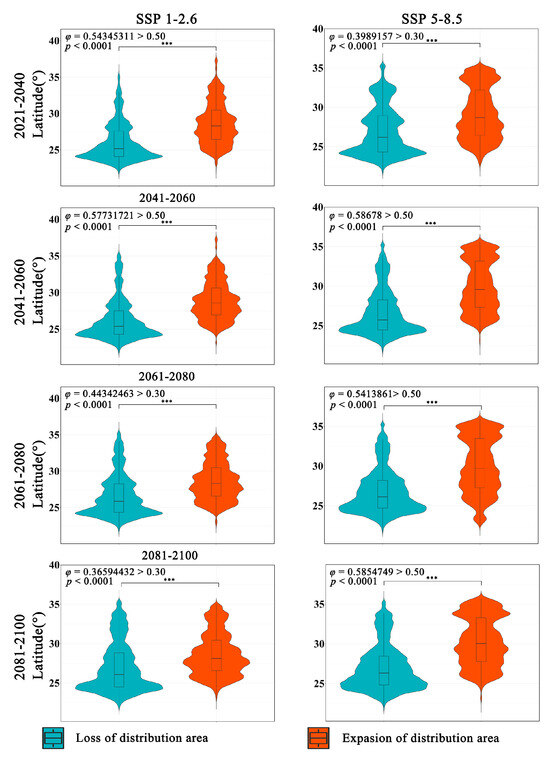
Figure 4.
Differences in latitude variations in the distribution area of Zelkova schneideriana. (The p value significance codes: “***”: p < 0.001. The same applies below.)
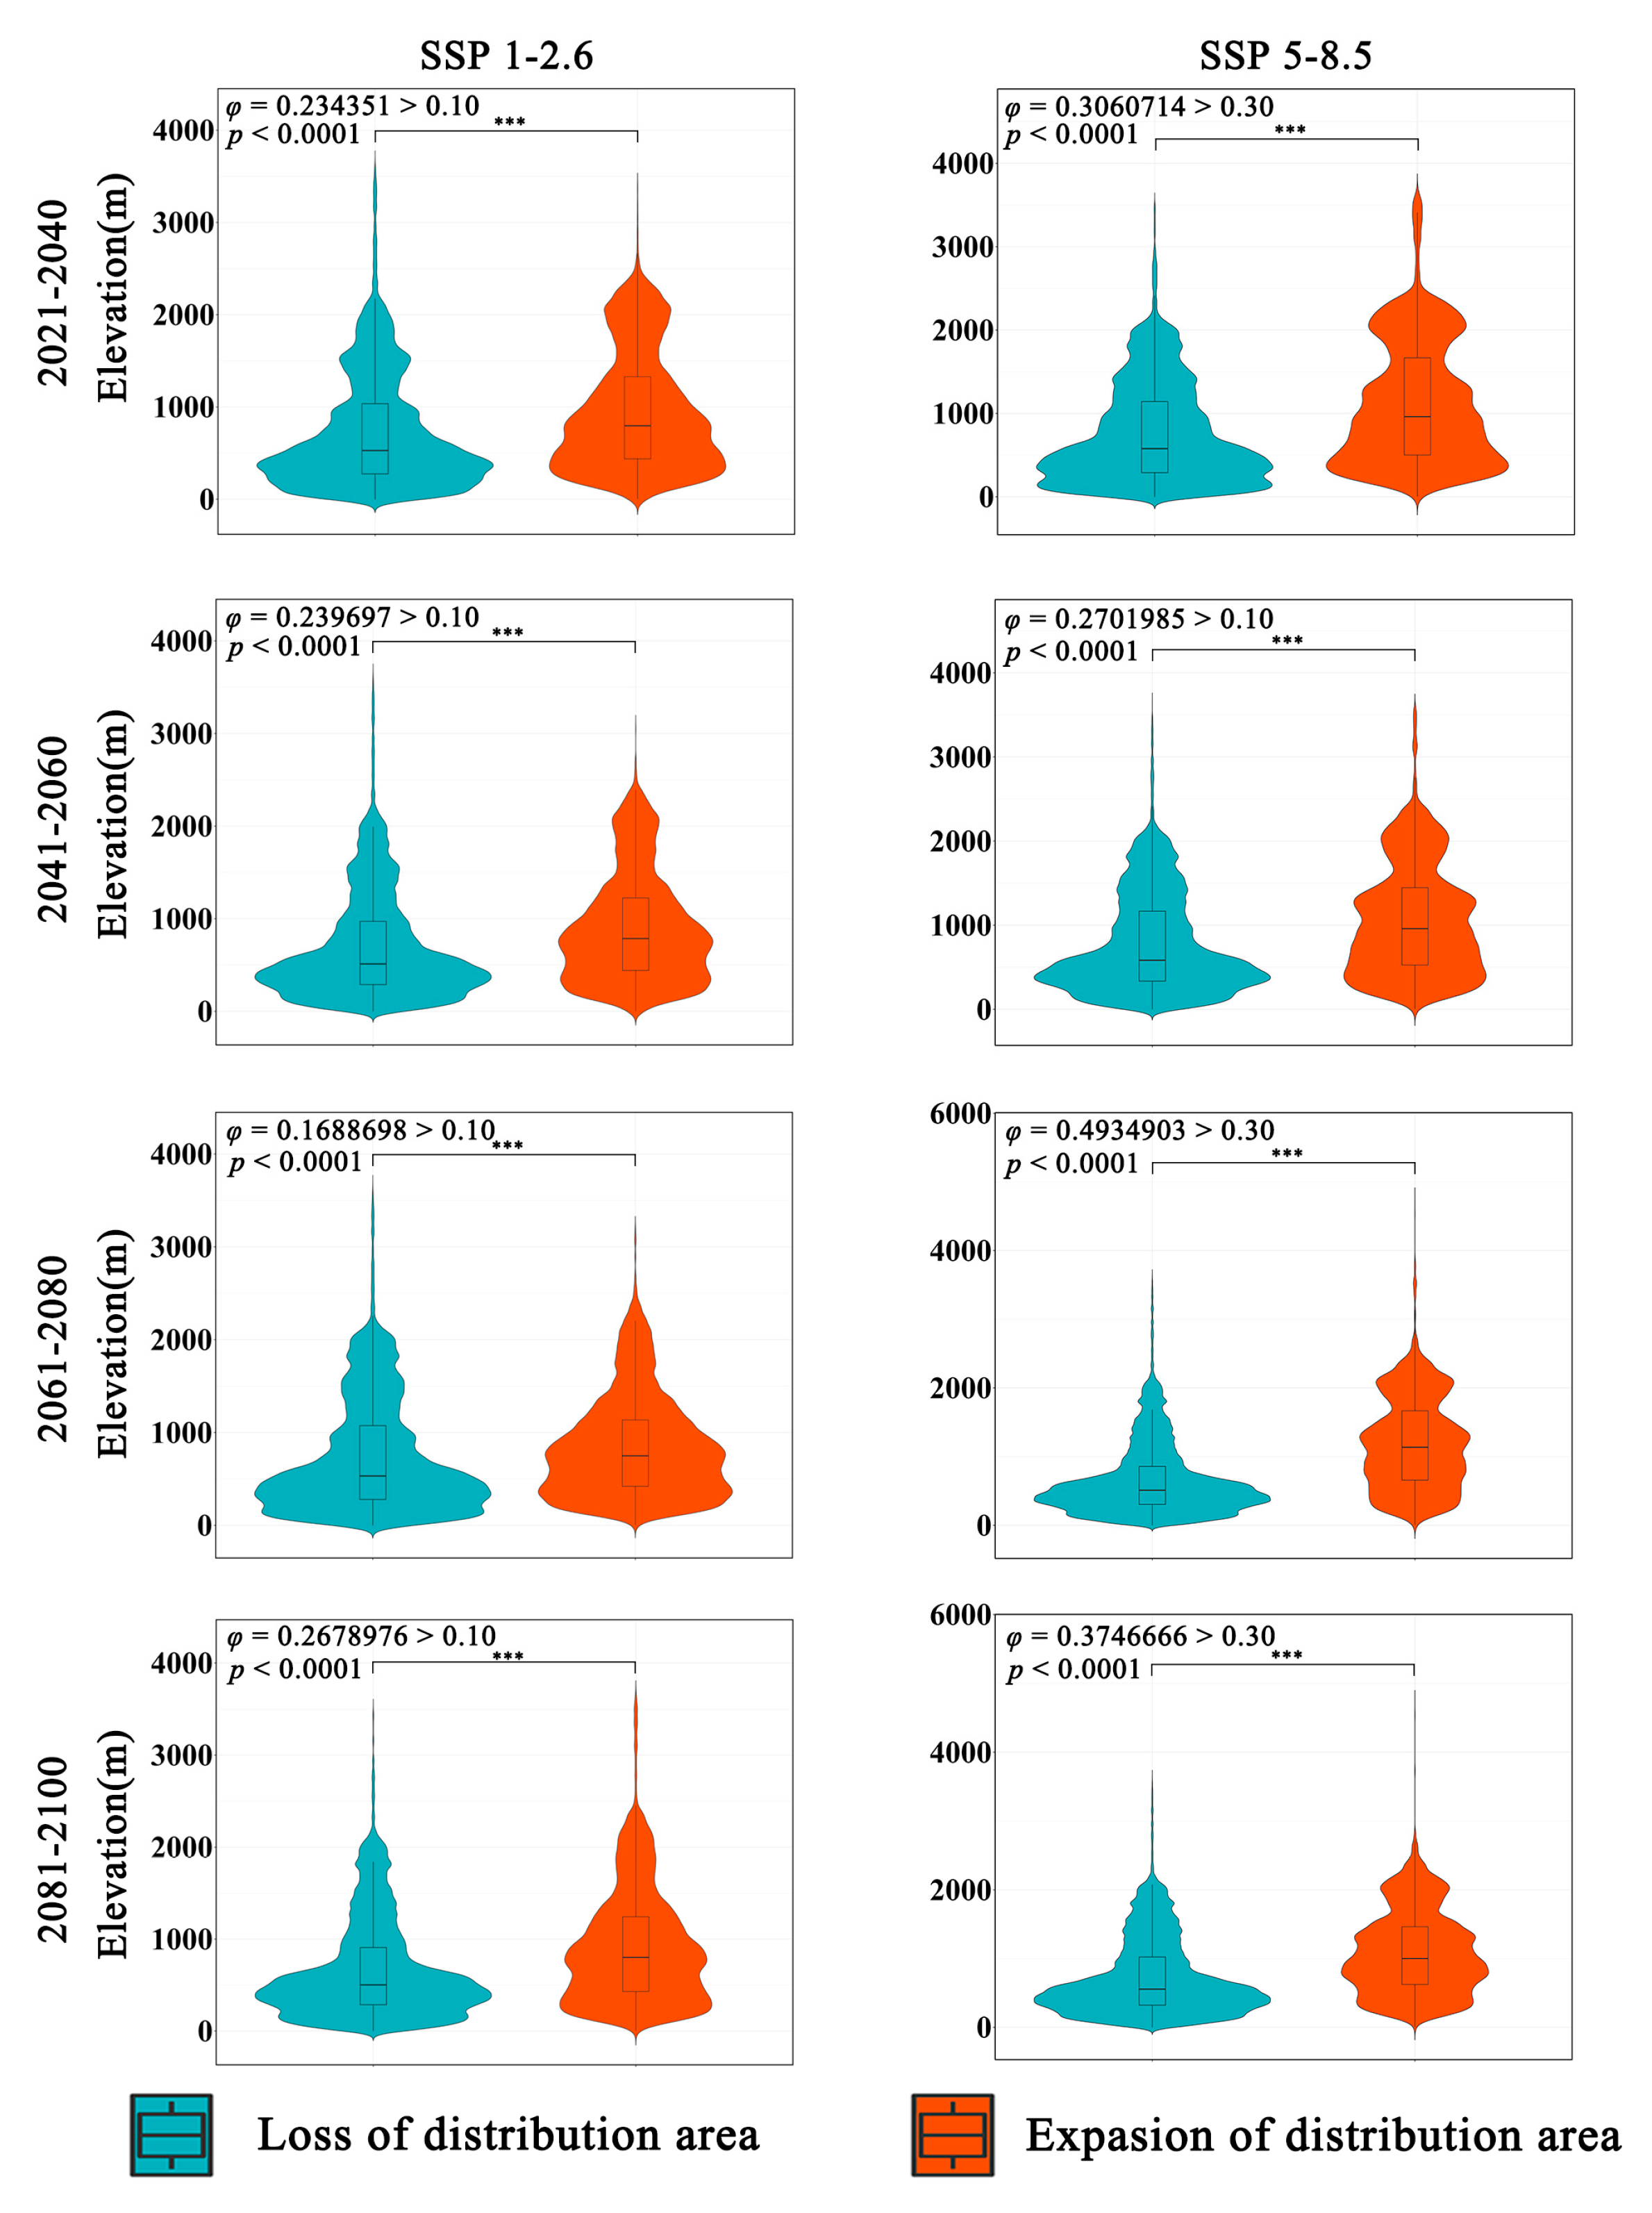
The overall trend of Zelkova schneideriana’s elevational changes in two climate scenarios is consistent (Figure 5). The expansion area has a higher distribution density at higher elevations compared to the contraction area. A statistically significant test (p < 0.0001) indicates that this change is statistically significant. However, the effect size of the SSP1-2.6 climate scenario is low (φ > 0.1), suggesting a mild distribution change. On the other hand, the SSP5-8.5 climate scenario has a higher effect size compared to SSP1-2.6, indicating a more pronounced tendency for Zelkova schneideriana to shift to higher elevations. The violin plots of the expansion and contraction areas in both scenarios exhibit clear elongated tails at higher elevations, indicating greater variability in the distribution at higher elevations.
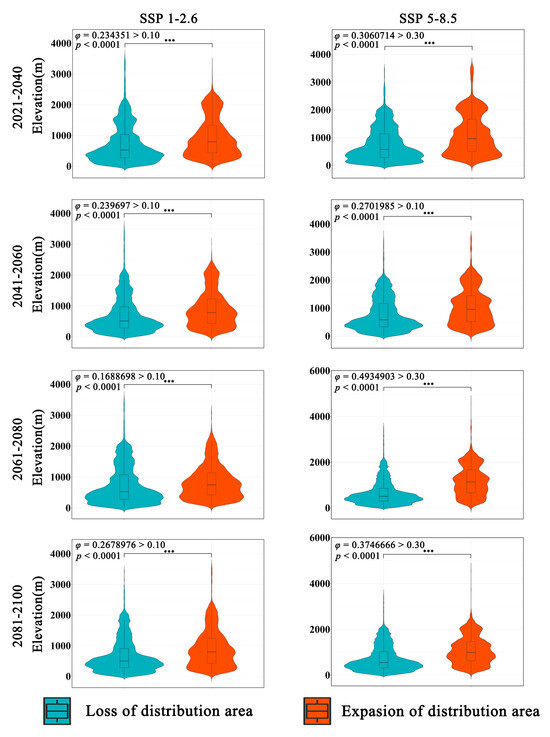
Figure 5.
Differences in elevation variations in the distribution area of Zelkova schneideriana. “***”: p < 0.001.
2.4. Internal Structural Changes in the Distribution Area of Zelkova schneideriana
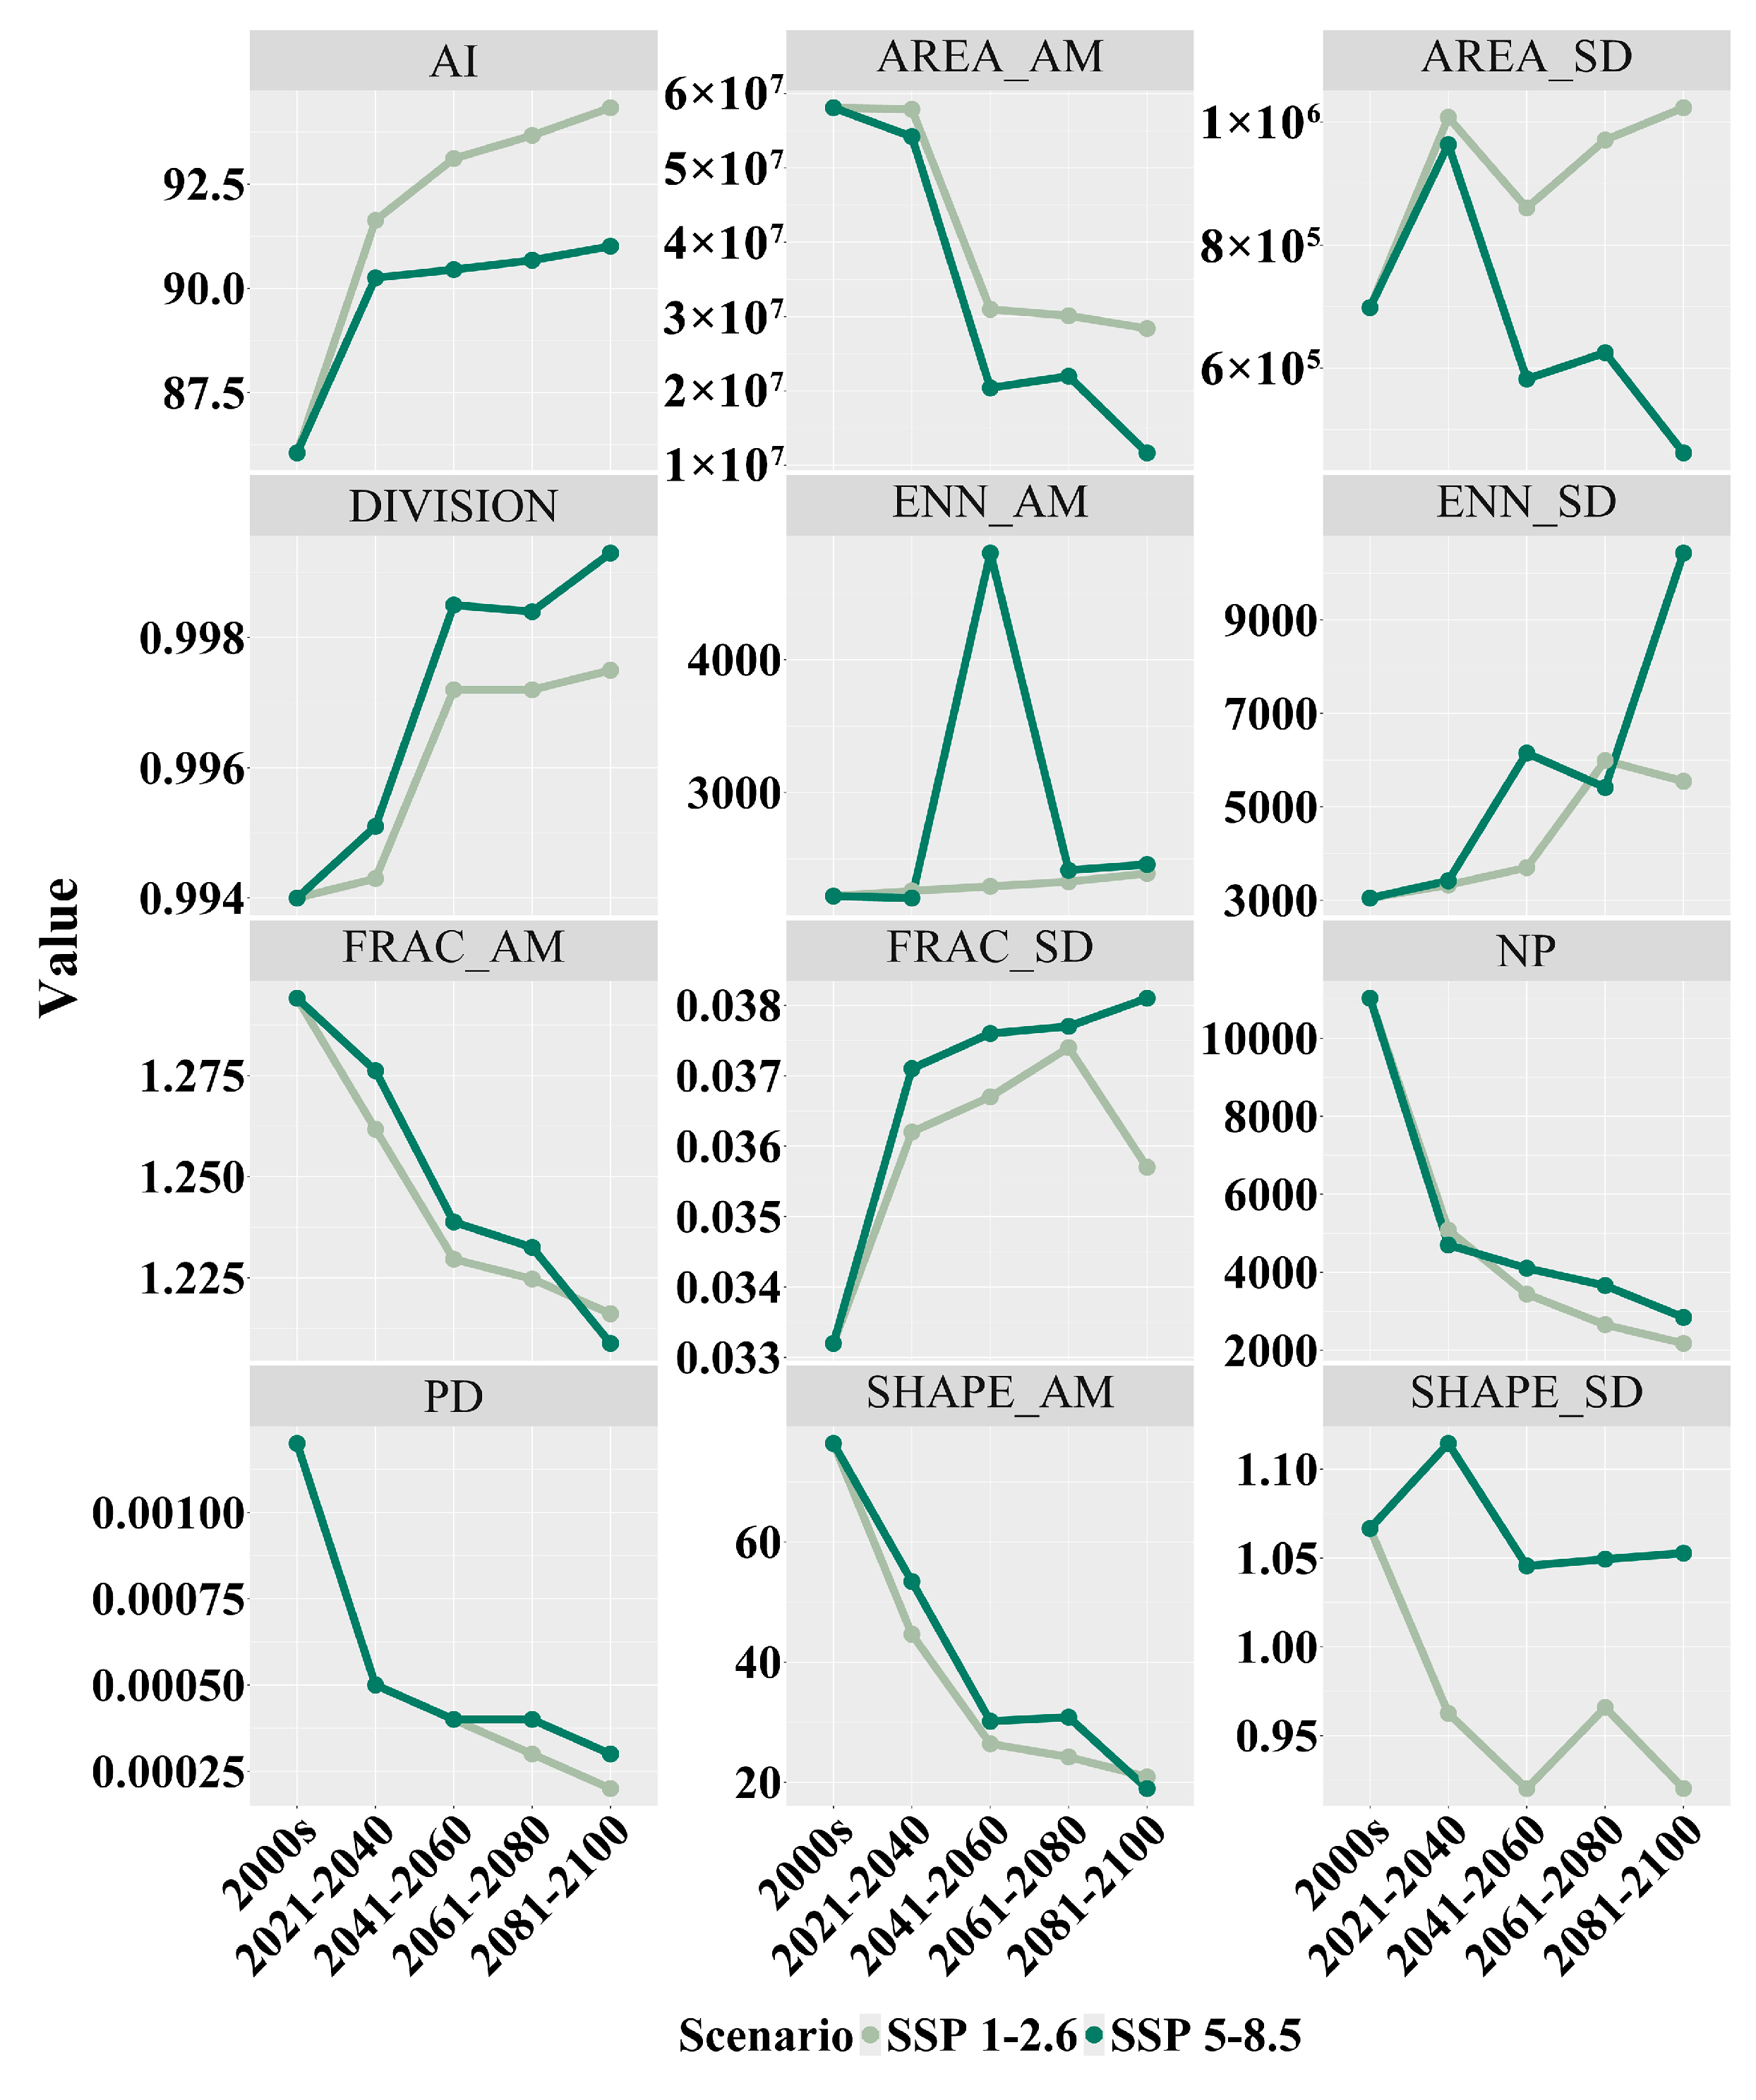
After studying the landscape index changes in the distribution area of Zelkova schneideriana in two scenarios, we found a series of structural changes in the distribution area of Zelkova schneideriana (Figure 6). An increase in the aggregation index (AI) was observed in both SSP1-2.6 and SSP5-8.5 scenarios, indicating a tendency for overall patch aggregation. SSP1-2.6 showed a higher aggregation index (AI) compared to the SSP5-8.5 climate scenario. While there was some improvement in local aggregation, the increase in landscape division index (DIVISION) revealed an overall increase in isolation between patches, suggesting the potential existence of barriers to movement between patch populations. The SSP5-8.5 climate scenario exhibited greater landscape fragmentation. Additionally, the significant peak observed in the area-weighted mean euclidean nearest-neighbor distance (ENN_AM) in the SSP5-8.5 scenario, as well as the stable increase in the SSP1-2.6 scenario, indicated increased patch separation. The upward trend in the standard deviation of the euclidean nearest-neighbor (ENN_SD) distance further highlighted the inconsistency in patch distances, suggesting that some patches in the habitat are more isolated compared to others. The continuous decline in patch number (NP) and the decrease in patch density (PD) in both scenarios further confirmed the increasing habitat fragmentation. The scenarios also showed a decreasing trend in the area-weighted mean shape index (SHAPE_AM) and the standard deviation of the shape index (SHAPE_SD), indicating a gradual simplification and regularity in the shape of the habitat patches and an increase in their consistency. The area-weighted mean fractal dimension index (FRAC_AM) displayed a decreasing trend in both scenarios, reflecting a tendency towards simplification and regularity in the shape of the patches, while the fluctuations in the standard deviation of the fractal dimension index (FRAC_SD) demonstrated an increasing inconsistency in patch shape and edge complexity between patches. The decrease in the area-weighted mean area (AREA_AM) indicated a reduction in the average size of the habitat patches, while the increase in the standard deviation of the area (AREA_SD) indicated an increasing inconsistency in the sizes of the habitat patches.
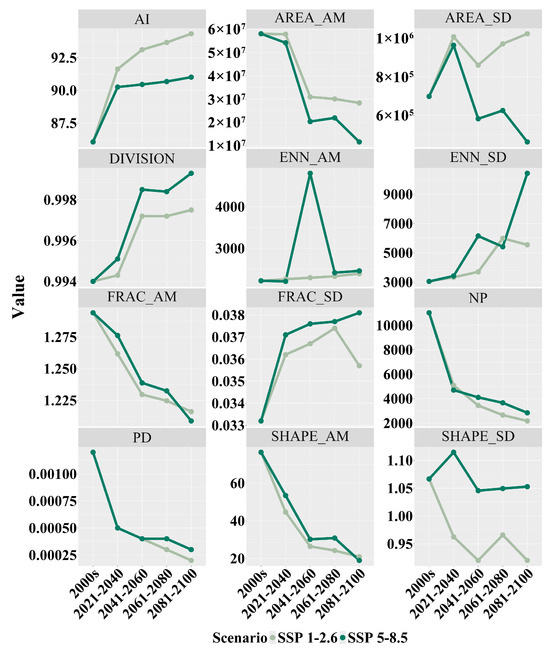
Figure 6.
Landscape index changes in the distribution area of Zelkova schneideriana.
2.5. Factors Influencing Changes in the Distribution Area of Zelkova schneideriana
The results presented in Table 2 demonstrate that the contribution rate of Bio6 (minimum temperature of the coldest month) is the highest. Following this, Bio2 (mean diurnal temperature range) contributes the second-highest percentage. In comparison to elevation and precipitation, temperature factors have a higher contribution rate (79%). Under both climate scenarios, it is expected that Bio6 will experience a significant increase. The mean minimum temperature of the coldest month in the original distribution area is projected to rise from 0.769 °C to 3.449 °C (in the SSP1-2.6 climate scenario) and to 4.985 °C (in the SSP5-8.5 climate scenario) during the period from 2081 to 2100 (Table 3 and Figure 7). Additionally, the average Bio6 (mean diurnal temperature range) exhibits an increasing trend within the original distribution area, while the Bio15 (precipitation seasonality) shows an upward trend accompanied by greater variability (Table 3 and Figure 5).
Table 2.
Relative contribution rate of bioclimatic variables.
Table 3.
Numerical characteristics of climatic variables in the current distribution area of Zelkova schneideriana.
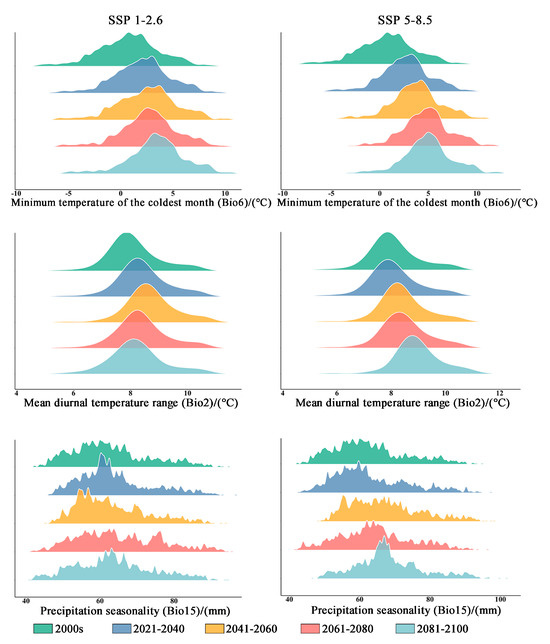
Figure 7.
The bioclimatic conditions of the current distribution area of Zelkova schneideriana.
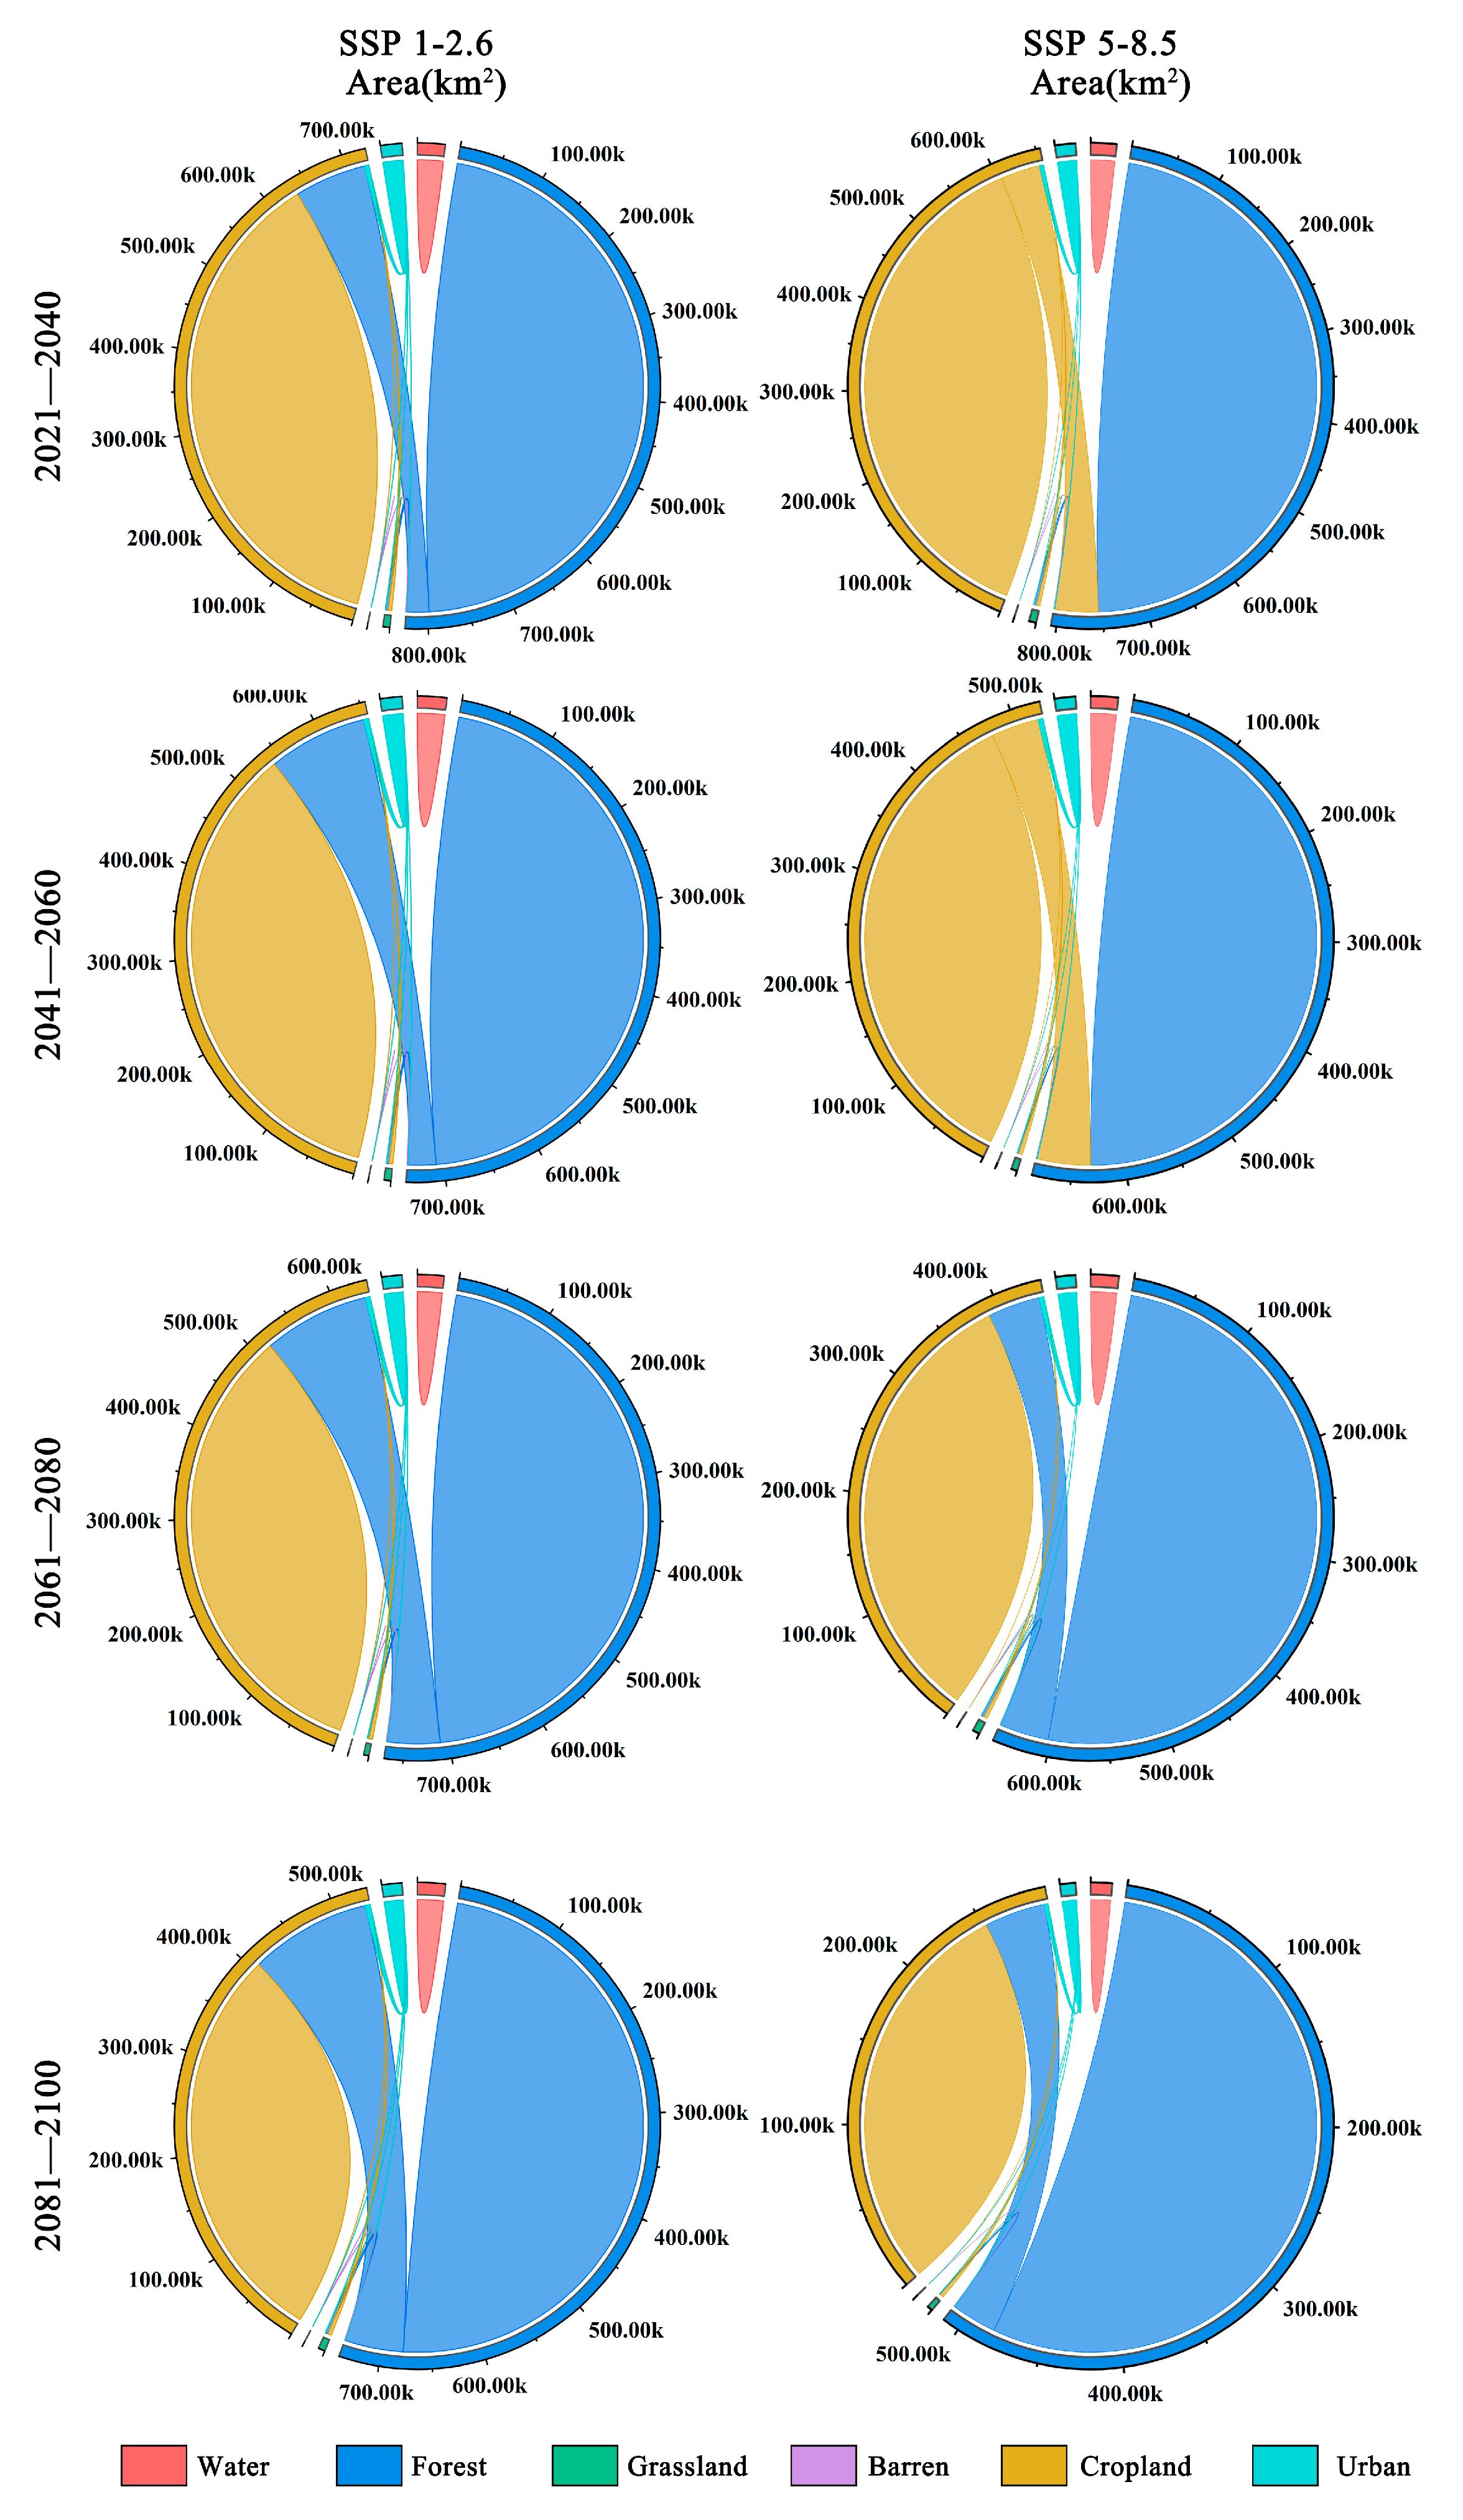
There are significant differences between the two scenarios of land-use change (Figure 8). Under the SSP1-2.6 climate scenario, land-use change is minimal due to human efforts in environmental conservation, leading to a gradual increase in forest area within the distribution area of Zelkova schneideriana. However, under the SSP5-8.5 climate scenario, from 2021 to 2060, we observed a substantial conversion of forest land into cropland within the distribution area of Zelkova schneideriana, accounting for over 50% of the total area. However, this trend reverses from 2061 to 2100, as cropland reverts back to forest land, resulting in the recovery of forest land, once again surpassing 50%.
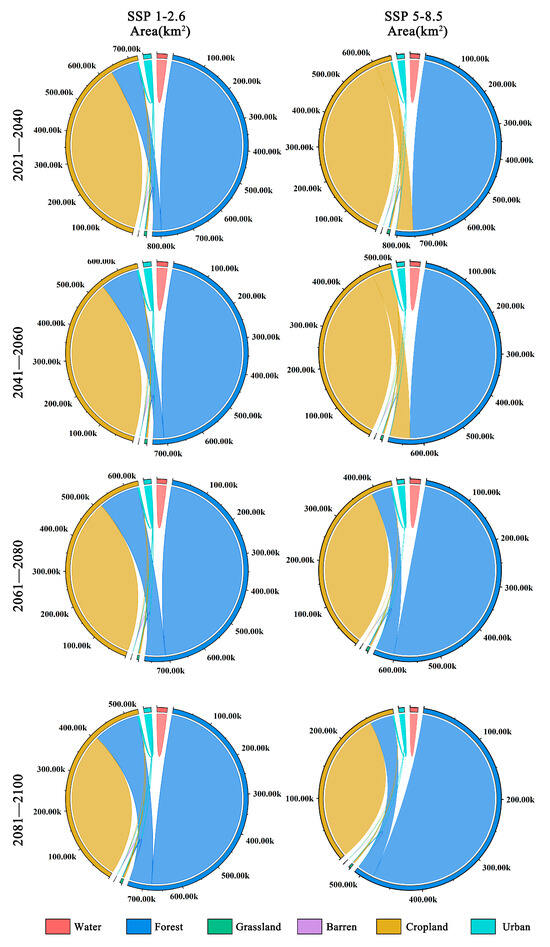
Figure 8.
Future land-use changes in the distribution area of Zelkova schneideriana.
3. Discussion
3.1. Factors Influencing the Distribution Area of Zelkova schneideriana
The geographic distribution of plant species is an important spatial characteristic that can be influenced by climate change, human activities, and other factors. Climate and land use are crucial factors affecting species distribution, and their levels of change are directly related to the patterns of species distribution and biodiversity. Our research findings indicate that temperature is the most influential factor affecting the distribution of Zelkova schneideriana. Among all climate variables, Bio6 (minimum temperature of the coldest month) and Bio2 (mean diurnal temperature range) have the greatest impact on the distribution of Zelkova schneideriana. This finding aligns with Zhou et al.’s previous study [23]. Zhou et al. suggested that the ample precipitation in subtropical regions is unlikely to be a limiting factor for the distribution of Zelkova schneideriana. Our research results confirm this assertion, as the Bio15 (precipitation seasonality) is not pronounced in the original distribution area. Furthermore, many studies on the distribution of subtropical plants in China have indicated that temperature may be the primary factor driving the distribution of plants in this region. Our previous research has shown that temperature dominates the distribution of landscape plants in both northern and southern regions [30]. However, this is not absolute. Research on Pinus massoniana Lamb. suggested that precipitation is the dominant factor, and Sun et al.’s research on the richness distribution pattern of oaks (Quercus L.) showed that annual precipitation (Bio12) exhibited the highest quantile compared with the other variables [31,32]. Therefore, the impact of climatic factors on the distribution of subtropical plants in China is heterogeneous, and further research is needed to understand the specific patterns.
Furthermore, our research proves the serious impact of land-use changes on the species distribution range. The high proportion of non-forested areas in the distribution area has resulted in the loss of suitable habitats for Zelkova schneideriana, and the most significant impact comes from cropland. Related studies have also shown that the impact of land-use changes on plant distribution cannot be ignored. For example, research by Song et al. on the extinction risk of eastern Asian plants indicated that the expansion of cropland and non-forest land will pose significant threats to plant distribution in the region, with cropland playing a prominent role [16]. Our research findings indicated that different development scenarios will have a significant impact on the survival status of Zelkova schneideriana. Under the SSP1-2.6 scenario, the conversion of cropland to forest mitigates the rate of disappearance of Zelkova schneideriana distribution areas, while under the SSP5-8.5 scenario, facing greater pressure from climate and land-use changes, the trend of Zelkova schneideriana distribution area loss further intensifies. Wang et al.’s study on coastal mangrove habitat yielded similar conclusions, suggesting that land-use policies aimed at mangrove conservation will effectively slow down the trend of habitat degradation in mangrove distribution areas [33].
3.2. Range Changes of the Distribution Area of Zelkova schneideriana
Over time, the distribution range of Zelkova schneideriana in both climate scenarios is expected to face contraction, consistent with previous findings [23,26]. In subtropical regions of China, variations exist in the trends of changes observed in plant distribution areas. Research findings regarding species such as Litsea cubeba (Lour.) Pers. and Toona ciliata Roem. suggested an expansion of their distribution ranges [34,35]. Conversely, studies on plants like some species of oaks (Quercus L.) were consistent with our own research [32], indicating a reduction in their future distribution areas. Additionally, our study reveals a potential expansion of Zelkova schneideriana’s distribution range towards higher latitudes and elevations, accompanied by a reduction in lower latitudes and elevations areas. This trend is expected to become more significant with intensifying climate warming, aligning with previous research [23,26]. The observed migration pattern may be related to changes in the species’ climatic niche. Over time, Bio6 (minimum temperature of the coldest month) and Bio2 (mean diurnal temperature range) in the original distribution areas are projected to increase. Consequently, Zelkova schneideriana tracks cooler climates by advancing towards the northern edge and contracting in the south. Similar conclusions have been drawn in related studies [8,36,37]. It is important to note that species distribution models assume unobstructed dispersal pathways, which may not be the case due to landscape barriers and Zelkova schneideriana’s limited dispersal capacity [8].
Furthermore, we observe that there is a higher effect value for the migration trend of the Zelkova schneideriana distribution range towards higher latitudes compared to elevation. This suggests that the latitude variation in the distribution range of Zelkova schneideriana is more pronounced. We hypothesize that the reason for this trend disparity is due to varying regional rates of climate change. Previous research has indicated that the rate of global warming is faster in flat areas at higher latitudes [38]. Additionally, since temperature is the dominant factor influencing the distribution of Zelkova schneideriana, it is expected that the distribution range will primarily shift towards higher latitudes.
In light of the shifting distribution patterns of Zelkova schneideriana, our foremost priority is to safeguard their stable natural habitats effectively, thereby preventing illicit logging and ecological degradation. Moreover, we advocate for heightened monitoring and investigative measures in regions vulnerable to habitat loss and expansion. Consistent monitoring and evaluation of population size, distribution range, growth status, and potential threats to Zelkova schneideriana are imperative for prompt issue detection and the implementation of suitable conservation strategies.
3.3. Fragmentation of Distribution Range Landscape
The results of the landscape index reveal a concerning trend of landscape fragmentation in the distribution areas of Zelkova schneideriana under two climate scenarios. In the SSP5-8.5 scenario, habitat fragmentation becomes more pronounced. The synergy between landscape fragmentation and climate change will decrease the species’ ability to adapt to climate change. Firstly, Zelkova schneideriana produces small fruit that relies primarily on gravity and wind for dispersal [39]. Consequently, the limited dispersal distance in fragmented landscapes hampers the species’ migration to habitats with the most suitable climatic conditions, resulting in restricted natural regeneration and impacting reproductive, dispersal, and persistence mechanisms [40,41]. Additionally, research has shown that Zelkova schneideriana exhibits a high chance of inbreeding due to its naturally small population size [39]. In turn, landscape fragmentation increases the likelihood of random genetic drift and inbreeding, leading to a reduced level of gene flow between populations. Self-pollinating species often exhibit lower levels of within-species genetic variation, which affects gene flow between individuals and populations and undermines their ability to adapt to changing climates [42,43,44]. Related studies have also reached similar conclusions. Investigations into the distribution patterns of species like Tilia amurensis Rupr. and Phellodendron amurense Rupr. in northeastern China have revealed instances of habitat fragmentation within regional plant habitats. As landscapes progressively transition towards human-dominated land use, the spatial cohesion of plant habitats may continue to diminish [17,45].
To safeguard and capitalize on the genetic diversity within Zelkova schneideriana populations while mitigating the effects of landscape fragmentation, we advocate for the prompt collection of wild germplasm resources from high-quality wild Zelkova schneideriana tree communities. Assessing their diversity will lay the groundwork for future cultivation and conservation endeavors.
4. Materials and Methods
4.1. Data Collection
The distribution data of Zelkova schneideriana were obtained from the dataset provided by Zhou et al. which offers detailed records of Zelkova schneideriana distribution [23]. A total of 312 specimen points of Zelkova schneideriana were used for modeling purposes. For more detailed information on the methods of data collection and processing, please refer to Zhou et al. [23].
The climatic and elevation data used for modeling in this study were obtained from the WorldClim database (https://worldclim.org/). Climate data from the SSP1-2.6 and SSP5-8.5 scenarios under the BCC-CSM2-MR model were selected. The resolution for all data was 2.5 arc-minute. The BCC-CSM2-MR model is a medium-resolution climate system model developed by the National Climate Center. It exhibits improved performance in simulating future climates for China compared to its earlier version, BCC-CSM-1.1m [46,47]. Furthermore, compared to CMIP5, SSPs provide a better reflection of the relationship between socioeconomic development and climate scenarios [48].
In the context of the SSP-RCP scenarios, we utilized a high-resolution (1 km) land-use dataset developed by Chen et al. [49]. This dataset encompasses seven key land types, namely, water, forest, grassland, barren, cropland, urban, and permanent snow and ice. The inclusion of these data augments our understanding of the impact of anthropogenic changes on the Earth’s surface over time.
Due to the correlation among the 19 bioclimatic variables (Figure 9), using all of them in the model predictions may lead to overfitting. Consequently, this study screened the data of the 19 bioclimatic variables. Firstly, a correlation analysis was performed on the 19 climate variables. Then, an ensemble model was employed to model the 19 climate variables, yielding the important results for each variable. Variables with a correlation coefficient greater than 0.75 were considered highly correlated, and only those with high importance and interpretability were retained for species distribution modeling. The method of evaluating and selecting variables based on their importance using ensemble models allows for a more comprehensive consideration of each variable’s contribution to model predictions compared to other approaches for addressing multicollinearity [50,51]. Consequently, this method facilitates the selection of important variables, thereby enhancing the interpretability of the model. The climate variable data, digital elevation data, and land-use data used for modeling were standardized to a spatial resolution of 1 km using the resampling tool in ArcGIS 10.8.1.
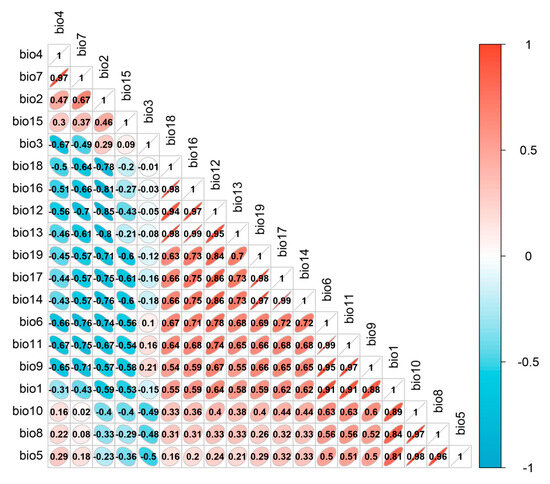
Figure 9.
Results of the correlation analysis of bioclimatic variables.
4.2. Species Distribution Model
This study employed an ensemble modeling approach known as presence–absence modeling, which consisted of four modeling methods: Generalized Linear Models (GLMs) [52], Generalized Boosted Models (GBMs) [53], Maximum Entropy Models (MaxEnt) [54], and Random Forest (RF) [55]. Default parameters were used for all models. The use of multiple modeling techniques can reduce the prediction bias caused by individual models, and ensemble modeling has been widely used in species distribution prediction [16,51]. The data were divided into training data (75%) and testing data (25%) [56]. We generated pseudo-absences in the same quantity as the Zelkova schneideriana specimen points to reduce uncertainty introduced by random sampling. Three sets of pseudo-absences were generated to balance the omission and commission errors in model predictions, and each algorithm was repeated 10 times [57]. All models and ensemble predictions were performed using the R 4.2.3 package “biomod2” [58].
We employed True Skill Statistics (TSS) [59] and the area under the Receiver Operating Characteristic curve (AUC) for model evaluation. AUC is not always sufficient to consider model fitness or to penalize excessive predictions [60]. Additionally, the median, being robust to outliers, is insensitive to abnormal values. Hence, in this study, we utilized a median ensemble based on TSS.
4.3. Analysis of Factors Influencing Changes in Distribution Range
To investigate the climate factors influencing the distribution of Zelkova schneideriana, our study randomly selected 1000 pixels within the current species’ distribution area and computed the density (frequency), mean, and 95% quantile of the four variables [61]. Additionally, to characterize the impact of land-use change on the distribution of Zelkova schneideriana, our study calculated the changes in land use compared to the current scenario within the study area using the future distribution areas.
4.4. Analysis of Changes in Distribution Range
To quantify the changes in the distribution range of Zelkova schneideriana, we first generated a binary map based on habitat suitability. A threshold of 0.7 was used to define suitability, such that locations with a probability of occurrence <0.7 were set to 0 and locations with a probability ≥0.7 were set to 1. Binary predictions are commonly used to estimate how future species ranges will be affected. Grid cells with a value of 1 indicate potentially suitable habitats for Zelkova schneideriana, whereas cells with a value of 0 are considered unsuitable due to inappropriate environmental conditions for the species’ growth. Subsequently, water, barren, cropland, and urban were identified as unsuitable for afforestation in both the current and future scenarios and were thus excluded from the suitable distribution range. The resulting areas define the potential habitat for Zelkova schneideriana [33].
To examine the anticipated direction of range shifts for each species, we calculated the latitudinal and elevational changes in the distribution range expansion and contraction of Zelkova schneideriana for both current and future periods. Firstly, we extracted the latitude and elevation values of each pixel within the expanding and contracting distribution ranges of Zelkova schneideriana. Then, a Mann–Whitney U test was conducted to analyze the differences between the two periods, with effect size employed as supplementary evidence due to the large sample size. All data extraction and analyses were performed using R 4.2.3.
In this study, Fragstats 4.2 software was used to calculate twelve landscape pattern indices to better characterize the internal structure of the distribution range of Zelkova schneideriana under current and future climate conditions. These twelve indices specifically include the area-weighted mean patch area (AREA_AM), standard deviation of patch area (AREA_SD), patch density (PD), number of patches (NP), area-weighted mean fractal dimension (FRAC_AM), area-weighted mean euclidean nearest-neighbor distance (ENN_AM), standard deviation of euclidean nearest-neighbor distance (ENN_SD), standard deviation of fractal dimension (FRAC_SD), area-weighted mean shape index (SHAPE_AM), standard deviation of shape index (SHAPE_SD), aggregation index (AI), and landscape division index (DIVISION). The calculation formulas and descriptions for each landscape index can be found on the official website of Fragstats 4.2 (https://www.fragstats.org.).
5. Conclusions
This study successfully reveals the changes in the distribution of Zelkova schneideriana under the SSP1-2.6 and SSP5-8.5 climate scenarios by ensemble species distribution models and Fragstats software. It clarifies the impacts of climate and land-use changes on the distribution of Zelkova schneideriana. In the future, the distribution of Zelkova schneideriana will not only face contraction but also fragmentation, with these challenges being more pronounced under the SSP5-8.5 climate scenario. Temperature emerges as the most important factor influencing the distribution of Zelkova schneideriana, and the occupation of non-forest areas will severely affect its distribution. Furthermore, incorporating monitoring and management into conservation planning is necessary to allow for flexible responses to unforeseen changes in habitat structure and quality. The findings of this study emphasize the immediate need for protective measures to mitigate the impact of climate change and habitat fragmentation on Zelkova schneideriana and similar key species. Focusing solely on changes in distribution areas is insufficient; monitoring and protecting the genetic diversity of Zelkova schneideriana communities should also be prioritized. It is hoped that this study will serve as a reference and inspiration for future research on the effects of climate and land-use changes on plant distribution and quantification.
Author Contributions
Y.Z. provided project administration and resources. Q.S. and Z.Z. provided funding acquisition, project administration, and resources. C.W. performed the research collection and analyzed and interpreted the data. C.W. wrote the manuscript with contributions from all the co-authors. All authors have read and agreed to the published version of the manuscript.
Funding
This research was funded by the Postgraduate Research and Practice Innovation Program of Jiangsu Province, grant number KYCX23_1261. This research was also funded by the Ministry of Education Humanities and Social Sciences Research “Study on the new mechanism of urban green space ecological benefit Measurement and high-quality collaborative development: A case study of Nanjing Metropolitan Area”: grant number 21YJCZH131; Young elite scientist sponsorship program by cast in China Association for Science and Technology: grant number YESS20220054; Social Science Foundation Project of Jiangsu Province: grant number 21GLC002; National Natural Science Foundation of China: grant number 32101582; Natural Science Foundation of Jiangsu Province of China: grant number BK20210613; The Natural Science Foundation of the Jiangsu Higher Education Institutions of China: grant number 21KJB220008; The National Natural Science Foundation of China: grant number 32071832. “Qing Lan Project” in Jiangsu Province of China: None. And the APC was funded by Qianqian Sheng.
Data Availability Statement
Data are contained within the article.
Conflicts of Interest
The authors declare no conflict of interest.
References
- Hooper, D.U.; Adair, E.C.; Cardinale, B.J.; Byrnes, J.E.K.; Hungate, B.A.; Matulich, K.L.; Gonzalez, A.; Duffy, J.E.; Gamfeldt, L.; O’Connor, M.I. A global synthesis reveals biodiversity loss as a major driver of ecosystem change. Nature 2012, 486, 105–108. [Google Scholar] [CrossRef] [PubMed]
- Santos, M.J.; Smith, A.B.; Dekker, S.C.; Eppinga, M.B.; Leitão, P.J.; Moreno-Mateos, D.; Morueta-Holme, N.; Ruggeri, M. The role of land use and land cover change in climate change vulnerability assessments of biodiversity: A systematic review. Landsc. Ecol. 2021, 36, 3367–3382. [Google Scholar] [CrossRef]
- Habibullah, M.S.; Din, B.H.; Tan, S.-H.; Zahid, H. Impact of climate change on biodiversity loss: Global evidence. Environ. Sci. Pollut. Res. 2022, 29, 1073–1086. [Google Scholar] [CrossRef] [PubMed]
- Pigot, A.L.; Merow, C.; Wilson, A.; Trisos, C.H. Abrupt expansion of climate change risks for species globally. Nat. Ecol. Evol. 2023, 7, 1060–1071. [Google Scholar] [CrossRef] [PubMed]
- Bellard, C.; Bertelsmeier, C.; Leadley, P.; Thuiller, W.; Courchamp, F. Impacts of climate change on the future of biodiversity. Ecol. Lett. 2012, 15, 365–377. [Google Scholar] [CrossRef] [PubMed]
- Pugnaire, F.I.; Morillo, J.A.; Peñuelas, J.; Reich, P.B.; Bardgett, R.D.; Gaxiola, A.; Wardle, D.A.; van der Putten, W.H. Climate change effects on plant-soil feedbacks and consequences for biodiversity and functioning of terrestrial ecosystems. Sci. Adv. 2019, 5, eaaz1834. [Google Scholar] [CrossRef] [PubMed]
- Sintayehu, D.W. Impact of climate change on biodiversity and associated key ecosystem services in Africa: A systematic review. Ecosyst. Health Sustain. 2018, 4, 225–239. [Google Scholar] [CrossRef]
- Oke, T.A.; Stralberg, D.; Reid, D.G.; Bennett, B.A.; Cannings, S.; Willier, C.; Fulkerson, J.R.; Cooke, H.A.; Mantyka-Pringle, C.S. Warming drives poleward range contractions of Beringian endemic plant species at high latitudes. Divers. Distrib. 2023, 29, 509–523. [Google Scholar] [CrossRef]
- Burrows, M.T.; Schoeman, D.S.; Richardson, A.J.; Molinos, J.G.; Hoffmann, A.; Buckley, L.B.; Moore, P.J.; Brown, C.J.; Bruno, J.F.; Duarte, C.M.; et al. Geographical limits to species-range shifts are suggested by climate velocity. Nature 2014, 507, 492–495. [Google Scholar] [CrossRef]
- Lenoir, J.; Gégout, J.C.; Marquet, P.A.; de Ruffray, P.; Brisse, H. A Significant Upward Shift in Plant Species Optimum Elevation During the 20th Century. Science 2008, 320, 1768–1771. [Google Scholar] [CrossRef]
- Lenoir, J.; Gégout, J.-C.; Guisan, A.; Vittoz, P.; Wohlgemuth, T.; Zimmermann, N.E.; Dullinger, S.; Pauli, H.; Willner, W.; Svenning, J.-C. Going against the flow: Potential mechanisms for unexpected downslope range shifts in a warming climate. Ecography 2010, 33, 295–303. [Google Scholar] [CrossRef]
- Marques, A.; Martins, I.S.; Kastner, T.; Plutzar, C.; Theurl, M.C.; Eisenmenger, N.; Huijbregts, M.A.J.; Wood, R.; Stadler, K.; Bruckner, M.; et al. Increasing impacts of land use on biodiversity and carbon sequestration driven by population and economic growth. Nat. Ecol. Evol. 2019, 3, 628–637. [Google Scholar] [CrossRef]
- Brondizio, E.S.; Settele, J.; Diaz, S.; Ngo, H.T. Global Assessment Report on Biodiversity and Ecosystem Services of the Intergovernmental Science-Policy Platform on Biodiversity and Ecosystem Services; IPBES Secretariat: Bonn, Germany, 2019. [Google Scholar] [CrossRef]
- VanDerWal, J.; Murphy, H.T.; Kutt, A.S.; Perkins, G.C.; Bateman, B.L.; Perry, J.J.; Reside, A.E. Focus on poleward shifts in species’ distribution underestimates the fingerprint of climate change. Nat. Clim. Chang. 2013, 3, 239–243. [Google Scholar] [CrossRef]
- Della Rocca, F.; Milanesi, P. Combining climate, land use change and dispersal to predict the distribution of endangered species with limited vagility. J. Biogeogr. 2020, 47, 1427–1438. [Google Scholar] [CrossRef]
- Song, H.J.; Ordonez, A.; Svenning, J.-C.; Qian, H.; Yin, X.; Mao, L.F.; Deng, T.; Zhang, J. Regional disparity in extinction risk: Comparison of disjunct plant genera between eastern Asia and eastern North America. Glob. Chang. Biol. 2021, 27, 1904–1914. [Google Scholar] [CrossRef] [PubMed]
- Chen, B.R.; Zou, H.; Zhang, B.Y.; Zhang, X.Y.; Wang, C.; Zhang, X.X. Distribution change and protected area planning of Tilia amurensis in China: A study of integrating the climate change and present habitat landscape pattern. Glob. Ecol. Conserv. 2023, 43, e02438. [Google Scholar] [CrossRef]
- Zhang, R.Q.; Yang, J.; Jin, X.L.; Tang, C.F.; Liu, H.L. Dynamic activity of endogenous plant hormones in Zelkova schneideriana during the growth of seedlings. Non-Wood For. Res. 2011, 29, 1–5. [Google Scholar]
- Cao, Y.F.; Liu, Z.H.; Zhao, H.E. Preliminary Investigation on the Suitability of Some Deciduous Broad-leaved Trees in Beijing. J. Chin. Landsc. Archit. 2005, 8, 62–66. [Google Scholar]
- Jin, X.L.; Zhang, R.Q.; Zhang, D.L.; He, P.; Cao, F.X. In vitro plant regeneration of Zelkova schneideriana, an endangered woody species in China, from leaf explants. J. Hortic. Sci. Biotechnol. 2009, 84, 415–420. [Google Scholar] [CrossRef]
- Ma, F.; Zhang, J.L. Investigation on Key Protected Wild Plant Resources in China; China Forestry Publishing House: Beijing, China, 2009. [Google Scholar]
- Shao, L.; Zhang, G. Niche and interspecific association of dominant tree populations of Zelkova schneideriana communities in eastern China. Bot. Sci. 2021, 99, 823–833. [Google Scholar] [CrossRef]
- Zhou, Y.R.; Lu, X.; Zhang, G.F. Potentially differential impacts on niche overlap between Chinese endangered Zelkova schneideriana and its associated tree species under climate change. Front. Ecol. Evol. 2023, 11, 1218149. [Google Scholar] [CrossRef]
- Fu, L.K.; Jin, J.M. China Plant Red Data Book-Rare and Endangered Plants; Science Press: Beijing, China, 1992; Volume 1. [Google Scholar]
- Liu, H.L.; Zhang, R.Q.; Geng, M.L.; Zhu, J.Y.; An, J.C.; Ma, J.L. Chloroplast analysis of Zelkova schneideriana (Ulmaceae): Genetic diversity, population structure, and conservation implications. Genet. Mol. Res. 2016, 15, 1–9. [Google Scholar] [CrossRef] [PubMed]
- Sun, J.J.; Qiu, H.J.; Guo, J.H.; Xu, X.; Wu, D.T.; Zhong, L.; Jiang, B.; Jiao, J.J.; Yuan, W.G.; Huang, Y.J.; et al. Modeling the potential distribution of Zelkova schneideriana under different human activity intensities and climate change patterns in China. Glob. Ecol. Conserv. 2020, 21, e00840. [Google Scholar] [CrossRef]
- Titeux, N.; Henle, K.; Mihoub, J.-B.; Regos, A.; Geijzendorffer, I.R.; Cramer, W.; Verburg, P.H.; Brotons, L. Biodiversity scenarios neglect future land-use changes. Glob. Chang. Biol. 2016, 22, 2505–2515. [Google Scholar] [CrossRef]
- Curd, A.; Chevalier, M.; Vasquez, M.; Boyé, A.; Firth, L.B.; Marzloff, M.P.; Bricheno, L.M.; Burrows, M.T.; Bush, L.E.; Cordier, C.; et al. Applying landscape metrics to species distribution model predictions to characterize internal range structure and associated changes. Glob. Chang. Biol. 2023, 29, 631–647. [Google Scholar] [CrossRef] [PubMed]
- Lausch, A.; Blaschke, T.; Haase, D.; Herzog, F.; Syrbe, R.-U.; Tischendorf, L.; Walz, U. Understanding and quantifying landscape structure—A review on relevant process characteristics, data models and landscape metrics. Ecol. Model. 2015, 295, 31–41. [Google Scholar] [CrossRef]
- Wang, C.; Sheng, Q.Q.; Zhao, R.N.; Zhu, Z.L. Differences in the Suitable Distribution Area between Northern and Southern China Landscape Plants. Plants 2023, 12, 2710. [Google Scholar] [CrossRef]
- He, Y.L.; Ma, J.M.; Chen, G.S. Potential geographical distribution and its multi-factor analysis of Pinus massoniana in China based on the maxent model. Ecol. Indic. 2023, 154, 110790. [Google Scholar] [CrossRef]
- Sun, S.X.; Zhang, Y.; Huang, D.Z.; Wang, H.; Cao, Q.; Fan, P.X.; Yang, N.; Zheng, P.M.; Wang, R.Q. The effect of climate change on the richness distribution pattern of oaks (Quercus L.) in China. Sci. Total Environ. 2020, 744, 140786. [Google Scholar] [CrossRef]
- Wang, Y.Y.; Chao, B.X.; Dong, P.; Zhang, D.; Yu, W.W.; Hu, W.J.; Ma, Z.Y.; Chen, G.C.; Liu, Z.H.; Chen, B. Simulating spatial change of mangrove habitat under the impact of coastal land use: Coupling MaxEnt and Dyna-CLUE models. Sci. Total Environ. 2021, 788, 147914. [Google Scholar] [CrossRef]
- Shi, X.D.; Wang, J.W.; Zhang, L.; Chen, S.X.; Zhao, A.L.; Ning, X.D.; Fan, G.R.; Wu, N.S.; Zhang, L.; Wang, Z.D. Prediction of the potentially suitable areas of Litsea cubeba in China based on future climate change using the optimized MaxEnt model. Ecol. Indic. 2023, 148, 110093. [Google Scholar] [CrossRef]
- Xie, C.P.; Li, M.; Chen, L.; Jim, C.Y. Climate-driven changes to the spatial–temporal pattern of endangered tree Toona ciliata Roem. in China. Theor. Appl. Climatol. 2023, 1–15. [Google Scholar] [CrossRef]
- Kuhn, E.; Gégout, J.-C. Highlighting declines of cold-demanding plant species in lowlands under climate warming. Ecography 2019, 42, 36–44. [Google Scholar] [CrossRef]
- Mamet, S.D.; Brown, C.D.; Trant, A.J.; Laroque, C.P. Shifting global Larix distributions: Northern expansion and southern retraction as species respond to changing climate. J. Biogeogr. 2019, 46, 30–44. [Google Scholar] [CrossRef]
- Loarie, S.R.; Duffy, P.B.; Hamilton, H.; Asner, G.P.; Field, C.B.; Ackerly, D.D. The velocity of climate change. Nature 2009, 462, 1052–1055. [Google Scholar] [CrossRef] [PubMed]
- Liao, J.H. Study on the Growth Law and the Community Characteristics of Zelkova Schneideriana in Northwest of Guangxi. Master’s Thesis, Guangxi University, Nanning, China, 2014. [Google Scholar]
- Soomers, H.; Karssenberg, D.; Verhoeven, J.T.A.; Verweij, P.A.; Wassen, M.J. The effect of habitat fragmentation and abiotic factors on fen plant occurrence. Biodivers. Conserv. 2013, 22, 405–424. [Google Scholar] [CrossRef]
- Ozinga, W.A.; Römermann, C.; Bekker, R.M.; Prinzing, A.; Tamis, W.L.M.; Schaminée, J.H.J.; Hennekens, S.M.; Thompson, K.; Poschlod, P.; Kleyer, M.; et al. Dispersal failure contributes to plant losses in NW Europe. Ecol. Lett. 2009, 12, 66–74. [Google Scholar] [CrossRef] [PubMed]
- Jump, A.S.; Peñuelas, J. Running to stand still: Adaptation and the response of plants to rapid climate change. Ecol. Lett. 2005, 8, 1010–1020. [Google Scholar] [CrossRef]
- Turbek, S.P.; Taylor, S.A. Hybridization provides climate resilience. Nat. Clim. Chang. 2023, 13, 212–213. [Google Scholar] [CrossRef]
- Brauer, C.J.; Sandoval-Castillo, J.; Gates, K.; Hammer, M.P.; Unmack, P.J.; Bernatchez, L.; Beheregaray, L.B. Natural hybridization reduces vulnerability to climate change. Nat. Clim. Chang. 2023, 13, 282–289. [Google Scholar] [CrossRef]
- Zhang, B.Y.; Zou, H.; Chen, B.R.; Zhang, X.Y.; Kang, X.; Wang, C.; Zhang, X.X. Optimizing the distribution pattern of species under climate change: The protection and management of Phellodendron amurense in China. Front. Ecol. Evol. 2023, 11, 1186627. [Google Scholar] [CrossRef]
- Wu, T.W.; Lu, Y.X.; Fang, Y.J.; Xin, X.G.; Li, L.; Li, W.P.; Jie, W.H.; Zhang, J.; Liu, Y.M.; Zhang, L.; et al. The Beijing Climate Center Climate System Model (BCC-CSM): The main progress from CMIP5 to CMIP6. Geosci. Model Dev. 2019, 12, 1573–1600. [Google Scholar] [CrossRef]
- Xin, X.G.; Wu, T.W.; Zhang, J.; Zhang, F.; Li, W.P.; Zhang, Y.W.; Lu, Y.X.; Fang, Y.J.; Jie, W.H.; Zhang, L.; et al. Introduction of BCC models and its participation in CMIP6. Adv. Clim. Change Res. 2019, 15, 533. [Google Scholar] [CrossRef]
- Moss, R.H.; Edmonds, J.A.; Hibbard, K.A.; Manning, M.R.; Rose, S.K.; van Vuuren, D.P.; Carter, T.R.; Emori, S.; Kainuma, M.; Kram, T.; et al. The next generation of scenarios for climate change research and assessment. Nature 2010, 463, 747–756. [Google Scholar] [CrossRef]
- Chen, G.Z.; Li, X.; Liu, X.P. Global land projection based on plant functional types with a 1-km resolution under socio-climatic scenarios. Sci. Data 2022, 9, 125. [Google Scholar] [CrossRef] [PubMed]
- Mendoza-Fernández, A.J.; Martínez-Hernández, F.; Salmerón-Sánchez, E.; Pérez-García, F.J.; Teruel, B.; Merlo, M.E.; Mota, J.F. The Relict Ecosystem of Maytenus senegalensis subsp. europaea in an Agricultural Landscape: Past, Present and Future Scenarios. Land 2021, 10, 1. [Google Scholar] [CrossRef]
- Guo, Y.L.; Zhao, Z.F.; Zhu, F.X.; Gao, B. The impact of global warming on the potential suitable planting area of Pistacia chinensis is limited. Sci. Total Environ. 2023, 864, 161007. [Google Scholar] [CrossRef] [PubMed]
- Nelder, J.A.; Wedderburn, R.W.M. Generalized Linear Models. J. R. Stat. Soc. 1972, 135, 370–384. [Google Scholar] [CrossRef]
- Friedman, J.H. Greedy Function Approximation: A Gradient Boosting Machine. Ann. Stat. 2001, 29, 1189–1232. [Google Scholar] [CrossRef]
- Phillips, S.J.; Anderson, R.P.; Dudík, M.; Schapire, R.E.; Blair, M.E. Opening the black box: An open-source release of Maxent. Ecography 2017, 40, 887–893. [Google Scholar] [CrossRef]
- Breiman, L. Random Forests. Mach. Learn. 2001, 45, 5–32. [Google Scholar] [CrossRef]
- Franklin, J. Mapping Species Distributions: Spatial Inference and Prediction; Cambridge University Press: Cambridge, UK, 2010. [Google Scholar]
- Barbet-Massin, M.; Jiguet, F.; Albert, C.H.; Thuiller, W. Selecting pseudo-absences for species distribution models: How, where and how many? Methods Ecol. Evol. 2012, 3, 327–338. [Google Scholar] [CrossRef]
- Thuiller, W.; Lafourcade, B.; Engler, R.; Araújo, M.B. BIOMOD—A platform for ensemble forecasting of species distributions. Ecography 2009, 32, 369–373. [Google Scholar] [CrossRef]
- Allouche, O.; Tsoar, A.; Kadmon, R. Assessing the accuracy of species distribution models: Prevalence, kappa and the true skill statistic (TSS). J. Appl. Ecol. 2006, 43, 1223–1232. [Google Scholar] [CrossRef]
- Lobo, J.M.; Jiménez-Valverde, A.; Real, R. AUC: A misleading measure of the performance of predictive distribution models. Glob. Ecol. Biogeogr. 2008, 17, 145–151. [Google Scholar] [CrossRef]
- Tagliari, M.M.; Danthu, P.; Leong Pock Tsy, J.-M.; Cornu, C.; Lenoir, J.; Carvalho-Rocha, V.; Vieilledent, G. Not all species will migrate poleward as the climate warms: The case of the seven baobab species in Madagascar. Glob. Chang. Biol. 2021, 27, 6071–6085. [Google Scholar] [CrossRef]


Disclaimer/Publisher’s Note: The statements, opinions and data contained in all publications are solely those of the individual author(s) and contributor(s) and not of MDPI and/or the editor(s). MDPI and/or the editor(s) disclaim responsibility for any injury to people or property resulting from any ideas, methods, instructions or products referred to in the content. |
© 2024 by the authors. Licensee MDPI, Basel, Switzerland. This article is an open access article distributed under the terms and conditions of the Creative Commons Attribution (CC BY) license (https://creativecommons.org/licenses/by/4.0/).