

Genome-Wide Association Mapping of Macronutrient Mineral Accumulation in Wheat (Triticum aestivum L.) Grain


Abstract
1. Introduction
2. Results
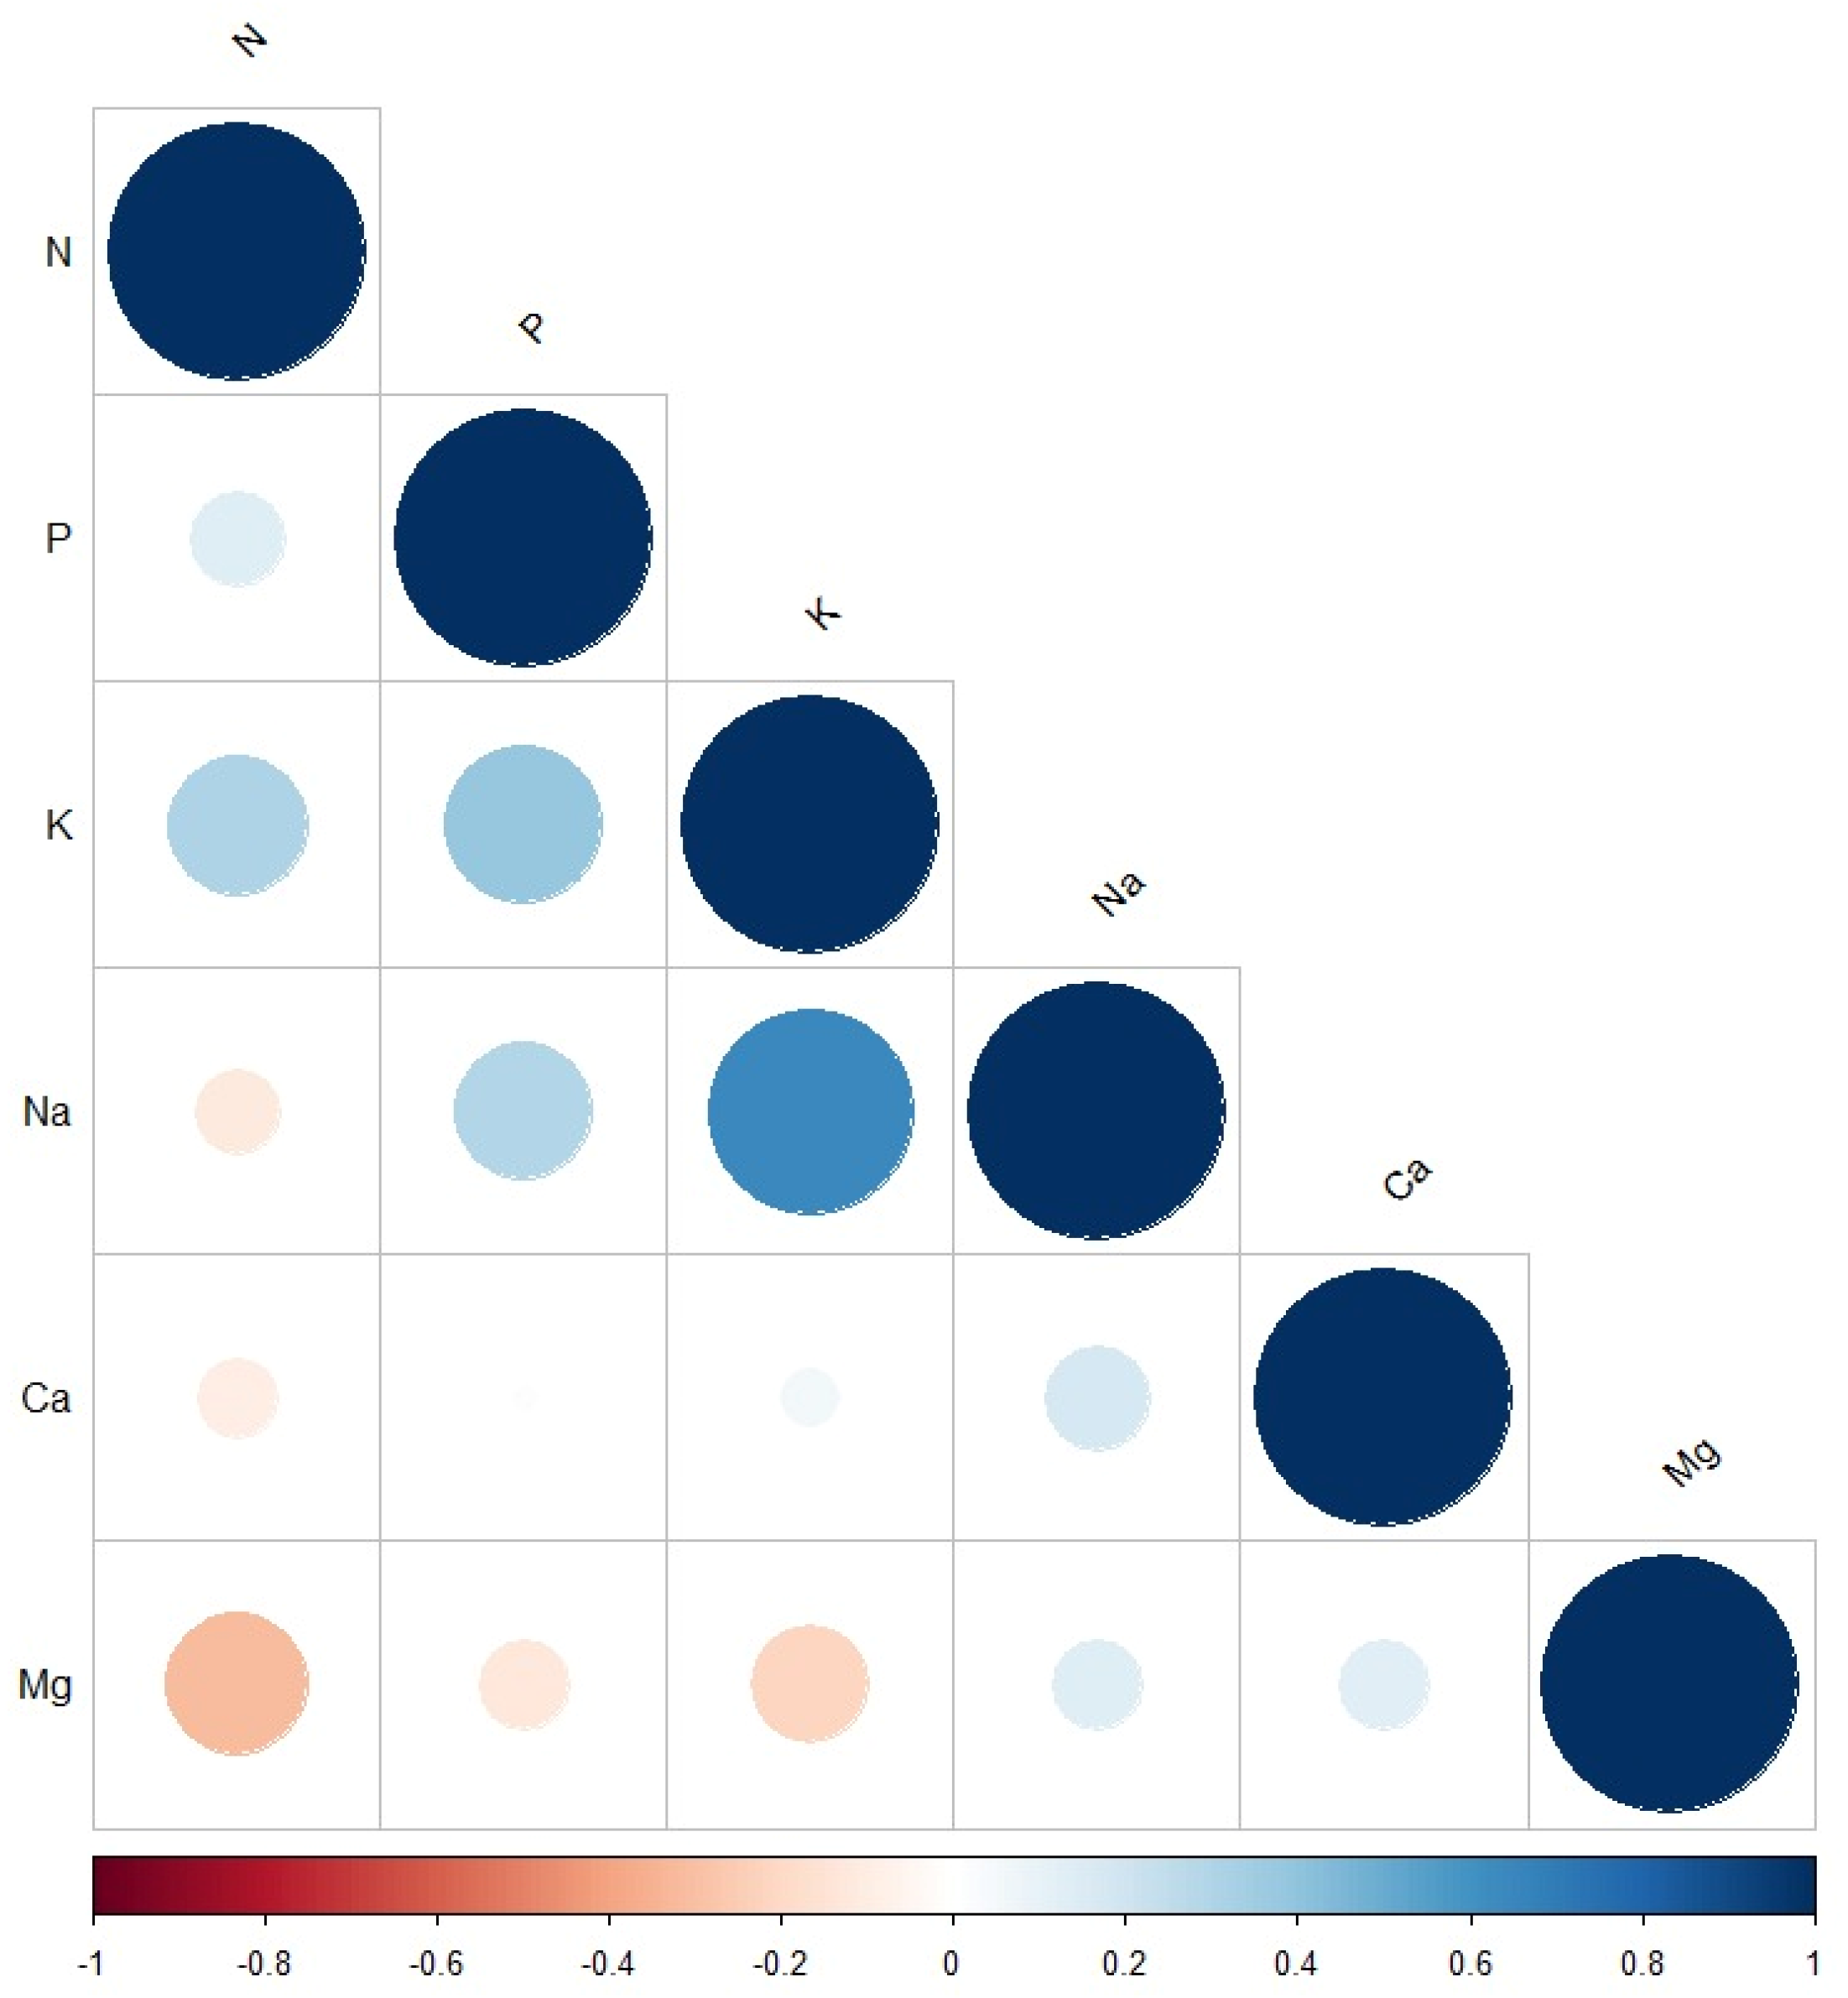
2.1. Statistical Analysis
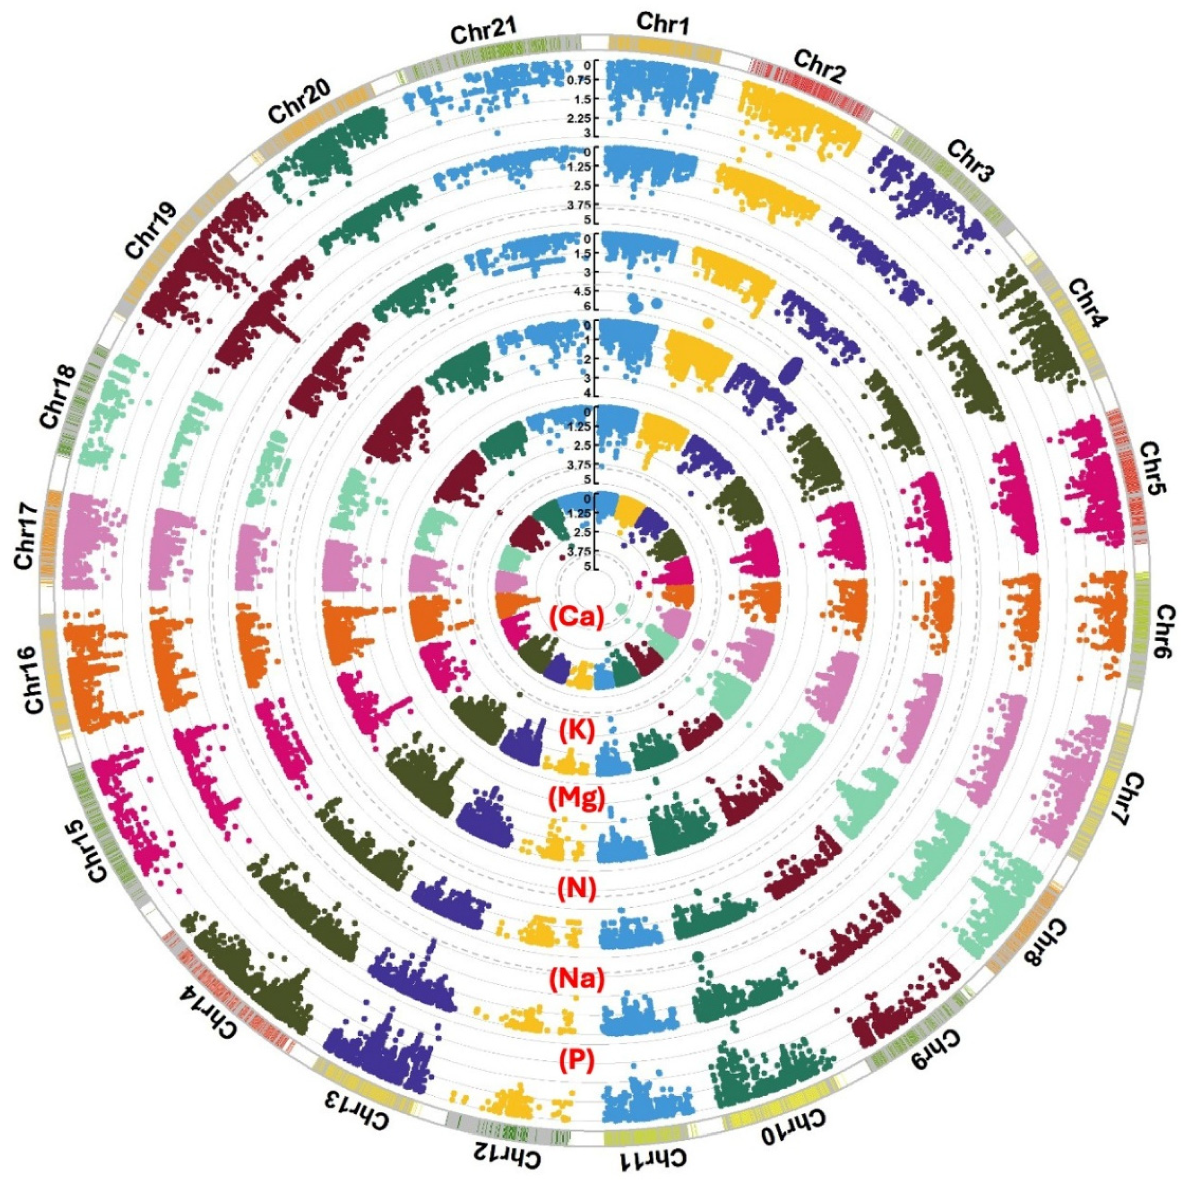
2.2. Genome-Wide Association Mapping
2.3. Genomic Prediction
3. Discussion
4. Materials and Methods
4.1. Plant Materials and Soil Conditions
4.2. Mineral Measurements
4.3. Statistical Analysis, Genome-Wide Association Mapping, and Genomic Prediction
4.4. Candidate Genes Identification
Supplementary Materials
Author Contributions
Funding
Data Availability Statement
Acknowledgments
Conflicts of Interest
References
- Foreign Agricultural Service, United States Department of Agriculture. Available online: https://fas.usda.gov/data/production/commodity/0410000 (accessed on 19 November 2024).
- Erenstein, O.; Jaleta, M.; Mottaleb, K.A.; Sonder, K.; Donovan, J.; Braun, H.-J. Global trends in wheat production, consumption and trade. In Wheat Improvement: Food Security in a Changing Climate; Reynolds, M.P., Braun, H.-J., Eds.; Springer International Publishing: Cham, Switzerland, 2022; pp. 47–66. [Google Scholar]
- Alomari, D.Z.; Alqudah, A.M.; Pillen, K.; von Wirén, N.; Röder, M.S. Toward identification of a putative candidate gene for nutrient mineral accumulation in wheat grains for human nutrition purposes. J. Exp. Bot. 2021, 72, 6305–6318. [Google Scholar] [CrossRef] [PubMed]
- Yan, S.; Wu, Y.; Fan, J.; Zhang, F.; Guo, J.; Zheng, J.; Wu, L. Quantifying grain yield, protein, nutrient uptake and utilization of winter wheat under various drip fertigation regimes. Agric. Water Manag. 2022, 261, 107380. [Google Scholar] [CrossRef]
- Bhatta, M.; Baenziger, P.S.; Waters, B.M.; Poudel, R.; Belamkar, V.; Poland, J.; Morgounov, A. Genome-wide association study reveals novel genomic regions associated with 10 grain minerals in synthetic hexaploid wheat. Int. J. Mol. Sci. 2018, 19, 3237. [Google Scholar] [CrossRef] [PubMed]
- Liu, J.; Huang, L.; Li, T.; Liu, Y.; Yan, Z.; Tang, G.; Zheng, Y.; Liu, D.; Wu, B. Genome-wide association study for grain micronutrient concentrations in wheat advanced lines derived from wild emmer. Front. Plant Sci. 2021, 12. [Google Scholar] [CrossRef] [PubMed]
- El-Soda, M.; Aljabri, M. Genome-wide association mapping of grain metal accumulation in wheat. Genes 2022, 13, 1052. [Google Scholar] [CrossRef]
- Rathan, N.D.; Krishna, H.; Ellur, R.K.; Sehgal, D.; Govindan, V.; Ahlawat, A.K.; Krishnappa, G.; Jaiswal, J.P.; Singh, J.B.; Sv, S.; et al. Genome-wide association study identifies loci and candidate genes for grain micronutrients and quality traits in wheat (Triticum aestivum L.). Sci. Rep. 2022, 12, 7037. [Google Scholar] [CrossRef]
- Sabiha, J.; Siddque, N.; Waheed, S.; Uz Zaman, Q.; Aslam, A.; Tufail, M.; Nasir, R. Uptake of heavy metal in wheat from application of different phosphorus fertilizers. J. Food Compos. Anal. 2023, 115, 104958. [Google Scholar] [CrossRef]
- Lan, Y.; Kuktaite, R.; Chawade, A.; Johansson, E. Chasing high and stable wheat grain mineral content: Mining diverse spring genotypes under induced drought stress. PLoS ONE 2024, 19, e0298350. [Google Scholar] [CrossRef]
- Sigalas, P.P.; Shewry, P.R.; Riche, A.; Wingen, L.; Feng, C.; Siluveru, A.; Chayut, N.; Burridge, A.; Uauy, C.; Castle, M.; et al. Improving wheat grain composition for human health by constructing a QTL atlas for essential minerals. Commun. Biol. 2024, 7, 1001. [Google Scholar] [CrossRef]
- Alomari, D.Z.; Eggert, K.; von Wirén, N.; Pillen, K.; Röder, M.S. Genome-wide association study of calcium accumulation in grains of European wheat cultivars. Front. Plant Sci. 2017, 8. [Google Scholar] [CrossRef]
- Ahmad, A.; Aslam, Z.; Javed, T.; Hussain, S.; Raza, A.; Shabbir, R.; Mora-Poblete, F.; Saeed, T.; Zulfiqar, F.; Ali, M.M.; et al. Screening of wheat (Triticum aestivum L.) genotypes for drought tolerance through agronomic and physiological response. Agronomy 2022, 12, 287. [Google Scholar] [CrossRef]
- Shi, X.; Zhou, Z.; Li, W.; Qin, M.; Yang, P.; Hou, J.; Huang, F.; Lei, Z.; Wu, Z.; Wang, J. Genome-wide association study reveals the genetic architecture for calcium accumulation in grains of hexaploid wheat (Triticum aestivum L.). BMC Plant Biol. 2022, 22, 229. [Google Scholar] [CrossRef] [PubMed]
- Kong, L.; Xie, Y.; Hu, L.; Si, J.; Wang, Z. Excessive nitrogen application dampens antioxidant capacity and grain filling in wheat as revealed by metabolic and physiological analyses. Sci. Rep. 2017, 7, 43363. [Google Scholar] [CrossRef] [PubMed]
- Elhanafi, L.; Houhou, M.; Rais, C.; Mansouri, I.; Elghadraoui, L.; Greche, H. Impact of excessive nitrogen fertilization on the biochemical quality, phenolic compounds, and antioxidant power of Sesamum indicum L seeds. J. Food Qual. 2019, 2019, 9428092. [Google Scholar] [CrossRef]
- Khan, F.; Siddique, A.B.; Shabala, S.; Zhou, M.; Zhao, C. Phosphorus plays key roles in regulating plants’ physiological responses to abiotic stresses. Plants 2023, 12, 2861. [Google Scholar] [CrossRef]
- Shukla, D.; Rinehart, C.A.; Sahi, S.V. Comprehensive study of excess phosphate response reveals ethylene mediated signaling that negatively regulates plant growth and development. Sci. Rep. 2017, 7, 3074. [Google Scholar] [CrossRef]
- Pan, Y.; Song, Y.; Zhao, L.; Chen, P.; Bu, C.; Liu, P.; Zhang, D. The genetic basis of phosphorus utilization efficiency in plants provide new insight into woody perennial plants improvement. Int. J. Mol. Sci. 2022, 23, 2353. [Google Scholar] [CrossRef]
- Xu, X.; Du, X.; Wang, F.; Sha, J.; Chen, Q.; Tian, G.; Zhu, Z.; Ge, S.; Jiang, Y. Effects of potassium levels on plant growth, accumulation and distribution of carbon, and nitrate metabolism in apple dwarf rootstock seedlings. Front. Plant Sci. 2020, 11. [Google Scholar] [CrossRef]
- Nieves-Cordones, M.; Al Shiblawi, F.R.; Sentenac, H. Roles and transport of sodium and potassium in plants. In The Alkali Metal Ions: Their Role for Life; Sigel, A., Sigel, H., Sigel, R.K.O., Eds.; Springer International Publishing: Cham, Switzerland, 2016; pp. 291–324. [Google Scholar]
- Hepler, P.K. Calcium: A central regulator of plant growth and development. Plant Cell 2005, 17, 2142–2155. [Google Scholar] [CrossRef]
- Dayod, M.; Tyerman, S.D.; Leigh, R.A.; Gilliham, M. Calcium storage in plants and the implications for calcium biofortification. Protoplasma 2010, 247, 215–231. [Google Scholar] [CrossRef]
- Hermans, C.; Verbruggen, N. Physiological characterization of Mg deficiency in Arabidopsis thaliana. J. Exp. Bot. 2005, 56, 2153–2161. [Google Scholar] [CrossRef] [PubMed]
- Franklin, W.T.; Olsen, J.S.; Soltanpour, P.N. Effects of excessive magnesium in irrigation waters on wheat and corn growth. Commun. Soil Sci. Plant Anal. 1991, 22, 49–61. [Google Scholar] [CrossRef]
- Garg, M.; Sharma, N.; Sharma, S.; Kapoor, P.; Kumar, A.; Chunduri, V.; Arora, P. Biofortified crops generated by breeding, agronomy, and transgenic approaches are improving lives of millions of people around the world. Front. Nutr. 2018, 5, 12. [Google Scholar] [CrossRef] [PubMed]
- Ofori, K.F.; Antoniello, S.; English, M.M.; Aryee, A.N.A. Improving nutrition through biofortification—A systematic review. Front. Nutr. 2022, 9. [Google Scholar] [CrossRef]
- Kartseva, T.; Alqudah, A.M.; Aleksandrov, V.; Alomari, D.Z.; Doneva, D.; Arif, M.A.R.; Börner, A.; Misheva, S. Nutritional genomic approach for improving grain protein content in wheat. Foods 2023, 12, 1399. [Google Scholar] [CrossRef]
- El-Soda, M.; Sarhan, M.S. From gene mapping to gene editing, a guide from the Arabidopsis research. Annu. Plant Rev. 2021, 4, 733–766. [Google Scholar]
- García-Barrios, G.; Crespo-Herrera, L.; Cruz-Izquierdo, S.; Vitale, P.; Sandoval-Islas, J.S.; Gerard, G.S.; Aguilar-Rincón, V.H.; Corona-Torres, T.; Crossa, J.; Pacheco-Gil, R.A. Genomic prediction from multi-environment trials of wheat breeding. Genes 2024, 15, 417. [Google Scholar] [CrossRef]
- Meuwissen, T.H.E.; Hayes, B.J.; Goddard, M.E. Prediction of total genetic value using genome-wide dense marker maps. Genetics 2001, 157, 1819–1829. [Google Scholar] [CrossRef]
- Endelman, J.B. Ridge regression and other kernels for genomic selection with R package rrBLUP. Plant Genome 2011, 4. [Google Scholar] [CrossRef]
- Said, A.A.; MacQueen, A.H.; Shawky, H.; Reynolds, M.; Juenger, T.E.; El-Soda, M. Genome-wide association mapping of genotype-environment interactions affecting yield-related traits of spring wheat grown in three watering regimes. Environ. Exp. Bot. 2022, 194, 104740. [Google Scholar] [CrossRef]
- Ayoubi, S.; Mehnatkesh, A.; Jalalian, A.; Sahrawat, K.L.; Gheysari, M. Relationships between grain protein, Zn, Cu, Fe and Mn contents in wheat and soil and topographic attributes. Arch. Agron. Soil Sci. 2014, 60, 625–638. [Google Scholar] [CrossRef]
- El-Soda, M.; Neris Moreira, C.; Goredema-Matongera, N.; Jamar, D.; Koornneef, M.; Aarts, M.G.M. QTL and candidate genes associated with leaf anion concentrations in response to phosphate supply in Arabidopsis thaliana. BMC Plant Biol. 2019, 19, 410. [Google Scholar] [CrossRef] [PubMed]
- Kumar, S.; Kumar, S.; Mohapatra, T. Interaction between macro- and micro-nutrients in plants. Front. Plant Sci. 2021, 12. [Google Scholar] [CrossRef] [PubMed]
- Shepelev, S.; Morgounov, A.; Flis, P.; Koksel, H.; Li, H.; Savin, T.; Sharma, R.; Wang, J.; Shamanin, V. Variation of macro- and microelements, and trace metals in spring wheat genetic resources in Siberia. Plants 2022, 11, 149. [Google Scholar] [CrossRef]
- Balyan, H.S.; Gupta, P.K.; Kumar, S.; Dhariwal, R.; Jaiswal, V.; Tyagi, S.; Agarwal, P.; Gahlaut, V.; Kumari, S. Genetic improvement of grain protein content and other health-related constituents of wheat grain. Plant Breed. 2013, 132, 446–457. [Google Scholar] [CrossRef]
- Debaeke, P.; Aussenac, T.; Fabre, J.L.; Hilaire, A.; Pujol, B.; Thuries, L. Grain nitrogen content of winter bread wheat (Triticum aestivum L.) as related to crop management and to the previous crop. Eur. J. Agron. 1996, 5, 273–286. [Google Scholar] [CrossRef]
- Yeoh, H.-H.; Wee, Y.-C. Leaf protein contents and nitrogen-to-protein conversion factors for 90 plant species. Food Chem. 1994, 49, 245–250. [Google Scholar] [CrossRef]
- Fujihara, S.; Sasaki, H.; Aoyagi, Y.; Sugahara, T. Nitrogen-to-protein conversion factors for some cereal products in Japan. J. Food Sci. 2008, 73, C204–C209. [Google Scholar] [CrossRef]
- Yamaguchi, M. Determination of the nitrogen-to-protein conversion factor in cereals. In Seed Analysis; Linskens, H.F., Jackson, J.F., Eds.; Springer: Berlin/Heidelberg, Germany, 1992; pp. 95–107. [Google Scholar]
- Tabbita, F.; Pearce, S.; Barneix, A.J. Breeding for increased grain protein and micronutrient content in wheat: Ten years of the GPC-B1 gene. J. Cereal Sci. 2017, 73, 183–191. [Google Scholar] [CrossRef]
- Boussakouran, A.; El Yamani, M.; Sakar, E.H.; Rharrabti, Y. Trend in yield and protein content relationship in a historical series of durum wheat varieties under rainfed and irrigated environments. Crop Environ. 2024, 3, 171–176. [Google Scholar] [CrossRef]
- Zhang, D.; Liu, J.; Li, D.; Batchelor, W.D.; Wu, D.; Zhen, X.; Ju, H. Future climate change impacts on wheat grain yield and protein in the North China Region. Sci. Total Environ. 2023, 902, 166147. [Google Scholar] [CrossRef] [PubMed]
- Ali, M.W.; Borrill, P. Applying genomic resources to accelerate wheat biofortification. Heredity 2020, 125, 386–395. [Google Scholar] [CrossRef] [PubMed]
- Lopes, M.S.; Dreisigacker, S.; Pena, R.J.; Sukumaran, S.; Reynolds, M.P. Genetic characterization of the wheat association mapping initiative (WAMI) panel for dissection of complex traits in spring wheat. TAG. Theor. Appl. Genetics. Theor. Angew. Genet. 2015, 128, 453–464. [Google Scholar] [CrossRef] [PubMed]
- Ahirwar, R.N.; Mishra, V.K.; Chand, R.; Budhlakoti, N.; Mishra, D.C.; Kumar, S.; Singh, S.; Joshi, A.K. Genome-wide association mapping of spot blotch resistance in wheat association mapping initiative (WAMI) panel of spring wheat (Triticum aestivum L.). PLoS ONE 2018, 13, e0208196. [Google Scholar] [CrossRef]
- Alqudah, A.M.; Elkelish, A.; Abu-Elsaoud, A.M.; Hassan, S.E.-D.; Thabet, S.G. Genome-wide association study reveals the genetic basis controlling mineral accumulation in wheat grains under potassium deficiency. Genet. Resour. Crop Evol. 2024. [Google Scholar] [CrossRef]
- Shi, R.-l.; Tong, Y.-p.; Jing, R.-l.; Zhang, F.-s.; Zou, C.-q. Characterization of quantitative trait loci for grain minerals in hexaploid wheat (Triticum aestivum L.). J. Integr. Agric. 2013, 12, 1512–1521. [Google Scholar] [CrossRef]
- El-Soda, M.; Malosetti, M.; Zwaan, B.J.; Koornneef, M.; Aarts, M.G. Genotype x environment interaction QTL mapping in plants: Lessons from Arabidopsis. Trends Plant Sci. 2014, 9, 390–398. [Google Scholar] [CrossRef]
- Manickavelu, A.; Hattori, T.; Yamaoka, S.; Yoshimura, K.; Kondou, Y.; Onogi, A.; Matsui, M.; Iwata, H.; Ban, T. Genetic nature of elemental contents in wheat grains and its genomic prediction: Toward the effective use of wheat landraces from Afghanistan. PLoS ONE 2017, 12, e0169416. [Google Scholar] [CrossRef]
- Zhou, Y.; Vales, M.I.; Wang, A.; Zhang, Z. Systematic bias of correlation coefficient may explain negative accuracy of genomic prediction. Brief. Bioinform. 2016, 18, 744–753. [Google Scholar] [CrossRef]
- Misztal, I.; Lourenco, D. Potential negative effects of genomic selection. J. Anim. Sci. 2024, 102, skae155. [Google Scholar] [CrossRef]
- Adelantado, J.V.G.; Martinez, V.P.; Garcia, A.P.; Reig, F.B. Atomic-absorption spectrometric determination of calcium, magnesium and potassium in leaf samples after decomposition with molten sodium hydroxide. Talanta 1991, 38, 959–963. [Google Scholar] [CrossRef] [PubMed]
- Bradbury, P.J.; Zhang, Z.; Kroon, D.E.; Casstevens, T.M.; Ramdoss, Y.; Buckler, E.S. TASSEL: Software for association mapping of complex traits in diverse samples. Bioinformatics 2007, 23, 2633–2635. [Google Scholar] [CrossRef] [PubMed]
- Wang, S.; Wong, D.; Forrest, K.; Allen, A.; Chao, S.; Huang, B.E.; Maccaferri, M.; Salvi, S.; Milner, S.G.; Cattivelli, L.; et al. Characterization of polyploid wheat genomic diversity using a high-density 90,000 single nucleotide polymorphism array. Plant Biotechnol. J. 2014, 12, 787–796. [Google Scholar] [CrossRef] [PubMed]
- Zhu, T.; Wang, L.; Rimbert, H.; Rodriguez, J.C.; Deal, K.R.; De Oliveira, R.; Choulet, F.; Keeble-Gagnère, G.; Tibbits, J.; Rogers, J.; et al. Optical maps refine the bread wheat Triticum aestivum cv. Chinese Spring genome assembly. Plant J. 2021, 107, 303–314. [Google Scholar] [CrossRef]
- Hassani-Pak, K.; Singh, A.; Brandizi, M.; Hearnshaw, J.; Parsons, J.D.; Amberkar, S.; Phillips, A.L.; Doonan, J.H.; Rawlings, C. KnetMiner: A comprehensive approach for supporting evidence-based gene discovery and complex trait analysis across species. Plant Biotechnol. J. 2021, 19, 1670–1678. [Google Scholar] [CrossRef]

| Macronutrient Minerals (mg·kg−1) | Min | Max | Mean | Standard Error |
|---|---|---|---|---|
| N | 0.58 | 3.37 | 1.44 | 0.0304 |
| P | 0.20 | 0.58 | 0.34 | 0.0045 |
| K | 0.21 | 0.62 | 0.41 | 0.0031 |
| Na | 0.06 | 0.12 | 0.09 | 0.0007 |
| Ca | 0.11 | 0.78 | 0.31 | 0.0083 |
| Mg | 0.03 | 0.38 | 0.17 | 0.0050 |
| Genotype | Macronutrient Minerals | GY | Category | |||||
|---|---|---|---|---|---|---|---|---|
| N | P | K | Na | Ca | Mg | |||
| 393392 | 1.18 | 0.37 | 0.38 | 0.086 | 0.27 | 0.23 | 25.01 | High yield |
| 1706327 | 1.29 | 0.31 | 0.42 | 0.095 | 0.34 | 0.16 | 26.32 | |
| 346403 | 1.06 | 0.36 | 0.34 | 0.076 | 0.19 | 0.15 | 26.94 | |
| 3597332 | 1.12 | 0.32 | 0.39 | 0.075 | 0.31 | 0.13 | 25.00 | |
| 294568 | 1.39 | 0.33 | 0.42 | 0.096 | 0.20 | 0.09 | 25.32 | |
| 80836 | 3.37 | 0.39 | 0.45 | 0.088 | 0.69 | 0.09 | 21.35 | High N content |
| 85599 | 3.06 | 0.34 | 0.44 | 0.088 | 0.17 | 0.14 | 16.90 | |
| 610288 | 2.94 | 0.34 | 0.4 | 0.065 | 0.25 | 0.07 | 14.98 | |
| 68315 | 2.90 | 0.45 | 0.46 | 0.088 | 0.20 | 0.07 | 12.60 | |
| 295261 | 2.90 | 0.37 | 0.48 | 0.010 | 0.30 | 0.06 | 18.63 | |
| 369673 | 1.88 | 0.58 | 0.62 | NA | 0.31 | 0.19 | 15.39 | High P content |
| 450975 | 2.86 | 0.53 | 0.44 | 0.069 | 0.15 | 0.08 | 18.84 | |
| 3669874 | 1.64 | 0.51 | 0.5 | 0.110 | 0.63 | 0.16 | 16.49 | |
| 1558746 | 1.31 | 0.51 | 0.45 | 0.105 | 0.44 | 0.18 | 15.87 | |
| 3586080 | 2.06 | 0.49 | 0.54 | NA | 0.29 | 0.25 | 23.30 | |
| 1812971 | 1.47 | 0.49 | 0.47 | 0.110 | 0.37 | 0.17 | 14.27 | |
| 369673 | 1.88 | 0.58 | 0.62 | NA | 0.31 | 0.19 | 15.39 | High K content |
| 3586080 | 2.06 | 0.49 | 0.54 | NA | 0.29 | 0.25 | 23.30 | |
| 3669874 | 1.64 | 0.51 | 0.50 | 0.110 | 0.63 | 0.16 | 16.49 | |
| 295261 | 2.90 | 0.37 | 0.48 | 0.100 | 0.30 | 0.06 | 18.63 | |
| 4318107 | 1.33 | 0.3 | 0.48 | 0.118 | 0.36 | 0.18 | 16.05 | |
| 4835640 | NA | 0.29 | 0.48 | 0.075 | 0.21 | 0.33 | 13.99 | |
| 4318107 | 1.33 | 0.30 | 0.48 | 0.113 | 0.36 | 0.18 | 16.05 | High Na content |
| 3600263 | 1.49 | 0.42 | 0.46 | 0.113 | 0.29 | 0.06 | 18.64 | |
| 4320047 | 1.39 | 0.30 | 0.46 | 0.113 | 0.24 | 0.20 | 13.06 | |
| 3669874 | 1.64 | 0.51 | 0.50 | 0.110 | 0.63 | 0.16 | 16.49 | |
| 1812971 | 1.47 | 0.49 | 0.47 | 0.110 | 0.37 | 0.17 | 14.27 | |
| 82710 | 1.51 | 0.48 | 0.43 | 0.110 | 0.41 | 0.22 | 13.57 | |
| 85587 | 1.37 | 0.30 | 0.35 | 0.086 | 0.78 | 0.15 | 19.97 | High Ca content |
| 41868 | 2.94 | 0.30 | 0.44 | 0.069 | 0.74 | NA | 12.59 | |
| 2244167 | 1.11 | 0.30 | 0.39 | 0.086 | 0.73 | 0.17 | 14.91 | |
| 3617481 | 1.14 | 0.29 | 0.41 | 0.094 | 0.69 | 0.18 | 17.37 | |
| 80836 | 3.37 | 0.39 | 0.45 | 0.088 | 0.69 | 0.09 | 21.35 | |
| 86005 | 1.47 | 0.35 | 0.37 | 0.095 | 0.30 | 0.38 | 13.75 | High Mg content |
| 126306 | 1.33 | 0.26 | 0.36 | 0.090 | 0.49 | 0.35 | 18.41 | |
| 640876 | 1.49 | 0.40 | 0.38 | 0.090 | 0.29 | 0.34 | 17.13 | |
| 88701 | 1.06 | 0.28 | 0.33 | 0.081 | 0.28 | 0.33 | 12.92 | |
| 41372 | 1.37 | 0.28 | 0.40 | 0.086 | 0.22 | 0.32 | 14.30 | |
| Trait | Marker | Chr | Pos | −LOG10 (P) | R2 | Allele (Alternate) | Effect | Gene Name in RefSeq_v2 |
|---|---|---|---|---|---|---|---|---|
| N | RAC875_c32452_55 | 1A | 86 | 4.928 | 0.11 | C(T) | −0.41 | TraesCS1A03G0802700LC |
| Excalibur_c8396_396 | 94 | 5.686 | 0.15 | A(C) | −0.71 | TraesCS1A03G0838000 | ||
| Excalibur_c8301_1555 | 101 | 5.501 | 0.12 | A(G) | 0.45 | TraesCS1A03G0846000 | ||
| RAC875_c51346_99 | 144 | 4.971 | 0.11 | C(T) | 0.43 | NA | ||
| Excalibur_c3596_144 | 1B | 86 | 5.228 | 0.11 | A(G) | 0.43 | TraesCS1B03G0941800 | |
| Ra_c1211_1656 | 1D | 103 | 4.869 | 0.10 | C(T) | 0.41 | TraesCS1D03G0769500 | |
| BS00028216_51 | 104 | 4.596 | 0.10 | A(C) | −0.39 | NA | ||
| IAAV6873 | 104 | 4.645 | 0.10 | A(T) | 0.41 | TraesCS1D03G0772200 | ||
| wsnp_Ra_c17989_26960545 | 104 | 4.508 | 0.10 | C(T) | 0.38 | TraesCS1D03G0786200 | ||
| Excalibur_c53900_86 | 104 | 4.157 | 0.09 | C(T) | −0.37 | TraesCS1D03G0781300 | ||
| Kukri_c12183_262 | 105 | 4.928 | 0.11 | C(T) | 0.41 | TraesCS1D03G0780300 | ||
| CAP7_c9557_164 | 105 | 4.257 | 0.09 | C(T) | −0.38 | TraesCS1D03G0789100 | ||
| Ra_c3045_1739 | 105 | 5.356 | 0.12 | G(T) | 0.44 | TraesCS1D03G0778200 | ||
| RFL_Contig651_953 | 107 | 4.086 | 0.08 | A(C) | −0.37 | TraesCS1D03G0792900 | ||
| Ra_c11906_1618 | 107 | 5.656 | 0.12 | A(G) | −0.46 | TraesCS1D03G0791300 | ||
| Ra_c11906_1441 | 107 | 5.639 | 0.12 | A(G) | −0.01 | TraesCS1D03G0791300 | ||
| Ra_c15730_3403 | 111 | 5.639 | 0.12 | A(G) | −0.46 | TraesCS1D03G0806600 | ||
| wsnp_Ra_rep_c70864_68811253 | 111 | 4.880 | 0.10 | A(G) | −0.41 | TraesCS1D03G0805600 | ||
| wsnp_Ku_c26635_36605013 | 111 | 5.639 | 0.12 | C(T) | 0.46 | TraesCS1D03G0803500 | ||
| RAC875_c55026_311 | 112 | 5.527 | 0.12 | C(T) | 0.45 | TraesCS1D03G0811800 | ||
| wsnp_Ku_c40309_48558476 | 112 | 4.458 | 0.09 | C(T) | 0.41 | TraesCS1D03G0813500 | ||
| wsnp_Ex_rep_c111610_93458148 | 113 | 5.685 | 0.13 | C(T) | 0.46 | TraesCS1D03G0813500 | ||
| RFL_Contig4705_3207 | 113 | 4.770 | 0.11 | C(T) | 0.41 | TraesCS1D03G0813600 | ||
| BS00063907_51 | 115 | 5.269 | 0.11 | C(T) | 0.43 | TraesCS1D03G0816500 | ||
| K | wsnp_Ex_c361_707953 | 3A | 177 | 4.357 | 0.10 | A(G) | 0.03 | TraesCS3A03G1209700 |
| BS00068508_51 | 177 | 4.310 | 0.09 | A(G) | 0.03 | TraesCS3A03G1210000LC | ||
| wsnp_Ex_c361_708712 | 177 | 4.369 | 0.10 | C(T) | −0.03 | TraesCS3A03G1209700 | ||
| Ca | D_F5XZDLF01EEKO2_217 | 3B | 35 | 4.189 | 0.09 | A(C) | −239.52 | TraesCS3B03G1455900 |
| Na | Excalibur_c2023_345 | 4A | 139 | 4.106 | 0.08 | A(G) | 73.05 | TraesCS4A03G1146300 |
| Properties | Depth (cm) | |
|---|---|---|
| 00–30 | 30–45 | |
| Soil pH | 7.5 | 8.2 |
| ECe (dS/m at 25 °C) | 2.1 | 2.5 |
| Available nitrogen (ppm) | 50 | 20 |
| Available phosphorus (ppm) | 20 | 22 |
| Available potassium (ppm) | 69 | 62 |
| CaCO3 % | 3.5 | 4.1 |
| Organic matter % | 1.9 | 1.4 |
Disclaimer/Publisher’s Note: The statements, opinions and data contained in all publications are solely those of the individual author(s) and contributor(s) and not of MDPI and/or the editor(s). MDPI and/or the editor(s) disclaim responsibility for any injury to people or property resulting from any ideas, methods, instructions or products referred to in the content. |
© 2024 by the authors. Licensee MDPI, Basel, Switzerland. This article is an open access article distributed under the terms and conditions of the Creative Commons Attribution (CC BY) license (https://creativecommons.org/licenses/by/4.0/).
Share and Cite
Aljabri, M.; El-Soda, M. Genome-Wide Association Mapping of Macronutrient Mineral Accumulation in Wheat (Triticum aestivum L.) Grain. Plants 2024, 13, 3472. https://doi.org/10.3390/plants13243472
Aljabri M, El-Soda M. Genome-Wide Association Mapping of Macronutrient Mineral Accumulation in Wheat (Triticum aestivum L.) Grain. Plants. 2024; 13(24):3472. https://doi.org/10.3390/plants13243472
Chicago/Turabian StyleAljabri, Maha, and Mohamed El-Soda. 2024. "Genome-Wide Association Mapping of Macronutrient Mineral Accumulation in Wheat (Triticum aestivum L.) Grain" Plants 13, no. 24: 3472. https://doi.org/10.3390/plants13243472
APA StyleAljabri, M., & El-Soda, M. (2024). Genome-Wide Association Mapping of Macronutrient Mineral Accumulation in Wheat (Triticum aestivum L.) Grain. Plants, 13(24), 3472. https://doi.org/10.3390/plants13243472