Abstract
In recent years, quinoa, as a nutritious and sustainable food material, has gained increasing popularity worldwide. To investigate the diversity of nutritional characteristics among different quinoa cultivars and explore their potential health benefits, metabolites of five quinoa cultivars (QL-1, SJ-1, SJ-2, KL-1 and KL-2) were compared by non-targeted metabolomics analysis based on UPLC-ZenoTOF-MS/MS in this study. A total of 248 metabolites across 13 categories were identified. Although the metabolite compositions were generally similar among the different quinoa cultivars, significant variations existed in their respective metabolite contents. Among the identified metabolites, amino acids/peptides, nucleosides, saponins and phenolic acids were the most abundant. Notably, SJ-1 exhibited the most distinct metabolite profile when compared to the other cultivars. Amino acids/peptides and nucleosides were found to be crucial factors contributing to the unique metabolite profile of SJ-1. Collectively, these aforementioned metabolites accounted for a substantial 60% of the total metabolites observed in each quinoa variety. Additionally, a correlation between the DPPH radical scavenging activity and the free phenolic content of quinoa was observed. Variations in phenolic content resulted in different antioxidant capacities among the quinoa cultivars, and SJ-1 exhibited lower phenolic levels and weaker antioxidant activity than the others. These results can provide important information for the development of quinoa resources.
1. Introduction
Plant-based foods have gained increasing attention all over the world due to growing concerns about the environmental, ethical, and health impacts associated with animal-sourced foods [1]. Plant seeds are important food ingredients because they provide not only essential nutrients like proteins, lipids, and carbohydrates, but also various small molecular substances that play important roles in maintaining human well-being [2]. For instance, some phytochemicals that are widely found in plant seeds, such as phenolic compounds and carotenoids, are well known for their various health-promoting properties, including antioxidant and anti-inflammatory effects [2]. In recent years, more and more research has focused on the antioxidant properties of phytochemicals in plant seeds [3,4].
Quinoa (Chenopodium quinoa Willd.) is often referred to as a pseudocereal because it belongs to dicotyledonous plants, but its seed has similar nutritional and functional characteristics with the grains of monocotyledonous plants, such as millet and rice [5]. In recent decades, quinoa has gained significant popularity worldwide because of its outstanding nutritional value and versatile functional properties.
Generally, quinoa has a lower starch content than grains, and a considerable proportion of starch in quinoa is indigestible starch, which makes quinoa a low-glycemic-index (GI) food [6]. Due to the small size of quinoa starch granules, it is suitable for the preparation of Pickering emulsions [7]. The excellent water retention and gelatinity of quinoa starch can improve the quality of gluten-free bread and help prepare biodegradable membranes [8]. In addition, quinoa contains a high level of protein and can exert some beneficial effects as a source of bioactive peptides [9], as well as a superior gel ability when compared with other plant proteins [10]. Quinoa protein is easier to digest than other grain-based proteins. Gullon et al. analyzed the in vitro digestibility of quinoa protein under various enzymatic hydrolysis systems, and showed that the in vitro digestibility of quinoa protein was ca. 78%, which was higher than that of wheat protein (ca. 55%) [11]. Quinoa also contains more soluble dietary fiber than other plant grains, including inulin, fructooligosaccharides, and galacto-oligosaccharides, which promote the production of short-chain fatty acids (acetic acid, butyric acid and propionic acid) by microorganisms; has a lower intestinal pH; and increases the formation of favorable bacteria [12]. In addition, quinoa contains abundant secondary metabolites, including phenolic acids, flavonoids and other antioxidants, which have been shown to be beneficial to human health [13]. It has been reported that quinoa contains more phenolic substances than most grains and legumes [14]. The regular consumption of polyphenol-containing diets can help prevent cancer, cardiovascular disease, diabetes, osteoporosis, and neurodegenerative diseases [15].
Different cultivars or growing areas have a significant influence on the nutritional characteristics of quinoa, especially in terms of secondary metabolites [16]. Therefore, a comparative analysis of bioactive small-molecule metabolites in quinoa from different cultivars and growing locations is essential to explore their nutritional potentials and the development of quinoa-based foods. Qinghai province is located in the northeastern part of the Tibetan Plateau, and has become a key area for quinoa cultivation in China due to its suitable climate and growing conditions. In the present study, the composition and content of small-molecule metabolites in five quinoa cultivars widely cultivated in Qinghai province were investigated. Meanwhile, their antioxidant abilities and contents of related substances were compared.
2. Results
2.1. Multivariate Statistical Analysis
The total ion chromatograms of the quality control (QC) and the five samples are shown in Figure S1A. A hierarchical cluster dendritic diagram was employed to explore the relationships and differences between the metabolites of the different quinoa cultivars (Figure S1B). The metabolite composition of SJ-1 exhibited a distinct pattern when compared to the other quinoa cultivars. Principal component analysis (PCA) and partial-least-squares discriminant analysis (PLS-DA) were also conducted to clarify the metabolite differences between the different quinoa cultivars. The first two main principal components (PC1 and PC2) from PCA accounted for 31.4% and 17.1% of total PCA, respectively (Figure S1C), and the samples were well separated. The metabolites of SJ-1 also differed greatly from other samples in both PCA and PLS-DA (Figure S1D). Meanwhile, the metabolites of SJ-2 and QL-1 appeared to display a relatively high degree of similarity, and the metabolite compositions of KL-1 and KL-2 exhibited a strong tendency to cluster closely together, which was consistent with the classification in the hierarchical cluster dendrogram.
2.2. Metabolite Composition Analysis
In total, 13 categories (namely amino acids/peptides, sesquiterpenes, nucleosides, phenolics, hormones, pigments, alkaloids, sugars, vitamins, coumarins, organic acids, saponins and others) and 248 kinds of metabolites were detected in the five quinoa cultivars (Figure 1A). There were 78 kinds of phenolics detected, which was the highest among the 13 categories, followed by saponins (41 kinds), amino acids/peptides (34 kinds), organic acids (19 kinds) and nucleosides (19 kinds). The numbers of metabolites in other categories were less than 15. However, 24 metabolites were classified under the category of other. As shown in Figure 1B, the relative content of phenolics was the highest within all the cultivars. After phenolics, vitamins exhibited the second-highest level of their relative content, followed by saponins, sugars and amino acids. The compositions of detected metabolites in different categories in quinoa are shown in Table S1.
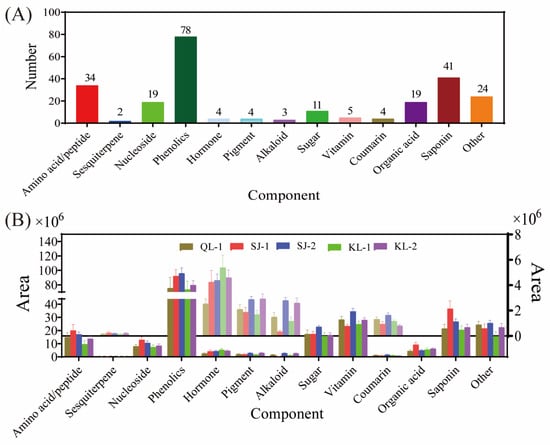
Figure 1.
Metabolite composition of different cultivars of quinoa. The number of metabolic species detected (A). The area of different species of metabolites in different cultivars of quinoa (B).
The relative content of four groups of metabolites (amino acids/peptides, phenolic acids, saponins and nucleosides) and the PCA analysis of individual metabolites are shown in Figure 2, and loading plots as well as the hierarchical clustering heatmap are shown in the Supplementary Materials (Figures S2–S9). SJ-1 had the highest relative content of amino acids/peptides (Figure 2A), saponins (Figure 2E), and nucleosides (Figure 2G) among all the cultivars. SJ-1 and SJ-2 had a similar level of phenolic acids and there were no significant differences among KL-1, KL-2, and QL-1 (Figure 2C). KL-1 had the lowest levels of these four metabolites among all cultivars.
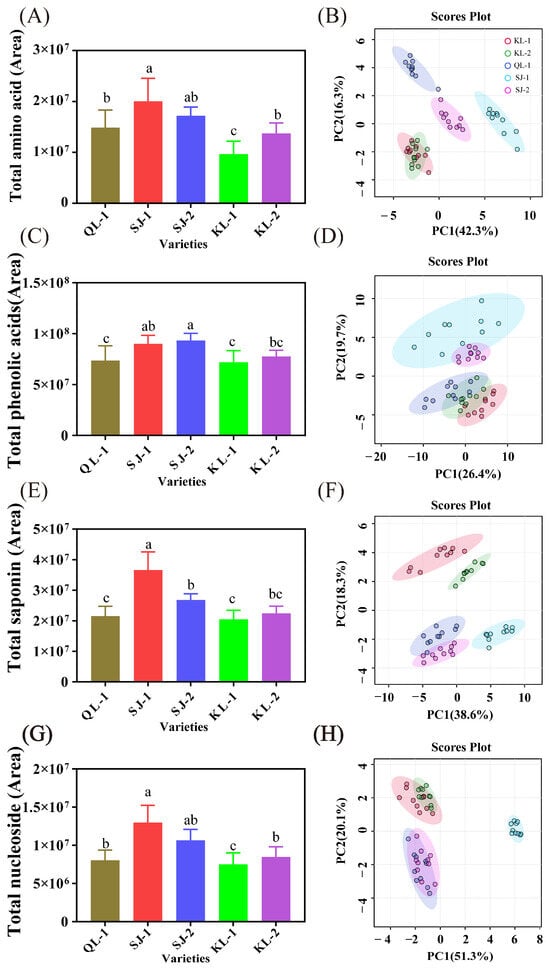
Figure 2.
The area of total amino acids (A), phenolic acids (C), saponins (E) and nucleosides (G) and PCA analysis of individual metabolites (B,D,F,H). Bars with different letters indicate significant differences at p < 0.05 for each index.
In the PCA analysis of four metabolites, SJ-1 showed significant differences in amino acids/peptides and saponins from other cultivars in terms of the PC1 (Figure 2B,H). In the PCA analysis of phenolic acids, a distinct clustering pattern emerged, with SJ-1 and SJ-2 forming a distinct group, while the remaining three cultivars clustered together (Figure 2D). In terms of saponin, a distinct group was formed between QL-1 and SJ-2 (Figure 2F).
2.3. Analysis of Differences in Different Metabolites
2.3.1. Amino Acids/Peptides
The area of the six amino acids/peptides accounting for more than 50% of all amino acids are shown in Figure 3A. Glutathione (oxidized) was the most abundant type in these cultivars of quinoa and SJ-2 had the highest amount of Glutathione (oxidized). However, the ratios of Glutathione (oxidized) in all amino acids among cultivars varied from 27.34% to 47.14% (Figure 3B). N-acetyl-1-phenalanine was detected only in QL-1 and acetyl-1-isoleucine was not detected in SJ-1.
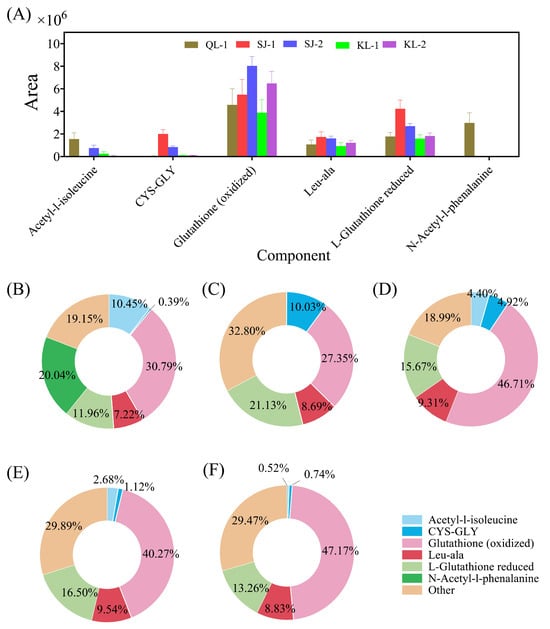
Figure 3.
The relative contents of amino acids/peptides in different cultivars of quinoa (A) and their ratios in different quinoa cultivars: QL-1 (B), SJ-1 (C), SJ-2 (D), KL-1 (E) and KL-2 (F).
2.3.2. Phenolics
The areas of phenolics of a relatively high content in quinoa are shown in Figure 4. Isorhamnetin, kaempferol and quercetin were three main phenolics present in the five cultivars of quinoa and constituted for ca. 50% of the total areas. Generally, the contents of these phenolics in the SJ cultivars were higher than those of other cultivars. About 30% of the relative monomer contents were classified into the category of others.
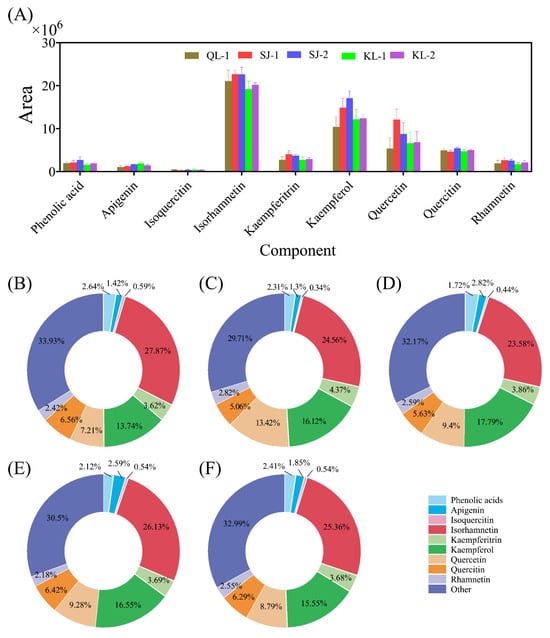
Figure 4.
The area of main phenolic acids in different cultivars of quinoa (A). Relative monomer content of quinoa phenolic acids of different cultivars: QL-1 (B), SJ-1 (C), SJ-2 (D), KL-1 (E) and KL-2 (F).
2.3.3. Saponins
The area of saponins with a higher content in quinoa is shown in Figure 5A. The relative content of the saponin monomers of all cultivars of quinoa is shown in Figure 5B–F. The profile of saponin monomers detected were similar among the different cultivars of quinoa. The highest contents of saponin monomers consisted of phytolaccagenic acids or quinoasaponin, but their contents varied among the cultivars.
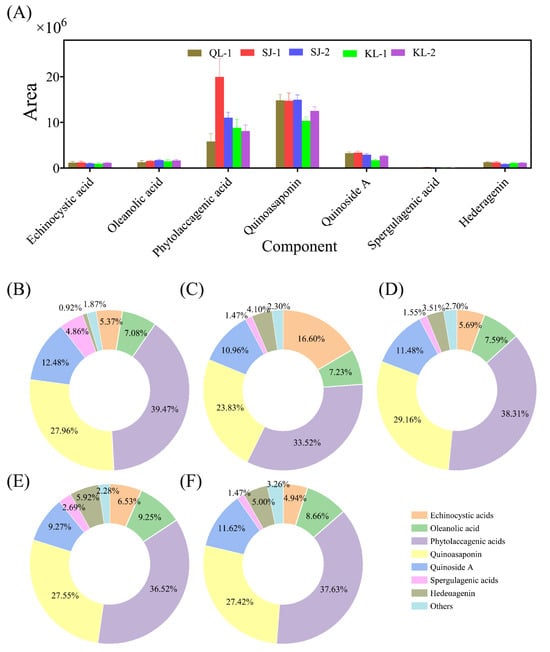
Figure 5.
The area of the main saponins in different cultivars of quinoa (A). Relative monomer content of quinoa saponins of different cultivars: QL-1 (B), SJ-1 (C), SJ-2 (D), KL-1 (E) and KL-2 (F).
2.3.4. Nucleosides
A total of 19 different nucleoside monomers were detected in quinoa seeds using a non-targeted metabolomics approach. The areas of saponins with high levels are shown in Figure 6A. The nucleoside composition of SJ-1 is the most special, which had a significantly higher levels of guanosine and hypoxanthine but lower levels of cytosine and thymine. The relative contents of the nucleoside monomers of all cultivars are shown in Figure 6B–F. The monomer types detected with a higher nucleoside content were similar in different cultivars of quinoa.
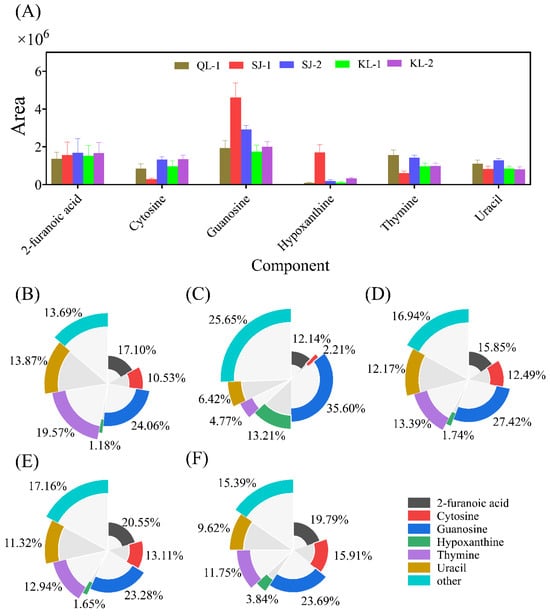
Figure 6.
The area of main nucleosides in different cultivars of quinoa (A). Relative monomer content of quinoa nucleosides of different cultivars: QL-1 (B), SJ-1 (C), SJ-2 (D), KL-1 (E) and KL-2 (F).
2.4. Target Verification of Major Antioxidants and Analysis of Antioxidant Capacity
2.4.1. Total Phenolic Content
SJ-1 had the lowest content of free phenolics and there were no significant differences among the other four cultivars (Figure 7A). However, QL-1 and SJ-2 had the lowest contents of bound phenolics (Figure 7B). The trend of the total phenolic contents in the five quinoa cultivars was similar to that of the free phenolics (Figure 7C).
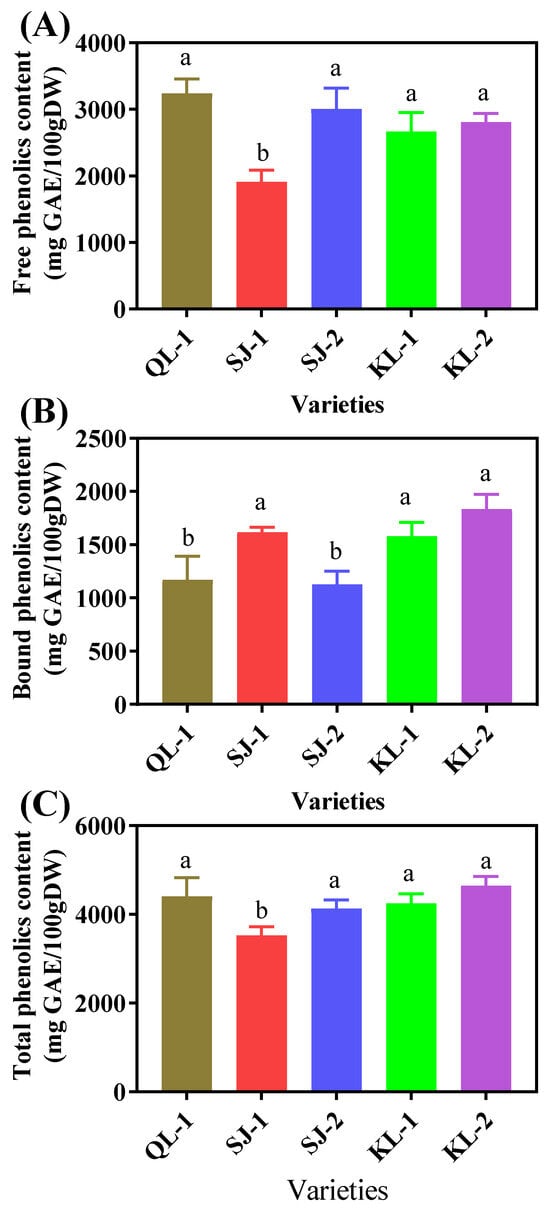
Figure 7.
Free phenolic (A), bound phenolic (B) and total phenolic (C) content of different cultivars of quinoa. Bars with different letters indicate significant differences at p < 0.05 for each index.
2.4.2. Quantification of Phenolic Compounds
Nine kinds of phenolic acids were detected in quinoa, namely gallic acid, protocatechuic acid, p-hydroxybenzoic acid, vanillic acid, caffeic acid, syringic acid, p-coumaric acid, ferulic acid and sinapinic acid. Ferulic acid was detected at high levels in the bound state rather than in the free state. Caffeic acid was detected at high levels in the free state rather than in the bound state. The rest of the phenolic acids were at comparable levels in the bound and free states.
2.4.3. Antioxidant Capacity
The 1,1-Diphenyl-2-picrylhydrazyl free radical (DPPH) and 2,2′-Azinobis-(3-ethylbenzthiazoline-6-sulphonate (ABTS) radical-scavenging capacity reflects the antioxidant capacity of different cultivars of quinoa (Figure 8). SJ-2 and SJ-1 showed the highest and lowest DPPH radical-scavenging values among the five cultivars in the free and total phenolics, respectively. However, QL-1 had the lowest DPPH radical-scavenging value of bound phenolics. No significant difference in ABTS radical scavenging was detected among cultivars, no matter whether in free, bound or total phenolics (p < 0.05).
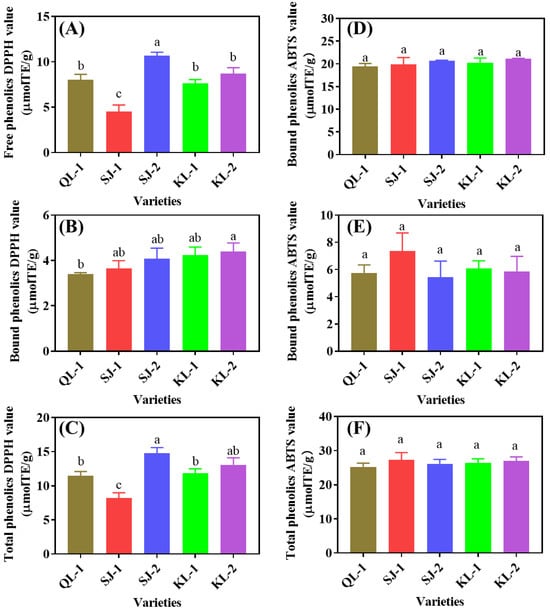
Figure 8.
DPPH (A–C) and ABTS (D–F) radical scavenging of phenolic substances in different cultivars of quinoa. Bars with different letters indicate significant differences, at p < 0.05 for each index.
3. Discussion
Quinoa, recommended by the United Nations as a highly nutritious food for humans, is renowned for its health benefits and excellent nutritional profile [17]. Although quinoa is a native Andean plant, it has spread to other continents. However, the composition of its nutrients, especially the profile of small metabolites in various cultivation areas, remains to be thoroughly investigated. In the present research, metabolites in five cultivars of quinoa cultivated in Qinghai Province, China, were determined by a UHPLC-Q-Orbitrap MS/MS-based untargeted metabolomics approach. A distinct variety in metabolites has been observed among five quinoa cultivars through analysis (Figure S1) and the main factors contributing to these differences, as determined by PCA analysis, were nucleosides, amino acids/peptides, saponins, and phenolic acids.
Amino acids are the basic building blocks of proteins and play an important role in human health [18]. The nutritional value of protein depends on the composition of amino acids. Generally speaking, quinoa has a well-balanced amino acid profile when compared with other plant seeds, such as beans and wheat, which were found to be limited by methionine and lysine, respectively [2,19]. Glutathione is a tripeptide composed of glutamic acid, cysteine, and glycine, which plays an important role in the non-enzymatic antioxidant defense system of plants [20]. The contents of glutathione were found to be the highest in amino acids/peptides and the oxidized type content is higher than that of reduced prototypes (Figure 3). The reason for the high glutathione content in quinoa may be due to the fact that quinoa contains more cysteine (about 5.5 mg/g protein) than plant-based proteins. Therefore, the consumption of quinoa-based foods can have a high nutritional value for children’s growth and development [21].
It is reported that polyphenols and saponins are the most important antioxidants in quinoa seeds [22,23]. The phenolics in quinoa seeds may be present in free form in vacuoles or in bound form on cell wall structures [24]. It has been found that there were significant differences in the content of bound phenolics among different quinoa cultivars, while their content of free phenolics showed relatively small differences [25,26]. At the same time, some studies have reported that bound phenolics were more responsible for the ability of scavenging DPPH and ABTS free radicals than free phenolics [27]. However, in this study, there was no general regularity between the contents of the bound phenolics and free phenolics in different cultivars, and the antioxidant properties of the phenolics depended on the free phenolics. Caffeic acid, syringic acid and ferulic acid were the main phenolic acids in quinoa (Table 1). Flavonoids are a class of antioxidant substances that account for a large proportion of phenolic substances [25], and had a high level in quinoa (Figure 2). Isorhamnetin is reported to be a flavonoid widely found in fruits such as ginkgo and sea buckthorn [28], which has multiple pharmacological activities, such as anti-inflammatory, antioxidant, and antitumor ones [29,30]. However, this study showed that quinoa also contains high level of isorhamnetin (Figure 4). Quercetin classes (Isoquercitin and quercetin) were also found to be the main substance of flavonoids in quinoa and their presence can increase the physiological activity of quinoa seeds [31]. Pasko et al. [32] analyzed the effects of the dietary addition of quinoa seeds on plasma and oxidative stress, and found that quinoa can improve antioxidant capacity by decreasing malondialdehyde in plasma and increasing the activity of antioxidant enzymes, which is consistent with our findings, proving that quinoa is a natural source of antioxidants.

Table 1.
The content of individual phenolic acids in different cultivars of quinoa.
Saponins are made up of steroids (or triterpenoids) and individual or multiple sugar chains. Saponins are often considered as anti-nutritional factors due to their effect on the digestibility and flavor profile of plant grains. However, saponins have been proved to have positive effects on the human body, such as antifungal, antioxidant and antiviral ones [33]. Stuardo and San [34] reported that the content of saponins in quinoa is between 0.1–5%, which is higher than that in beans and cereals. Phytolaccagenic acids had the highest levels among saponin monomers in the present research, which is consistent with the study of Lim et al. [22]. Lim et al. also reported that not only quinoa seeds, but also the roots and leaves of quinoa contain saponins, which are also potentially excellent raw materials for the development of functional substances [22]. Madl et al. [35] isolated 19 kinds of known saponins and 68 kinds of novel saponin compounds from the crude extract of triterpene saponins from quinoa seeds. The saponin compounds identified in this study were consistent with this.
Nucleosides are important metabolites in plants, which are not only important synthetic precursors of nucleotides, but also play an important role in plant growth as signaling molecules [36,37]. Although the composition of each nucleoside monomer was similar among different cultivars, the content varied, with the most significant differences were observed in the SJ-1 cultivars (Figure 6). Guanosine was the most abundant nucleoside compound in quinoa in this study. It has been reported that different types of guanosine play a key role in the metabolic pathways of different substances in the grain [38]. For example, cyclic guanosine monophosphate (cGMP) induces chalcone synthase (CHS) expression in photosignal transduction to indirectly participate in the synthesis of flavonoids [39]. Different kinds of small-molecule metabolites in plant grains are interconnected and play important nutritional roles for humans.
4. Materials and Methods
4.1. Raw Materials
Five cultivars of quinoa (Qingli-1, QL-1; Sanjiang-1, SJ-1; Sanjiang-2, SJ-2; Keli-1, KL-1 and Keli-2, KL-2) used in this study were harvested in Qinghai province in 2021 and provided by Qinghai Academy of Agricultural and Forestry Sciences. The dried seeds were stored at −20 °C before use.
4.2. Chemicals and Reagents
LC–MS-grade methanol (MeOH), acetonitrile (ACN), and methyl tert-butyl ether (MTBE) were purchased from VWR International (Zaventem, Belgium). Ammonium formate (99%) was obtained from Sigma-Aldrich (St. Louis, MO, USA). Ultrafree®-MC centrifugal filter devices (0.22 μm) were obtained from Millipore (Bredford, MA, USA). DPPH and ABTS were purchased from Yuanye Bio-Technology Co., Ltd. (Shanghai, China). Other chemicals and reagents were of analytical grade.
4.3. Metabolomic Analysis
Metabolomic analysis were determined according to the literature, with slight modifications [40]. The freeze-dried quinoa sample was ground into powder and sieved through an 80-micron-mesh sieve (mesh size: 180 µm). Twenty milligrams of powder was mixed with 200 μL methanol by shaking for 10 min and centrifuged (15,000× g) at 4 °C for 10 min. The supernatant was filtered through a syringe filter (0.22 μm, organic phase) and we waited for analysis with a UPLC-ZenoTOF-MS/MS system. To prepare the QC sample, 20 μL of all sample extracts were mixed by vortex and the QC sample was injected once every five samples to detect instrument drift.
Liquid chromatography was performed by an ExionLC AD ultra-performance liquid chromatography (UPLC, AB Sciex Analytical Instrument Trading Co., Ltd., Shanghai, China) system. The analytical column was a Waters ACQUITY UPLC HSS T3 (1002.1 mm, 1.8 μm; Waters, Zellik, Belgium), with a flow rate set to 0.4 mL/min and an injection volume of 3 μL. Mobile phase A and B were 0.05% formic acid and acetonitrile, respectively. The column and sample temperature were maintained at 40 °C. A gradient elution program was started with 1% B, and from 1 to 24 min, it linearly increased to 30% B. From 24 to 37 min, it increased to 95% B and was maintained for 3 min, and it decreased to 1% at 44 min.
The UPLC system was coupled to a ZenoTOF7600 mass spectrometer equipped with an electrospray ionization (ESI) source (AB Sciex, Shanghai, China). The ESI source conditions were set as follows: spray voltage (5.5 kV), curtain gas (N2, 99.999%, 35 psi, Domnik Hunter), temperature (550 °C), ion source gas1 (nebulizer gas, 55 psi), and ion source gas 2 (turbo gas, 55 psi). Data were collected in both positive and negative ionization modes over a mass range between 60 and 1200 m/z. The MS/MS experiments were performed using a collision energy of 35 eV in negative mode. The mass range was set between 40 and 1200 m/z for the fragmentation products.
The acquisition of the raw data was performed using Analyst TF (version 1.7.1, AB Sciex, Framingham, MA, USA) qualitative analysis software. The data processing was performed in the online tool Metaboanalyst 5.0 (https://www.metaboanalyst.ca/; accessed on 12 June 2023), with processes including peak picking, quality assurance, normalization (by median), log transformation (base 10), and auto scaling (mean-centered and divided by the standard deviation of each variable). The molecular weights of the metabolites were confirmed, matched, and annotated by databases (Metlin, MassBank and KNApSAcK databases) to achieve accurate metabolite characterization.
4.4. Determination of Total Phenolic Content
4.4.1. Extraction
The extraction and the determination of the total phenolic content in quinoa was conducted according to a method in the literature [41], with slight modifications. Briefly, 1 g quinoa powder was mixed with 20 mL of 80% methanol and extracted in the darkness at 25 °C with shaking (200 rpm) for 1 h. Then, mixtures were centrifuged (10,000× g, 15 min) and the supernatants from three cycles of centrifugations were evaporated to dry at 40 °C. The dried samples were re-dissolved by 50% methanol and stored at −20 °C before analysis as a free phenolic extract (FPS).
The residues after extraction of the free phenolic were mixed with 20 mL of 2 mol/L NaOH to reach a pH between 1.5 and 2.0. After being oscillated at 25 °C in the absence of light for 4 h, the mixture was mixed with 25 mL of ethyl acetate for 15 min and centrifuged (10,000× g, 15 min) to collect the ethyl acetate layer. Ethyl acetate layers from 3 cycles of centrifugation were combined and dried in a rotary evaporator at 40 °C. The residue was re-dissolved into 10 mL of 50% methanol as a bound phenolic solution (BPS) and stored at −20 °C before analysis.
4.4.2. Determination of Contents of Total Phenolic and Phenolic Acids
The content of the total phenolics was determined by Folin’s phenol method, according to our previous study [42]. Galic acid was used as a standard and the absorbance at 765 nm was measured with a 50% methanol solution used as the blank control. The total phenolic content was presented in mg GAE/100 g DW.
The quantification of phenolic acids was conducted using high-performance liquid chromatography (HPLC, Agilent Technologies Co., Ltd., Santa Clara, CA, USA) as described by the literature [43], with slight modification. FPS and BPS were filtered through a 0.45 μm membrane filter for the Agilent 1200 HPLC system with a reversed phase column (Shimadzu C18 110A, Kyoto, Japan, 4.6 mm × 150 mm, 5 μm particle size) and a C18 cartridge. The column temperature was maintained at 35 °C. Mobile phase A and B were water and methanol; both contained 0.1% acetic acid, respectively. A 75 min gradient was programmed as follows: 0–11 min, 9–14% B; 11–14 min, 14–15% B; 14–17 min, 15% B; 17–24 min, 15–16.5% B; 24–28 min, 16.5–19% B; 28–30 min, 19–25% B; 30–36 min, 25–26% B; 36–38 min, 26–28% B; 38–41 min, 28–35% B; 41–46 min, 35–40% B; 46–48 min, 40–48% B; 48–53 min, 48–53% B; 53–65 min, 53–70% B; 65–66 min, 70–9% B; 66–75 min, 9% B. The injection volume was 20 μL and the flow rate was 0.9 mL/min. The detector was VWD and the measurement wavelength was 280 nm.
4.5. Determination of ABTS and DPPH Radical-Scavenging Activities
The ABTS and DPPH radical-scavenging activities of different cultivars of quinoa were measured as described in the literature [43]. The ABTS radical cation (ABTS+) was created by reacting a 7.0 mM stock solution of ABTS (20 mL) with 13.2 mg potassium persulphate, and the mixture was stirred in the dark at room temperature (25 °C) for 16 h. The ABTS+ solution was diluted with PBS buffer (pH 7.4) with an absorbance of 0.7 ± 0.1 at 734 nm. The absorbance was measured at 734 nm after mixing a certain amount of diluted FPS and BPS with ABTS working solution. The DPPH working solution (0.05 mM) was prepared. FPS and BPS were diluted and mixed with DPPH working solution for 30 min. A UV–visible spectrophotometer was used to measure the absorbance of the mixture at 517 nm. Trolox was used as the standard. The results were expressed as micromoles of Trolox equivalents per gram of dry sample (μ molTE/DW).
4.6. Statistical Analysis
All measurements were taken at least three times. Metabolomic data analysis, i.e., PCA/PLS-DA, was carried out using the online tool Metaboanalyst 5.0, according to the provided protocols in the website (https://www.metaboanalyst.ca/; accessed on 12 June 2023). The data were presented as means ± SD from at least three replicates. GraphPad Prism 7 was used for data elaboration, and one-way ANOVA as well as Duncan’s test were used for statistical analysis. Statistical significance was established at p < 0.05.
5. Conclusions
In the present study, a total of 248 metabolites from five cultivars of quinoa were identified and compared. Significant variations in the profiles of phenolics, amino acids, saponins and nucleosides among the different quinoa cultivars were observed. SJ-1 exhibited a unique metabolite profile among the five cultivars due to its composition of amino acids/peptides and nucleosides. In addition, the antioxidant capacities of the quinoas was found to be closely related to their free phenolic acid contents. These findings will provide useful information for developing functional foods with quinoa and explore the potential of this crop.
Supplementary Materials
The following supporting information can be downloaded at: https://www.mdpi.com/article/10.3390/plants13020240/s1.
Author Contributions
S.W.: data curation, writing—original draft, and software; G.L.: investigation, formal analysis data curation, software, and methodology; C.X.: data curation. Y.Z., R.Y. and J.W.: methodology; J.X.: methodology and writing—review and editing; K.T.: conceptualization, supervision, investigation, funding acquisition, and writing—review and editing. All authors have read and agreed to the published version of the manuscript.
Funding
The authors would like to thank the funding supports from Jiangsu Agriculture Science and Technology (Grant No. CX(22)2013), National Special Project for Agro-product Safety Risk Evaluation of China (GJFP20220105, GJFP20220102), and a project funded by the Priority Academic Program Development of Jiangsu Higher Education Institutions (PAPD).
Data Availability Statement
Data are contained within the article.
Acknowledgments
The authors are very grateful to Xiaofeng Sun from Qinghai Academy of Agriculture and Forestry Sciences for providing the quinoa seeds used in this study! The authors also would like to thank Xi Chen from Department of Application Support Center, SCIEX Analvtical instrument Trading Co. (Shanghai, China), for providing apparatus and valuable technical assistance.
Conflicts of Interest
The authors declare no conflicts of interest.
References
- Sridhar, K.; Bouhallab, S.; Croguennec, T.; Renard, D.; Lechevalier, V. Recent trends in design of healthier plant-based alternatives: Nutritional profile, gastrointestinal digestion, and consumer perception. Crit. Rev. Food Sci. Nutr. 2022, 63, 2081666. [Google Scholar] [CrossRef]
- Liu, S.; Wang, W.; Lu, H.; Shu, Q.; Zhang, Y.; Chen, Q. New perspectives on physiological, biochemical and bioactive components during germination of edible seeds: A review. Trends Food Sci. Technol. 2022, 123, 187–197. [Google Scholar] [CrossRef]
- Ceylan, R.; Zengin, G.; Mahomoodally, M.F.; Sinan, K.I.; Ak, G.; Jugreet, S.; Cakir, O.; Ouelbani, R.; Paksoy, M.Y.; Yilmaz, M.A. Enzyme inhibition and antioxidant functionality of eleven Inula species based on chemical components and chemometric insights. Biochem. Syst. Ecol. 2021, 95, 104225. [Google Scholar] [CrossRef]
- Yilmaz, M.A.; Ertas, A.; Yener, I.; Akdeniz, M.; Cakir, O.; Altun, M.; Demirtas, I.; Boga, M.; Temel, H. A comprehensive LC-MS/MS method validation for the quantitative investigation of 37 fingerprint phytochemicals in Achillea species: A detailed examination of A. coarctata and A. monocephala. J. Pharm. Biomed. Anal. 2018, 154, 413–424. [Google Scholar] [CrossRef] [PubMed]
- Ren, G.; Teng, C.; Fan, X.; Guo, S.; Zhao, G.; Zhang, L.; Liang, Z.; Qin, P. Nutrient composition, functional activity and industrial applications of quinoa (Chenopodium quinoa Willd.). Food Chem. 2023, 410, 135290. [Google Scholar] [CrossRef]
- Zhang, Y.; Ma, Z.; Cao, H.; Huang, K.; Guan, X. Effect of germinating quinoa flour on wheat noodle quality and changes in blood glucose. Food Biosci. 2022, 48, 10809. [Google Scholar] [CrossRef]
- Li, G.; Zhu, F. Quinoa starch: Structure, properties, and applications. Carbohydr. Polym. 2018, 181, 851–861. [Google Scholar] [CrossRef] [PubMed]
- Mufari, J.R.; Miranda-Villa, P.P.; Calandri, E.L. Quinoa germ and starch separation by wet milling, performance and characterization of the fractions. LWT-Food Sci. Technol. 2018, 96, 527–534. [Google Scholar] [CrossRef]
- Cao, H.; Huang, Q.; Shi, J.; Guan, X.; Song, H.; Zhang, Y.; Xie, J.; Fang, Y. Effect of conventional and microwave heating treatment on antioxidant activity of quinoa protein after simulated gastrointestinal digestion. Food Chem. 2023, 415, 135763. [Google Scholar] [CrossRef]
- Lingiardi, N.; Galante, M.; de Sanctis, M.; Spelzini, D. Are quinoa proteins a promising alternative to be applied in plant-based emulsion gel formulation? Food Chem. 2022, 394, 133485. [Google Scholar] [CrossRef]
- Gullon, B.; Gullon, P.; Tavaria, F.K.; Yanez, R. Assessment of the prebiotic effect of quinoa and amaranth in the human intestinal ecosystem. Food Funct. 2016, 7, 3782–3788. [Google Scholar] [CrossRef] [PubMed]
- Lamothe, L.M.; Srichuwong, S.; Reuhs, B.L.; Hamaker, B.R. Quinoa (Chenopodium quinoa W.) and amaranth (Amaranthus caudatus L.) provide dietary fibres high in pectic substances and xyloglucans. Food Chem. 2015, 167, 490–496. [Google Scholar] [CrossRef] [PubMed]
- Angeli, V.; Silva, P.; Massuela, D.; Khan, M.W.; Hamar, A.; Khajehei, F.; Graeff-Hoenninger, S.; Piatti, C. Quinoa (Chenopodium quinoa Willd.): An overview of the potentials of the “Golden Grain” and socio-economic and environmental aspects of its cultivation and marketization. Foods 2020, 9, 216. [Google Scholar] [CrossRef] [PubMed]
- Rocchetti, G.; Chiodelli, G.; Giuberti, G.; Masoero, F.; Trevisan, M.; Lucini, L. Evaluation of phenolic profile and antioxidant capacity in gluten-free flours. Food Chem. 2017, 228, 367–373. [Google Scholar] [CrossRef]
- Zhang, H.; Tsao, R. Dietary polyphenols, oxidative stress and antioxidant and anti-inflammatory effects. Curr. Opin. Food Sci. 2016, 8, 33–42. [Google Scholar] [CrossRef]
- He, Y.; Song, S.; Li, C.; Zhang, X.; Liu, H. Effect of germination on the main chemical compounds and 5-methyltetrahydrofolate metabolism of different quinoa varieties. Food Res. Int. 2022, 159, 111601. [Google Scholar] [CrossRef]
- Craine, E.B.; Murphy, K.M. Seed composition and amino acid profiles for quinoa grown in washington state. Front. Nutr. 2020, 7, 126. [Google Scholar] [CrossRef]
- Hoffer, L.J. Human Protein and Amino Acid Requirements. J. Parenter. Enter. Nutr. 2016, 40, 460–474. [Google Scholar] [CrossRef]
- Zhao, J.; Li, Z.; Khan, M.U.; Gao, X.; Yu, M.; Gao, H.; Li, Y.; Zhang, H.; Dasanayaka, B.P.; Lin, H. Extraction of total wheat (Triticum aestivum) protein fractions and cross-reactivity of wheat allergens with other cereals. Food Chem. 2021, 347, 129064. [Google Scholar] [CrossRef]
- Jez, J.M. Structural biology of plant sulfur metabolism: From sulfate to glutathione. J. Exp. Bot. 2019, 70, 4089–4103. [Google Scholar] [CrossRef]
- Nowak, V.; Du, J.; Charrondiere, U.R. Assessment of the nutritional composition of quinoa (Chenopodium quinoa Willd.). Food Chem. 2016, 193, 47–54. [Google Scholar] [CrossRef]
- Lim, J.G.; Park, H.-M.; Yoon, K.S. Analysis of saponin composition and comparison of the antioxidant activity of various parts of the quinoa plant (Chenopodium quinoa Willd.). Food Sci. Nutr. 2020, 8, 694–702. [Google Scholar] [CrossRef] [PubMed]
- Liu, M.; Zhu, K.; Yao, Y.; Chen, Y.; Guo, H.; Ren, G.; Yang, X.; Li, J. Antioxidant, anti-inflammatory, and antitumor activities of phenolic compounds from white, red, and black Chenopodium quinoa seed. Cereal Chem. 2020, 97, 703–713. [Google Scholar] [CrossRef]
- Acosta-Estrada, B.A.; Gutierrez-Uribe, J.A.; Serna-Saldivar, S.O. Bound phenolics in foods, a review. Food Chem. 2014, 152, 46–55. [Google Scholar] [CrossRef] [PubMed]
- Abderrahim, F.; Huanatico, E.; Segura, R.; Arribas, S.; Carmen Gonzalez, M.; Condezo-Hoyos, L. Physical features, phenolic compounds, betalains and total antioxidant capacity of coloured quinoa seeds (Chenopodium quinoa Willd.) from Peruvian Altiplano. Food Chem. 2015, 183, 83–90. [Google Scholar] [CrossRef] [PubMed]
- Nsimba, R.Y.; Kikuzaki, H.; Konishi, Y. Antioxidant activity of various extracts and fractions of Chenopodium quinoa and Amaranthus spp. seeds. Food Chem. 2008, 106, 760–766. [Google Scholar] [CrossRef]
- Han, Y.; Chi, J.; Zhang, M.; Zhang, R.; Fan, S.; Huang, F.; Xue, K.; Liu, L. Characterization of saponins and phenolic compounds: Antioxidant activity and inhibitory effects on alpha-glucosidase in different varieties of colored quinoa (Chenopodium quinoa Willd). Biosci. Biotechnol. Biochem. 2019, 83, 2128–2139. [Google Scholar] [CrossRef] [PubMed]
- Wang, J.; Zhang, W.; Zhu, D.; Zhu, X.; Pang, X.; Qu, W. Hypolipidaemic and hypoglycaemic effects of total flavonoids from seed residues of Hippophae rhamnoides L. in mice fed a high-fat diet. J. Sci. Food Agric. 2011, 91, 1446–1451. [Google Scholar] [CrossRef]
- Chi, G.; Zhong, W.; Liu, Y.; Lu, G.; Lu, H.; Wang, D.; Sun, F. Isorhamnetin protects mice from lipopolysaccharide-induced acute lung injury via the inhibition of inflammatory responses. Inflamm. Res. 2016, 65, 33–41. [Google Scholar] [CrossRef]
- Kim, S.Y.; Jin, C.-Y.; Kim, C.H.; Yoo, Y.H.; Choi, S.H.; Kim, G.-Y.; Yoon, H.M.; Park, H.T.; Choi, Y.H. Isorhamnetin alleviates lipopolysaccharide-induced inflammatory responses in BV2 microglia by inactivating NF-B, blocking the TLR4 pathway and reducing ROS generation. Int. J. Mol. Med. 2019, 43, 682–692. [Google Scholar] [CrossRef]
- Hirose, Y.; Fujita, T.; Ishii, T.; Ueno, N. Antioxidative properties and flavonoid composition of Chenopodium quinoa seeds cultivated in Japan. Food Chem. 2010, 119, 1300–1306. [Google Scholar] [CrossRef]
- Pasko, P.; Barton, H.; Zagrodzki, P.; Izewska, A.; Krosniak, M.; Gawlik, M.; Gawlik, M.; Gorinstein, S. Effect of Diet Supplemented with Quinoa Seeds on Oxidative Status in Plasma and Selected Tissues of High Fructose-Fed Rats. Plant Foods Hum. Nutr. 2010, 65, 146–151. [Google Scholar] [CrossRef] [PubMed]
- Gitanjali, J.; Ram, D.S.D.; Kavitha, R.; Amalan, V.; Alahmadi, T.A.; Alharbi, S.A.; Kandasamy, S.; Shanmuganthan, R.; Vijayakumar, N. Antimicrobial, antioxidant, anticancer, and antithrombotic, competency of saponins from the root of Decalepis hamiltonii. Environ. Res. 2023, 231, 116096. [Google Scholar] [CrossRef]
- Stuardo, M.; Martin, R.S. Antifungal properties of quinoa (Chenopodium quinoa Willd) alkali treated saponnins against Botrytis cinerea. Ind. Crops Prod. 2008, 27, 296–302. [Google Scholar] [CrossRef]
- Madl, T.; Sterk, H.; Mittelbach, M. Tandem mass spectrometric analysis of a complex triterpene saponin mixture of Chenopodium quinoa. J. Am. Soc. Mass Spectrom. 2006, 17, 795–806. [Google Scholar] [CrossRef] [PubMed]
- Cornelius, S.; Traub, M.; Bernard, C.; Salzig, C.; Lang, P.; Moehlmann, T. Nucleoside transport across the plasma membrane mediated by equilibrative nucleoside transporter 3 influences metabolism of Arabidopsis seedlings. Plant Biol. 2012, 14, 696–705. [Google Scholar] [CrossRef] [PubMed]
- Jiao, C.; Yang, R.; Gu, Z. Cyclic ADP-ribose mediates nitric oxide-guanosine 3′,5′-cyclic monophosphate-induced isoflavone accumulation in soybean sprouts under UVB radiation. Can. J. Plant Sci. 2018, 98, 47–53. [Google Scholar] [CrossRef]
- Wu, Y.; Hiratsuka, K.; Neuhaus, G.; Chua, N.H. Calcium and cGMP target distinct phytochrome-responsive elements. Plant J. 1996, 10, 1149–1154. [Google Scholar] [CrossRef]
- Suita, K.; Kiryu, T.; Sawada, M.; Mitsui, M.; Nakagawa, M.; Kanamaru, K.; Yamagata, H. Cyclic GMP acts as a common regulator for the transcriptional activation of the flavonoid biosynthetic pathway in soybean. Planta 2009, 229, 403–413. [Google Scholar] [CrossRef][Green Version]
- Zhu, A.; Zhou, Q.; Hu, S.; Wang, F.; Tian, Z.; Hu, X.; Liu, H.; Jiang, D.; Chen, W. Metabolomic analysis of the grain pearling fractions of six bread wheat varieties. Food Chem. 2022, 369, 130881. [Google Scholar] [CrossRef]
- Wang, M.; Ding, Y.; Wang, Q.; Wang, P.; Han, Y.; Gu, Z.; Yang, R. NaCl treatment on physio-biochemical metabolism and phenolics accumulation in barley seedlings. Food Chem. 2020, 331, 127282. [Google Scholar] [CrossRef] [PubMed]
- Xie, C.; Wang, P.; Sun, M.; Gu, Z.; Yang, R. Nitric oxide mediates gamma-aminobutyric acid signaling to regulate phenolic compounds biosynthesis in soybean sprouts under NaCl stress. Food Biosci. 2021, 44, 101356. [Google Scholar] [CrossRef]
- Chen, Z.; Yu, L.; Wang, X.; Gu, Z.; Beta, T. Changes of phenolic profiles and antioxidant activity in canaryseed (Phalaris canariensis L.) during germination. Food Chem. 2016, 194, 608–618. [Google Scholar] [CrossRef] [PubMed]


Disclaimer/Publisher’s Note: The statements, opinions and data contained in all publications are solely those of the individual author(s) and contributor(s) and not of MDPI and/or the editor(s). MDPI and/or the editor(s) disclaim responsibility for any injury to people or property resulting from any ideas, methods, instructions or products referred to in the content. |
© 2024 by the authors. Licensee MDPI, Basel, Switzerland. This article is an open access article distributed under the terms and conditions of the Creative Commons Attribution (CC BY) license (https://creativecommons.org/licenses/by/4.0/).