
Developing the Additive Systems of Stand Basal Area Model for Broad-Leaved Mixed Forests


Abstract
1. Introduction
2. Results
2.1. Basic Model for Predicting the SBA of Populus davidiana × Betula platyphylla Broad-Leaved Mixed Forests
2.2. Nonlinear SBA Models Fitted Using AP
2.3. Nonlinear SBA Models Fitted Using NSUR
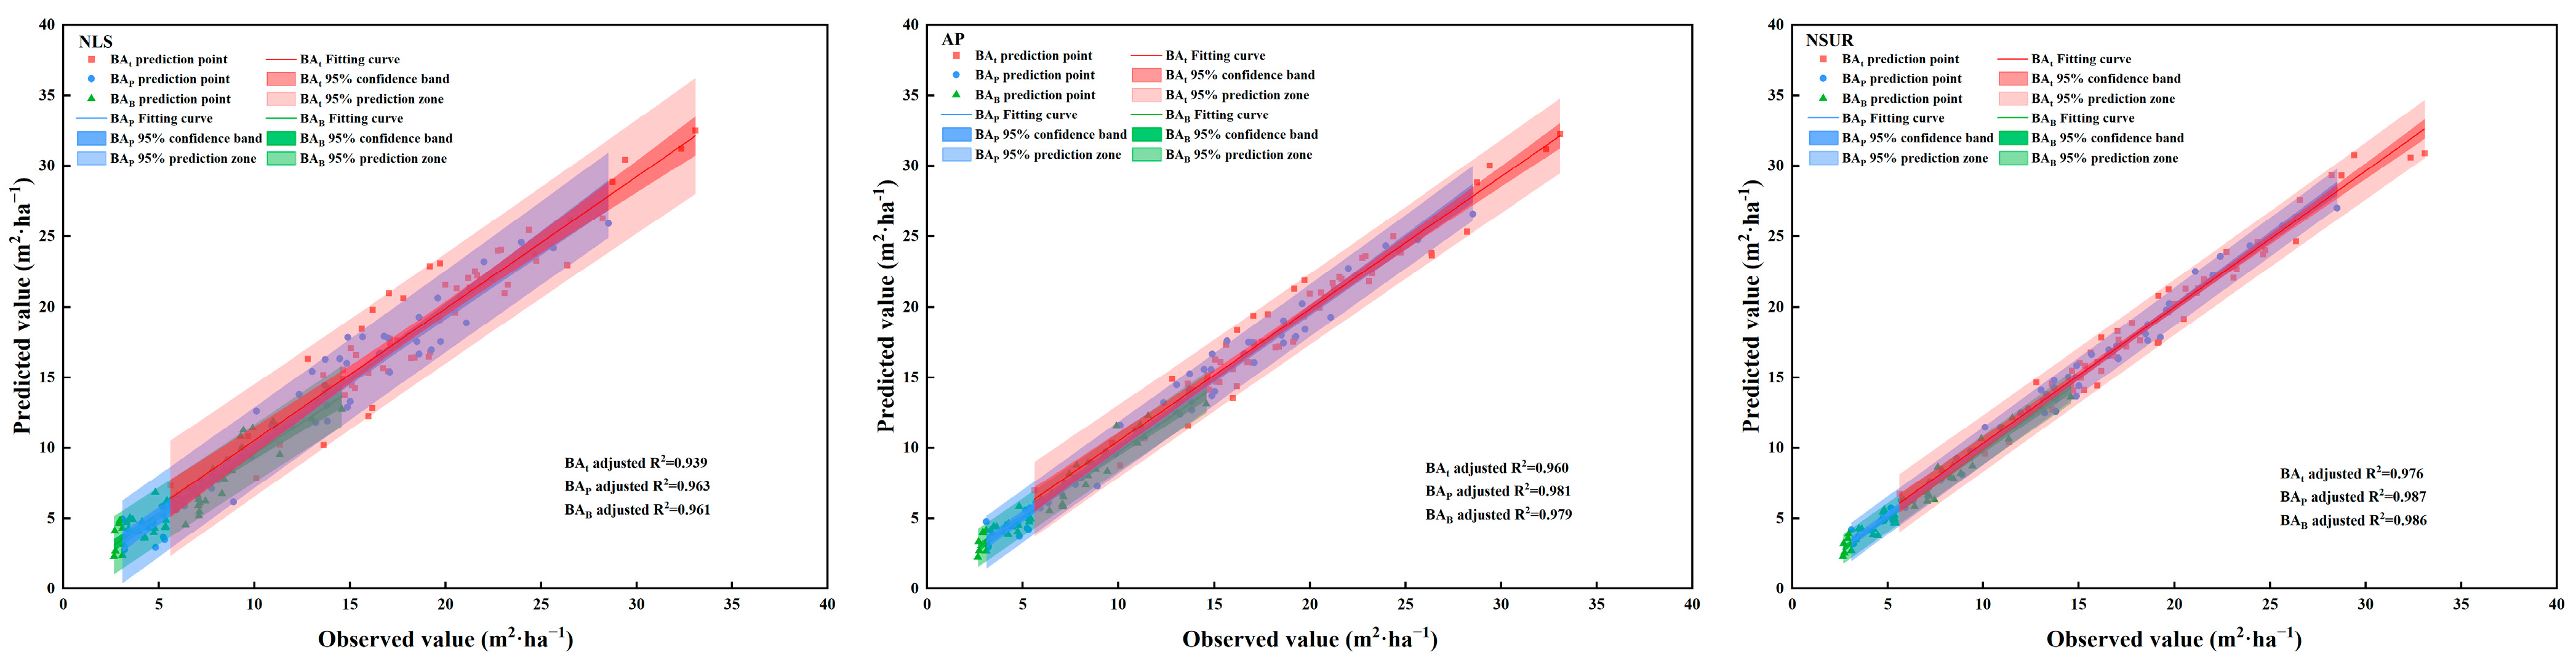
2.4. Model Evaluation and Prediction
3. Discussion
3.1. Selection of an Optimal Model for Predicting SBA
3.2. Factors Affecting the SBA Model
3.3. Parameter Estimation Methods Affect the Accuracy of SBA
4. Materials and Methods
4.1. Study Area
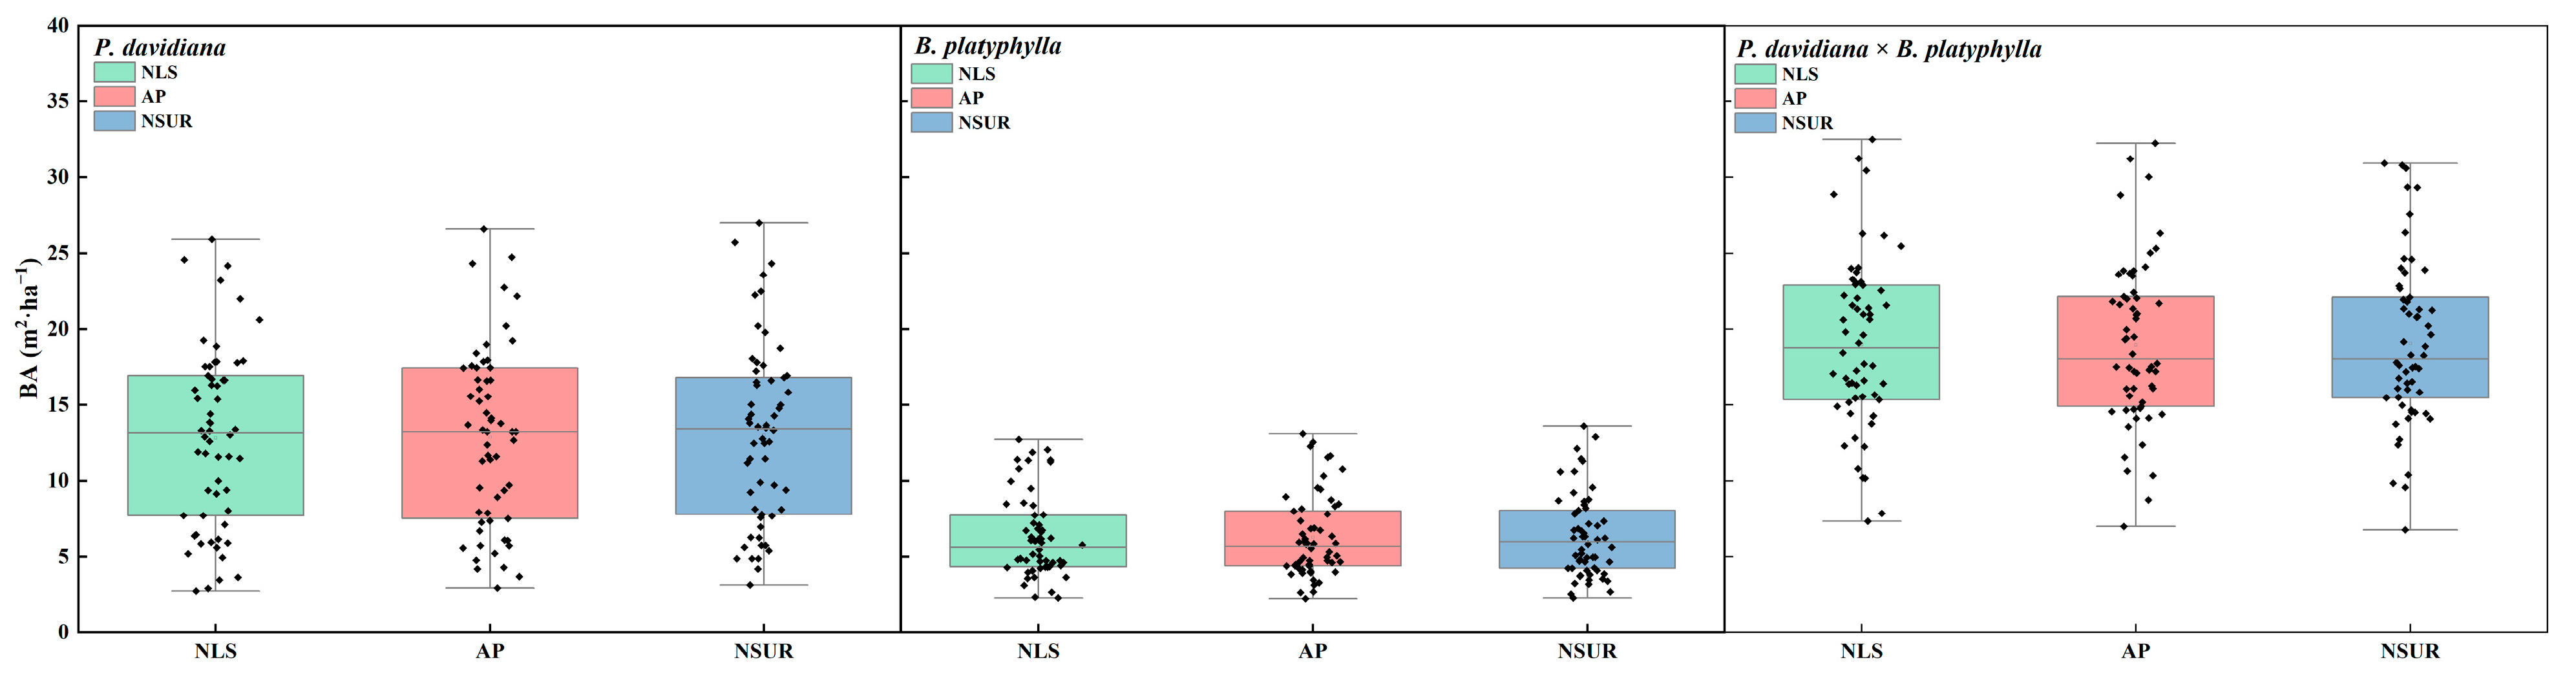
4.2. Data Description
4.3. Methods
4.3.1. Basic Model Selection
4.3.2. Adjustment in Proportion (AP)
4.3.3. Nonlinear Seemingly Unrelated Regression (NSUR)
4.3.4. Model Fitting and Evaluation
5. Conclusions
Author Contributions
Funding
Data Availability Statement
Acknowledgments
Conflicts of Interest
References
- Rodríguez, F.; Pemán, J.; Aunós, Á. A reduced growth model based on stand basal area. A case for hybrid poplar plantations in northeast Spain. For. Ecol. Manag. 2010, 259, 2093–2102. [Google Scholar] [CrossRef]
- Fu, L.; Sharma, R.P.; Zhu, G.; Li, H.; Hong, L.; Guo, H.; Duan, G.; Shen, C.; Lei, Y.; Li, Y. A basal area increment-based approach of site productivity evaluation for multi-aged and mixed forests. Forests 2017, 8, 119. [Google Scholar] [CrossRef]
- Ruiz-Benito, P.; Madrigal-Gonzalez, J.; Ratcliffe, S.; Coomes, D.A.; Kändler, G.; Lehtonen, A.; Wirth, C.; Zavala, M.A. Stand structure and recent climate change constrain stand basal area change in European forests: A comparison across boreal, temperate, and Mediterranean biomes. Ecosystems 2014, 17, 1439–1454. [Google Scholar] [CrossRef]
- Del Río, M.; Sterba, H. Comparing volume growth in pure and mixed stands of Pinus sylvestris and Quercus pyrenaica. Ann. For. Res. 2009, 66, 502. [Google Scholar] [CrossRef]
- Zhou, G.; Meng, S.; Yu, J.; Zhou, H.; Liu, Q. Quantitative relationships between fine roots and stand characteristics. Eur. J. For. Res. 2018, 137, 385–399. [Google Scholar] [CrossRef]
- Cieszewski, C.J.; Zasada, M.; Lowe, R.C.; Liu, S. Estimating Biomass and Carbon Storage by Georgia Forest Types and Species Groups Using the FIA Data Diameters, Basal Areas, Site Indices, and Total Heights. Forests 2021, 12, 141. [Google Scholar] [CrossRef]
- Torres, A.B.; Lovett, J.C. Using basal area to estimate aboveground carbon stocks in forests: La Primavera Biosphere’s Reserve, Mexico. Forestry 2013, 86, 267–281. [Google Scholar] [CrossRef]
- Thom, D.; Keeton, W.S. Stand structure drives disparities in carbon storage in northern hardwood-conifer forests. For. Ecol. Manag. 2019, 442, 10–20. [Google Scholar] [CrossRef]
- Reid, R. Diameter–basal area ratio as a practical stand density measure for pruned plantations. For. Ecol. Manag. 2006, 233, 375–382. [Google Scholar] [CrossRef]
- Che, S.; Tan, X.; Xiang, C.; Sun, J.; Hu, X.; Zhang, X.; Duan, A.; Zhang, J. Stand basal area modelling for Chinese fir plantations using an artificial neural network model. J. For. Res. 2019, 30, 1641–1649. [Google Scholar] [CrossRef]
- Pretzsch, H.; Steckel, M.; Heym, M.; Biber, P.; Ammer, C.; Ehbrecht, M.; Bielak, K.; Bravo, F.; Ordóñez, C.; Collet, C. Stand growth and structure of mixed-species and monospecific stands of Scots pine (Pinus sylvestris L.) and oak (Q. robur L., Quercus petraea (Matt.) Liebl.) analysed along a productivity gradient through Europe. Eur. J. For. Res. 2020, 139, 349–367. [Google Scholar] [CrossRef]
- Ingram, J.C.; Dawson, T.P.; Whittaker, R.J. Mapping tropical forest structure in southeastern Madagascar using remote sensing and artificial neural networks. Remote Sens. Environ. 2005, 94, 491–507. [Google Scholar] [CrossRef]
- Brunner, A.; Forrester, D.I. Tree species mixture effects on stem growth vary with stand density–An analysis based on individual tree responses. For. Ecol. Manag. 2020, 473, 118334. [Google Scholar] [CrossRef]
- Rüger, N.; Condit, R.; Dent, D.H.; DeWalt, S.J.; Hubbell, S.P.; Lichstein, J.W.; Lopez, O.R.; Wirth, C.; Farrior, C.E. Demographic trade-offs predict tropical forest dynamics. Science 2020, 368, 165–168. [Google Scholar] [CrossRef]
- Ruotsalainen, R.; Pukkala, T.; Kangas, A.; Packalen, P. Effects of errors in basal area and mean diameter on the optimality of forest management prescriptions. Ann. For. Res. 2021, 78, 18. [Google Scholar] [CrossRef]
- Forrester, D.I.; Kohnle, U.; Albrecht, A.T.; Bauhus, J. Complementarity in mixed-species stands of Abies alba and Picea abies varies with climate, site quality and stand density. For. Ecol. Manag. 2013, 304, 233–242. [Google Scholar] [CrossRef]
- Wang, W.; Chen, X.; Zeng, W.; Wang, J.; Meng, J. Development of a mixed-effects individual-tree basal area increment model for oaks (Quercus spp.) considering forest structural diversity. Forests 2019, 10, 474. [Google Scholar] [CrossRef]
- Bartelink, H. A growth model for mixed forest stands. For. Ecol. Manag. 2000, 134, 29–43. [Google Scholar] [CrossRef]
- Condés, S.; Pretzsch, H.; del Río, M. Species admixture can increase potential tree growth and reduce competition. For. Ecol. Manag. 2023, 539, 120997. [Google Scholar] [CrossRef]
- Rozendaal, D.M.; Phillips, O.L.; Lewis, S.L.; Affum-Baffoe, K.; Alvarez-Davila, E.; Andrade, A.; Aragão, L.E.; Araujo-Murakami, A.; Baker, T.R.; Bánki, O. Competition influences tree growth, but not mortality, across environmental gradients in Amazonia and tropical Africa. Ecology 2020, 101, e03052. [Google Scholar] [CrossRef] [PubMed]
- Chikumbo, O.; Steward, G.A. A stand basal area model for plantation grown New Zealand kauri. Ecol. Model. 2007, 209, 367–376. [Google Scholar] [CrossRef]
- Chikumbo, O.; Mareels, I.M.; Turner, B.J. Predicting stand basal area in thined stands using a dynamical model. For. Ecol. Manag. 1999, 116, 175–187. [Google Scholar] [CrossRef]
- Russo, D.; Marziliano, P.A.; Macrì, G.; Zimbalatti, G.; Tognetti, R.; Lombardi, F. Tree growth and wood quality in pure vs. mixed-species stands of European beech and Calabrian pine in Mediterranean mountain forests. Forests 2019, 11, 6. [Google Scholar] [CrossRef]
- Janda, P.; Tepley, A.J.; Schurman, J.S.; Brabec, M.; Nagel, T.A.; Bače, R.; Begovič, K.; Chaskovskyy, O.; Čada, V.; Dušátko, M. Drivers of basal area variation across primary late-successional Picea abies forests of the Carpathian Mountains. For. Ecol. Manag. 2019, 435, 196–204. [Google Scholar] [CrossRef]
- Snowdon, P. Modeling Type 1 and Type 2 growth responses in plantations after application of fertilizer or other silvicultural treatments. For. Ecol. Manag. 2002, 163, 229–244. [Google Scholar] [CrossRef]
- Riofrío, J.; del Río, M.; Maguire, D.A.; Bravo, F. Species mixing effects on height–diameter and basal area increment models for scots pine and maritime pine. Forests 2019, 10, 249. [Google Scholar] [CrossRef]
- Andreassen, K.; Tomter, S.M. Basal area growth models for individual trees of Norway spruce, Scots pine, birch and other broadleaves in Norway. For. Ecol. Manag. 2003, 180, 11–24. [Google Scholar] [CrossRef]
- de Prado, D.R.; Riofrío, J.; Aldea, J.; Bravo, F.; de Aza, C.H. Competition and climate influence in the basal area increment models for Mediterranean mixed forests. For. Ecol. Manag. 2022, 506, 119955. [Google Scholar] [CrossRef]
- Wykoff, W.R. A basal area increment model for individual conifers in the northern Rocky Mountains. For. Sci. 1990, 36, 1077–1104. [Google Scholar] [CrossRef]
- Zobel, J.M.; Ek, A.R.; Burk, T.E. Comparison of Forest Inventory and Analysis surveys, basal area models, and fitting methods for the aspen forest type in Minnesota. For. Ecol. Manag. 2011, 262, 188–194. [Google Scholar] [CrossRef]
- Zhao, L.; Li, C. Stand basal area model for Cunninghamia lanceolata (Lamb.) Hook. plantations based on a multilevel nonlinear mixed-effect model across south-eastern China. South For. 2013, 75, 41–50. [Google Scholar] [CrossRef]
- Yan, W.; Duan, G.; Wang, Y.; Sun, Z.; Zhou, T.; Fu, L. Construction of stand basal area and volume growth model for Quercus and Populus in Henan Province of central China. J. Beijing For. Univ. 2019, 41, 55–61. (In Chinese) [Google Scholar] [CrossRef]
- Li, C.; Tang, S. The Basal Area Model of Mixed Stands of Larix olgensis, Abies nephrolepis and Picea jezoensis Based on Nonlinear Mixed Model. Sci. Silv. Sin. 2010, 46, 106–113. (In Chinese) [Google Scholar] [CrossRef]
- Pszwaro, J.L.; D’Amato, A.W.; Burk, T.E.; Russell, M.B.; Palik, B.J.; Strong, T.F. Analysis of stand basal area development of thinned and unthinned Acer rubrum forests in the upper Great Lakes region, USA. Can. J. For. Res. 2016, 46, 645–655. [Google Scholar] [CrossRef]
- Zhao, D.; Bullock, B.P.; Montes, C.R.; Wang, M. Rethinking maximum stand basal area and maximum SDI from the aspect of stand dynamics. For. Ecol. Manag. 2020, 475, 118462. [Google Scholar] [CrossRef]
- Donoso, P.J.; Soto, D.P. Does site quality affect the additive basal area phenomenon? Results from Chilean old-growth temperate rainforests. Can. J. For. Res. 2016, 46, 1330–1336. [Google Scholar] [CrossRef]
- Vospernik, S. Basal area increment models accounting for climate and mixture for Austrian tree species. For. Ecol. Manag. 2021, 480, 118725. [Google Scholar] [CrossRef]
- Zhu, G.; Hu, S.; Fu, L. Basal area growth model for oak natural forest in Hunan Province based on dummy variable. J. Nanjing For. Univ. (Nat. Sci. Ed.) 2018, 61, 155–162. (In Chinese) [Google Scholar] [CrossRef]
- Hein, S.; Dhôte, J.-F. Effect of species composition, stand density and site index on the basal area increment of oak trees (Quercus sp.) in mixed stands with beech (Fagus sylvatica L.) in northern France. Ann. For. Res. 2006, 63, 457–467. [Google Scholar] [CrossRef]
- Liang, J.; Buongiorno, J.; Monserud, R.A.; Kruger, E.L.; Zhou, M. Effects of diversity of tree species and size on forest basal area growth, recruitment, and mortality. For. Ecol. Manag. 2007, 243, 116–127. [Google Scholar] [CrossRef]
- Riofrío, J.; del Río, M.; Pretzsch, H.; Bravo, F. Changes in structural heterogeneity and stand productivity by mixing Scots pine and Maritime pine. For. Ecol. Manag. 2017, 405, 219–228. [Google Scholar] [CrossRef]
- Pretzsch, H.; Schütze, G. Effect of tree species mixing on the size structure, density, and yield of forest stands. Eur. J. For. Res. 2016, 135, 1–22. [Google Scholar] [CrossRef]
- Liu, D.; Zhou, C.; He, X.; Zhang, X.; Feng, L.; Zhang, H. The effect of stand density, biodiversity, and spatial structure on stand basal area increment in natural spruce-fir-broadleaf mixed forests. Forests 2022, 13, 162. [Google Scholar] [CrossRef]
- Taylor, A.R.; Gao, B.; Chen, H.Y. The effect of species diversity on tree growth varies during forest succession in the boreal forest of central Canada. For. Ecol. Manag. 2020, 455, 117641. [Google Scholar] [CrossRef]
- Zhang, G.; Hui, G.; Zhao, Z.; Hu, Y.; Wang, H.; Liu, W.; Zang, R. Composition of basal area in natural forests based on the uniform angle index. Ecol. Inform. 2018, 45, 1–8. [Google Scholar] [CrossRef]
- Samec, P.; Rychtecká, P.; Zeman, M.; Zapletal, M. Environmental Effects among Differently Located and Fertile Sites on Forest Basal-Area Increment in Temperate Zone. Forests 2022, 13, 588. [Google Scholar] [CrossRef]
- Tewari, V. Stand density and basal area prediction of unthinned irrigated plantations of Eucalyptus camaldulensis in the hot desert of India. Bioresour. Technol. 2007, 98, 1106–1114. [Google Scholar] [CrossRef] [PubMed]
- Antón-Fernández, C.; Burkhart, H.E.; Amateis, R.L. Modeling the effects of initial spacing on stand basal area development of loblolly pine. For. Sci. 2012, 58, 95–105. [Google Scholar] [CrossRef]
- Hu, S.; Zhu, G.; Chen, Z.; Lu, K.; Huang, L.; Liu, Z. Basal Area Growth Model for Oaks Natural Secondary Forest in Hunan Province Based on Storey Identification. Sci. Silv. Sin. 2020, 56, 184–192. (In Chinese) [Google Scholar] [CrossRef]
- He, H.; Zhu, G.; Ma, W.; Liu, F.; Zhang, X. Additivity of stand basal area predictions in canopy stratifications for natural oak forests. For. Ecol. Manag. 2021, 492, 119246. [Google Scholar] [CrossRef]
- Demaerschalk, J.P. Integrated systems for the estimation of tree taper and volume. Can. J. For. Res. 1973, 3, 90–94. [Google Scholar] [CrossRef]
- Xu, H.; Sun, Y.; Wang, X.; Fu, Y.; Dong, Y.; Li, Y. Nonlinear mixed-effects (NLME) diameter growth models for individual China-fir (Cunninghamia lanceolata) trees in southeast China. PLoS ONE 2014, 9, e104012. [Google Scholar] [CrossRef]
- Raptis, D.; Kazana, V.; Kazaklis, A.; Stamatiou, C. A crown width-diameter model for natural even-aged black pine forest management. Forests 2018, 9, 610. [Google Scholar] [CrossRef]
- Wu, W.; Wang, D.; Zhang, D. Aridity index and quantile regression influences on the maximum size-density relationship for coniferous and broad-leaved mixed forests. For. Ecol. Manag. 2023, 543, 121148. [Google Scholar] [CrossRef]
- Moisen, G.G.; Freeman, E.A.; Blackard, J.A.; Frescino, T.S.; Zimmermann, N.E.; Edwards Jr, T.C. Predicting tree species presence and basal area in Utah: A comparison of stochastic gradient boosting, generalized additive models, and tree-based methods. Ecol. Model. 2006, 199, 176–187. [Google Scholar] [CrossRef]
- Fu, L.; Lei, Y.; Zeng, W. Comparison of Several Compatible Biomass Models and Estimation Approaches. Sci. Silv. Sin. 2014, 50, 42–54. Available online: http://www.linyekexue.net/EN/10.11707/j.1001-7488.20140606 (accessed on 25 January 2024). (In Chinese).
- Lei, Y.; Fu, L.; Affleck, D.L.; Nelson, A.S.; Shen, C.; Wang, M.; Zheng, J.; Ye, Q.; Yang, G. Additivity of nonlinear tree crown width models: Aggregated and disaggregated model structures using nonlinear simultaneous equations. For. Ecol. Manag. 2018, 427, 372–382. [Google Scholar] [CrossRef]
- Fu, L.; Sharma, R.P.; Wang, G.; Tang, S. Modelling a system of nonlinear additive crown width models applying seemingly unrelated regression for Prince Rupprecht larch in northern China. For. Ecol. Manag. 2017, 386, 71–80. [Google Scholar] [CrossRef]
- Zhou, Z.; Fu, L.; Zhou, C.; Sharma, R.P.; Zhang, H. Simultaneous compatible system of models of height, crown length, and height to crown base for natural secondary forests of Northeast China. Forests 2022, 13, 148. [Google Scholar] [CrossRef]
- Parresol, B.R. Additivity of nonlinear biomass equations. Can. J. For. Res. 2001, 31, 865–878. [Google Scholar] [CrossRef]
- Pretzsch, H.; Schütze, G. Tree species mixing can increase stand productivity, density and growth efficiency and attenuate the trade-off between density and growth throughout the whole rotation. Ann. Bot. 2021, 128, 767–786. [Google Scholar] [CrossRef] [PubMed]
- Power, H.; Raymond, P.; Prévost, M.; Roy, V.; Berninger, F. Basal area and diameter growth in high-graded eastern temperate mixedwood forests: The influence of acceptable growing stock, species, competition and climate. Forestry 2019, 92, 659–669. [Google Scholar] [CrossRef]
- Yue, C.; Kohnle, U.; Kahle, H.-P.; Klädtke, J. Exploiting irregular measurement intervals for the analysis of growth trends of stand basal area increments: A composite model approach. For. Ecol. Manag. 2012, 263, 216–228. [Google Scholar] [CrossRef]
- Reineke, L.H. Perfecting a stand-density index for even-aged forests. J. Agric. Res. 1933, 46, 627–638. [Google Scholar] [CrossRef]
- Seo, Y.; Lee, D.; Choi, J. Developing and comparing individual tree growth models of major coniferous species in south korea based on stem analysis data. Forests 2023, 14, 115. [Google Scholar] [CrossRef]
- Pienaar, L.; Turnbull, K. The Chapman-Richards generalization of von Bertalanffys growth model for basal area growth and yield in even-aged stands. For. Sci. 1973, 19, 2–21. [Google Scholar]
- Colbert, J.; Schuckers, M.; Fekedulegn, D.; Rentch, J.; MacSiúrtáin, M.n.; Gottschalk, K. Individual tree basal-area growth parameter estimates for four models. Ecol. Model. 2004, 174, 115–126. [Google Scholar] [CrossRef]
- Bianchi, S.; Siipilehto, J.; Repola, J.; Niemisto, P.; Korhonen, K.; Peltoniemi, M.; Salminen, H.; Hynynen, J. Individual tree basal area increment models suitable for different stand structures in Finland. For. Ecol. Manag. 2023, 549, 121467. [Google Scholar] [CrossRef]
- Wang, J.; Jiang, L.; Xin, S.; Wang, Y.; He, P.; Yan, Y. Two new methods applied to crown width additive models: A case study for three tree species in Northeastern China. Ann. For. Res. 2023, 80, 11. [Google Scholar] [CrossRef]
- Li, Y.; Ye, S.; Hui, G.; Hu, Y.; Zhao, Z. Spatial structure of timber harvested according to structure-based forest management. For. Ecol. Manag. 2014, 322, 106–116. [Google Scholar] [CrossRef]
- Poage, N.J.; Tappeiner, I.; John, C. Long-term patterns of diameter and basal area growth of old-growth Douglas-fir trees in western Oregon. Can. J. For. Res. 2002, 32, 1232–1243. [Google Scholar] [CrossRef]
- Smith, F.W.; Long, J.N. Age-related decline in forest growth: An emergent property. For. Ecol. Manag. 2001, 144, 175–181. [Google Scholar] [CrossRef]
- Barbosa, L.O.; Costa, E.A.; Schons, C.T.; Finger, C.A.G.; Liesenberg, V.; Bispo, P.d.C. Individual tree basal area increment models for Brazilian Pine (Araucaria angustifolia) using artificial neural networks. Forests 2022, 13, 1108. [Google Scholar] [CrossRef]
- Mohammadi, Z.; Mohammadi Limaei, S.; Lohmander, P.; Olsson, L. Estimation of a basal area growth model for individual trees in uneven-aged Caspian mixed species forests. J. For. Res. 2018, 29, 1205–1214. [Google Scholar] [CrossRef]
- Filipescu, C.N.; Comeau, P.G. Competitive interactions between aspen and white spruce vary with stand age in boreal mixedwoods. For. Ecol. Manag. 2007, 247, 175–184. [Google Scholar] [CrossRef]
- Forrester, D.I. The spatial and temporal dynamics of species interactions in mixed-species forests: From pattern to process. For. Ecol. Manag. 2014, 312, 282–292. [Google Scholar] [CrossRef]
- Padilla-Martínez, J.R.; Paul, C.; Husmann, K.; Corral-Rivas, J.J.; von Gadow, K. Grouping tree species to estimate basal area increment in temperate multispecies forests in Durango, Mexico. For. Ecosyst. 2024, 11, 100158. [Google Scholar] [CrossRef]
- Condés, S.; Del Rio, M.; Sterba, H. Mixing effect on volume growth of Fagus sylvatica and Pinus sylvestris is modulated by stand density. For. Ecol. Manag. 2013, 292, 86–95. [Google Scholar] [CrossRef]
- Xu, A.; Wang, D.; Liu, Q.; Zhang, D.; Zhang, Z.; Huang, X. Incorporating stand density effects and regression techniques for stem taper modeling of a Larix principis-rupprechtii plantation. Front. Plant. Sci. 2022, 13, 902325. [Google Scholar] [CrossRef]
- Gilson, L.W.; Maguire, D.A. Drivers of productivity differences between Douglas-fir planted within its native range in Oregon and on exotic sites in New Zealand. For. Ecol. Manag. 2021, 498, 119525. [Google Scholar] [CrossRef]
- Burkhart, H.E. Comparison of maximum size–density relationships based on alternate stand attributes for predicting tree numbers and stand growth. For. Ecol. Manag. 2013, 289, 404–408. [Google Scholar] [CrossRef]
- Budhathoki, C.B.; Lynch, T.B.; Guldin, J.M. Nonlinear mixed modeling of basal area growth for shortleaf pine. For. Ecol. Manag. 2008, 255, 3440–3446. [Google Scholar] [CrossRef]
- Rose Jr, C.E.; Lynch, T.B. Estimating parameters for tree basal area growth with a system of equations and seemingly unrelated regressions. For. Ecol. Manag. 2001, 148, 51–61. [Google Scholar] [CrossRef]
- Tenzin, J.; Tenzin, K.; Hasenauer, H. Individual tree basal area increment models for broadleaved forests in Bhutan. Forestry 2017, 90, 367–380. [Google Scholar] [CrossRef]
- Perin, J.; Claessens, H.; Lejeune, P.; Brostaux, Y.; Hébert, J. Distance-independent tree basal area growth models for Norway spruce, Douglas-fir and Japanese larch in Southern Belgium. Eur. J. For. Res. 2017, 136, 193–204. [Google Scholar] [CrossRef]
- Liu, Y.; Wang, D.; Zhang, Z.; Liu, Q.; Zhang, D.; Xu, Z. Modeling Free Branch Growth with the Competition Index for a Larix principis-rupprechtii Plantation. Forests 2023, 14, 1495. [Google Scholar] [CrossRef]
- Fu, L.; Lei, Y.; Sun, W.; Tang, S.; Zeng, W. Development of compatible biomass models for trees from different stand origin. Acta Ecol. Sin. 2014, 34, 1461–1470. (In Chinese) [Google Scholar] [CrossRef]
- Babst, F.; Bouriaud, O.; Alexander, R.; Trouet, V.; Frank, D. Toward consistent measurements of carbon accumulation: A multi-site assessment of biomass and basal area increment across Europe. Dendrochronologia 2014, 32, 153–161. [Google Scholar] [CrossRef]
- Opie, J.E. Predictability of Individual Tree Growth Using Various Definitions of Competing Basal Area. For. Sci. 1968, 14, 314–323. [Google Scholar]
- Gove, J.H.; Patil, G.P. Modeling the basal area-size distribution of forest stands: A compatible approach. For. Sci. 1998, 44, 285–297. [Google Scholar] [CrossRef]
- Brown, S.; Narine, L.L.; Gilbert, J. Using airborne lidar, multispectral imagery, and field inventory data to estimate basal area, volume, and aboveground biomass in heterogeneous mixed species forests: A case study in southern Alabama. Remote Sens. 2022, 14, 2708. [Google Scholar] [CrossRef]
- Jevšenak, J.; Skudnik, M. A random forest model for basal area increment predictions from national forest inventory data. For. Ecol. Manag. 2021, 479, 118601. [Google Scholar] [CrossRef]
- Wang, Y.; Wang, D.; Zhang, D.; Liu, Q.; Li, Y. Predicting carbon storage of mixed broadleaf forests based on the finite mixture model incorporating stand factors, site quality, and aridity index. For. Ecosyst. 2024, 11, 100189. [Google Scholar] [CrossRef]
- Monserud, R.A.; Sterba, H. A basal area increment model for individual trees growing in even-and uneven-aged forest stands in Austria. For. Ecol. Manag. 1996, 80, 57–80. [Google Scholar] [CrossRef]
- Yang, Y.; Huang, S.; Meng, S.X.; Trincado, G.; VanderSchaaf, C.L. A multilevel individual tree basal area increment model for aspen in boreal mixedwood stands. Can. J. For. Res. 2009, 39, 2203–2214. [Google Scholar] [CrossRef]
- Kweon, D.; Comeau, P.G. Relationships between tree survival, stand structure and age in trembling aspen dominated stands. For. Ecol. Manag. 2019, 438, 114–122. [Google Scholar] [CrossRef]
- Chen, J.; Yang, H.; Man, R.; Wang, W.; Sharma, M.; Peng, C.; Parton, J.; Zhu, H.; Deng, Z. Using machine learning to synthesize spatiotemporal data for modelling DBH-height and DBH-height-age relationships in boreal forests. For. Ecol. Manag. 2020, 466, 118104. [Google Scholar] [CrossRef]
- Sun, H.; Zhang, J.; Duan, A.; He, C. A review of stand basal area growth models. For. Stud. China 2007, 9, 85–94. [Google Scholar] [CrossRef]
- Pan, X.; Sun, S.; Hua, W.; Li, J.; Zhuang, C.; Jiang, X. Predicting the Stand Growth and Yield of Mixed Chinese Fir Forests Based on Their Site Quality, Stand Density, and Species Composition. Forests 2023, 14, 2315. [Google Scholar] [CrossRef]
- Richards, F.J. A flexible growth function for empirical use. J. Exp. Bot. 1959, 10, 290–301. [Google Scholar] [CrossRef]
- Tang, S.; Zhang, H.; Xu, H. Study on establish and estimate method of compatible biomass model. Sci. Silv. Sin. 2000, 36, 19–27. (In Chinese) [Google Scholar] [CrossRef]
- Wang, D.; Zhang, Z.; Zhang, D.; Huang, X. Biomass allometric models for Larix rupprechtii based on Kosak’s taper curve equations and nonlinear seemingly unrelated regression. Front. Plant. Sci. 2023, 13, 1056837. [Google Scholar] [CrossRef]
- Xin, S.; Shahzad, M.K.; Mahardika, S.B.; Wang, W.; Jiang, L. An Alternative Method for Estimation of Stand-Level Biomass for Three Conifer Species in Northeast China. Forests 2023, 14, 1274. [Google Scholar] [CrossRef]
- Xiong, N.; Qiao, Y.; Ren, H.; Zhang, L.; Chen, R.; Wang, J. Comparison of Parameter Estimation Methods Based on Two Additive Biomass Models with Small Samples. Forests 2023, 14, 1655. [Google Scholar] [CrossRef]
- Castedo-Dorado, F.; Diéguez-Aranda, U.; Barrio-Anta, M.; Álvarez-González, J.G. Modelling stand basal area growth for radiata pine plantations in Northwestern Spain using the GADA. Ann. For. Res. 2007, 64, 609–619. [Google Scholar] [CrossRef]

| Species | Type | Model | Model Forms | b0 | b1 | b2 | b3 | b4 | b5 |
|---|---|---|---|---|---|---|---|---|---|
| SBAP | Korf | M1 | 0.013 *** (0.002) | 0.289 *** (0.032) | 4.454 *** (1.042) | 1.029 *** (0.020) | - | - | |
| M2 | 14.026 *** (1.661) | 0.290 *** (0.034) | 2.196 ** (0.769) | 1.020 *** (0.020) | - | - | |||
| Schumacher | M3 | −3.377 *** (0.650) | −30.547 ns (16.450) | 0.801 *** (0.123) | 0.452 ** (0.162) | 6.049 ns (3.223) | −4.446 * (4.101) | ||
| M4 | 2.105 *** (0.257) | 12.677 * (6.345) | 0.894 *** (0.093) | 0.485 *** (0.086) | 3.559 ns (2.385) | −5.384 * (2.224) | |||
| Richards | M5 | 31.156 * (13.690) | 0.216 *** (0.043) | 0.002 ns (0.004) | 2.243 *** (0.271) | 0.483 *** (0.066) | - | ||
| M6 | 23.576 * (18.991) | 0.288 *** (0.032) | 0.001 * (0.001) | 6.593 *** (1.808) | 0.157 *** (0.041) | - | |||
| SBAB | Korf | M1 | S | 0.012 *** (0.002) | 0.285 *** (0.033) | 3.867 ** (1.131) | 1.030 *** (0.020) | - | - |
| M2 | 10.301 *** (1.770) | 0.423 *** (0.062) | 1.443 ns (0.893) | 1.034 *** (0.017) | - | - | |||
| Schumacher | M3 | −4.862 *** (1.308) | 1.667 ns (4.418) | 1.073 *** (0.110) | 0.374 ** (0.334) | −1.466 ns (3.450) | 1.531 ns (8.214) | ||
| M4 | 2.163 *** (0.414) | 2.644 ns (9.992) | 1.053 *** (0.074) | 0.505 ** (0.183) | −0.648 ns (2.272) | −2.134 ns (4.570) | |||
| Richards | M5 | 16.121 ns (40.244) | 0.775 ns (0.474) | 0.013 ns (0.047) | 1.014 ns (1.597) | 0.424 ns (0.623) | - | ||
| M6 | 19.954 ns (42.750) | 0.728 ns (0.417) | 0.002 ns (0.063) | 0.537 ns (0.317) | 0.931 ns (0.828) | - |
| Species | Type | Model | MAE | MPE | RMSE | R2 | |
|---|---|---|---|---|---|---|---|
| SBAP | Korf | M1 | 1.000 | 0.073 | 1.710 | 0.961 | 0.959 |
| M2 | 1.003 | 0.076 | 1.737 | 0.960 | 0.958 | ||
| Schumacher | M3 | 0.988 | 0.072 | 1.642 | 0.962 | 0.957 | |
| M4 | 1.572 | 0.074 | 1.722 | 0.952 | 0.948 | ||
| Richards | M5 | 1.837 | 0.137 | 2.232 | 0.932 | 0.927 | |
| M6 | 0.973 | 0.070 | 1.438 | 0.965 | 0.962 | ||
| SBAB | Korf | M1 | 0.515 | 0.091 | 0.749 | 0.963 | 0.961 |
| M2 | 0.612 | 0.109 | 0.878 | 0.959 | 0.957 | ||
| Schumacher | M3 | 0.535 | 0.093 | 0.808 | 0.951 | 0.947 | |
| M4 | 0.641 | 0.114 | 0.808 | 0.950 | 0.946 | ||
| Richards | M5 | 2.893 | 0.382 | 3.558 | 0.475 | 0.436 | |
| M6 | 2.418 | 0.348 | 3.331 | 0.443 | 0.401 |
| SBA | b0 | b1 | b2 | b3 | b4 | RMSE | |
|---|---|---|---|---|---|---|---|
| SBAP | 19.254 * (10.378) | 0.307 *** (0.049) | 0.003 * (0.001) | 6.808 * (2.801) | 0.157 * (0.065) | 0.709 | 0.981 |
| SBAB | 0.010 * (0.004) | 0.377 *** (0.081) | 3.343 * (1.637) | 1.032 *** (0.029) | - | 0.678 | 0.979 |
| SBAt | 0.016 *** (0.005) | 0.264 *** (0.048) | 3.155 ** (1.201) | 1.001 *** (0.028) | - | 1.776 | 0.939 |
| SBA | b0 | b1 | b2 | b3 | b4 | RMSE | |
|---|---|---|---|---|---|---|---|
| SBAP | 30.3645 * (13.4303) | 0.2701 *** (0.0315) | 0.0002 * (0.0001) | 6.6979 *** (1.8965) | 0.1498 *** (0.0429) | 0.6297 | 0.9870 |
| SBAB | 0.0080 ** (0.0026) | 0.4216 *** (0.0615) | 1.4756 * (0.8851) | 1.0338 *** (0.0210) | - | 0.4092 | 0.9858 |
| SBAt | - | - | - | - | - | 0.6263 | 0.9757 |
| Method | SBA | MAE | MPE | RMSE | R2 | |
|---|---|---|---|---|---|---|
| NLS | SBAP | 0.973 | 0.071 | 1.438 | 0.965 | 0.963 |
| SBAB | 0.515 | 0.091 | 0.749 | 0.963 | 0.961 | |
| SBAt | 1.354 | 0.069 | 1.776 | 0.942 | 0.939 | |
| AP | SBAP | 0.560 | 0.043 | 0.709 | 0.982 | 0.981 |
| SBAB | 0.511 | 0.079 | 0.678 | 0.980 | 0.979 | |
| SBAt | 0.921 | 0.047 | 1.170 | 0.965 | 0.960 | |
| NSUR | SBAP | 0.524 | 0.036 | 0.630 | 0.987 | 0.987 |
| SBAB | 0.353 | 0.057 | 0.409 | 0.986 | 0.986 | |
| SBAt | 0.481 | 0.044 | 0.626 | 0.979 | 0.976 |
| Stand Variable | P. davidiana × B. platyphylla | P. davidiana | B. platyphylla | |||||||||
|---|---|---|---|---|---|---|---|---|---|---|---|---|
| Max. | Min. | S.D. | Mean | Max. | Min. | S.D. | Mean | Max. | Min. | S.D. | Mean | |
| SBA (m2·ha−1) | 33.1 | 5.6 | 5.6 | 19.1 | 28.5 | 3.1 | 6.0 | 12.9 | 14.6 | 2.7 | 2.8 | 6.2 |
| SI (m) | 24.0 | 8.1 | 3.7 | 15.8 | 23.6 | 7.1 | 3.9 | 14.7 | 21.4 | 8.1 | 3.2 | 14.8 |
| Dg (cm) | 21.8 | 6.3 | 3.9 | 15.3 | 23.6 | 6.2 | 4.1 | 14.8 | 27.6 | 6.8 | 5.2 | 16.1 |
| ADBH (year) | 42 | 17 | 5 | 28 | 44 | 14 | 7 | 26 | 45 | 13 | 6 | 29 |
| SDI (trees·ha−1) | 985.8 | 317.4 | 245.7 | 698.3 | 849.8 | 105.8 | 185.8 | 469.2 | 547.1 | 50.6 | 183.1 | 242.7 |
| Type | Expression | Reference |
|---|---|---|
| Korf | Pan et al., 2023 [99] | |
| Schumacher | Schumacher, 1939 [25] | |
| Richards | Richards, 1959 [100] |
Disclaimer/Publisher’s Note: The statements, opinions and data contained in all publications are solely those of the individual author(s) and contributor(s) and not of MDPI and/or the editor(s). MDPI and/or the editor(s) disclaim responsibility for any injury to people or property resulting from any ideas, methods, instructions or products referred to in the content. |
© 2024 by the authors. Licensee MDPI, Basel, Switzerland. This article is an open access article distributed under the terms and conditions of the Creative Commons Attribution (CC BY) license (https://creativecommons.org/licenses/by/4.0/).
Share and Cite
Zeng, X.; Wang, D.; Zhang, D.; Lu, W.; Li, Y.; Liu, Q. Developing the Additive Systems of Stand Basal Area Model for Broad-Leaved Mixed Forests. Plants 2024, 13, 1758. https://doi.org/10.3390/plants13131758
Zeng X, Wang D, Zhang D, Lu W, Li Y, Liu Q. Developing the Additive Systems of Stand Basal Area Model for Broad-Leaved Mixed Forests. Plants. 2024; 13(13):1758. https://doi.org/10.3390/plants13131758
Chicago/Turabian StyleZeng, Xijuan, Dongzhi Wang, Dongyan Zhang, Wei Lu, Yongning Li, and Qiang Liu. 2024. "Developing the Additive Systems of Stand Basal Area Model for Broad-Leaved Mixed Forests" Plants 13, no. 13: 1758. https://doi.org/10.3390/plants13131758
APA StyleZeng, X., Wang, D., Zhang, D., Lu, W., Li, Y., & Liu, Q. (2024). Developing the Additive Systems of Stand Basal Area Model for Broad-Leaved Mixed Forests. Plants, 13(13), 1758. https://doi.org/10.3390/plants13131758