Article

Pharmacognostic Evaluation, Chemical Characterization, and Antibacterial Activity of Bassia indica (Wight) A.J. Scott

1
Department of Pharmacology, Faculty of Pharmacy, The Islamia University of Bahawalpur, Bahawalpur 63100, Pakistan
2
College of Pharmacy, Al Ain University, Abu Dhabi 112612, United Arab Emirates
3
AAU Health and Biomedical Research Center, Al Ain University, Abu Dhabi 112612, United Arab Emirates
4
Department of Pharmacognosy, Faculty of Pharmacy, The Islamia University of Bahawalpur, Bahawalpur 63100, Pakistan
5
Department of Pharmacy Practice, Faculty of Pharmacy, The Islamia University of Bahawalpur, Bahawalpur 63100, Pakistan
6
Department of Pharmaceutics, Faculty of Pharmacy, The Islamia University of Bahawalpur, Bahawalpur 63100, Pakistan
7
Department of Pharmaceutical Chemistry, Faculty of Pharmacy, The Islamia University of Bahawalpur, Bahawalpur 63100, Pakistan
8
Department of Botany, Faculty of Chemical and Biological Sciences, The Islamia University of Bahawalpur, Bahawalpur 63100, Pakistan
9
Department of Pharmacy, Faculty of Pharmacy, The Islamia University of Bahawalpur, Bahawalpur 63100, Pakistan
10
School of Biochemistry and Biotechnology, Quaid-e-Azam Campus, University of the Punjab, Lahore 54590, Pakistan
11
Division of Pharmacology and Toxicology, University of Vienna, UZA II, Josef-Holaubek-Platz 2, A-1090 Vienna, Austria
*
Authors to whom correspondence should be addressed.
Plants 2024, 13(13), 1753; https://doi.org/10.3390/plants13131753
Submission received: 23 May 2024 / Revised: 20 June 2024 / Accepted: 21 June 2024 / Published: 25 June 2024
(This article belongs to the Special Issue Phytochemistry and Pharmacological Properties of Medicinal Plants)

Abstract

:
Bassia indica (Wight) A.J. Scott is an Indian origin plant with documented medicinal and nutritional value, but has not been fully characterized yet. The present study was designed to establish pharmacognostic standards for the proper identification of the B. indica plant and its chemical characterization. The plant was standardized with World Health Organization (WHO) standardization tools and chemically characterized by Fourier transform infrared spectroscopy (FTIR) and gas chromatography-mass spectroscopy (GC-MS) analysis. Antibacterial potential was assessed by the zone of inhibition and minimum inhibitory concentration (MIC), and molecular docking studies were also performed. Pharmacognostic evaluation established the macroscopic and microscopic parameters for the identification of whole plant and its powder. Physicochemical parameters were also set forth while quantitative phytochemical analysis showed that the ethyl acetate fraction had the highest quantity of phenols, flavonoids, and tannins. FTIR analysis showed several functional groups such as phenols, alkanes, and alcohols while 55 phytochemicals were identified in the GC-MS analysis of the crude fraction. The crude extract and other fractions showed marked antibacterial activity, while the ethyl acetate fraction showed the least MIC (1.95–31.25 mg/mL). Phytochemicals identified in the GC-MS showed good molecular docking interactions against the DNA gyrase subunit B of bacteria with binding energies ranging from −4.2 to −9.4 kcal/mol. The current study describes the pharmacognostic characterization and phytochemical profiling of B. indica and provides scientific evidence to support its use in infections.

Graphical Abstract

1. Introduction

Plants have been a major source of agents used for the management of various diseases across the world for millennia and are still of contemporary importance as 80% of people worldwide depend on herbal remedies in their primary healthcare system, and over 25% of prescribed medicines in developed countries are of plant origin [1,2]. Over the last few decades, an upsurge has been witnessed in the public acceptance of natural therapies, leading to the increased usage of herbal medicines and phytonutrients. In Europe, over 1300 medicinals are being used for various ailments, while 118 out of the top 150 prescription drugs in the USA are based on natural resources [3]. Due to the increased demand for medicinal plants and the continuous loss of natural habitat, medicinal plants are facing a serious challenge to their existence. An upsurge in the usage of herbal medicines, a decrease in natural sources, and less availability of genuine crude drugs are resulting in adulteration and substitution practices [4]. Furthermore, crude drugs are collected, stored, distributed, and sold in raw form without any special packaging, which may also lead to adulteration and substitution [5].
As the use of herbal products continues to grow globally, concerns regarding their safety and public health issues are also increasingly recognized. One survey showed that 27% of herbal products commercialized worldwide are adulterated. The growing evidence of poor quality and a lack of authenticity is causing deep concerns [6]. Therefore, the proper identification of plants, their standardization, and documentation is very important for the quality of drugs. Identification includes the physical, biological, chemical, and biochemical features of plant species [7]. The WHO has set various qualitative and quantitative parameters for the standardization and quality control of herbal medicines. In pharmacognostic standardization, crude drugs are properly identified, their quality and purity is confirmed, and possible adulteration is observed. Qualitative methods of standardization such as organoleptic evaluation, toxicity testing, and bioassays contribute to the correct identification of crude drugs, while physicochemical analysis is carried out for their quantification [8].
Bassia indica (Wight) A.J. Scott [Syn.: Kochia indica Wight] belongs to the family Amaranthaceae [9]. This family includes a large number of halophytes that are well-known for their therapeutic applications in traditional medical systems and are used for infected skin wounds, internal worms, fungal infections, renal and rheumatic disorders [10] as a cardiotonic [11], anti-inflammatory, and antioxidant [12]. B. indica is an annual herb found in Egypt, India, Pakistan, Northern Africa, Saudi Arabia, and other countries [13]. The plant extracts are reported to have therapeutically important metabolites including polyphenols, sterols, alkaloids, glycosides, tannins, coumarins, terpenes, and saponins [14]. Moreover, it has been reported that this plant exhibits anti-inflammatory, anticancer [15], antioxidant [16], antimicrobial [17], antifungal [18], antiparasitic [14], anti-ulcer [12], and neuroprotective activities [19].
Despite the medicinal potential of B. indica, its pharmacognostic evaluation has not been performed yet. Therefore, the present study was designed to establish a pharmacognostic standard for the proper identification and purity of the plant to avoid adulteration. Along with this, comprehensive chemical characterization was carried out and the antibacterial activity was tested. Further in silico molecular docking was performed to identify the compounds responsible for the antibacterial effects. In vitro cytotoxicity and acute toxicity studies in mice were also conducted to establish its safety profile.

2. Results

2.1. Extract Preparation and Fractionation

A total of 264 g B. indica extract was obtained from 3 kg powder of the aerial parts with an 8.8% yield. During fractionation, the highest yield (77%) was observed in the aqueous fraction while the least yield (1%) was observed in the n-hexane fraction.

2.2. Pharmacognostic Evaluation

2.2.1. Macroscopic Analysis

The fresh leaves of the plant were hairy, dark green in color, and decussate in arrangement with lanceolate tips (Figure 1b), which turned into light brown on drying. The leaves were 3.7 cm long and had a 0.5 cm width (Figure 1c). The stem was yellowish green and flowers were inconspicuous. The plant has a characteristic odor and bitter taste.

2.2.2. Microscopic Analysis

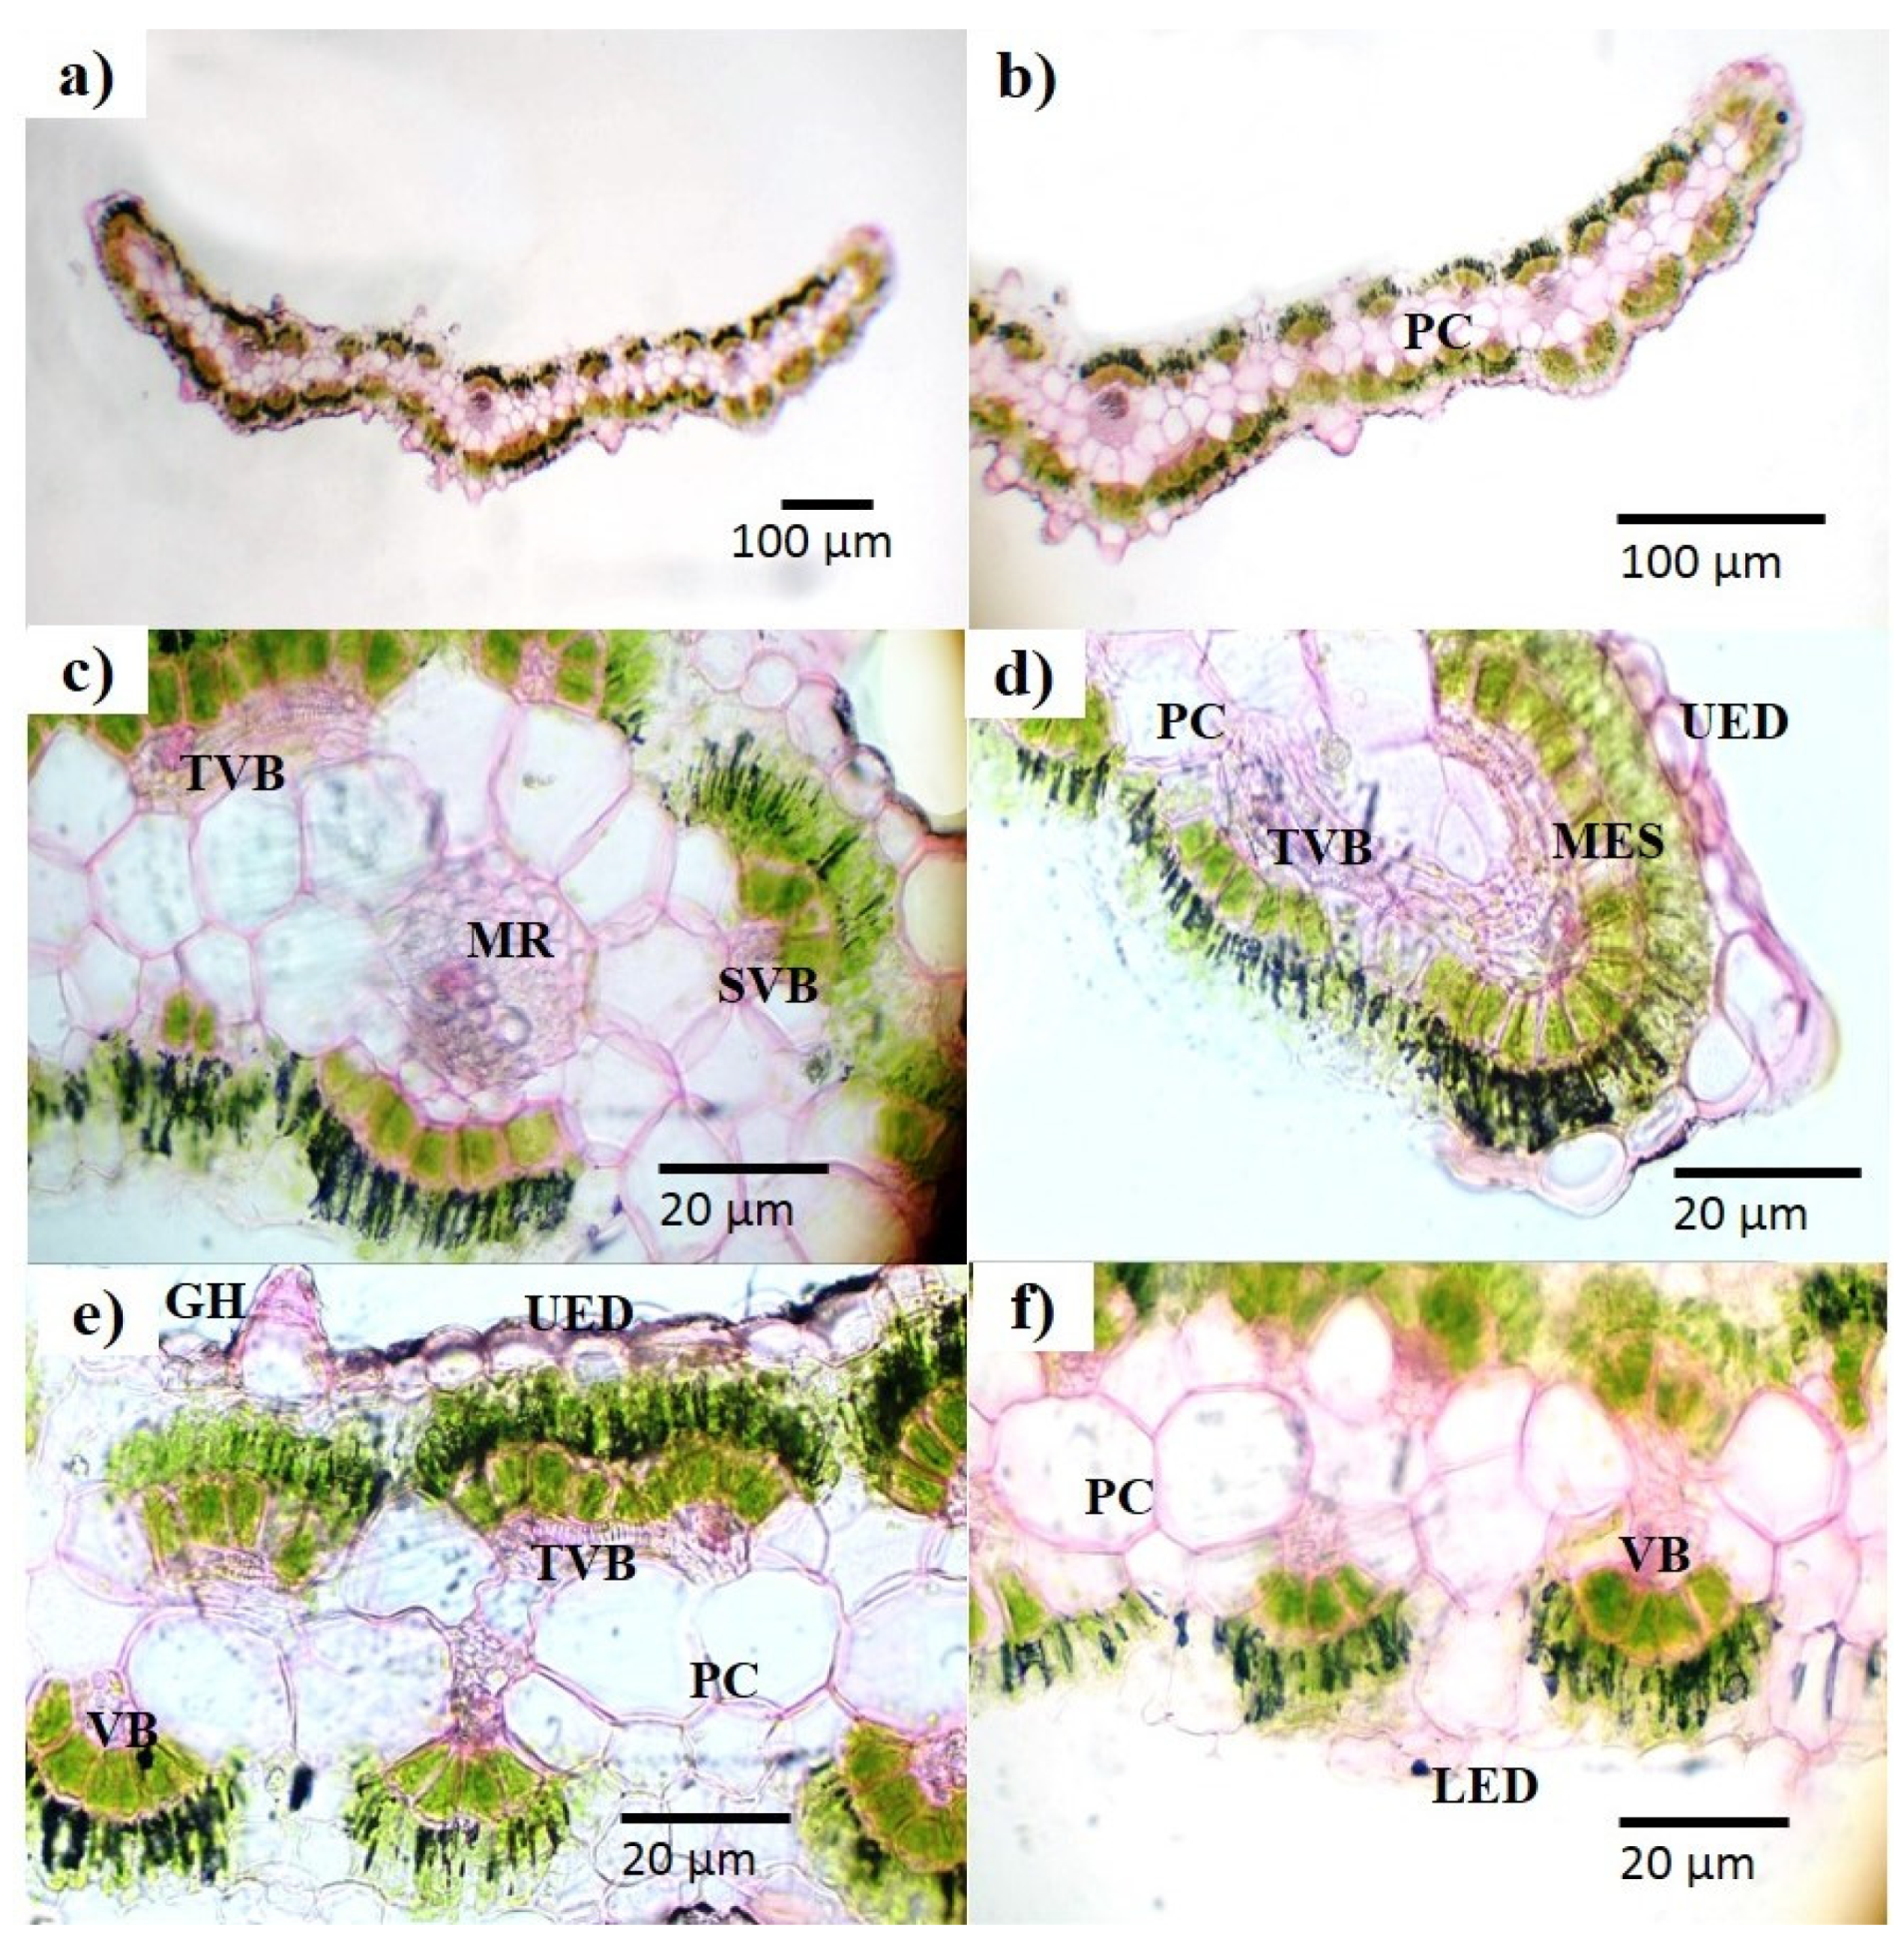
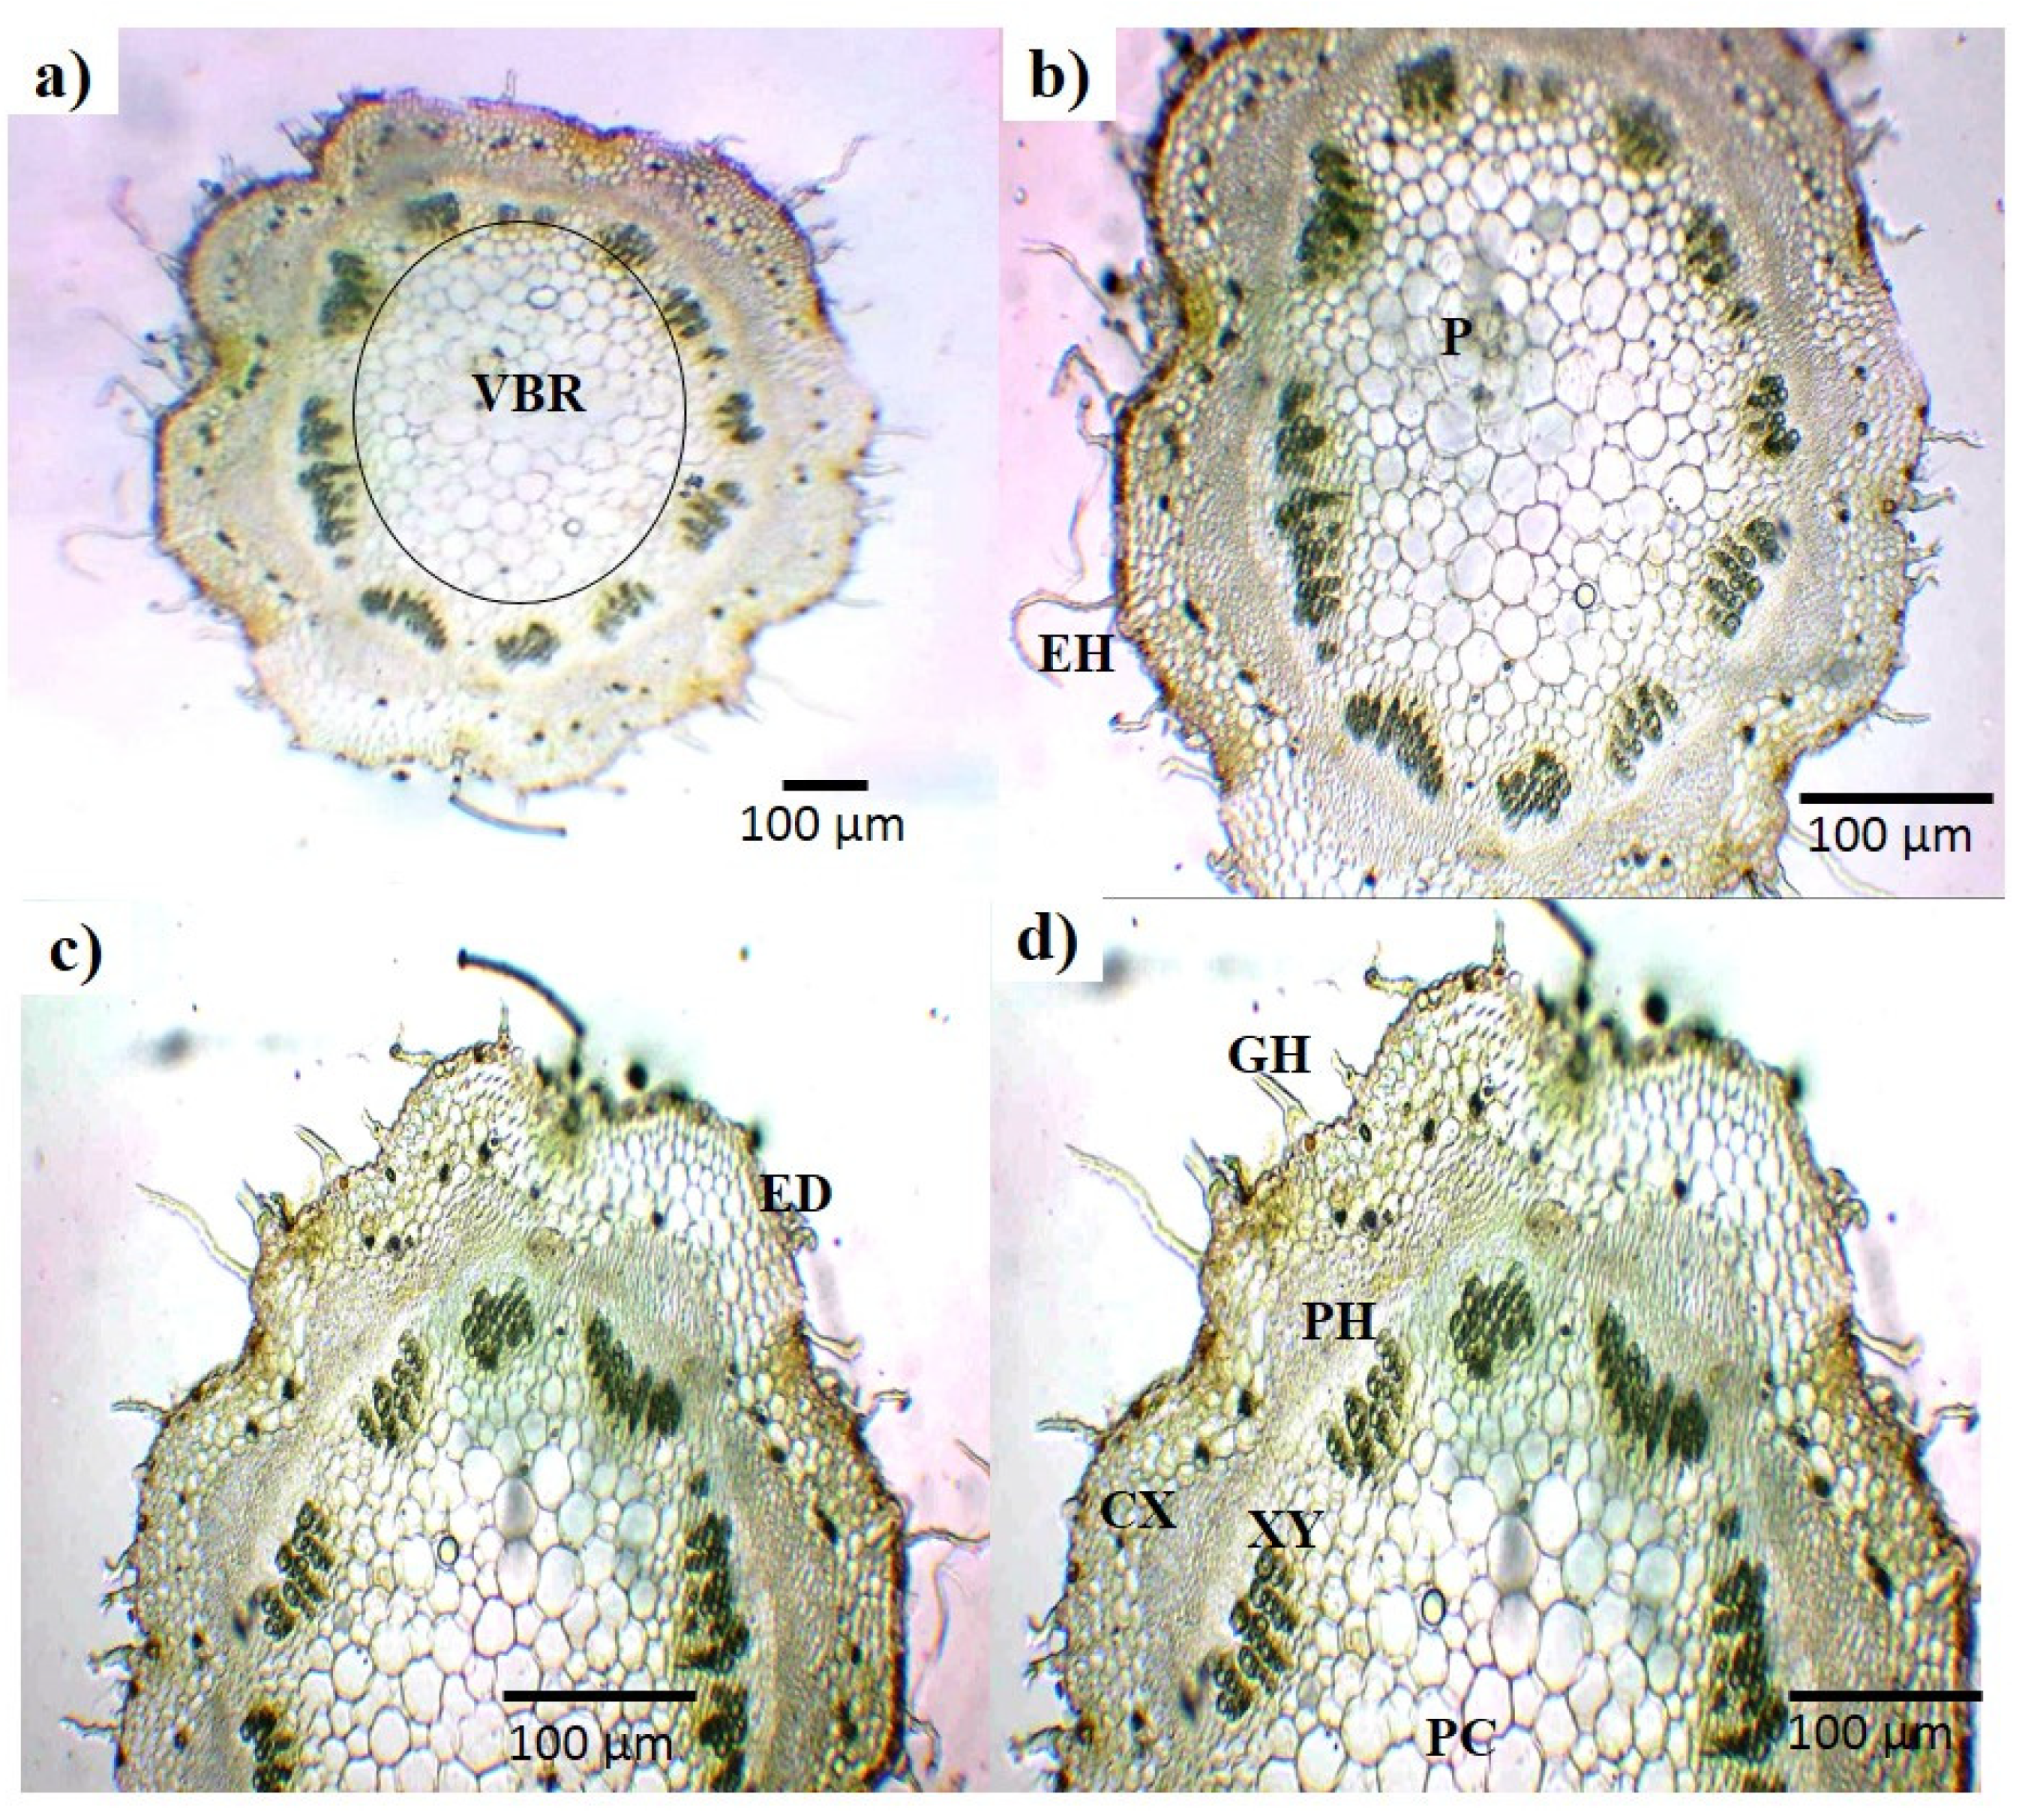
In the microscopic analysis of fresh leaves, complete transverse sections (TSs) of a leaf are presented (Figure 2a). In the center of the TS, a closely packed cell area (midrib) was seen, along with a number of whitish parenchyma cells in the adjacent areas (Figure 2b,c). Between the parenchyma cells and mesophyll, vascular bundles (cylindrical shaped) could be seen (Figure 2c,d). The TS of the leaf showed that an elongated cell layer covered both sides of the leaf called the upper and lower epidermal cells (Figure 2d,f). Glandular hair and mesophyll was also seen in the TS (Figure 2e). Similarly, the complete TS of the B. indica stem with a vascular bundle ring in the middle is presented (Figure 3a). A small and closely packed area, called the pith, and green colored xylem could also be visualized (Figure 3b,c). These different parts and cells of the leaf and stem were also observed in the dried powder of the aerial parts of B. indica (Figure 4). In addition to these structures, a number of stomata cells were seen in the epidermal cells along with abundant starch grains (Figure 4a,c). Microscopic analysis also showed that the powder had pitted as well as spiral vessels (Figure 4h,j).

2.2.3. Scanning Electron Microscopy

B. indica powder was observed under a scanning electron microscope for detailed anatomy. SEM analysis of the aerial parts (powder) showed the presence of epidermal and stomata cells embedded in fibers like a vascular bundle (Figure 5a). Many salt crystals and broken bundles of vessels were also seen (Figure 5b–d). Under the scanning electron microscope, epidermal hairs and fibers were seen, which can be an important parameter for plant identification (Figure 5f).

2.2.4. Extractive Value and Swelling Index

Percent extractive values of the B. indica powder was carried out in solvents with different polarities. The maximum extractive value was observed in the aqueous solvent (10.5%) and the minimum for n-hexane (Table 1). The swelling index of the plant powder was 0.6 cm.

2.2.5. Nutritional and Elemental Analysis

The nutritional analysis of the powder showed the presence of the highest amount of crude fibers (24.21%), followed by carbohydrates and proteins (Table 2). The total caloric value was 111.43 kcal/100 g of dry powder. The atomic absorption spectroscopy of the B. indica extract showed the presence of different elements (Table 2), where the analysis showed the highest amount of calcium (470 ppm), followed by iron (161 ppm) and magnesium (55.6 ppm). The content of heavy metals (i.e., lead, cadmium, chromium, copper, and zinc) was less than the WHO maximum permissible element values.

2.2.6. Fluorescence Analysis

Fluorescence analysis of the powdered aerial parts of B. indica was carried out with various reagents that showed different shades of colors such as light and dark brown, light greenish, black greenish, and purple (Table 3). Fluorescence analysis is an important parameter adopted to confirm the quality of the crude drug as different secondary metabolites present in the crude material exhibit different fluorescence under visible and ultraviolet (UV) light when treated with different reagents.

2.2.7. Thin Layer Chromatography

In the TLC profile, different fluorescent compounds were separated depending upon their affinity toward the mobile phase polarity. Brown spots were observed when TLC plates were seen under UV light at 254 nm. The maximum number (5) of spots were seen when the chloroform and methanol (4:1) mobile phase was used. The appearance of multiple spots on the TLC plates suggests the presence of secondary metabolites like flavonoids, phenolic compounds, glycosides, and saponins. The Rf values of different spots are listed in Table 4.

2.3. Phytochemical Analysis

2.3.1. Qualitative Analysis

The presence of different important bioactive secondary metabolites was detected by phytochemical analysis. The appearance of different colors and precipitates confirmed the presence of several secondary metabolites including alkaloids, carbohydrates, flavonoids, glycosides, phenols, saponins, and tannins.

2.3.2. Quantitative Analysis of Total Phenols, Tannins, Flavonoids, and Saponins

Therapeutically important phytoconstituents like phenols, flavonoids, and tannins present in the extract were further quantified (Table 5). The quantitative analysis showed that the ethyl acetate fraction contained the highest amount of total phenols (419.10 ± 11.76), tannins (249.60 ± 10.50) mg tannic acid equivalent per gram of dried extract (mg TAEg−1), and flavonoids 161.790 ± 1.375 mg quercetin equivalent per gram of dried extract (mg QEg−1). The saponin contents were greater in the aqueous fraction (40.5 ± 0.9%) compared to the crude extract (30.9 ± 2.2%). Significant amounts of these secondary metabolites present in the plant suggest that B. indica may have therapeutic potential.

2.4. FTIR Spectroscopy

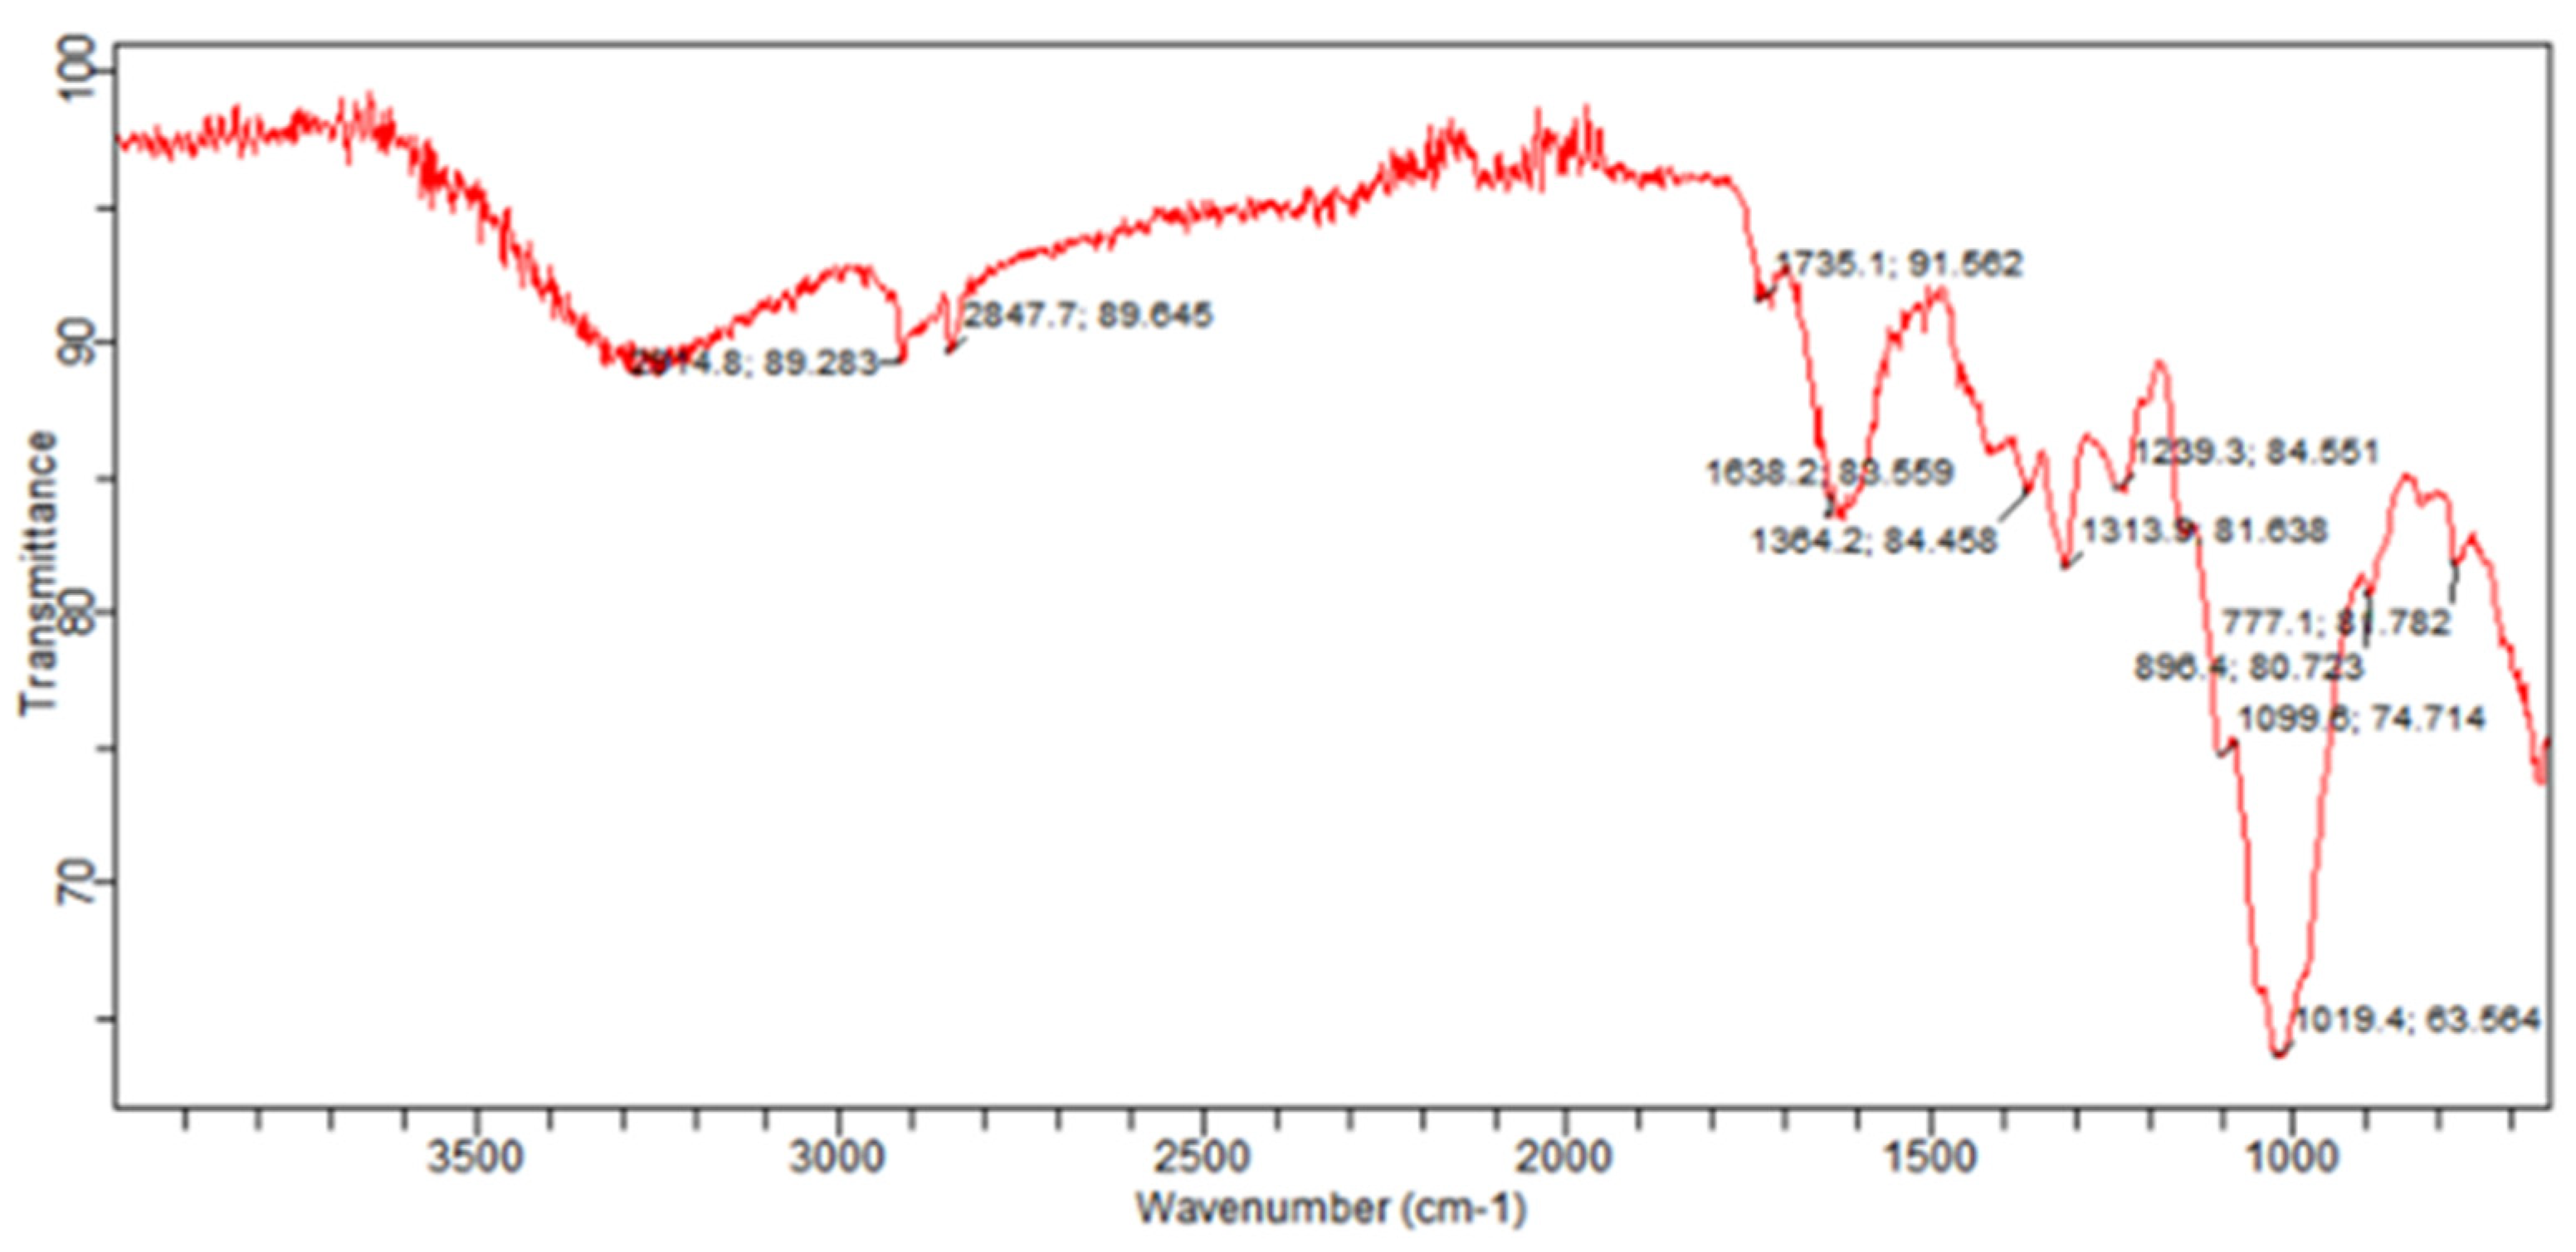
The B. indica extract was also characterized with FTIR (Figure 6). The FTIR of the crude extract showed 11 characteristic peaks ranging from 777.1 to 2914.8 cm−1 in the frequency range and important medicinal functional groups (Table 6).

2.5. GC-MS Analysis

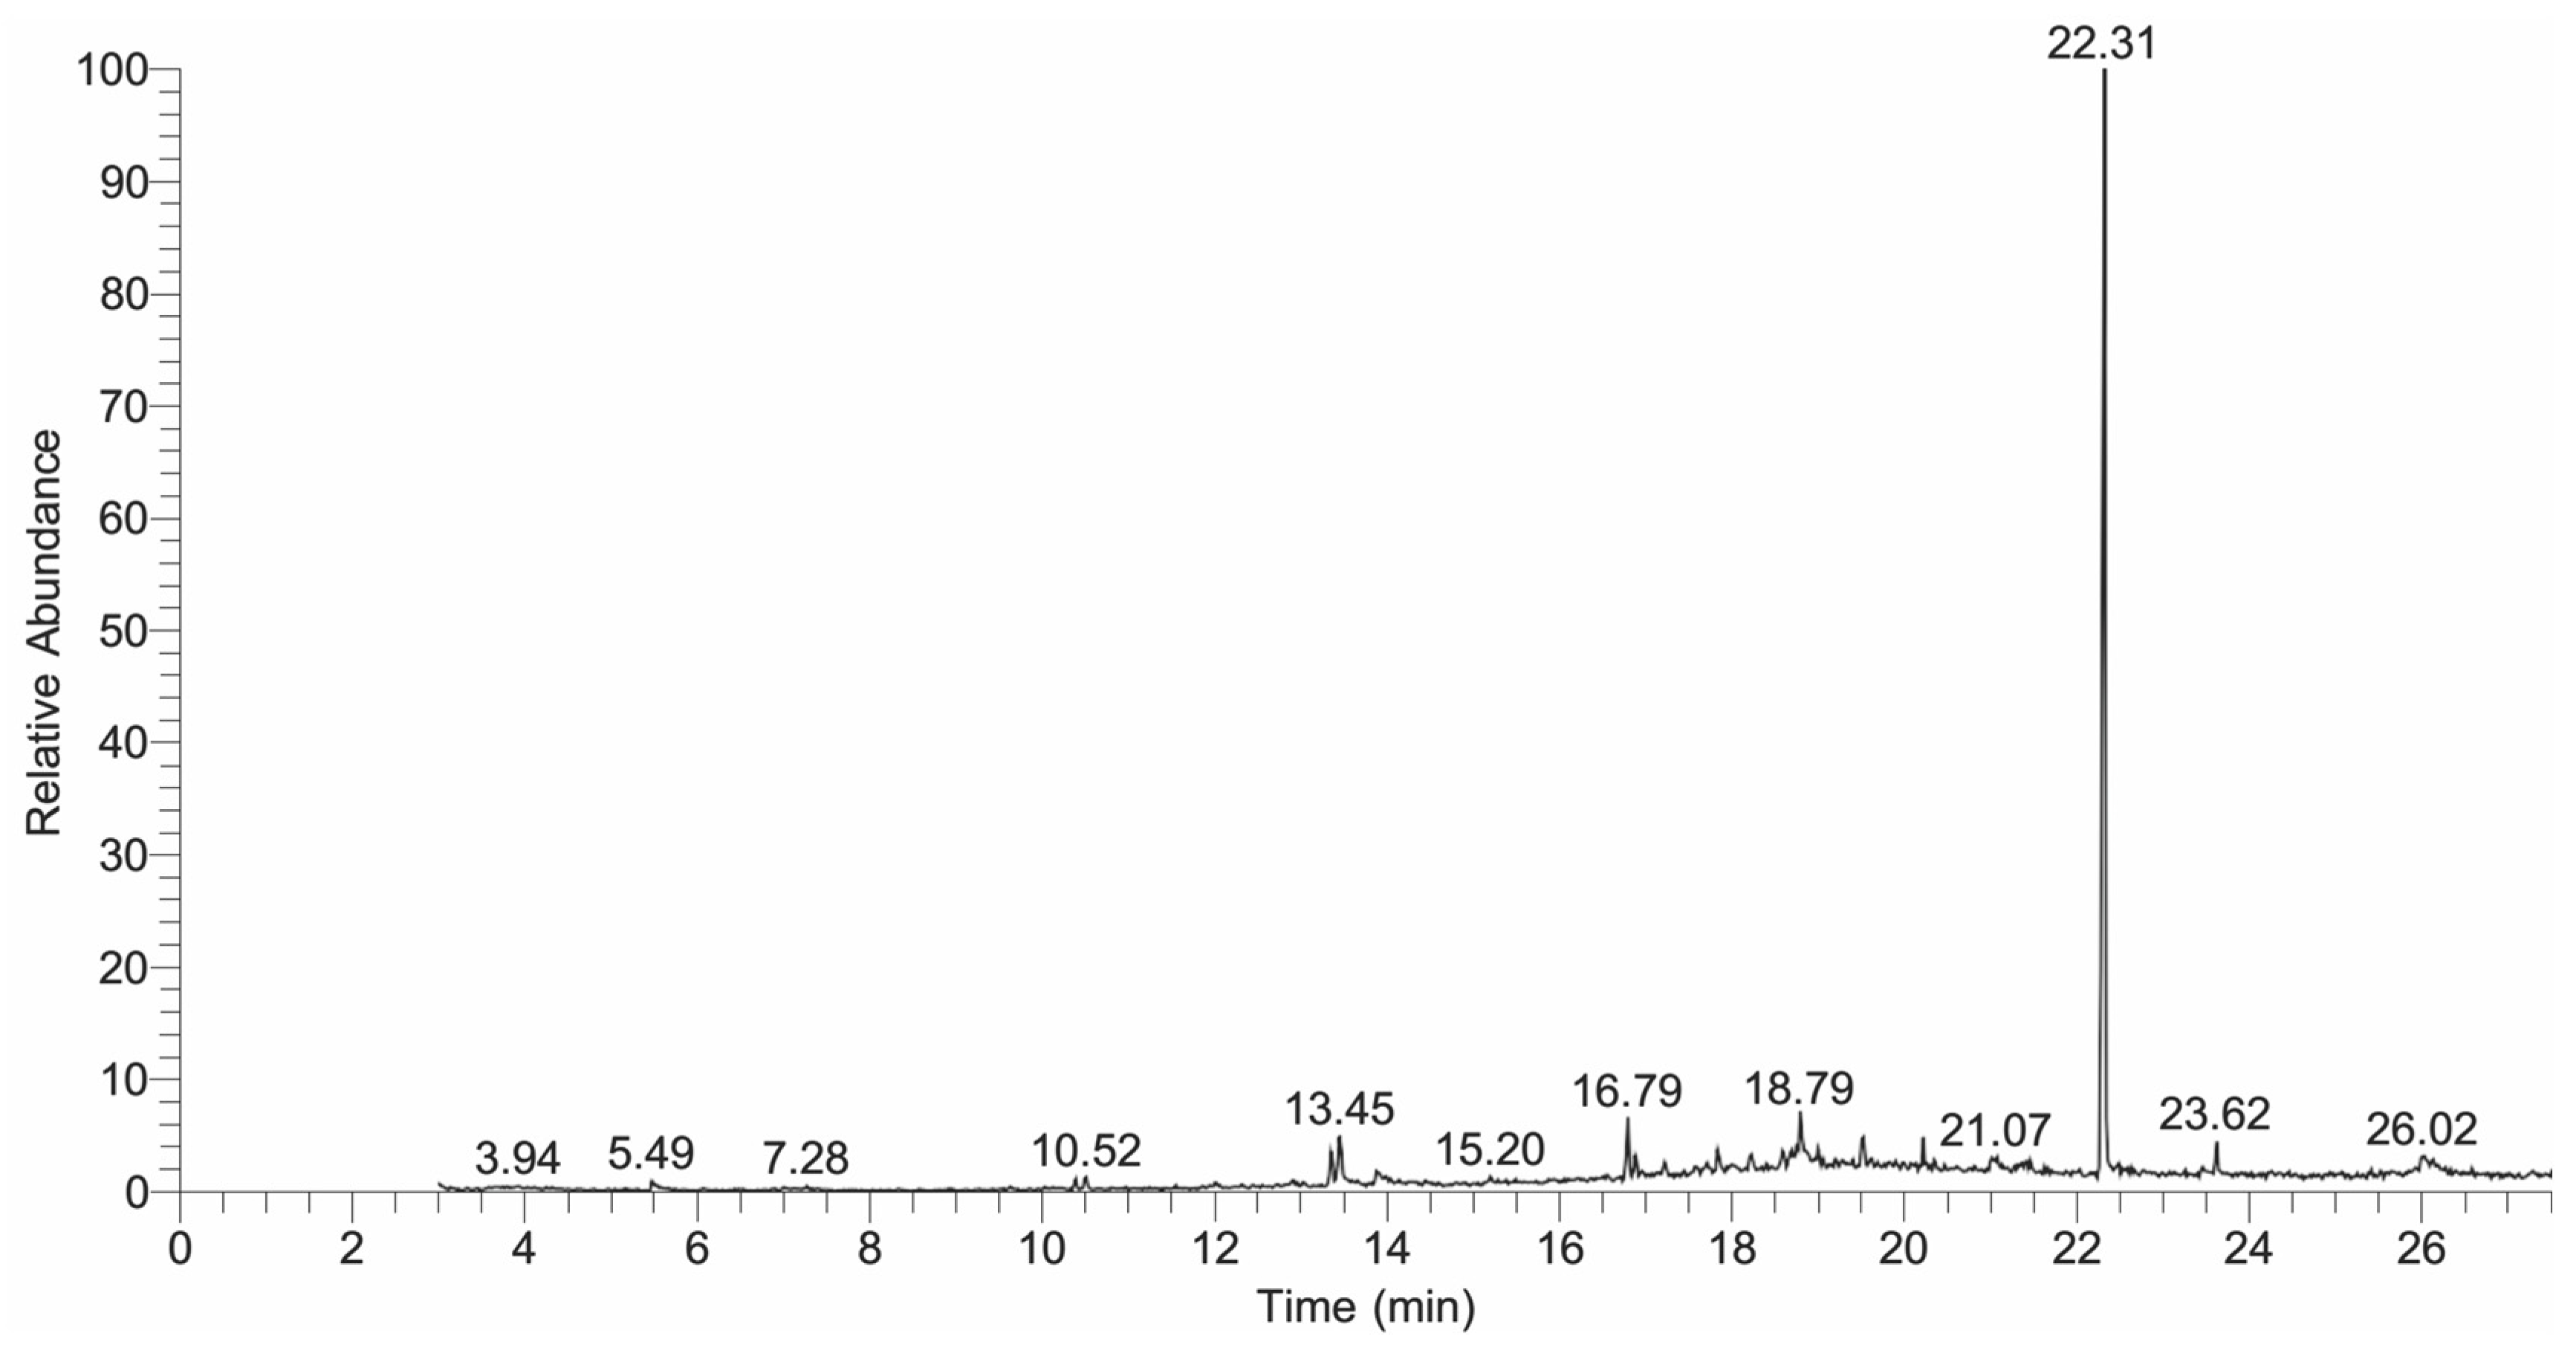
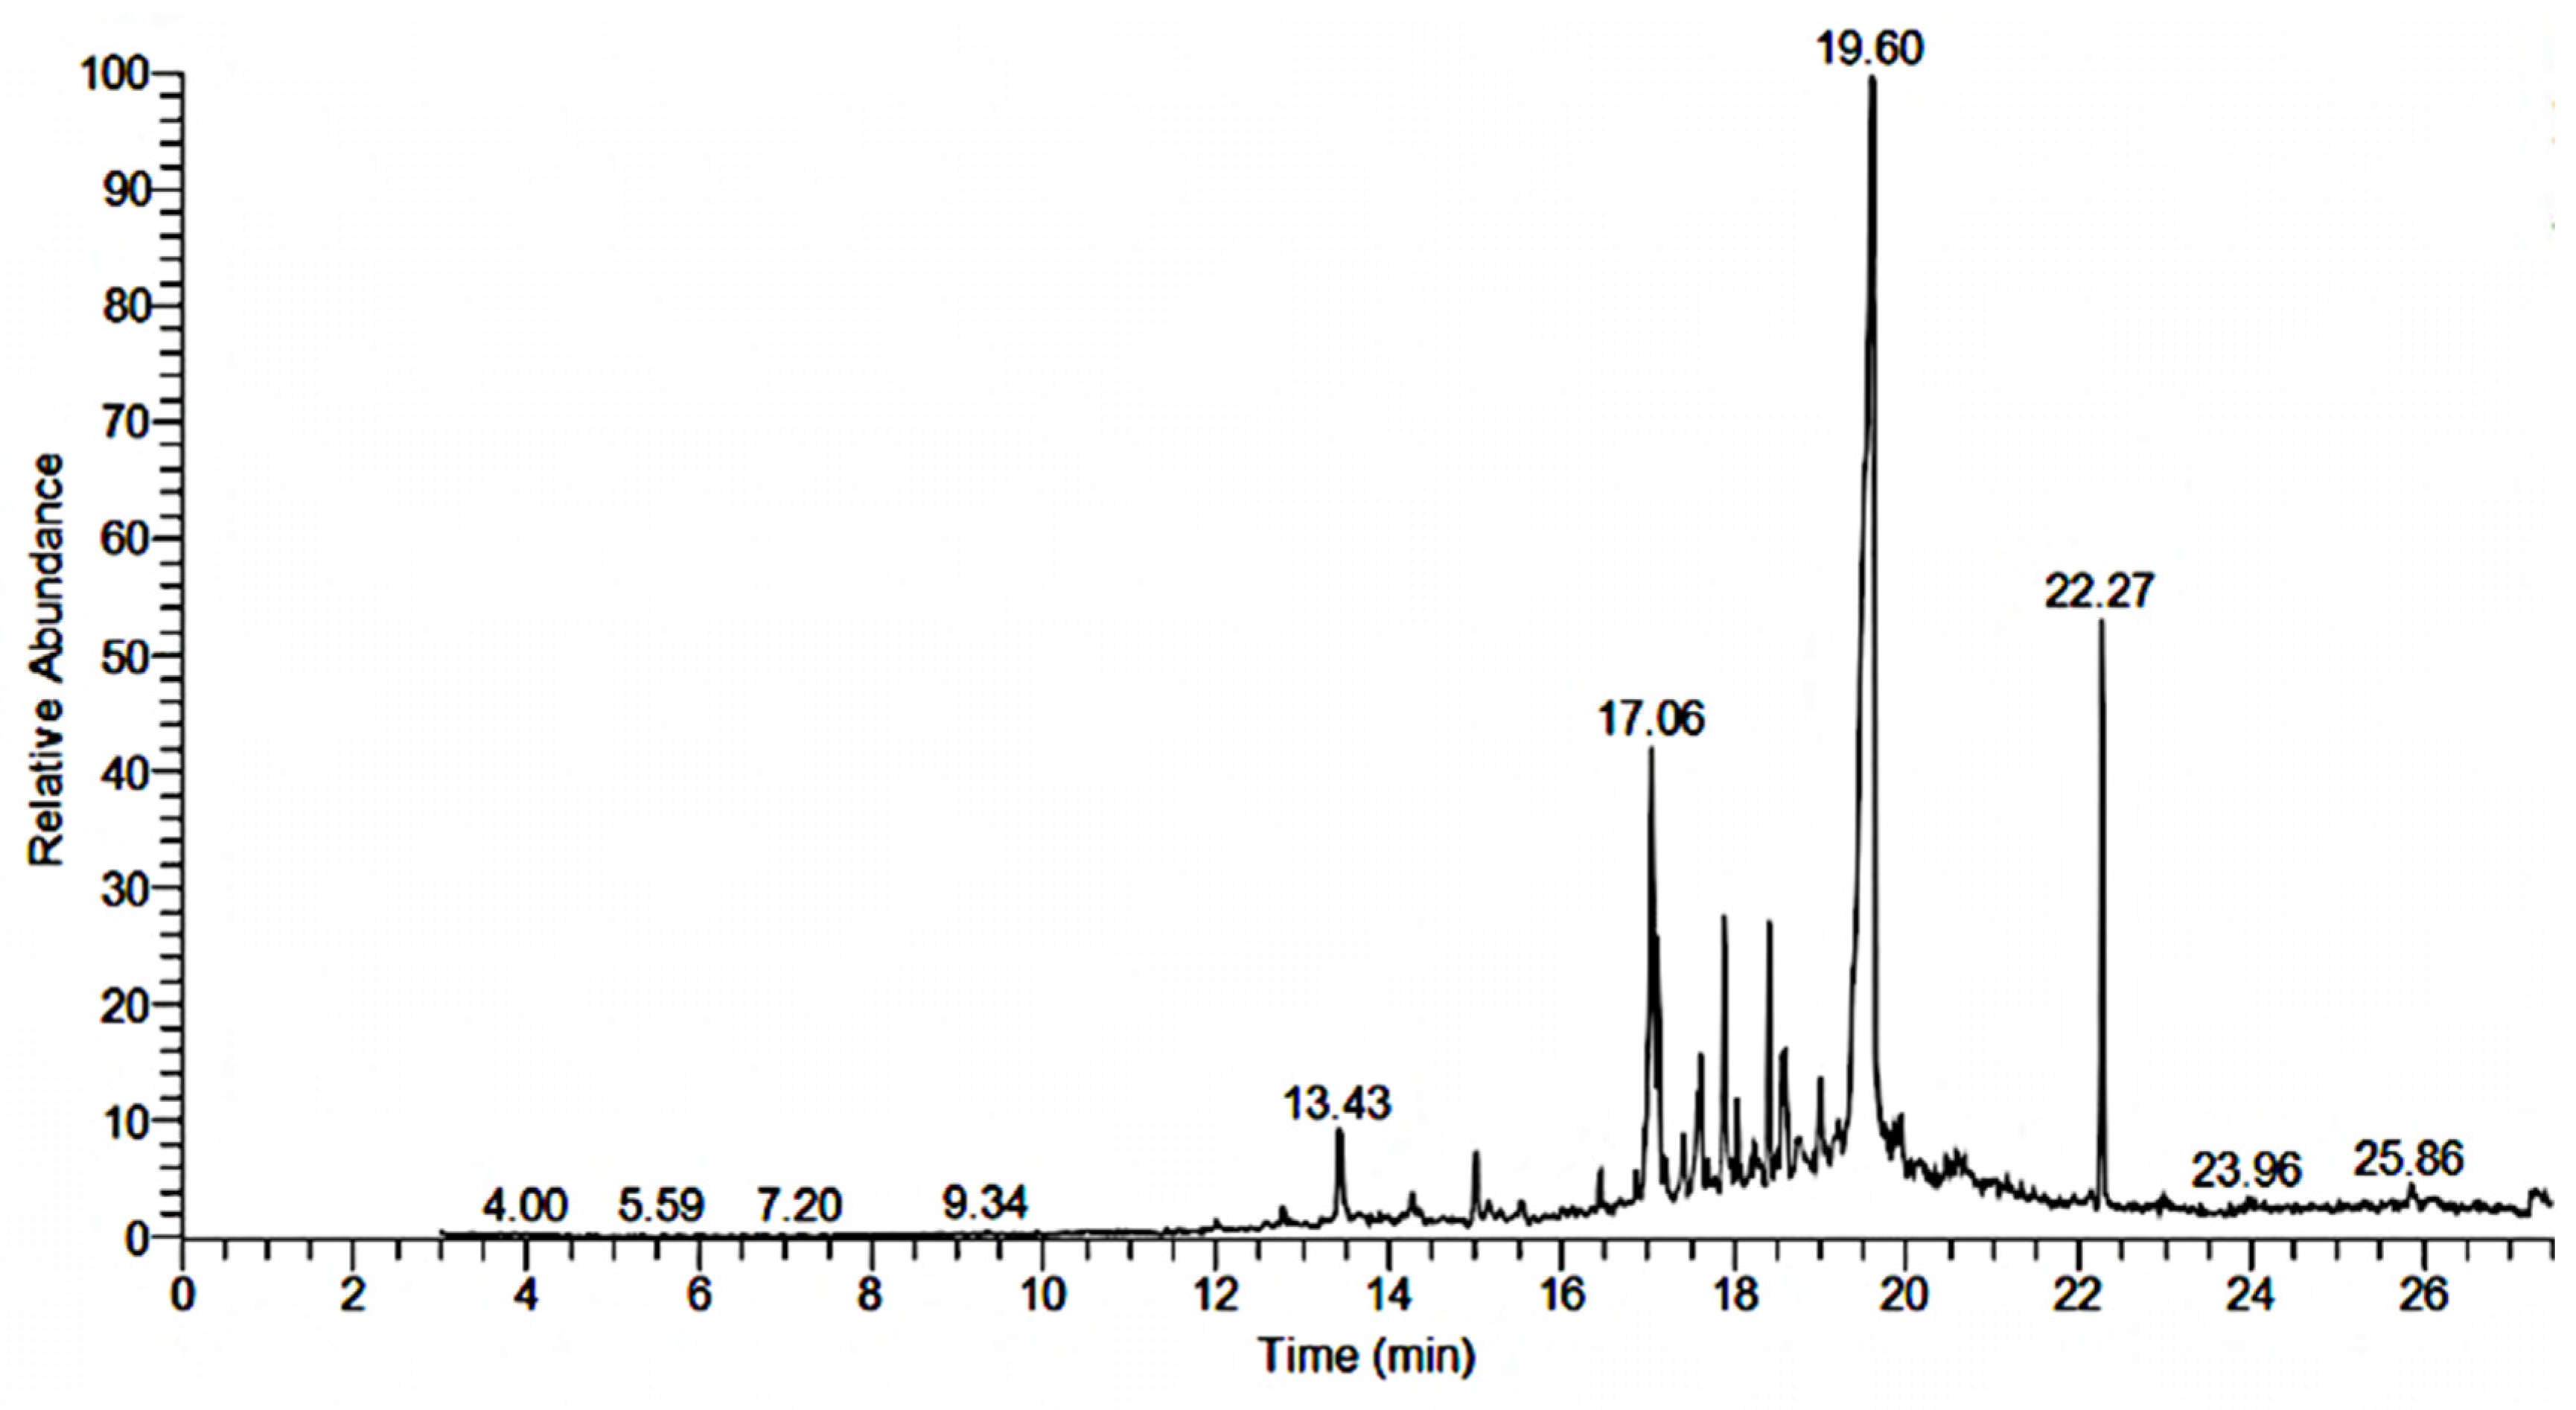
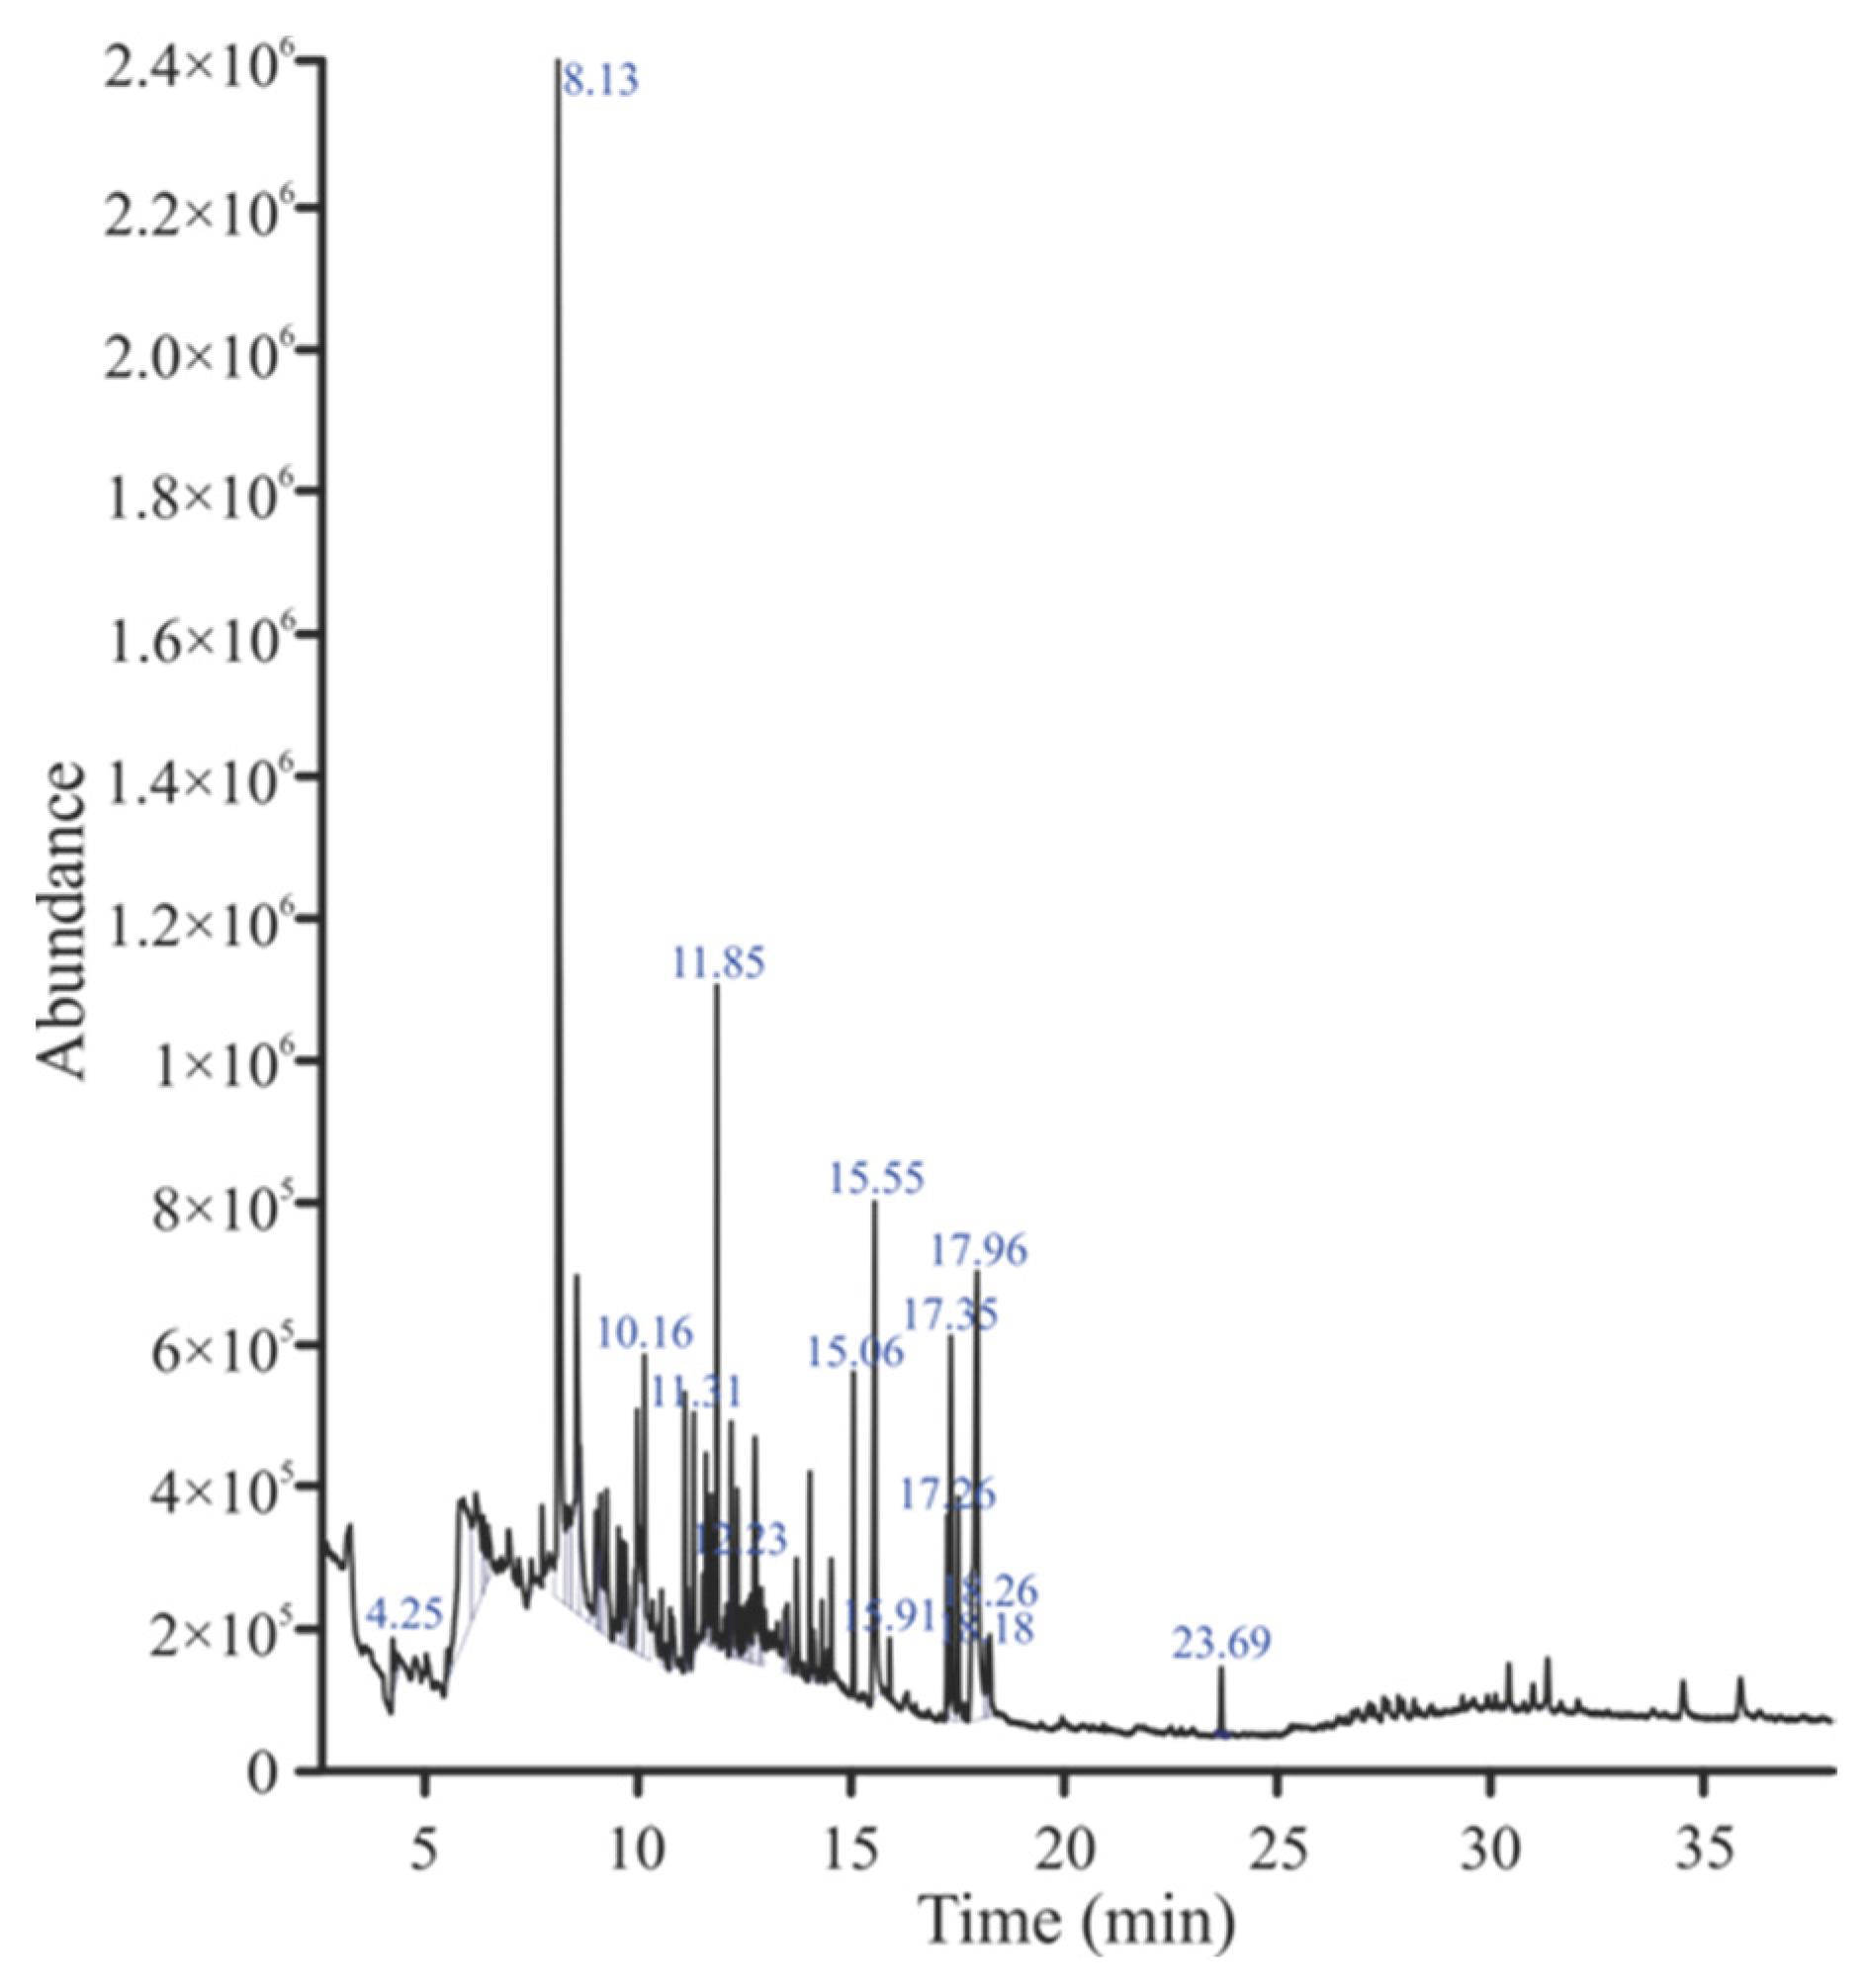
GC-MS analysis of the n-butanol, ethyl acetate, and n-hexane fractions were performed and their chromatograms are shown in Figure 7, Figure 8 and Figure 9, respectively. A total of 30 compounds were detected in the n-butanol fraction while 25 compounds were found in the ethyl acetate fraction (Table 7 and Table 8). Six compounds were common among the n-butanol and ethyl acetate fractions including dodecane, 5,8-diethyl-17-pentatriacontene, 1,2-benzenedicarboxylic acid, mono(2-ethylhexyl) ester, 1,2-benzenedicarboxylic acid, diisooctyl ester, 24,25-dihydroxycholecalciferol, and 9,12,15-octadecatrienoic acid, 2,3-bis[(trimethylsilyl)oxy]propyl ester, (Z,Z,Z)-. The total number of compounds detected in the n-hexane fraction was 62, out of which 14 compounds had a qual factor more than 80 (Table 9). One compound 10,13-octadecadiynoic acid, methyl ester was found to be common among the n-butanol and n-hexane fractions. Similarly, the ethyl acetate and n-hexane fractions also contained isoaromadendrene epoxide as a common compound.

2.6. Acute Toxicity and Cytotoxicity

Oral acute toxicity was performed on mice and no mortality was observed. Furthermore, no sign of any toxicity like behavioral changes and any apparent injury or deformity was seen in animals throughout the study. Therefore, the extract was found to be safe up to a dose of 2000 mg/kg. The MTT cytotoxicity assay, carried out in mouse fibroblast cells, showed that B. indica is safe and did not cause any toxicity.

2.7. Antimicrobial Activity

2.7.1. Disc Diffusion Method

The antimicrobial assay of the crude extract and its n-hexane, dichloromethane, ethyl acetate, n-butanol, and aqueous fractions showed good antibacterial activity against Gram-positive and Gram-negative bacteria. The zone of inhibition at 10, 30, and 100 mg/mL of all fractions was measured (Table 10). Results were dose dependent and the largest zone of inhibition (27 mm) was seen in the ethyl acetate fraction against E. coli. The aqueous extract was more effective at a lower dose than a higher dose; no growth inhibition of B. subtilis was seen at 100 mg/mL. The effects were comparable to the standard drug ceftriaxone (1 mg/mL); the fractions were more effective against E. coli, and the least effective against P. aeruginosa.

2.7.2. Minimum Inhibitory Concentration

The MIC was also observed and the results indicated that the ethyl acetate fraction had the lowest minimum inhibitory concentration against all of the tested bacterial strains ranging from 1.95 to 31.25 mg/mL. The MIC was the lowest (1.95 mg/mL) against B. subtilis and highest (31.25 mg/mL) against S. typhi. The n-butanol fraction showed overall promising results, with the MIC ranging from 3.91 to 7.81 mg/mL. The n-hexane fraction was found to be the least effective (MIC > 100 mg/mL) against the tested strains, with zero response against E. coli (Table 11).

2.8. Molecular Docking

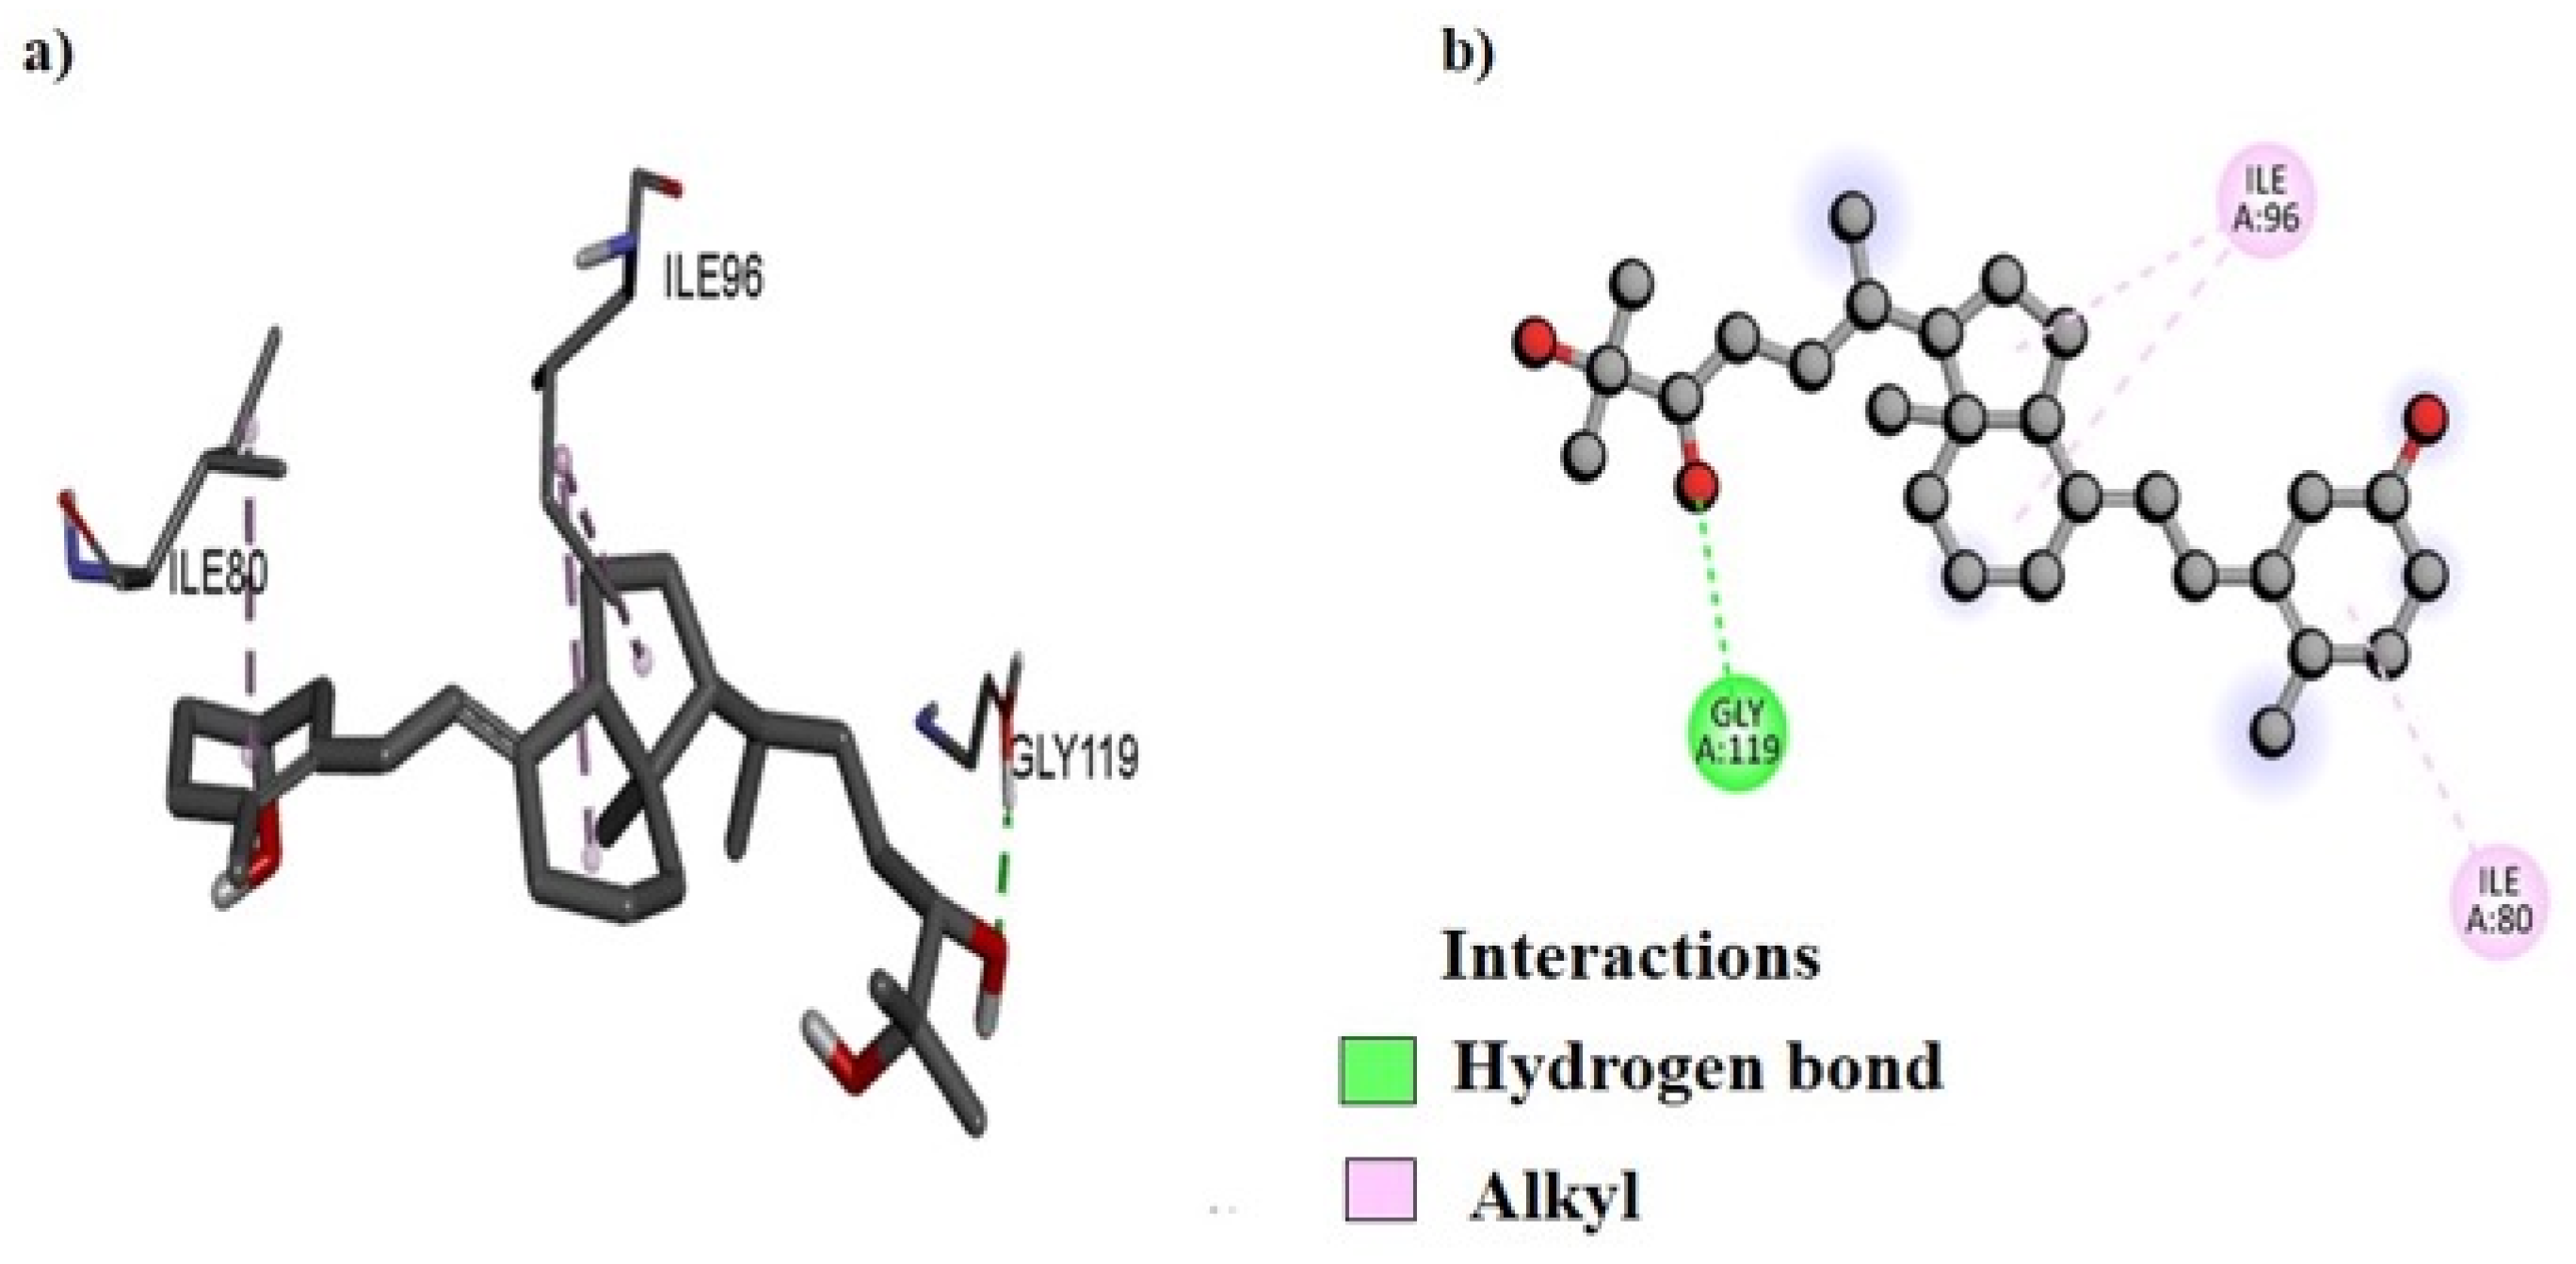
DNA gyrase was chosen as the molecular docking target for the B. indica extracts for several reasons. Firstly, DNA gyrase plays a crucial role in bacterial DNA replication and transcription, making it a potential target for antibacterial agents. Secondly, it is a well-validated target for existing antibacterial drugs, enhancing the likelihood of finding effective compounds in the extracts. Additionally, numerous studies have shown that plant-derived compounds can inhibit DNA gyrase [20], suggesting that B. indica may contain phytochemicals that target the DNA gyrase. Additionally, targeting DNA gyrase also offers the advantage of broad-spectrum antibacterial activity and can potentially complement other antibacterial mechanisms, leading to synergistic effects. These factors collectively justify the focus on DNA gyrase in identifying antibacterial compounds in B. indica [21]. Our analysis revealed that several amino acids were involved in forming both bonding and non-bonding interactions with the ligand. The docking protocol was validated by first separating the co-crystal ligand from the active pocket of the complex, and then re-docking was performed to validate its accuracy. The co-crystal ligand docking score and figures are given in the Supplementary Materials (Table S1; Figures S1–S9). The molecular docking scores of selected compounds of different fractions show that the best docked compound, NB23, from the n-butanol fraction bound with a −8.4 kcal/mol binding energy (Table 12). The 2D and 3D binding interactions between NB23 and the active pocket of DNA gyrase subunit B of P. aeruginosa were also visualized (Figure 10). Amino acid residue GLY119 interacts via forming conventional hydrogen bonds while lLE96 and ILE80 interact by alkyl linkage. Similarly, the best docked compound, EA19, from the ethyl acetate fraction bound with a −9.4 kcal/mol energy within the active pocket of DNA gyrase subunit B of S. typhi and its 2D and 3D binding interactions are presented in Figure 11. The docking analysis shows that amino acid residue GLN837 was found to have conventional hydrogen bond interactions with EA19 while ARG580 and ARG838 formed pi-cation, and the VAL787 and ILE736 amino acid residues interacted with EA19 by pi-sigma and pi-alkyl linkages (Figure 11). The binding interactions of NH4 with the active site of DNA gyrase from P. aeruginosa, both in two-dimensional (2D) and three-dimensional (3D) visuals are also presented in Figure 12. The amino acid GLY79 in the DNA gyrase established conventional hydrogen bonds with NH4. Furthermore, three other amino acids, ILE96, ILE80, and PRO81, formed alkyl interactions with NH4.

3. Discussion

The standardization of medicinal plants is of great importance as it plays a legitimate role in understanding its botanical value, chemical structure, and clinical suitability; moreover, it may be helpful in finding morphologically similar and adulterated species [7,22]. The World Health Organization has laid down many standardization parameters that ensure the safety, efficacy, and quality of crude drugs [23]. The first and quickest method of drug identification and adulteration or purity is macroscopic evaluation. Macroscopic evaluation of the plant showed that it has green colored lanceolate leaves, a hairy stem, fibrous texture, and other characteristic parameters (Figure 1). These results allow for the easy identification of B. indica when harvesting from its natural habitat and preventing unintentional adulteration. These organoleptic characters are consistent with the previously reported description of the B. indica plant [24,25]. Microscopic evaluation parameters have an important role in the identification and validation of the plant. Anatomical histology and powder microscopy act as excellent tools for the authentication, adulteration, or purity of crude drugs [26]. Anatomical structures observed in the present microscopic study of the leaf, stem, and powder provide necessary information about the morphological characteristics of B. indica, which can aid in the identification and authentication of the plant material [27]. Similar structures have also been reported in other plants of the same genus [28,29]. Stomata observed in the epidermis prevent a cellular imbalance in plants; this adaptive strategy helps the plant to survive in drought conditions. Trichomes maintain still air on the leaves and are involved in secretory functions [30]. Scanning electron microscopy (SEM) was used to measure and describe the surface morphology of the plant material. Such morphological characteristics are important parameters in the identification of the sample [31]. Xylem observed in the SEM images had a narrow opening, which allows for the capillary movement of water and decreases its loss; the phloem ensures the storage of food. Therefore, the water conservation and food storage ability of different parts of plants help the plant survive in drought conditions. Similar anatomical features have also been observed in other plants growing in drought conditions [30,32,33] Moreover, these observations provide information about the physical characteristics of the plant that may affect its solubility [28]. Extraction with different solvents showed the maximum yield in the aqueous solution. These results indicate that the plant material contains more polar compound (i.e., alkaloids, flavonoids, phenolics, saponins, and polysaccharides). It is reported that polar compounds often exhibit different biological activities such as antioxidant, anti-inflammatory, antimicrobial, and anticancer activities. A high aqueous extractive value indicates the presence of polar compounds, which imparts medicinal importance to plants [15,34]. Swelling of the plant material, when soaked in a solvent, indicates the presence of mucilage found in the crude drug. The swelling index of the powder observed in the current study was in line with previously reported studies performed on the other halophytic plant Salsola kali. Mucilages are mainly polysaccharides, and the swelling index properties are specific to their pharmaceutical utility [28]. The nutrients present in plants are vital for health and growth promotion as well as preventing many diseases. [35]. The nutritional analysis of B. indica showed the presence of fibers in a high amount, followed by carbohydrates and proteins, just like other nutritional plants [26,36]. The high ash value depicts a good amount of minerals in plants [8]. Minerals are very important for living organisms to maintain their physiological and biochemical functions. Plants are considered a good source of minerals but may also contain toxic heavy metals that may lead to dangerous consequences to human health when ingested [26,37]. The B. indica extract contained a significant amount of important minerals such as calcium, iron, and magnesium. These results were in line with other reported studies [38]. Heavy metals like lead, copper, chromium, and cadmium quantified in the extract did not exceed the safety threshold prescribed by the WHO [39]. Forage, having a considerable amount of elements and nutrients, improve the growth, reproduction, and performance of animals [24,40]. It is reported that B. indica is used as forage, which increases the performance, growth, and milk yield of cattle [24,41].
Crude drugs may also be assessed qualitatively by their fluorescence pattern [42]. The fluorescence analysis of the extract showed different fluorescent colors when treated with different organic and inorganic solvents and observed under daylight and UV light. Different fluorescent colors indicated the presence of multiple compounds in the plant, as claimed in previously reported studies [43]. Phytochemical analysis of the crude extract showed the presence of important secondary metabolites such as phenolics, flavonoids, tannins, and saponins, which were further quantified. The results of the current study were similar to the reported phytochemical profile of other plants of the genus Bassia like B. scoporia, and B. muricata, etc. [10,17,44]. The presence of phenols and flavonoids makes B. indica a plant of therapeutic potential. It is a well-documented fact that polyphenols are involved in various human health benefits and strongly linked with antioxidant, antimicrobial, anti-inflammatory, cardioprotective, and anticancer activities [45,46]. In a previous study, phenolic compounds exhibited significant antimicrobial activity [47], so the antimicrobial effects of B. indica observed in the current study may be attributed to phenols. Tannins are also polyphenols, which precipitate the proteins and form complexes with enzymes, thereby inhibiting their activity. Tannins are known for their antimicrobial activities and are used in wound healing and anti-inflammatory activities [48]. Saponins are glycosides and have many therapeutic activities including diuretic, ant-inflammatory, antimicrobial, cardioprotective, and many other biological activities [49]. The functional groups observed in the FTIR analysis of B. indica further confirmed the phytochemical results, and this test can be used to control the quality and standardization of the plant material, as conducted in previously reported studies [50]. 1,2-Benzenedicarboxylic acid, diisooctyl ester, and 1,2-benzenedicarboxylic acid, mono(2-ethylhexyl) ester were the most abundant compounds observed in the GC-MS analysis of the n-butanol fraction, and their presence has also been reported in many other medicinal plants with antimicrobial, anticancer, antifungal, antioxidant and anti-inflammatory properties [51,52,53]. Squalene observed in the current study has also been found in the phytochemical screening of many other plants, is considered as a natural antioxidant, and possesses cholesterol lowering, anticancer, immune enhancing, and chemopreventive activities [54]. Other identified compounds like 24,25 dihydroxycholcalciferol, oleic acid, 3-(octadecyloxy)propyl ester, azafrin, and rhodopin have also been identified in other plants and is reported to have calcium regulation, antifungal, cardioprotective, and antineoplastic activities, respectively [55,56,57]. In the ethyl acetate fraction, 4,4-dimethyladamantan-2-ol was the most abundant compound, and is also found in the essential oil of plants with antimalarial and antioxidant activities [58,59]. Other compounds like agathic acid, gitoxigenin, betulin, and stigmasterol have previously been isolated from other plants and shown to have antileishmanial and abortifacient [60], cardioprotective [61], antioxidant, anti-inflammatory, anticancer [62] anti-osteoarthritis, anti-inflammatory, and antibacterial [63] properties, respectively. Similarly, 5-methylfurfural, 2-methoxy-4-vinylphenol, Ar-turmerone, and hexadecanoic acid, methyl esters found in the n-hexane fraction have also been found in different plant extracts and reported to have acaricidal, anti-inflammatory, anticancer [64], anti-inflammatory, anti-nociceptive, anti-proliferative [65], and antibacterial activities [66], respectively. An oral acute toxicity study performed in mice and the MTT cytotoxicity assay carried out in mouse fibroblast cells showed that B. indica is safe and did not cause any toxicity.
The B. indica crude extract and all fractions showed good antibacterial effects against Gram-positive and Gram-negative strains. It was observed that the ethyl acetate fraction was more effective against bacterial strains, followed by the n-butanol fraction. The most abundant compound of the n-butanol fraction 1,2-benzenedicarboxylic acid, diisooctyl ester was previously isolated from the root of Plumbago zeylanica Linn and tested against different bacterial strains, which showed good antibacterial results [53,67]. Therefore, the present antibacterial results of the n-butanol fraction may be due to the presence of a large amount of the 1,2-benzenedicarboxylic acid, diisooctyl ester compound. Similarly, hexadecanoic acid, methyl ester, identified in the n-hexane fraction, was also isolated from clove, which showed antibacterial effects [66]. Furthermore, in the current study, it was observed that the B. indica extract had a considerable amount of polyphenols and tannins, and the observed antibacterial effects may also be attributed to these secondary metabolites [48]. Moreover, to provide a theoretical rectification to the antibacterial investigations, the major compounds of different fractions identified in the GC-MS analysis were subjected to in silico computational analysis against the DNA gyrase subunit B of various bacteria. Computational studies like molecular docking help to predict the least good binding energy and high affinity as well as a better framework between protein and ligand interactions [68]. The amino acid residues interact with the DNA gyrase through hydrogen bonds, pi-cation, pi-sigma, pi-alkyl, and alkyl interactions, which play an important role in the overall stability and specificity of the binding between the two molecules [69].

4. Materials and Methods

4.1. Plant Collection

Aerial parts (Stem, branches and leaves) of Bassia indica (Wight) A.J. Scott were collected in bulk (10 kg) from the district pf Muzaffargarh (Punjab) in Pakistan [31°10′5″ N 70°50′25″ E] in June 2021, early morning before flowering, and were identified by a botanist, Dr. Ghulam Sarwar, Department of Botany, The Islamia University of Bahawalpur. The specimen was stored and voucher no. 324/Botany was issued. Plant material was cleaned, shade dried, and crushed into a coarse powder. A small amount of powder was stored in closed amber glass bottles for microscopic analysis.

4.2. Extract Preparation and Fractionation

Plant extraction was performed as described previously with minor modifications [70]. Briefly, the powdered plant material (3 kg) was soaked into an aqueous methanol (30:70) solvent for 7 days with daily stirring and shaking. The soaked material was filtered and evaporated under reduced pressure and temperature until a thick semisolid crude extract was obtained. Then, 150 g of the extract was used for fractionation, and the remaining portion was stored in a freezer at −20 °C for further use. The compounds present in the extract were then separated depending upon their polarity by the separation funnel method [71]. Solvents of different polarities were selected for this purpose, and 150 g of extract was dissolved in 250 mL of distilled water and extracted successively with an equal volume of different organic solvents (i.e., n-hexane, dichloromethane, ethyl acetate, and n-butanol, respectively). All of the solvent fractions were then evaporated under reduced pressure (150 mbr) and temperature (40 °C) to obtain thick extracts. The percentage yield of the crude extract and fractions was calculated, and the extracts were stored in closed containers at −20 °C for further studies.

4.3. Experimental Animals

Albino mice of either sex weighing about 30–50 g were housed in the animal house of the Pharmacology Research Lab, Department of Pharmacology, Faculty of Pharmacy, The Islamia University of Bahawalpur. The animals were housed in polycarbonate cages with sawdust (renewed every 48 h) under standard lab conditions (temp: 25 ± 2 °C; humidity 60 ± 5%), a light and dark cycle of 12 h was maintained, and they were fed standard diet and water ad libitum. The study was carried out according to the guidelines of the Pharmacy Animal Ethics Committee (AEC file no PAEC/23/101).

4.4. Pharmacognostic Evaluation

4.4.1. Macroscopic Studies

Cleaned and shade dried samples of the B. indica plant were observed for color, shape, size, odor, taste, and texture. Similarly, the leaves and stem were powdered and observed for color, odor, and taste [72].

4.4.2. Microscopic Studies

Microscopic studies of the B. indica fresh leaves and stem were performed under a simple compound microscope. Fresh, cleaned, small-sized (5–10 mm) parts of the leaf and stem were placed into the potato block and sections were cut with a razor blade manually and dipped into water in a Petri dish. Uniform and small-sized sections (5–15 µm) were stained and observed under a camera-fitted microscope (4× and 10×) [72]. Similarly, dried powder of the aerial parts of B. indica was investigated following the previously described method with slight modifications [73]. A few particles of fine powder material were placed on cleaned glass slides and 1–2 drops of 10% chloral hydrate, 50% glycerin, and 5% iodine solution was added separately and mixed well with a needle. Glass cover slides were placed, and various structures were observed under the microscope at 10×, 50×, and 100×.

4.4.3. Scanning Electron Microscopy

The surface morphology of the powder was assessed by keeping the powder in the chamber of a scanning electron microscope. Scanning was performed at various magnifications ranging from 900 to 4500 cm−1 at 10.0, 20.0, and 100.0 μm [74].

4.4.4. Swelling Index

The swelling index was calculated by adding 2 g of plant powder in a 100 mL measuring cylinder with 50 mL of water. The cylinder was gently shaken many times, allowed to stand for 24 h, then the volume occupied by the sample was measured [75].

4.4.5. Extractive Value Determination

The plant powder (2 g) was macerated in n-hexane, ethyl acetate, dichloromethane, n-butanol, and distilled water (20 mL each) separately in air tight bottles for 7 days with intermittent shaking. The extract was filtered in pre-weighted flasks, then the filtrate was evaporated and the flasks were weighed again. The extractive value (percentage) was calculated using the following formula [72]:
E x t r a c t i v e   v a l u e % = w e i g h t   o f   e x t r a c t w e i g h t   o f   p o w d e r × 100

4.4.6. Elemental and Nutritional Analysis

The quantities of the different metals and minerals in the extract were measured with the help of an atomic absorption spectrophotometer (Hitachi Polarized Zeeman AAS, Z-8200, Tokyo, Japan) under the conditions described in the AOAC (1990). Metals assessed in the extract were calcium (Ca), chromium (Cr), copper (Cu), cadmium (Cd), iron (Fe), lead (Pb), manganese (Mn), magnesium (Mg), nickel (Ni), and zinc (Zn). Commercially available stock solution (Applichem®, Darmstadt, Germany) was used for the preparation of calibrated standards in purified de-ionized water (1000 ppm). The glass apparatus used during the procedure of experimental work was kept overnight in 8 N HNO3 and cleaned with de-ionized water many times before use [76]. Nutritional contents such as carbohydrates, fats, proteins, and fiber percentage were calculated according to the AOAC 2005 guidelines and method adopted by Zaman et al. The carbohydrate percentage and total energy was calculated by the following equations [26]:
C a r b o h y d r a t e   c o n t e n t = 100 ( % m o i s t u r e + % p r o t e i n + % c r u d e   l i p i d + c r u d e   f i b e r + % a s h )
T o t a l   c a l o r i c   v a l u e K c a l 100   g = 2.62 × p r o t e i n + 4.2 × c a r b o h y d r a t e + 8.37 × f a t

4.4.7. Fluorescence Analysis

A small quantity of the powder was soaked in different reagents as mentioned including methanol, ethyl acetate, dichloromethane, chloroform, n-butanol, n-hexane, 50% HNO3, picric acid, conc. H2SO4, 50% HCl, 1% NaOH, iodine, and 5% FeCl3. After 5 min, all mixtures were observed in visible light and under a UV lamp at 254 nm for fluorescence [5].

4.4.8. Thin Layer Chromatography

Thin layer chromatography of the plant extract and its fractions was carried out using various mobile phases of different concentrations and silica gel 60 backed aluminum TLC plates. The mobile phase was poured into a closed tank, and saturation was achieved by placing the filter paper across the walls of the tank. The sample extracts dissolved in different solvents were placed on a TLC plate with the help of a capillary tube, 1.5 cm above the base of the plate, and allowed to dry. Then, the plates were placed in a chromatographic tank until the elevation of the mobile phase to the upper mark. Then, the plates were removed, dried, and observed under a UV lamp (λ = 254 nm) to visualize the separated compound spots, and their Rf value was calculated [77].

4.5. Phytochemical Analysis

4.5.1. Qualitative Analysis

For the detection of various phytochemicals present in the crude extract, a standard procedure was followed with some modifications [70]. Briefly, Molisch’s test was used for the detection of carbohydrates, which turns a purple color in their presence. The formation of a yellow precipitate in Hager’s reagent confirmed the alkaloids. The extract was treated with FeCl3 and H2SO4 for the detection of phenol and flavonoids, respectively. A brown colored ring at the interface in the Keller–Kiliani test showed the presence of glycosides in the extract. A blackish precipitate with the ferric chloride solution and a pink color with HCl confirmed the tannins and resins in the extract, respectively. The formation of persistent froth while vigorous shaking of the extract with water exhibited the presence of saponins.

4.5.2. Quantitative Analysis of Total Phenols, Tannins, Flavonoids, and Saponins

The total phenol and tannins were estimated using the Folin–Ciocalteu method. A standard calibration curve was constructed using tannic acid solution. Different volumes (0, 20, 40, 60, 80, and 100 μL) of standard tannic acid solution (10 mg/mL) were poured into a test tube and the final volume (500 μL) was made with distilled water. Solutions were mixed with 250 µL 1 N FC reagent and 1.25 mL of 20% sodium carbonate, and the absorbance was measured (λ = 725 nm) after 40 min of incubation at room temperature. Similarly, 10, 30, and 100 μL of the extract stock solution (100 mg/mL) were diluted and mixed with FC reagent and sodium carbonate, and the absorbance was measured after incubation. The total phenols were estimated as tannic acid equivalent from the calibration curve and the results were expressed as the total phenolic milligram per gram of extract on a dry matter basis. Total tannins were determined by separating and subtracting non-tannin phenols from the total phenols. For the estimation of non-tannin phenols, 1 mL of each extract stock solution (100 mg/mL) and distilled water was mixed with 100 mg polyvinyl polypyrrolidone (PVPP), vortexed, and incubated at 4 °C for 15 min. Then, the mixture was centrifuged at 3000 rpm for 10 min, and the supernatant, containing non-tannin phenol, was collected. Next, 20, 60, and 200 µL of the supernatant were diluted and mixed with FC reagent and sodium carbonate as above-mentioned, and the absorbance was taken. Values were interpolated against the tannic acid calibration curve [78]. The tannin contents were calculated with the following equation
T a n n i n s % = % t o t a l   p h e n o l i c s ( % n o n t a n n i n   p h e n o l i c s )
For the estimation of the total flavonoid content, 50 µL of the extract sample (1 mg/mL) was mixed with 100 µL methanol in a 96-well microplate. Then, 20 µL 10% AlCl3 was added in the well and gently shaken. After 3 min of incubation, 20 µL 1 M CH3COONa was added to the well, followed by the addition of 60 µL of methanol. One well containing 150 µL methanol was used as the blank. The microplate was then further incubated for 40 min in the dark and the absorbance was measured at 430 nm using a microplate reader. A standard curve of quercetin (concentration ranging from 7.81 to 500 mg/mL, 2-fold dilution) was drawn under the same procedure. Flavonoid contents were expressed in milligram equivalent to quercetin per gram of dry extract (mg QE/g) [79].
The total saponin content present in the extract and its aqueous fraction were estimated by treating 1 g of extract with 20% acetic acid in ethanol and allowed to stand for 24 h at 50 °C. The mixture was filtered, concentrated in a water bath to one quarter of its initial volume, and then precipitated with NH4OH. Precipitates were separated by filtration, and the saponin content was calculated with the following equation [80].
S a p o n i n   c o n t e n t = W 2 W 1 S a m p l e   w e i g h t × 100
where W2 is the weight of the filter paper + residue and W1 is the weight of the empty filter paper.

4.6. FTIR Spectroscopy

Extracts can also be standardized by identifying different functional groups through FTIR analysis. The FTIR analysis of the extract was carried out at room temperature using a Bruker FTIR (Tensor 27 series, Ettlingen, Germany) scanning over the frequency range of 4000–650 cm−1 at a resolution of 4 cm−1. Attenuated total reflectance (ATR) technology along with OPUS data collection software (version 7.8) was used to collect the spectra. A sample of the extract was kept on the pike miracle ATR cell with a zinc selenide crystal surface, followed by rotation of the assembly, thus forming a compact mass. Finally, the spectrum was scanned and recorded [81].

4.7. GC-MS Analysis

GC-MS analysis of the n-butanol, ethyl acetate, and n-hexane fractions of the B. indica extract was performed by following the previously described method [82]. The samples were analyzed using a Thermo Scientific (DSQI) GC (Waltham, MA, USA) attached to the NIST11.L library. The gas was equipped with a TR-5MS capillary column with a length of 30 M, film thickness of 0.25 µm, and an internal diameter of 0.25 mm. Helium was used as the carrier gas with a 1 mL/min real flow rate. The GC-MS spectral lines were detected by the ionization energy method with an ionization energy of 70 electron volt and a 0.2 s scan time with a ranging fragment from 40 to 600 m/z. The injector was operated in split mode with a temperature of 250 °C. The 1 µL sample volume was injected with an initial oven temperature of 50 °C and held for 2 min, then increased to 150 °C with the temperature rate of 8 °C/min, and further increased to 300 °C with the temperature rate of 15 °C/min and held for 5 min. Retention time per minute, peak area, peak height, and spectral line patterns were used to identify the components present in the sample plant materials when compared with spectral lines from the database of authenticated compounds stored in the National Institute of Standards and Technology (NIST) library.

4.8. Cytotoxicity Study

Cytotoxic effects were assessed by the standard MTT (3-[4,5-dimethylthiazole-2-yl]-2,5-diphenyl-tetrazolium bromide) colorimetric assay on mouse fibroblast 3T3 cells. Cytotoxic effects were measured as concentration causing 50% cell growth inhibition (IC50) [83]. Percent inhibition was calculated by using the following formula:
% i n h i b i t i o n = 100 m e a n   o f   O . D   o f   t e s t   c o m p o u n d m e a n   o f   O . D   o f   n e g a t i v e   c o n t r o l m e a n   o f   O . D   o f   p o s i t i v e   c o n t r o l m e a n   o f   O . D   o f   n e g a t i v e   c o n t r o l × 100

4.9. Acute Toxicity Study

The acute toxicity study was performed on mice with a weight of 28 ± 4 g according to OECD guidelines test no. 425 [84]. A limit test was used for the toxicity study. Animals were housed under standard conditions and fed according to the mentioned guidelines. Initially, 2000 mg/kg of the extract was administered to a single mouse and the animal was closely monitored for the first 30 min, then for 4 h, and 24 h. After the survival of the first mouse, four additional mice were treated with the same dose and monitored accordingly. After that, the monitoring of all five mice was continued for 14 days, during which any signs of toxicity and altered behavior were observed.

4.10. Antibacterial Activity

The antibacterial activity of the B. indica crude extract, its n-hexane, dichloromethane, ethyl acetate, n-butanol, and aqueous fractions, and positive control (ceftriaxone) was assessed against Gram-positive bacteria (i.e., Bacillus subtilis (ATCC 6633), Staphylococcus aureus (ATCC 6538)) and Gram-negative bacteria including Escherichia coli (ATCC 10536), Salmonella typhi (ATCC 19430), and Pseudomonas aeruginosa (ATCC 9027), as described previously with minor modifications [85]. Ceftriaxone was used as a standard due to its broad spectrum antibacterial activity against both Gram-positive and Gram-negative bacteria. All of the apparatus and solutions used were sterilized, and the experiment was carried out in triplicate. Antibacterial potential was measured by the following methods.

4.10.1. Zone of Inhibition by Disc Diffusion Method

Solutions of different concentrations (10, 30, and 100 mg/mL) of the B. indica crude extract and its n-hexane, dichloromethane, ethyl acetate, n-butanol, and aqueous fractions were prepared to assess the zone of inhibition. Discs of 5 mm were cut from filter paper and soaked in different concentrations of extracts or solvent (control) and dried at room temperature. Bacterial cultures of all bacterial strains were prepared in nutrient broth, incubated for 24 h at 37 °C, and diluted with a normal saline concentration equivalent to the 0.5 McFarland standard. Muller–Hinton agar was dissolved in distilled water, heated, and sterilized by autoclaving. Sterilized agar was poured into a Petri dish, marked into four equal parts, in a laminar airflow hood near a flame burner and was allowed to solidify. Bacterial culture (100 µL) of different strains was spread over agar, and discs soaked in different concentrations of the extract and positive control ceftriaxone (1 mg/mL) were placed. Petri dishes were incubated for 24 h at 37 °C and the zone of inhibition was measured.

4.10.2. Minimum Inhibitory Concentration

The MIC of the extracts was measured using the 2-fold broth micro-dilution method in nutrient broth. Sterile 96-well plates were used for testing and dilutions ranging from 250 to 0.488 mg/mL were prepared by adding 100 µL of the extract concentration and 100 µL of nutrient broth. Negative control wells contained only 100 µL of nutrient broth. Stock solutions of the B. indica fractions were prepared in 10% DMSO. The effect of DMSO was ruled out by keeping one lane for the solvent without any extract. Similar dilutions of the standard drug ceftriaxone (dissolved in sterile distilled water) were prepared. Fresh bacterial inoculum, prepared from 24 h old culture, was standardized with 0.5 McFarland and 5 µL was added in each well. After 24 h of incubation at 37 °C, the clarity of the wells was observed to assess the MICs and the concentration of the wells was noted until no bacterial growth was seen [86].

4.11. Molecular Docking

Molecular docking was performed by AutoDock Vina (version 4.2) software to analyze the binding interactions of different compounds, obtained from GC-MS data, within the active pockets of the DNA gyrases of the targeted bacteria. The study was carried out using the 3D crystal structure of the DNA gyrase subunit B of various bacteria, retrieved from the Protein Data Bank (www.rcsb.com) with PDB ID: 4DDQ for B. subtilis, 1KZN for E. coli, 7PTF for P. aeruginosa, 6FM4 for S. aureus, and 5ZTJ for S. typhi [87]. Before the docking analysis, the targeted DNA gyrase structure was prepared by using MGL tools, where the heteroatoms and water molecules were removed, afterward, polar hydrogen and Kollman charges were added and the structure was rendered for missing amino acid residues [88]. The energy minimized 3D structures of all compounds were drawn using ChemDraw (Ultra 12.0) 3D [89]. The docking protocol was validated by first separating the co-crystal ligand from the active pocket of the complex, and then re-docking was performed to validate its accuracy [90]. The force field MMFF94x with an RMSD gradient of >0.01 kcal·mol−1Å−1 was used to minimize the energy of the selected compounds [91]. All compounds were docked within the active pocket of the DNA gyrase subunit B using AutoDock’s default genetic algorithm as the scoring function. The dimensions of the grid box were set as (x; −41.857501 y; −12.318299; z; −8.245484 for 4DDQ, x; 19.537493, y; 19.165566, z; 43.283299 for 1KZN, x; −2.468462 y; −2.933290 z; 38.392610 for 7PTF, x; −42.133240 y; −3.919944 z; 22.992590 for 6FM4 and x; 26.379112, y; 22.904972, z; 22.022154 for 5ZTJ). About 100 different configurations of the docking complexes were generated for the compounds with the active pocket of DNA gyrase subunit B. Finally, the most stable configuration possessing high affinity was selected for the further analysis and development of 2D and 3D models to understand the binding interactions of the compound within the active site of proteins [92]. For a more comprehensive understanding of the binding affinity, we also calculated and presented the binding energies of various other compounds. These binding energies can provide insights into the strength and stability of the binding interactions between these compounds and the DNA gyrase. Moreover, the results were compared with the docking of the positive control and the procedure was validated via the re-docking procedure.

4.12. Statistical Analysis

The results were calculated by linear regression using GraphPad Prism 6 and the results were presented as the mean ± SEM.

5. Conclusions

Our work has set forth pharmacognostic standards for the correct identification and authentication required for the quality control of Bassia indica (Wight) A.J. Scott. The results showed that the plant is rich in minerals and nutrients. Chemical characterization of the extract showed the presence of important bioactive phytochemicals like carbohydrates, glycosides, phenols, saponins, and sterols. GC-MS analysis identified several phytochemicals of pharmacological importance. B. indica showed good antibacterial activity against both Gram-positive and Gram-negative bacteria. Molecular docking studies described several phytochemicals with good binding interaction with DNA gyrase, which may suggest its antibacterial mechanism.

Supplementary Materials

The following supporting information can be downloaded at: https://www.mdpi.com/article/10.3390/plants13131753/s1, Figure S1. The predicted 3D(A) and 2D(B) binding mode of the co-crystal ligand against the DNA gyrase subunit B of B. subtilis; Figure S2. The predicted 3D(A) and 2D(B) binding mode of ceftriaxone against the DNA gyrase subunit B of B. subtilis; Figure S3. The predicted 3D(A) and 2D(B) binding mode of the co-crystal ligand against the DNA gyrase subunit B of E. coli; Figure S4. The predicted 3D(A) and 2D(B) binding mode of ceftriaxone against the DNA gyrase subunit B of E. coli; Figure S5. The predicted 3D(A) and 2D(B) binding mode of the co-crystal ligand against the DNA gyrase subunit B of P. aeruginosa; Figure S6. The predicted 3D(A) and 2D(B) binding mode of ceftriaxone against the DNA gyrase subunit B of P. aeruginosa; Figure S7. The predicted 3D(A) and 2D(B) binding mode of the co-crystal ligand against the DNA gyrase subunit B of S. aureus; Figure S8. The predicted 3D(A) and 2D(B) binding mode of ceftriaxone against the DNA gyrase subunit B of S. aureus; Figure S9. The predicted 3D(A) and 2D(B) binding mode of ceftriaxone against the DNA gyrase subunit B of S. typhi; Table S1. Molecular docking scores of the co-crystal ligands with the targeted proteins.

Author Contributions

F.A., M.A.W., J.H.S., S.A.E., H.M.A., G.S. and Z.H.K.: Methodology, Software, Investigation, Formal analysis, and Data curation. Q.J., M.Y.K. and S.M.I.: Supervision, Conceptualization, and Writing (original draft). S.T., A.R., B.M. and M.A.: Writing (review and editing) and Visualization. All authors have read and agreed to the published version of the manuscript.

Funding

This research received no external funding.

Data Availability Statement

Data can be provided upon reasonable request.

Acknowledgments

Open Access Funding by the University of Vienna

Conflicts of Interest

The authors declare no conflicts of interest.

References

  1. WHO. Guidelines on the Conservation of Medicinal Plants; International Union for Conservation of Nature and Natural Resources: Gland, Switzerland, 1993. [Google Scholar]
  2. Chen, S.-L.; Yu, H.; Luo, H.-M.; Wu, Q.; Li, C.-F.; Steinmetz, A. Conservation and sustainable use of medicinal plants: Problems, progress, and prospects. Chin. Med. 2016, 11, 37. [Google Scholar] [CrossRef] [PubMed]
  3. Ekor, M. The growing use of herbal medicines: Issues relating to adverse reactions and challenges in monitoring safety. Front. Pharmacol. 2014, 4, 177. [Google Scholar] [CrossRef] [PubMed]
  4. Puneshwar, K. Controversy, adulteration and substitution: Burning problems in ayurveda practices. In Natural Medicinal Plants; Hany, A.E.-S., Ed.; IntechOpen: Rijeka, Croatia, 2021. [Google Scholar]
  5. Khan, S.A.; Barkatullah; Ibrar, M.; Ullah, S. Microscopic investigations and pharmacognostic techniques used for the standardization of leaf of Rhus succedanea var. Himalaica JD Hook. Microsc. Res. Tech. 2019, 82, 1982–1992. [Google Scholar] [CrossRef] [PubMed]
  6. Ichim, M.C. The DNA-based authentication of commercial herbal products reveals their globally widespread adulteration. Front. Pharmacol. 2019, 10, 1227. [Google Scholar] [CrossRef] [PubMed]
  7. Bokhari, S.W.A.; Sharif, H.; Gilani, S.M.U.; Ali, S.T.; Ahmed, S.; Siddiqui, M.U.A.; Hasan, M.M. Pharmacognostic and phytochemical study of the flowers of Cordia sebestena L. Pak. J. Pharm. Sci 2022, 35, 069–076. [Google Scholar] [CrossRef]
  8. Uza, N.U.; Dastagir, G. Microscopic and pharmacognostic standardization of Astragalus scorpiurus Bunge. Microsc. Res. Tech. 2022, 85, 324–338. [Google Scholar] [CrossRef]
  9. WFO. Bassia indica (Wight) A.J. Scott. 2023. Available online: https://wfoplantlist.org/taxon/wfo-0000561151-2024-06?page=1 (accessed on 23 April 2024).
  10. Grabowska, K.; Buzdygan, W.; Galanty, A.; Wróbel-Biedrawa, D.; Sobolewska, D.; Podolak, I. Current knowledge on genus Bassia All: A comprehensive review on traditional use, phytochemistry, pharmacological activity, and nonmedical applications. Phytochem. Rev. 2023, 22, 1197–1246. [Google Scholar] [CrossRef]
  11. Youssef, S. Medicinal and non-medicinal uses of some plants found in the middle region of Saudi Arabia. J. Med. Plant Res. 2013, 7, 2501–2517. [Google Scholar] [CrossRef]
  12. El-Gendy, Z.A.; Taher, R.F.; Elgamal, A.M.; Serag, A.; Hassan, A.; Jaleel, G.A.A.; Farag, M.A.; Elshamy, A.I. Metabolites profiling and bioassays reveal Bassia indica ethanol extract protective effect against stomach ulcers development via HMGB1/TLR-4/NF-κB pathway. Antioxidants 2023, 12, 1263. [Google Scholar] [CrossRef]
  13. Qureshi, M.Z.; Javed, S.; Javaid, A.; Al-Taie, A.H. Identification of antimicrobial compounds from n-hexane stem extract of Kochia indica by GC-MS analysis. Mycopath 2020, 16, 51–55. [Google Scholar]
  14. Mohammed, M.; Heikal, E.A.; Ellessy, F.M.; Aboushousha, T.; Ghareeb, M.A. Comprehensive chemical profiling of Bassia indica Wight. aerial parts extract using UPLC-ESI–MS/MS, and its antiparasitic activity in Trichinella spiralis infected mice: In silico supported in vivo study. BMC Complement. Med. Ther. 2023, 23, 1–22. [Google Scholar] [CrossRef]
  15. Othman, A.; Amen, Y.; Inoue, Y.; Shimizu, K. Phytochemical analysis, anti-inflammatory, and anticancer activities of the halophyte herb Bassia indica. Nat. Prod. Commun. 2022, 17, 1–8. [Google Scholar] [CrossRef]
  16. Bouaziz, M.; Dhouib, A.; Loukil, S.; Boukhris, M.; Sayadi, S. Polyphenols content, antioxidant and antimicrobial activities of extracts of some wild plants collected from the south of Tunisia. Afr. J. Biotechnol. 2009, 8, 7017–7027. [Google Scholar]
  17. Bibi, H.; Hussain, M.; Jan, G.; Shah, G.; Khan, S.; Ullah, I. Phytochemical analysis and antimicrobial activities of Kochia indica (Wight), plant growing in District Karak Khyber Puhktunkhuwa. Pure Appl. Biol. 2021, 10, 789–796. [Google Scholar] [CrossRef]
  18. Javed, S.; Javaid, A.; Qureshi, M.Z. Antifungal phytocomponents in n-butanol fraction of leaf extract of Kochia indica Wight. Int. J. Biol. Biotechnol. 2018, 15, 661–666. [Google Scholar]
  19. Othman, A.; Sayed, A.M.; Amen, Y.; Shimizu, K. Possible neuroprotective effects of amide alkaloids from Bassia indica and Agathophora alopecuroides: In vitro and in silico investigations. RSC Adv. 2022, 12, 18746–18758. [Google Scholar] [CrossRef] [PubMed]
  20. Jubair, N.; Rajagopal, M.; Chinnappan, S.; Abdullah, N.B.; Fatima, A. Review on the antibacterial mechanism of plant-derived compounds against multidrug-resistant bacteria (MDR). Evid. Based Complement. Altern. Med. 2021, 2021, 3663315. [Google Scholar] [CrossRef]
  21. Kim, O.K.; Barrett, J.F.; Ohemeng, K. Advances in DNA gyrase inhibitors. Expert Opin. Investig. Drug 2001, 10, 199–212. [Google Scholar] [CrossRef]
  22. Zhang, M.; Wang, C.; Zhang, R.; Chen, Y.; Zhang, C.; Heidi, H.; Li, M. Comparison of the guidelines on good agricultural and collection practices in herbal medicine of the European Union, China, the WHO, and the United States of America. Pharmacol. Res. 2021, 167, 105533. [Google Scholar] [CrossRef]
  23. WHO. Quality Control Methods for Medicinal Plant Materials; World Health Organization: Geneva, Switzerland, 1998. [Google Scholar]
  24. El Shereef, A.A. Kochia plant as potential forage for ruminants under desert conditions. Annu. Res. Rev. Biol. 2016, 10, 1–6. [Google Scholar] [CrossRef]
  25. Turki, Z.; El-Shayeb, F.; Shehata, F. Taxonomic studies in the camphorosmeae (chenopodiaceae) in Egypt. Flora Mediterr. 2006, 16, 275–294. [Google Scholar] [CrossRef]
  26. Zaman, S.; Barkatulllah; Zahoor, M.; Wadood Ali Shah, S.; Ullah, Z.; Ullah, R.; Alotaibi, A. Pharmacognostic evaluation of Artemisia maritima L. a highly medicinal specie of genus Artemisia. Saudi J. Biol. Sci. 2022, 29, 103419. [Google Scholar] [CrossRef]
  27. Adu, O.T.; Naidoo, Y.; Adu, T.S.; Sivaram, V.; Dewir, Y.H. Micromorphology and histology of the secretory apparatus of Diospyros villosa (L.) de winter leaves and stem bark. Plants 2022, 11, 2498. [Google Scholar] [CrossRef]
  28. Hameed, A.; Ghani, N.; Mughal, T.A.; Abbas, M.; Abrar, A.; Javed, H. Pharmacognostical evaluation and physiochemical analysis of Salsola Kali as medicinal plant. Microsc. Res. Tech. 2023, 26, 1322–1332. [Google Scholar] [CrossRef]
  29. Yusufoglu, H.S. Pharmacognostic and wound healing studies of the leaves of Bassia eriophora (family: Chenopodiaceae) on albino rats. Annu. Res. Rev. Biol. 2015, 5, 400–408. [Google Scholar] [CrossRef]
  30. Ukwubile, C.A.; Ikpefan, E.O.; Dibal, M.Y.; Umeano, V.A.; Menkiti, D.N.; Kaosi, C.C.; Paul, S.; Famurewa, A.C.; Nettey, H.; Yerima, T.S. Pharmacognostic profiles, evaluation of analgesic, anti-inflammatory and anticonvulsant activities of Newbouldia laevis (P. Beauv.) Seem. ex Bureau leaf and root extracts in Wistar rats. J. Ethnopharmacol. 2023, 314, 116632. [Google Scholar] [CrossRef]
  31. Sree, P.R.; Thoppil, J. Comparative seed morphology, pharmacognostic, phytochemical, and antioxidant potential of Memecylon l. Fruits. Turk. J. Pharm. Sci. 2021, 18, 213. [Google Scholar] [CrossRef] [PubMed]
  32. Dastagir, G.; Hussain, F.; Uza, N.U. Anatomical and histochemical characterization of some highly medicinal plants as a tool for quality control. Microsc. Res. Tech. 2023, 86, 966–990. [Google Scholar] [CrossRef]
  33. Jones, P.W.; Chin, Y.-W.; Kinghorn, D.A. The role of pharmacognosy in modern medicine and pharmacy. Curr. Drug Targets 2006, 7, 247–264. [Google Scholar] [CrossRef]
  34. Pirintsos, S.; Panagiotopoulos, A.; Bariotakis, M.; Daskalakis, V.; Lionis, C.; Sourvinos, G.; Karakasiliotis, I.; Kampa, M.; Castanas, E. From traditional ethnopharmacology to modern natural drug discovery: A methodology discussion and specific examples. Molecules 2022, 27, 4060. [Google Scholar] [CrossRef]
  35. Balami, S.; Sharma, A.; Karn, R. Significance of nutritional value of fish for human health. Malays. J. Halal Res. J. 2019, 2, 32–34. [Google Scholar] [CrossRef]
  36. Radha; Kumar, M. Evaluation of nutritional, phytochemical, and mineral composition of selected medicinal plants for therapeutic uses from cold desert of Western Himalaya. Plants 2021, 10, 1429. [Google Scholar] [CrossRef] [PubMed]
  37. Ahmad, A.; Husain, A.; Mujeeb, M.; Khan, S.A.; Alhadrami, H.A.A.; Bhandari, A. Quantification of total phenol, flavonoid content and pharmacognostical evaluation including HPTLC fingerprinting for the standardization of Piper nigrum Linn fruits. Asian Pac. J. Trop. Biomed. 2015, 5, 101–107. [Google Scholar] [CrossRef]
  38. Nafea, E. Nutritive values of some wetland plants in the Deltaic Mediterranean coast of Egypt. Egypt. J. Bot. 2017, 57, 1–10. [Google Scholar] [CrossRef]
  39. Mensah, E.; Kyei-Baffour, N.; Ofori, E.; Obeng, G. Influence of Human Activities and Land Use on Heavy Metal Concentrations in Irrigated Vegetables in Ghana and Their Health Implications; Yanful, E.K., Ed.; Springer: Dordrecht, The Netherlands, 2009; pp. 9–14. [Google Scholar]
  40. Mirzaei, F. Minerals profile of forages for grazing ruminants in Pakistan. Open J. Anim. Sci. 2012, 2, 9. [Google Scholar] [CrossRef]
  41. El Shaer, H.M. Halophytes and salt-tolerant plants as potential forage for ruminants in the Near East region. Small Rumin. Res. 2010, 91, 3–12. [Google Scholar] [CrossRef]
  42. Younus, M.; Hasan, M.M.; Rehman, M.S.; Abbas, K.; Sarwar, G. Report: Pharmacognostic and physicochemical screening of Euphorbia nivulia Buch.-Ham. Pak. J. Pharm. Sci 2019, 32, 1111–1119. [Google Scholar]
  43. Sajid-Ur-Rehman, M.; Ishtiaq, S.; Khalil-Ur-Rehman, M.; Bauer, R. Pharmacognostic screening, physico-chemical and cytotoxic potential of Sesuvium sesuvioides (Fenzyl) Verdc. Pak. J. Pharm. Sci 2021, 34, 1585–1595. [Google Scholar] [CrossRef]
  44. Ahmed, F.A.; Baraka, D.M.; Donia, A.E.R.M.; Mostafa, R.M.; Morsy, Z.M. Phytochemical investigation, HPLC analysis and antimicrobial activity of some plants from chenopodiaceae family. Egypt. Acad. J. Biol. 2022, 13, 13–24. [Google Scholar] [CrossRef]
  45. Vasavilbazo-Saucedo, A.; Almaraz-Abarca, N.; González-Ocampo, H.A.; Ávila-Reyes, J.A.; González-Valdez, L.S.; Luna-González, A.; Delgado-Alvarado, E.A.; Torres-Ricario, R. Phytochemical characterization and antioxidant properties of the wild edible acerola Malpighia umbellata Rose. CyTA J. Food 2018, 16, 698–706. [Google Scholar] [CrossRef]
  46. González-Ocampo, H.A.; Martínez-Álvarez, I.G.; Jaramillo-Flores, M.E.; Luna-González, A. Comparison of phenolic and flavonoid content and antioxidant and chelating activities of Rhizophora mangle in different anthropogenically-polluted coastal lagoons. Front. Mar. Sci. 2022, 9, 791748. [Google Scholar] [CrossRef]
  47. Bouarab-Chibane, L.; Forquet, V.; Lantéri, P.; Clément, Y.; Léonard-Akkari, L.; Oulahal, N.; Degraeve, P.; Bordes, C. Antibacterial properties of polyphenols: Characterization and QSAR (quantitative structure–activity relationship) models. Front. Microbiol. 2019, 10, 829. [Google Scholar] [CrossRef] [PubMed]
  48. Maugeri, A.; Lombardo, G.E.; Cirmi, S.; Süntar, I.; Barreca, D. Pharmacology and toxicology of tannins. Arch. Toxicol. 2022, 96, 1257–1277. [Google Scholar] [CrossRef] [PubMed]
  49. Elekofehinti, O.O.; Iwaloye, O. Saponins in cancer treatment: Current progress and future prospects. Pathophysiology 2021, 28, 250–272. [Google Scholar] [CrossRef] [PubMed]
  50. Maulidya, V.; Hasanah, A.N. Quality control and authentication of black betel leaf extract (Piper acre Blume) from East Kalimantan as an antimicrobial agent using a combination of high-performance liquid chromatography and chemometric fourier transform infrared. Molecules 2023, 28, 5666. [Google Scholar] [CrossRef] [PubMed]
  51. Khan, I.H.; Javaid, A. Antifungal, antibacterial and antioxidant components of ethyl acetate extract of quinoa stem. Plant Prot. 2019, 3, 125–130. [Google Scholar] [CrossRef]
  52. Selvakumar, J.N.; Chandrasekaran, S.D.; Doss, G.P.C.; Kumar, T.D. Inhibition of the ATPase domain of human topoisomerase IIa on HepG2 Cells by 1, 2-benzenedicarboxylic acid, mono (2-ethylhexyl) ester: Molecular docking and dynamics simulations. Curr. Cancer Drug Targets 2019, 19, 495–503. [Google Scholar] [CrossRef] [PubMed]
  53. Fadipe, L.A.; Haruna, A.; Mohammed, I. Antibacterial activity of 1, 2-benzenedicarboxylic acid, dioctyl ester isolated from the ethyl acetate soluble sub-portion of the unripe fruits of Nauclea latifolia. Int. J. Pure Appl. Biosci. 2014, 2, 223–230. [Google Scholar]
  54. Reddy, L.H.; Couvreur, P. Squalene: A natural triterpene for use in disease management and therapy. Adv. Drug Deliv. Rev. 2009, 61, 1412–1426. [Google Scholar] [CrossRef]
  55. Henry, H.L.; Norman, A.W.; Taylor, A.N.; Hartenbower, D.L.; Coburn, J.W. Biological activity of 24,25-dihydroxycholecalciferol in chicks and rats. J. Nutr. 1976, 106, 724–734. [Google Scholar] [CrossRef]
  56. Yang, S.; Chou, G.; Li, Q. Cardioprotective role of azafrin in against myocardial injury in rats via activation of the Nrf2-ARE pathway. Phytomedicine 2018, 47, 12–22. [Google Scholar] [CrossRef] [PubMed]
  57. Brintha, S.; Rajesh, S.; Renuka, R.; Santhanakrishnan, V.; Gnanam, R. Phytochemical analysis and bioactivity prediction of compounds in methanolic extracts of Curculigo orchioides Gaertn. J. Pharmacogn. Phytochem. 2017, 6, 192–197. [Google Scholar]
  58. Anifalaje, E.O.; Ibok, M.G. Chemical compositions and antioxidant activities of Albizia lebbeck L. essential oils. J. Essent. Oil-Bear. Plants 2020, 23, 810–820. [Google Scholar] [CrossRef]
  59. Shokrollahi, N.; Ho, C.-L.; Mohd Zainudin, N.A.I.; Abdul Wahab, M.A.w.B.; Wong, M.-Y. Plant defense inducers and antioxidant metabolites produced during oil palm-Ganoderma boninense interaction in vitro. Chem. Afr. 2023, 6, 499–511. [Google Scholar] [CrossRef]
  60. Gardner, D.R.; Panter, K.E.; Stegelmeier, B.L. Implication of agathic acid from Utah juniper bark as an abortifacient compound in cattle. J. Appl. Toxicol. 2010, 30, 115–119. [Google Scholar] [CrossRef]
  61. Hashimoto, T.; Rathore, H.; Satoh, D.; Griffin, J.F.; From, A.H.; Ahmed, K.; Fullerton, D.S.; Hong, G. Cardiac glycosides. 6. Gitoxigenin C16 acetates, formates, methoxycarbonates, and digitoxosides. Synthesis and Na+, K+-ATPase inhibitory activities. J. Med. Chem. 1986, 29, 997–1003. [Google Scholar] [CrossRef] [PubMed]
  62. Kaur, P.; Arora, S.; Singh, R. Isolation, characterization and biological activities of betulin from Acacia nilotica bark. Sci. Rep. 2022, 12, 9370. [Google Scholar] [CrossRef]
  63. Bakrim, S.; Benkhaira, N.; Bourais, I.; Benali, T.; Lee, L.-H.; El Omari, N.; Sheikh, R.A.; Goh, K.W.; Ming, L.C.; Bouyahya, A. Health benefits and pharmacological properties of stigmasterol. Antioxidants 2022, 11, 1912. [Google Scholar] [CrossRef] [PubMed]
  64. Asami, E.; Kitami, M.; Ida, T.; Kobayashi, T.; Saeki, M. Anti-inflammatory activity of 2-methoxy-4-vinylphenol involves inhibition of lipopolysaccharide-induced inducible nitric oxidase synthase by heme oxygenase-1. Immunopharmacol. Immunotoxicol. 2023, 45, 589–596. [Google Scholar] [CrossRef]
  65. Yang, S.; Liu, J.; Jiao, J.; Jiao, L. Ar-turmerone exerts anti-proliferative and anti-inflammatory activities in HaCaT keratinocytes by inactivating hedgehog pathway. Inflammation 2020, 43, 478–486. [Google Scholar] [CrossRef]
  66. Shaaban, M.T.; Ghaly, M.F.; Fahmi, S.M. Antibacterial activities of hexadecanoic acid methyl ester and green-synthesized silver nanoparticles against multidrug-resistant bacteria. J. Basic Microbiol. 2021, 61, 557–568. [Google Scholar] [CrossRef]
  67. Mohammad Shafiqur, R.; Jaripa, B.; JU, C.; MN, A. Antibacterial activity of 1, 2-benzenedicarboxylic acid, diisooctyl ester isolated from the root of Pumbago zeylanica linn. Hamdard Med. 2007, 50, 23–28. [Google Scholar]
  68. Shahid, A.; Khan, D.A.; Aati, H.Y.; Sherif, A.E.; Ovatlarnporn, C.; Hussain, M.; Rao, H.; Khan, M.I.; Younus, M.; Basit, A.; et al. Chemical profiling and biological activities of Dipterygium glaucum Decne.: An in-vivo, in-vitro and in-silico evaluation. S. Afr. J. Bot. 2023, 160, 715–730. [Google Scholar] [CrossRef]
  69. Aati, H.Y.; Anwar, M.; Al-Qahtani, J.; Al-Taweel, A.; Khan, K.-u.-R.; Aati, S.; Usman, F.; Ghalloo, B.A.; Asif, H.M.; Shirazi, J.H. Phytochemical profiling, in vitro biological activities, and in-silico studies of Ficus vasta Forssk.: An unexplored plant. Antibiotics 2022, 11, 1155. [Google Scholar] [CrossRef] [PubMed]
  70. Iqbal, S.M.; Mushtaq, A.; Jabeen, Q. Antimicrobial, antioxidant and calcium channel blocking activities of Amberboa divaricata. Bangladesh J. Pharmacol. 2014, 9, 29–36. [Google Scholar] [CrossRef]
  71. Abubakar, A.R.; Haque, M. Preparation of medicinal plants: Basic extraction and fractionation procedures for experimental purposes. J. Pharm. Bioallied Sci. 2020, 12, 1–10. [Google Scholar] [CrossRef]
  72. Nafees, M.; Barkatullah; Ullah, S.; Ikram, N. Phytochemical and pharmacognostic studies of Buddleja asiatica leaves. Microsc. Res. Tech. 2022, 85, 510–520. [Google Scholar] [CrossRef] [PubMed]
  73. Khan, S.A.; Barkatullah; Khan, B. Anatomy, micromorphology, and physiochemical analysis of Rhus succedanea var. himalaica root. Microsc. Res. Tech. 2020, 83, 424–435. [Google Scholar] [CrossRef]
  74. Farooq, M.; Shoaib, M.H.; Yousuf, R.I.; Qazi, F.; Hanif, M. Development of extended release loxoprofen sodium multiparticulates using different hydrophobic polymers. Polym. Bull. 2019, 76, 2537–2558. [Google Scholar] [CrossRef]
  75. WHO. Quality Control Methods for Herbal Materials; World Health Organization: Geneva, Switzerland, 2011. [Google Scholar]
  76. Helrich, K. Official Methods of Analysis of the Association of Official Analytical Chemists; Association of Official Analytical Chemists: Washington, DC, USA, 1990; Volume 15. [Google Scholar]
  77. Altemimi, A.; Watson, D.G.; Kinsel, M.; Lightfoot, D.A. Simultaneous extraction, optimization, and analysis of flavonoids and polyphenols from peach and pumpkin extracts using a TLC-densitometric method. Chem. Cent. J. 2015, 9, 39. [Google Scholar] [CrossRef]
  78. Masood, N.; Jamil, Q.; Aslam, M.I.; Masood, M.I.; Shirazi, J.H.; Jamil, Q.A.; Jan, M.S.; Alsuwayt, B.; Ahmad, A.; Alnasser, S.M.A. Antioxidant, carbonic anhydrase inhibition and diuretic activity of Leptadenia pyrotechnica Forssk. Decne. Heliyon 2023, 9, e22485. [Google Scholar] [CrossRef]
  79. Ayaz, A.; Jamil, Q.; Hussain, M.; Anjum, F.; Sarfraz, A.; Alqahtani, T.; Hussain, N.; Gahtani, R.M.; Dera, A.A.; Alharbi, H.M. Antioxidant and gastroprotective activity of Suaeda fruticosa Forssk. Ex JF Gmel. Molecules 2022, 27, 4368. [Google Scholar] [CrossRef]
  80. Aslam, M.I.; Touqeer, S.; Jamil, Q.; Masood, M.I.; Sarfraz, A.; Khan, S.Y.; Jan, M.S.; Alnasser, S.M.A.; Ahmad, A.; Aslam, F.; et al. Cenchrus ciliaris L. ameliorates cigarette-smoke induced acute lung injury by reducing inflammation and oxidative stress. S. Afr. J. Bot. 2024, 171, 216–227. [Google Scholar] [CrossRef]
  81. Schulz, H.; Baranska, M. Identification and quantification of valuable plant substances by IR and Raman spectroscopy. Vib. Spectrosc. 2007, 43, 13–25. [Google Scholar] [CrossRef]
  82. Nawaz, I.; Tahir, A.; Iqbal, S.M.; Anjum, F.; Naseem, M.; Aslam, M.I.; Hussain, M.; Jamil, Q.A.; Shirazi, J.H.; Jamil, Q. Anti-inflammatory, anti-nociceptive and anti-pyretic activities of Cenchrus ciliaris L. J. Ethnopharmacol. 2023, 309, 116332. [Google Scholar] [CrossRef]
  83. Mosmann, T. Rapid colorimetric assay for cellular growth and survival: Application to proliferation and cytotoxicity assays. J. Immunol. Methods 1983, 65, 55–63. [Google Scholar] [CrossRef]
  84. Saleem, U.; Amin, S.; Ahmad, B.; Azeem, H.; Anwar, F.; Mary, S. Acute oral toxicity evaluation of aqueous ethanolic extract of Saccharum munja Roxb. roots in albino mice as per OECD 425 TG. Toxicol. Rep. 2017, 4, 580–585. [Google Scholar] [CrossRef]
  85. Iqbal, S.M.; Jamil, Q.; Jamil, N.; Kashif, M.; Mustafa, R.; Jabeen, Q. Antioxidant, antibacterial and gut modulating activities of Kalanchoe laciniata. Acta. Pol. Pharm. 2016, 73, 1221–1227. [Google Scholar]
  86. Konstantinovitch, K.k.Y.; Arsene, M.M.J.; Aliya, M.V.; Viktorovna, P.I.; Elena, V.G.; Azova, M.M.; Amira, A.A. Assessment of antimicrobial activity of ethanolic and aqueous extracts of Aesculus hippocastanum L. (horse chestnut) bark against bacteria isolated from urine of patients diagnosed positive to urinary tract infections. Front. Biosci. (Schol. Ed.) 2022, 14, 11. [Google Scholar] [CrossRef] [PubMed]
  87. Bank, P.D. Protein data bank. Nat. New Biol. 1971, 233, 223. [Google Scholar]
  88. Goodsell, D.S.; Sanner, M.F.; Olson, A.J.; Forli, S. The AutoDock suite at 30. Protein Sci. 2021, 30, 31–43. [Google Scholar] [CrossRef]
  89. Brown, T. ChemDraw. Sci. Teach. 2014, 81, 67. [Google Scholar]
  90. Ejaz, S.A.; Aziz, M.; Zafar, Z.; Akhtar, N.; Ogaly, H.A. Revisiting the inhibitory potential of protein kinase inhibitors against NEK7 protein via comprehensive computational investigations. Sci. Rep. 2023, 13, 4304. [Google Scholar] [CrossRef]
  91. Ejaz, S.A.; Aziz, M.; Fayyaz, A.; Wani, T.A.; Zargar, S. Computer-aided approach for the identification of lead molecules as the inhibitors of cholinesterase’s and monoamine oxidases: Novel target for the treatment of Alzheimer’s disease. J. Serb. Chem. Soc. 2023, 89, 441–442. [Google Scholar] [CrossRef]
  92. Aziz, M.; Ejaz, S.A.; Tamam, N.; Siddique, F.; Riaz, N.; Qais, F.A.; Chtita, S.; Iqbal, J. Identification of potent inhibitors of NEK7 protein using a comprehensive computational approach. Sci. Rep. 2022, 12, 6404. [Google Scholar] [CrossRef]
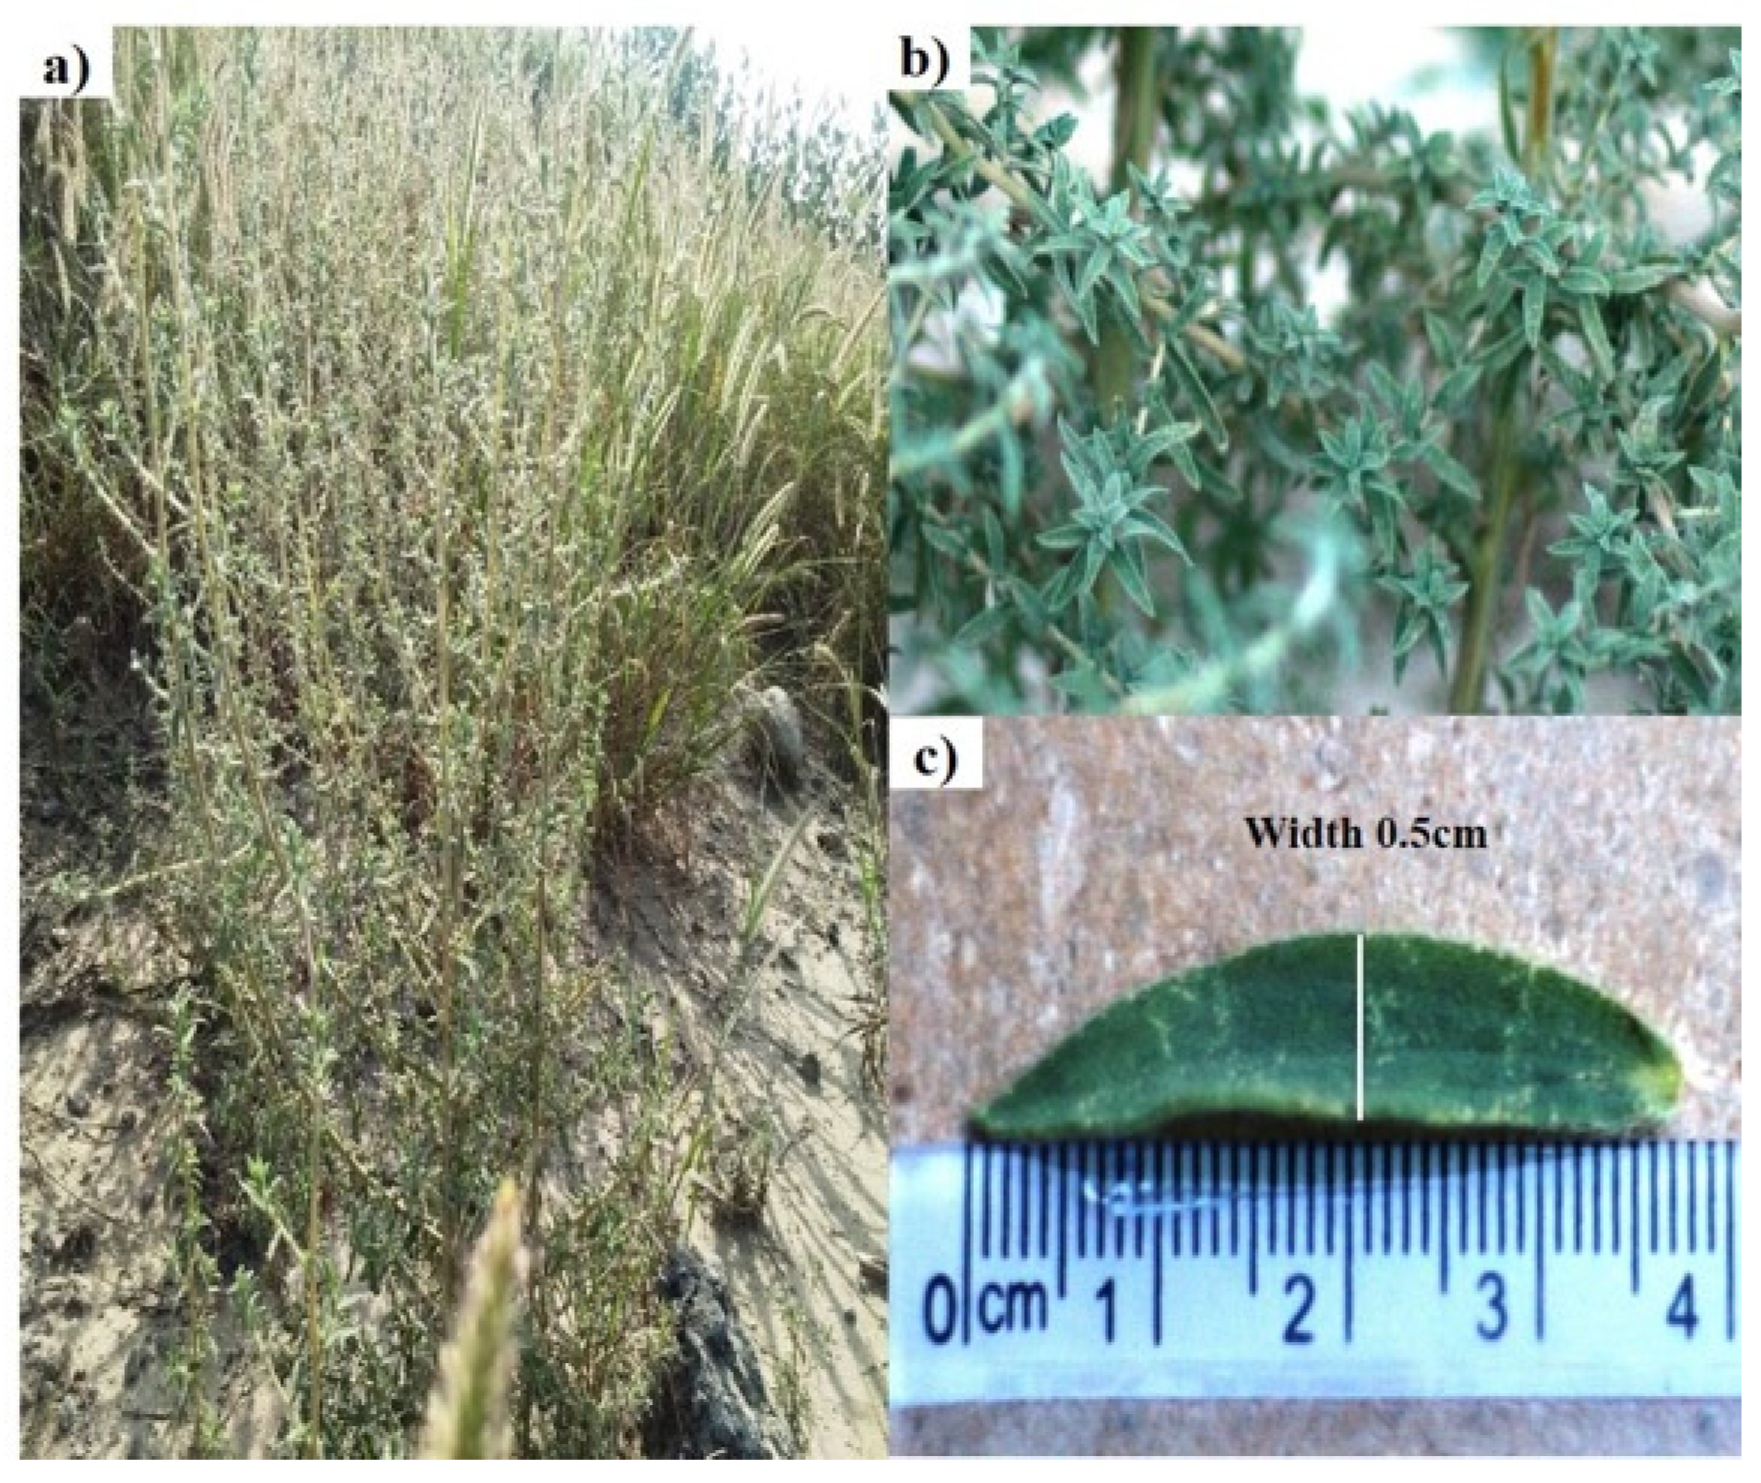
Figure 1. Different parts of the B. indica plant: (a) whole plant with area of growing; (b) plant stem and leaves showing color and summitry; (c) leaf indicating length and width.
Plants 13 01753 g001
Figure 2. Different portions showing various tissues: (a) overall outline of leaf cross section (4×); (b) portion of same under 10×; (c) midrib portion; (d) leaf tip; (e) part with upper epidermis; (f) part with lower epidermis (40×); GH: glandular hair; LED: lower epidermis; MR: midrib; MES: mesophyll; PC: parenchyma; SVB: small vascular bundle; TVB: transverse vascular bundle; UED: upper epidermis; VB: vascular bundle.
Plants 13 01753 g002
Figure 3. Different portions showing various tissues: (a) overall outline of stem cross section (4×); (b) portion of same under 10×; (c) overall showing epidermis; (d) different parts including glandular hair, cortex, phloem, xylem and parenchyma cells; CX: cortex, ED: epidermis, GH: e glandular hairs, P: pith, PC: parenchyma cells, PH: phloem, VBR: vascular bundle ring, XY: xylem.
Plants 13 01753 g003
Figure 4. Powder microscopy showing different structures at 10× (eh,jl) and 40× (ad,i). (a) epidermal cells (upper) with stomata; (b) lower epidermis cells; (c) cortical cells with starch grains; (d) trichome with base cell; (e) epidermal hair; (f) calcium oxalate crystals of different shape; (g) trichome; (h) pitted vascular system; (i) group of xylem fibers; (j) spiral thickening of vessels; (k,l): fiber bundle; CO: calcium oxalate crystals, FBI: intact fiber bundle, FBB: broken fiber bundle EH: epidermal hair, LED: lower epidermis, XF: xylem fibers, EC: epidermal cells, ST: stomata, SG: starch grain, SV: spiral thickening (lignin) of broken vessel, TB: trichome base, T: trichome, PVS: pitted vessel system.
Plants 13 01753 g004
Figure 5. Different fields of view of scanning electron microscopy: (a) segment of epidermis with multicellular glandular hair and epidermal cells (600×); (b) portion of same as (a) under 250×; (c) powder showing broken vascular bundle, salt crystals and broken epidermal hairs; (d) powder showing salt crystals and broken fiber cells; (e) epidermis showing tightly packed cells; (f) segments of vessel elements, fibers and hairs (60×) BEH: broken epidermal hairs, BVB: broken vascular bundle, EC: epidermal cells, ED: epidermis, EH: epidermal hair, F: fibers, GH: glandular hair, MCGH: multicellular glandular hairs, SC: salt crystals, VE: vessel elements.
Plants 13 01753 g005
Figure 6. Fourier transform infrared spectrogram of B. indica showing different peaks.
Plants 13 01753 g006
Figure 7. GC-MS chromatogram of the n-butanol fraction of the B. indica extract.
Plants 13 01753 g007
Figure 8. GC-MS chromatogram of the ethyl acetate fraction of the B. indica extract.
Plants 13 01753 g008
Figure 9. GC-MS chromatogram of the n-hexane fraction of the B. indica extract.
Plants 13 01753 g009
Figure 10. The predicted 3D (a) and 2D (b) binding modes of compound NB23 against the DNA gyrase subunit B of P. aeruginosa.
Plants 13 01753 g010
Figure 11. The predicted 3D (a) and 2D (b) binding modes of compound EA19 against the DNA gyrase subunit B of S. typhi.
Plants 13 01753 g011
Figure 12. The predicted 3D (a) and 2D (b) binding modes of compound NH4 against the DNA gyrase subunit B of P. aeruginosa.
Plants 13 01753 g012
Table 1. Extractive value of B. indica.
SolventValue (%)
Distilled water10.5
n-Butanol3
Ethyl acetate2
Dichloromethane1.5
n-Hexane1
Table 2. Nutritional and elemental analysis of B. indica.
ParameterValue
Nutritional analysis(%)
Crude protein12.39
Crude fat1.10
Crude fiber24.21
Carbohydrate16.61
Ash value14.52
Moisture content31.17
Caloric value111.43 (kcal/100 g)
Elemental content(mg/kg)
Calcium470
Cadmium0.1
Chromium0.05
Copper34.5
Iron161
Magnesium55.6
Manganese5.5
Table 3. Fluorescence analysis of the dried powder of the B. indica aerial parts.
ReagentsDaylightUV 254 nm
Powder as suchGreenish brownBrown
MethanolBrownDark brown
Ethyl acetateLight greenDark green
DichloromethaneDark greenBlue
ChloroformBrownDark brown
n-ButanolDark brownBlue
n-HexaneDark greenBlackish green
50% HNO3GreenPink
Picric acidsYellowishBrown
50% HClGreenLight pink
Conc. H2SO4BlackDark brown
1% NaOHGreenDark green
IodineLight brownBlue
5% FeCl3YellowDark brown
Table 4. Rf values of the B. indica extracts in different mobile phases.
ExtractSolventRatioRf Value
n-HexaneH:E.A1:10.34, 0.55, 0.67, 0.85
H:E.A3:10.15
DichloromethaneCH:M4:10.50, 0.62, 0.70, 0.90
H:E.A1:10.28, 0.52
Ethyl acetateH:E.A1:10.544, 0.68, 0.85
CH:M4:10.11, 0.26, 0.34
n-ButanolCH:M4:10.10, 0.16, 0.51, 0.63, 0.85
H:E.A1:10.23, 0.50, 0.59, 0.66
AqueousCH:M4:10.88
CrudeE.A:B:AA:W16:2:1:10.08, 0.94
H: n-hexane, E.A: ethyl acetate, CH: chloroform, M: methanol, B: n-butanol, AA: acetic acid, W: water.
Table 5. Quantitative analysis of phenols, flavonoids, and tannins in the B. indica extracts.
FractionTPC (mg TAEg−1)TTC (mg TAEg−1)TFC (mg QEg−1)
n-Hexane36.00 ± 2.93.99 ± 0.4824.089 ± 3.952
Dichloromethane303.48 ± 25.28190.95 ± 37.26106.223 ± 3.437
Ethyl acetate419.10 ± 11.76249.60 ± 10.50161.790 ± 1.375
n-Butanol296.07 ± 10.14156.97 ± 29.47109.658 ± 9.107
Aqueous169.86 ± 12.08104.17 ± 26.9347.973 ± 0.344
Crude214.27 ± 14.98107.50 ± 30.2786.943 ± 5.670
TPC: total phenolic content, TTC: total tannin content, TFC: total flavonoid content.
Table 6. Functional groups and their wave numbers found in the FTIR of the B. indica powder.
Wave Number (cm−1)Intensity of EstimationGroup or Functional Group Class
2914.8SO-H stretching (alcohol)
MC-H stretching (alkane)
2847.7MC-H stretching (alkane)
1735.1WC-H bending (aromatic compound)
1638.2MC=C stretching (conjugated alkene)
1364.2MO-H bending (alcohol)
1313.9SS=O stretching (sulfone)
MO-H bending (phenol)
1239.3SC-O stretching (alkyl aryl ether)
MC-N stretching (amine)
1099.6SC-O stretching (secondary alcohol)
1019.4SC=C bending (alkene)
896.4MC=C bend (alkenes like vanylidine)
777.1SC-Cl stretching (halo compound)
S: strong, M: medium, W: weak.
Table 7. Compounds identified in the GC-MS analysis of the n-butanol fraction of B. indica.
Sr. NORTAreaCompoundMolecular FormulaMolecular Weight
NB13.921.106-Methoxy-2-phenyl-hexahydropyrano[2,3-b][1,3]dioxine-7,8 diolC14H18O6282.29
NB24.280.172,5-Dihydro-5-methoxy-2-furanoneC5H6O3114.10
NB37.280.99-Octadecenoic acid, (2-phenyl-1,3-dioxolan-4-yl)methyl ester, cisC28H44O4444
NB49.620.15Acetamide, N-methyl-N-[4-[2-acetoxymethyl-1-pyrrolidyl]-2-butynyl]-C14H22N2O3266.33
NB510.501.28TetradecaneC14H30198.38
NB612.010.49Dodecane, 5,8-diethyl-C16H34226.44
NB712.310.202H-indeno[1,2-b]furan-2-one, 3,3a,4,5,6,7,8,8b-octahydro-8,8-dimethylC13H18O2206.28
NB812.920.74Pentanoic acid, 2,2,4-trimethyl-3-carboxyisopropyl, isobutyl esterC16H30O4286.40
NB913.435.20HexadecaneC16H34226.44
NB1013.923.16N-Acetyl-4-phenylbutylamineC12H17NO191
NB1115.200.77Myristyl monoethoxylateC16H34O2258.44
NB1215.920.152(3H)-Furanone, dihydro-5-tetradecylC18H34O2282.46
NB1316.180.16trans-1,2-diaminocyclohexane-N,N,N,N-tetraacetic acidC14H22N2O8346
NB1416.510.1417-PentatriaconteneC35H70490.93
NB1516.813.39Bacteriochlorophyll-c-stearylC52H72MgN4O4841.5
NB1617.200.772- Nonadecanone 2,4- dinitrophenylhydrazineC25H42N4O4462
NB1717.832.381-DocosanolC22H46O326.6
NB1818.220.687,9-Di-tert-butyl-1-oxaspiro(4,5)deca-6,9-diene-2,8-dioneC17H24O3276.37
NB1918.798.08Hexadecanoic acid, 1-(hydroxymethyl)-1,2-ethanediyl esterC35H68O5568.91
NB2020.560.113-Pyridinecarboxylic acid, 2,7,10-tris(acetyloxy)-1,1a,2,3,4,6,7,10, 11,11a-decahydro-1,1,3,6,9-pentamethyl-4-oxo-4a,7a-epoxy-5H-cyclopenta[a]cyclo propa [f]cycloundecen-11-yl ester, [1aR(1aR*,2R*,3S*,4aR*,6S*,7S*,7aS*,8E,10R*,11R*,11aS*)]-C32H39NO10597.25
NB2121.051.77Dodecanecarboxamide, N-[2-(3-indolyl)ethyl]-C22H34N2O342
NB2221.401.86Erucic acidC22H42O2338.57
NB2321.990.1818,19-Secoyohimban-19-oic acid, 16,17,20,21-tetradehydro-16-(hydroxy methyl)-, methyl ester, (15α,16E)-C21H24N2O3352
NB2422.3148.181,2-Benzenedicarboxylic acid, diisooctyl esterC24H38O4390
NB2523.622.08SqualeneC30H50410
NB2623.920.2224,25-DihydroxycholecalciferolC27H44O3416
NB2724.290.76Corynan-17-ol, 18,19-didehydro-10-methoxy-, acetate (ester)C22H28N2O3368
NB2825.00.549,12,15-Octadecatrienoic acid, 2,3-bis[(trimethylsilyl)oxy]propyl ester, (Z,Z,Z)-C27H52O4Si2496
NB2926.045.91AzafrinC27H38O4426
NB3027.80.13Butanoic acid,1a,2,5,5a,6,9,10,10a-octahydro-5,5a-di hydroxy-4-(hydroxymethyl)-1,1,7,9-tetra methyl-11-oxo-1H-2,8a-methanocyclop enta[a]cyclopropa[e]cyclodecen-6-yl esterC24H34O6418
Compounds written in bold characters were used for molecular docking; NB: n-butanol fraction, RT: retention time, *: describe spatial configuration.
Table 8. Compounds identified in the GC-MS analysis of the ethyl acetate fraction of B. indica.
Sr. NoRTAreaCompoundMolecular FormulaMolecular Weight
EA112.00.15Octadecane, 3-ethyl-5-(2-ethylbutyl)-C26H54366.70
EA212.800.59IlludolC15H24O3252.35
EA313.453.16HexadecaneC16H34226.44
EA414.290.952-Naphthalenemethanol, decahydro-α,α,4a-trimethyl-8-methylene-, [2R-(2α,4aα,8aα)]-C15H26O222.36
EA515.021.58Isoaromadendrene epoxideC15H24O220.35
EA615.530.40Alpha-Santanol acetateC17H26O2262.38
EA716.100.1217-PentatriaconteneC35H70490.93
EA816.440.46Acetate, [6-(acetyloxy)-5,5,8a-trimethyl-2-methyleneperhydro-1-naphthalenyl]methyl esterC19H30O4322.00
EA917.0612.11Bicyclo[2.2.2]octa-2,5-diene, 1,2,3,6-tetramethyl-C12H18162.27
EA1017.612.975-Hydroxymethyl-1,1,4a-trimethyl-6-methylenedecahydronaphthalen-2-olC15H26O2238.37
EA1117.893.36Benzene, hexamethyl-C12H18162.27
EA1219.011.05GitoxigeninC23H34O5390.50
EA1319.5655.804,4-Dimethyladamantan-2-olC12H20O180.29
EA1420.170.11Androst-4-en-3-one, 9-fluoro-11,17-dihydroxy-17-methyl-, (11α,17α)-C20H29FO3336.40
EA1520.621.65Methyl 3-(acetyloxy)-7,12-dioxocholan-24-oateC27H40O6460.00
EA1621.010.73Agathic acidC20H30O4334.40
EA1722.275.581,2-Benzenedicarboxylic acid, diisooctyl esterC24H38O4390.00
EA1822.980.482,7-Diphenyl-1,6-dioxopyridazino[4,5:2′,3′]pyrrolo [4′,5′-d]pyridazineC20H13N5O2355.30
EA1923.980.679-Octadecene, 1-[2-(octadecyloxy)ethoxy]-C38H76O2565.00
EA2024.430.175aH-3a,12-methano-1H-cyclopropa[5′,6′]cyclodeca [1′,2′:1,5]cyclopenta[1,2-d][1,3]dioxol-13-one, 1a,2,3,9,12,12a-hexahydro-9-hydroxy-10 -(hydroxymethyl)-1,1,3,5,7,7-hexamethyl-, [1aR-(1aα,3α,3aα,5aα,8aR*,9α,12α,12aα)]-C23H32O5388.50
EA2124.430.17BetulinC30H50O2442.70
EA2224.720.1324,25-DihydroxycholecalciferolC27H44O3416.00
EA2325.862.47StigmasterolC29H48O412.70
EA2426.630.632,2,3,5,5-Pentachloro-7,7-bis(chloromethyl)-1 (dichloromethyl)bicyclo[2.2.1]heptaneC10H9Cl9448.20
EA2527.300.689,12,15-Octadecatrienoic acid, 2,3-bis[(trimethylsilyl)oxy]propyl ester, (Z,Z,Z)-C27H52O4Si2496.90
Compounds written in bold characters were used for molecular docking; EA: ethyl acetate fraction, RT: retention time, *: describe spatial configuration.
Table 9. Compounds identified in the GC-MS analysis of the n-hexane fraction of B. indica.
Sr. NoRTAreaCompoundMolecular FormulaMolecular Weight
NH14.250.545-MethylfurfuralC6H6O2110.11
NH28.1316.942-Methoxy-4-vinylphenolC9H10O2150.17
NH310.162.594-(2,6,6-Trimethylcyclohexa-1,3-dienyl)but-3-en-2-oneC13H18O190.28
NH411.312.99MegastigmatrienoneC13H18O190.28
NH512.230.65Ar-turmeroneC15H20O216.31
NH615.061.58Hexadecanoic acid, methyl esterC17H34O2270.45
NH715.254.41n-Hexadeconic acidC16H32O2256.42
NH815.910.28Hexadeconic acid, ethyl esterC18H36O2284.47
NH917.261.099,12-Octadecadienoic acid, methyl esterC19H34O2294.47
NH1017.352.919,12,15-Octadecatrienoic acidC18H30O2278.40
NH1117.968.589,12,15-Octadecatrien-1-ol, (Z,Z,Z)-C18H32O264.44
NH1218.180.59Linoleic acid ethyl esterC20H36O2308.49
NH1318.260.89Ethyl OleateC20H38O2310.51
NH1423.690.491,2-Benzenedicarboxylic acid, monopentyl esterC13H16O4236.26
Compounds written in bold characters were used for molecular docking; RT: retention time, NH: n-hexane fraction.
Table 10. Zone of inhibition of the B. indica extracts.
FractionsConc.B. subtilisS. aureusP. aeruginosaS. typhiE. coli
(mg/mL)Mm
n-Hexane10610.58.5610.5
3012998.515
10011.5149.5912.5
Dichloromethane1097.57.54.54
309.5118913
100131211.510.513
Ethyl acetate10109.58.585
3015.511.599.58.5
1001314.510.59.527
n-Butanol1098599.5
3010.597.54.511.5
1001310.511.51114
Aqueous107.59.58.59.59.5
30813.5775.5
100nil9.57.56.59
Crude10118.5758.5
301194.5810.5
10014.5119812.5
Ceftriaxone115167.51115.5
Table 11. Minimum inhibitory concentration of the B. indica extracts.
FractionsB. subtilisS. aureusP. aeruginosaS. typhiE. coli
mg/mL
n-Hexane>100>100>100>100Nil
Dichloromethane3.917.813.9162.531.25
Ethyl acetate1.953.913.917.813.91
n-Butanol3.9131.253.9131.253.91
Aqueous31.2562.531.2562.562.5
Crude31.2531.2531.2562.562.5
Ceftriaxone1.953.910.980.987.81
Table 12. Molecular docking scores of the n-butanol, ethyl acetate, and n-hexane fractions with the targeted proteins.
CompoundsB. subtilisE. coliP. aeruginosaS. aureusS. typhi
kcal/mol
NB1−6.6−7.3−8.0−7.5−7.5
NB7−5.7−7.4−7.4−7.0−6.4
NB26−7.2−6.6−8.4−7.8−7.3
NB27−6.3−6.5−7.8−7.3−7.5
EA10−5.7−5.4−6.3−7.2−6.2
EA12−7.5−7.5−8.4−7.8−8.6
EA15−6.6−7.1−8.8−8.0−8.3
EA16−6.6−7.1−7.6−7.3−7.5
EA17−4.2−4.4−5.3−6.4−5.6
EA18−8.2−8.5−9.1−9.2−9.4
EA20−7.5−7.4−8.7−8.1−9.3
EA21−7.4−6.6−7.5−7.7−8.6
EA22−6.8−6.0−7.3−7.4−7.0
EA23−7.5−7.1−8.3−7.8−8.1
NH1−4.2−4.5−4.8−4.6−4.2
NH2−4.8−5.5−5.9−5.5−5.0
NH3−5.5−5.9−6.4−6.4−5.5
NH4−5.8−6.1−6.8−6.7−5.8
NH14−5.0−6.2−6.4−5.8−5.3
Disclaimer/Publisher’s Note: The statements, opinions and data contained in all publications are solely those of the individual author(s) and contributor(s) and not of MDPI and/or the editor(s). MDPI and/or the editor(s) disclaim responsibility for any injury to people or property resulting from any ideas, methods, instructions or products referred to in the content.