
Divergent Metabolic Changes in Rhizomes of Lowland and Upland Switchgrass (Panicum virgatum) from Early Season through Dormancy Onset

 , , and
Abstract
1. Introduction
2. Results
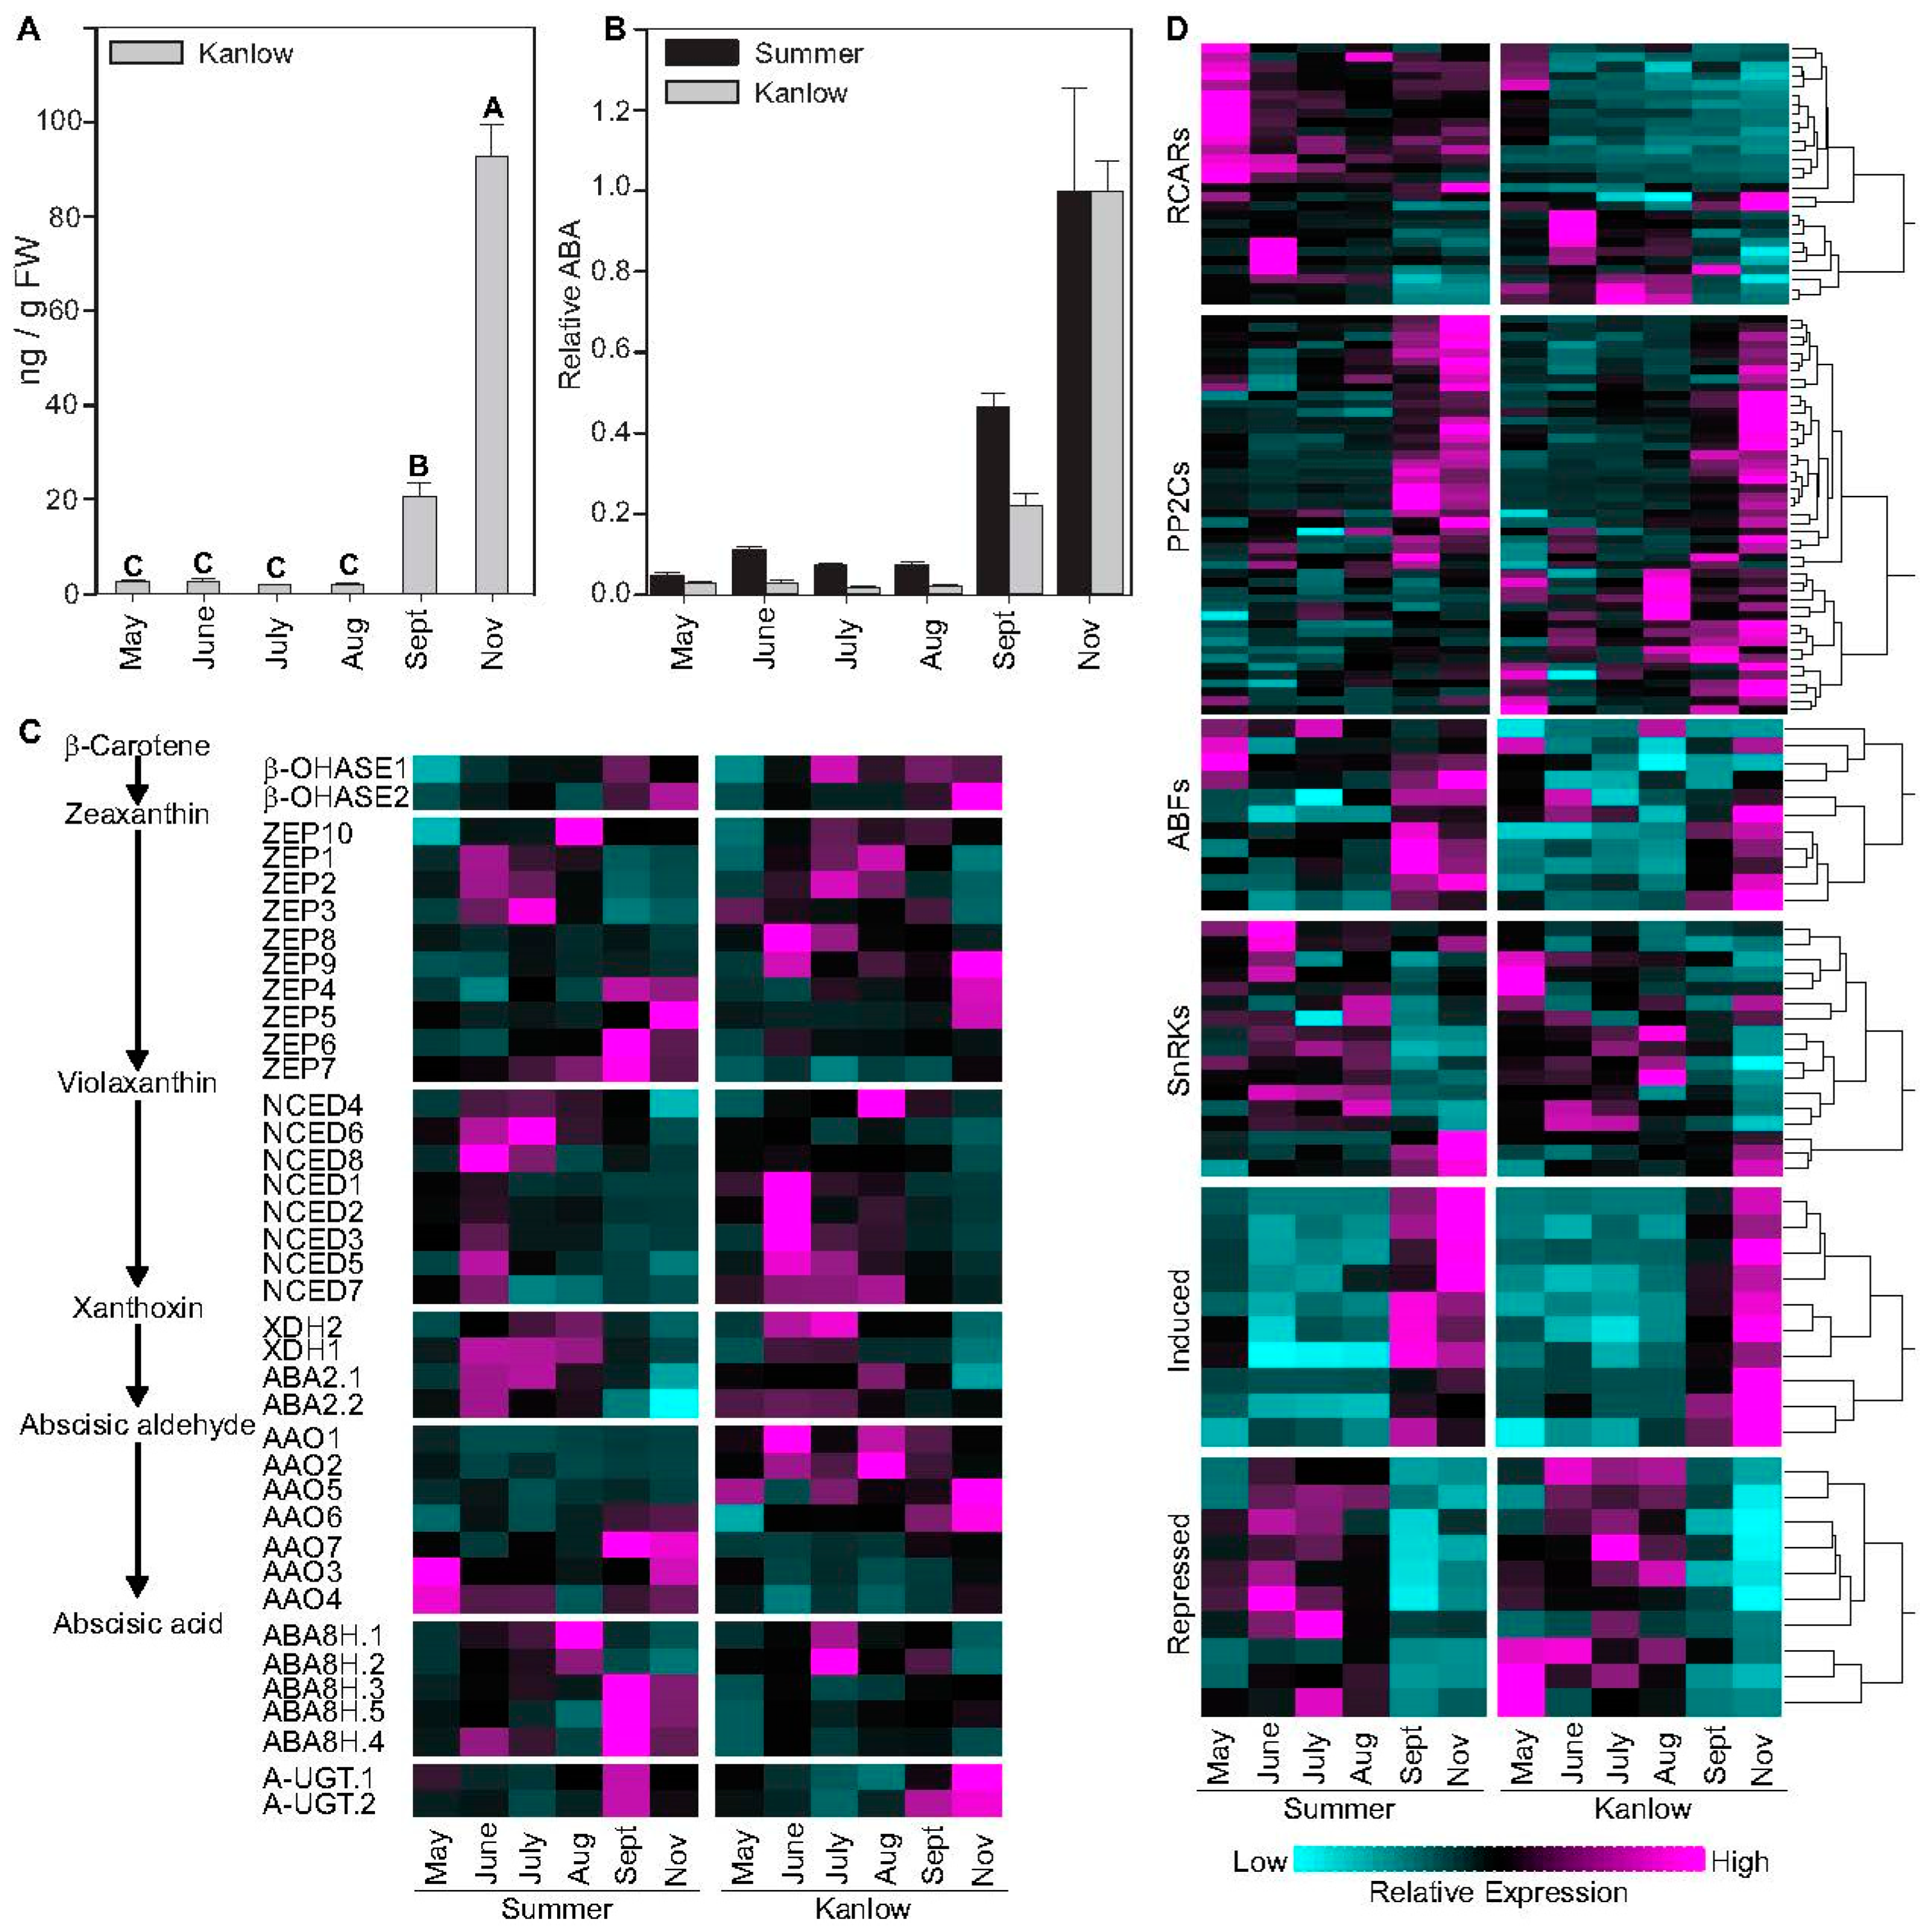
2.1. ABA Levels and ABA Influenced Genes Increased in Tandem with Progression to Dormancy
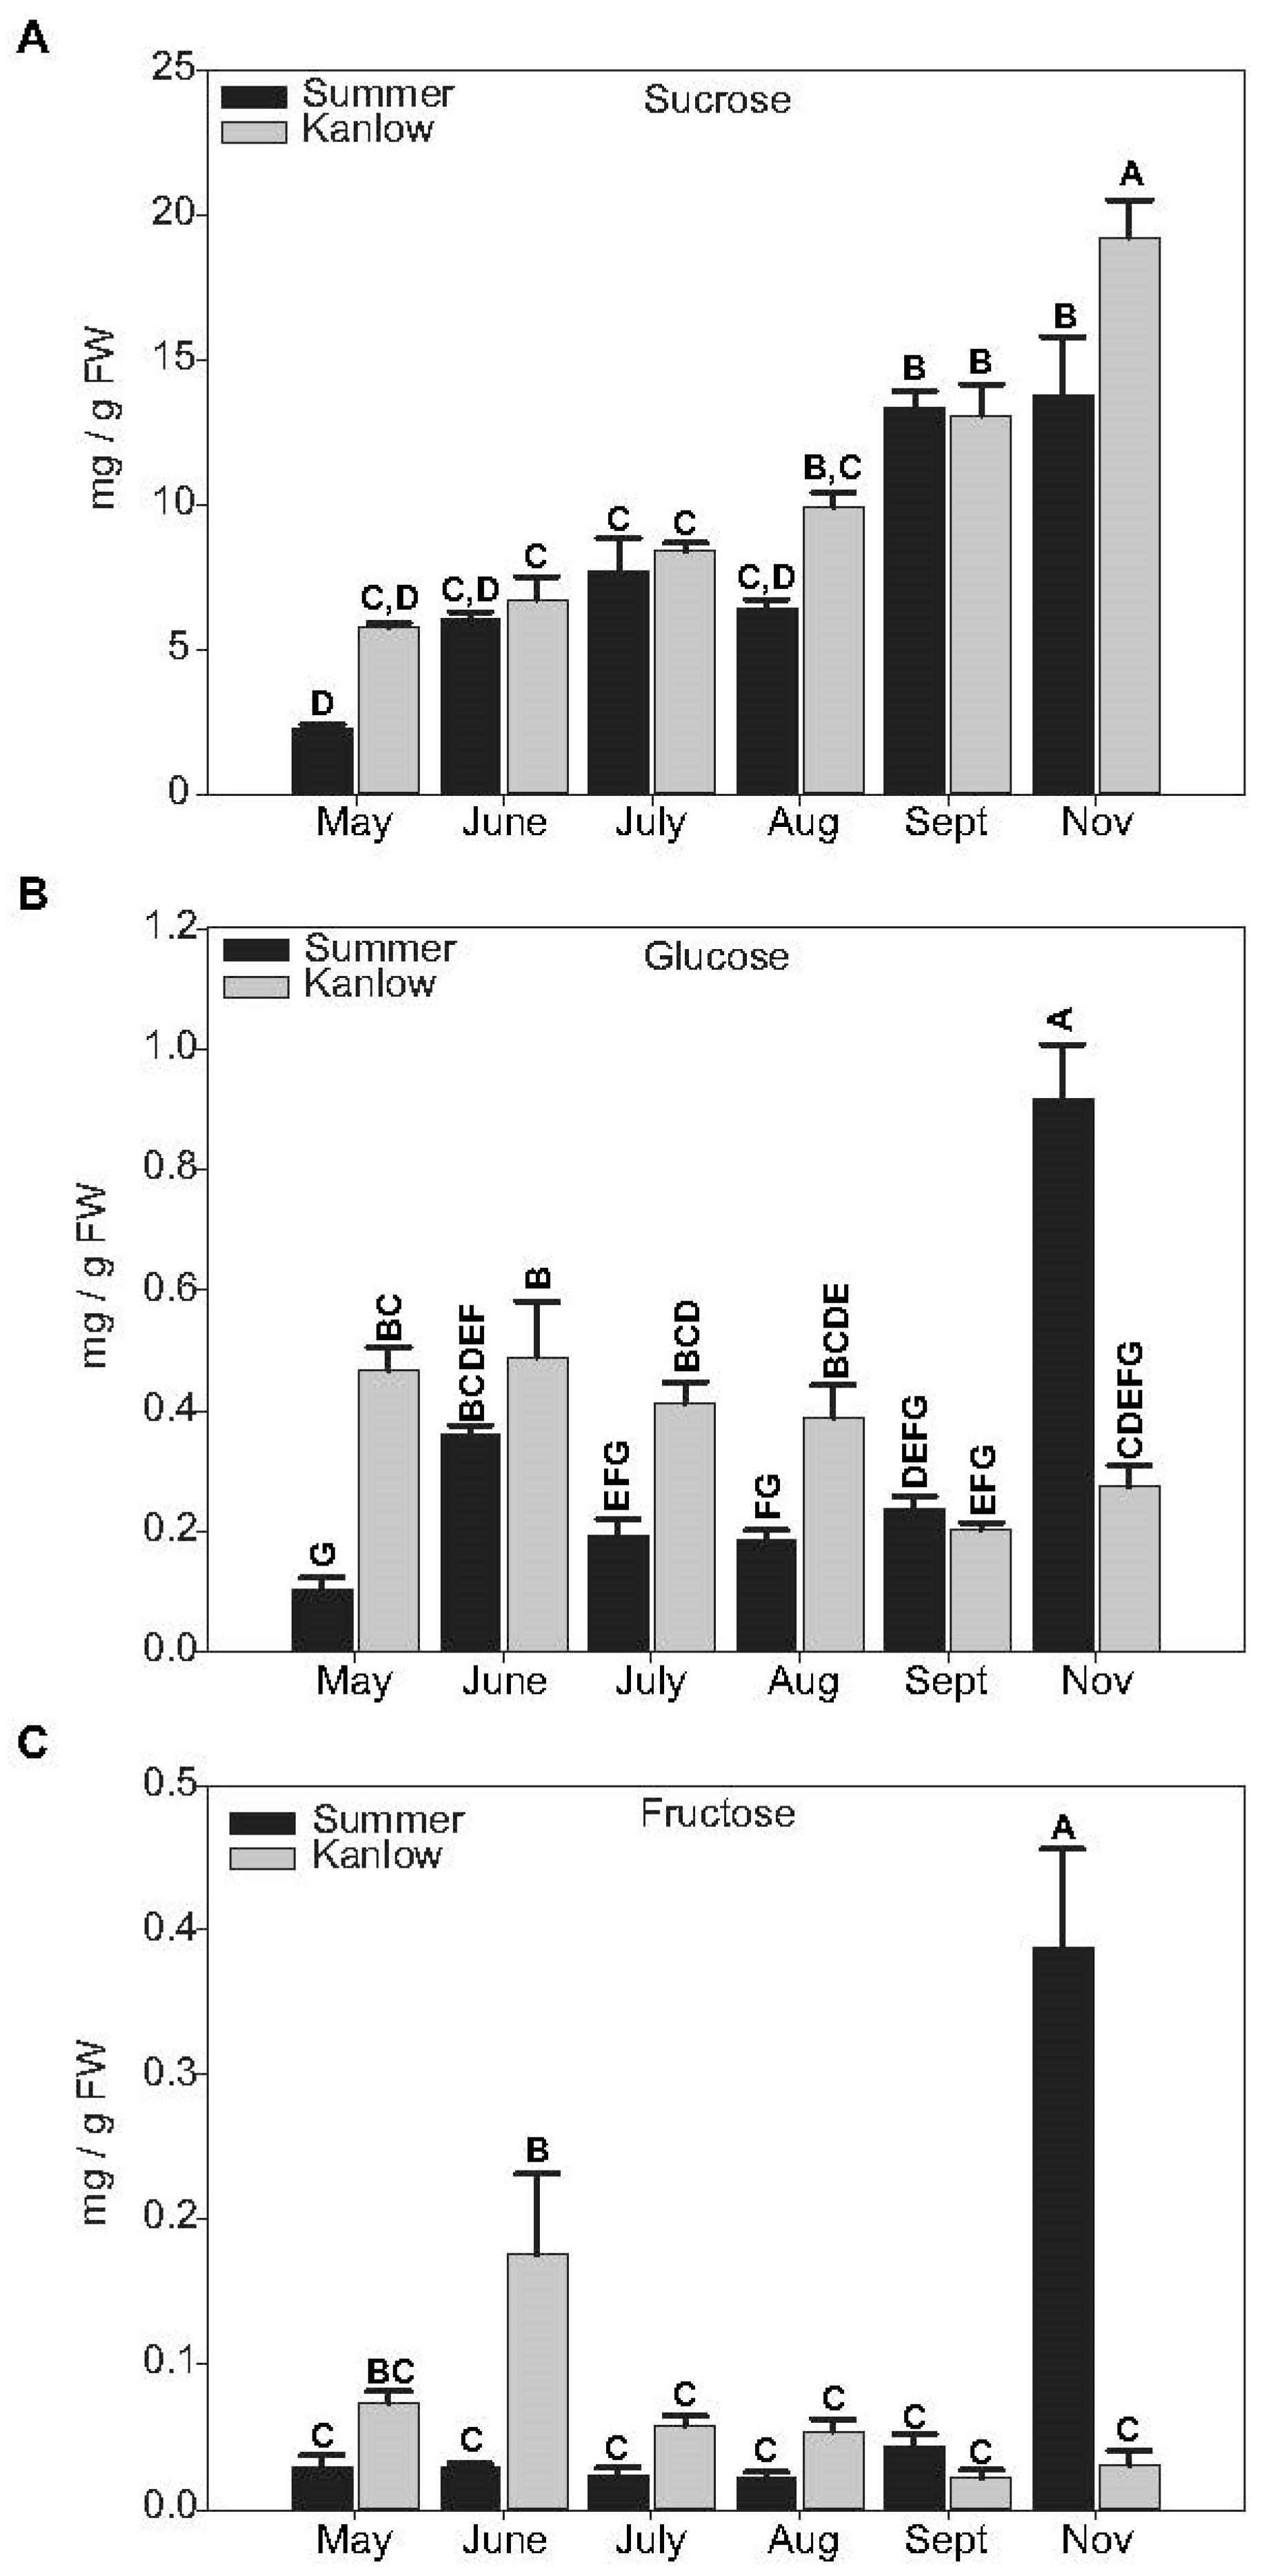
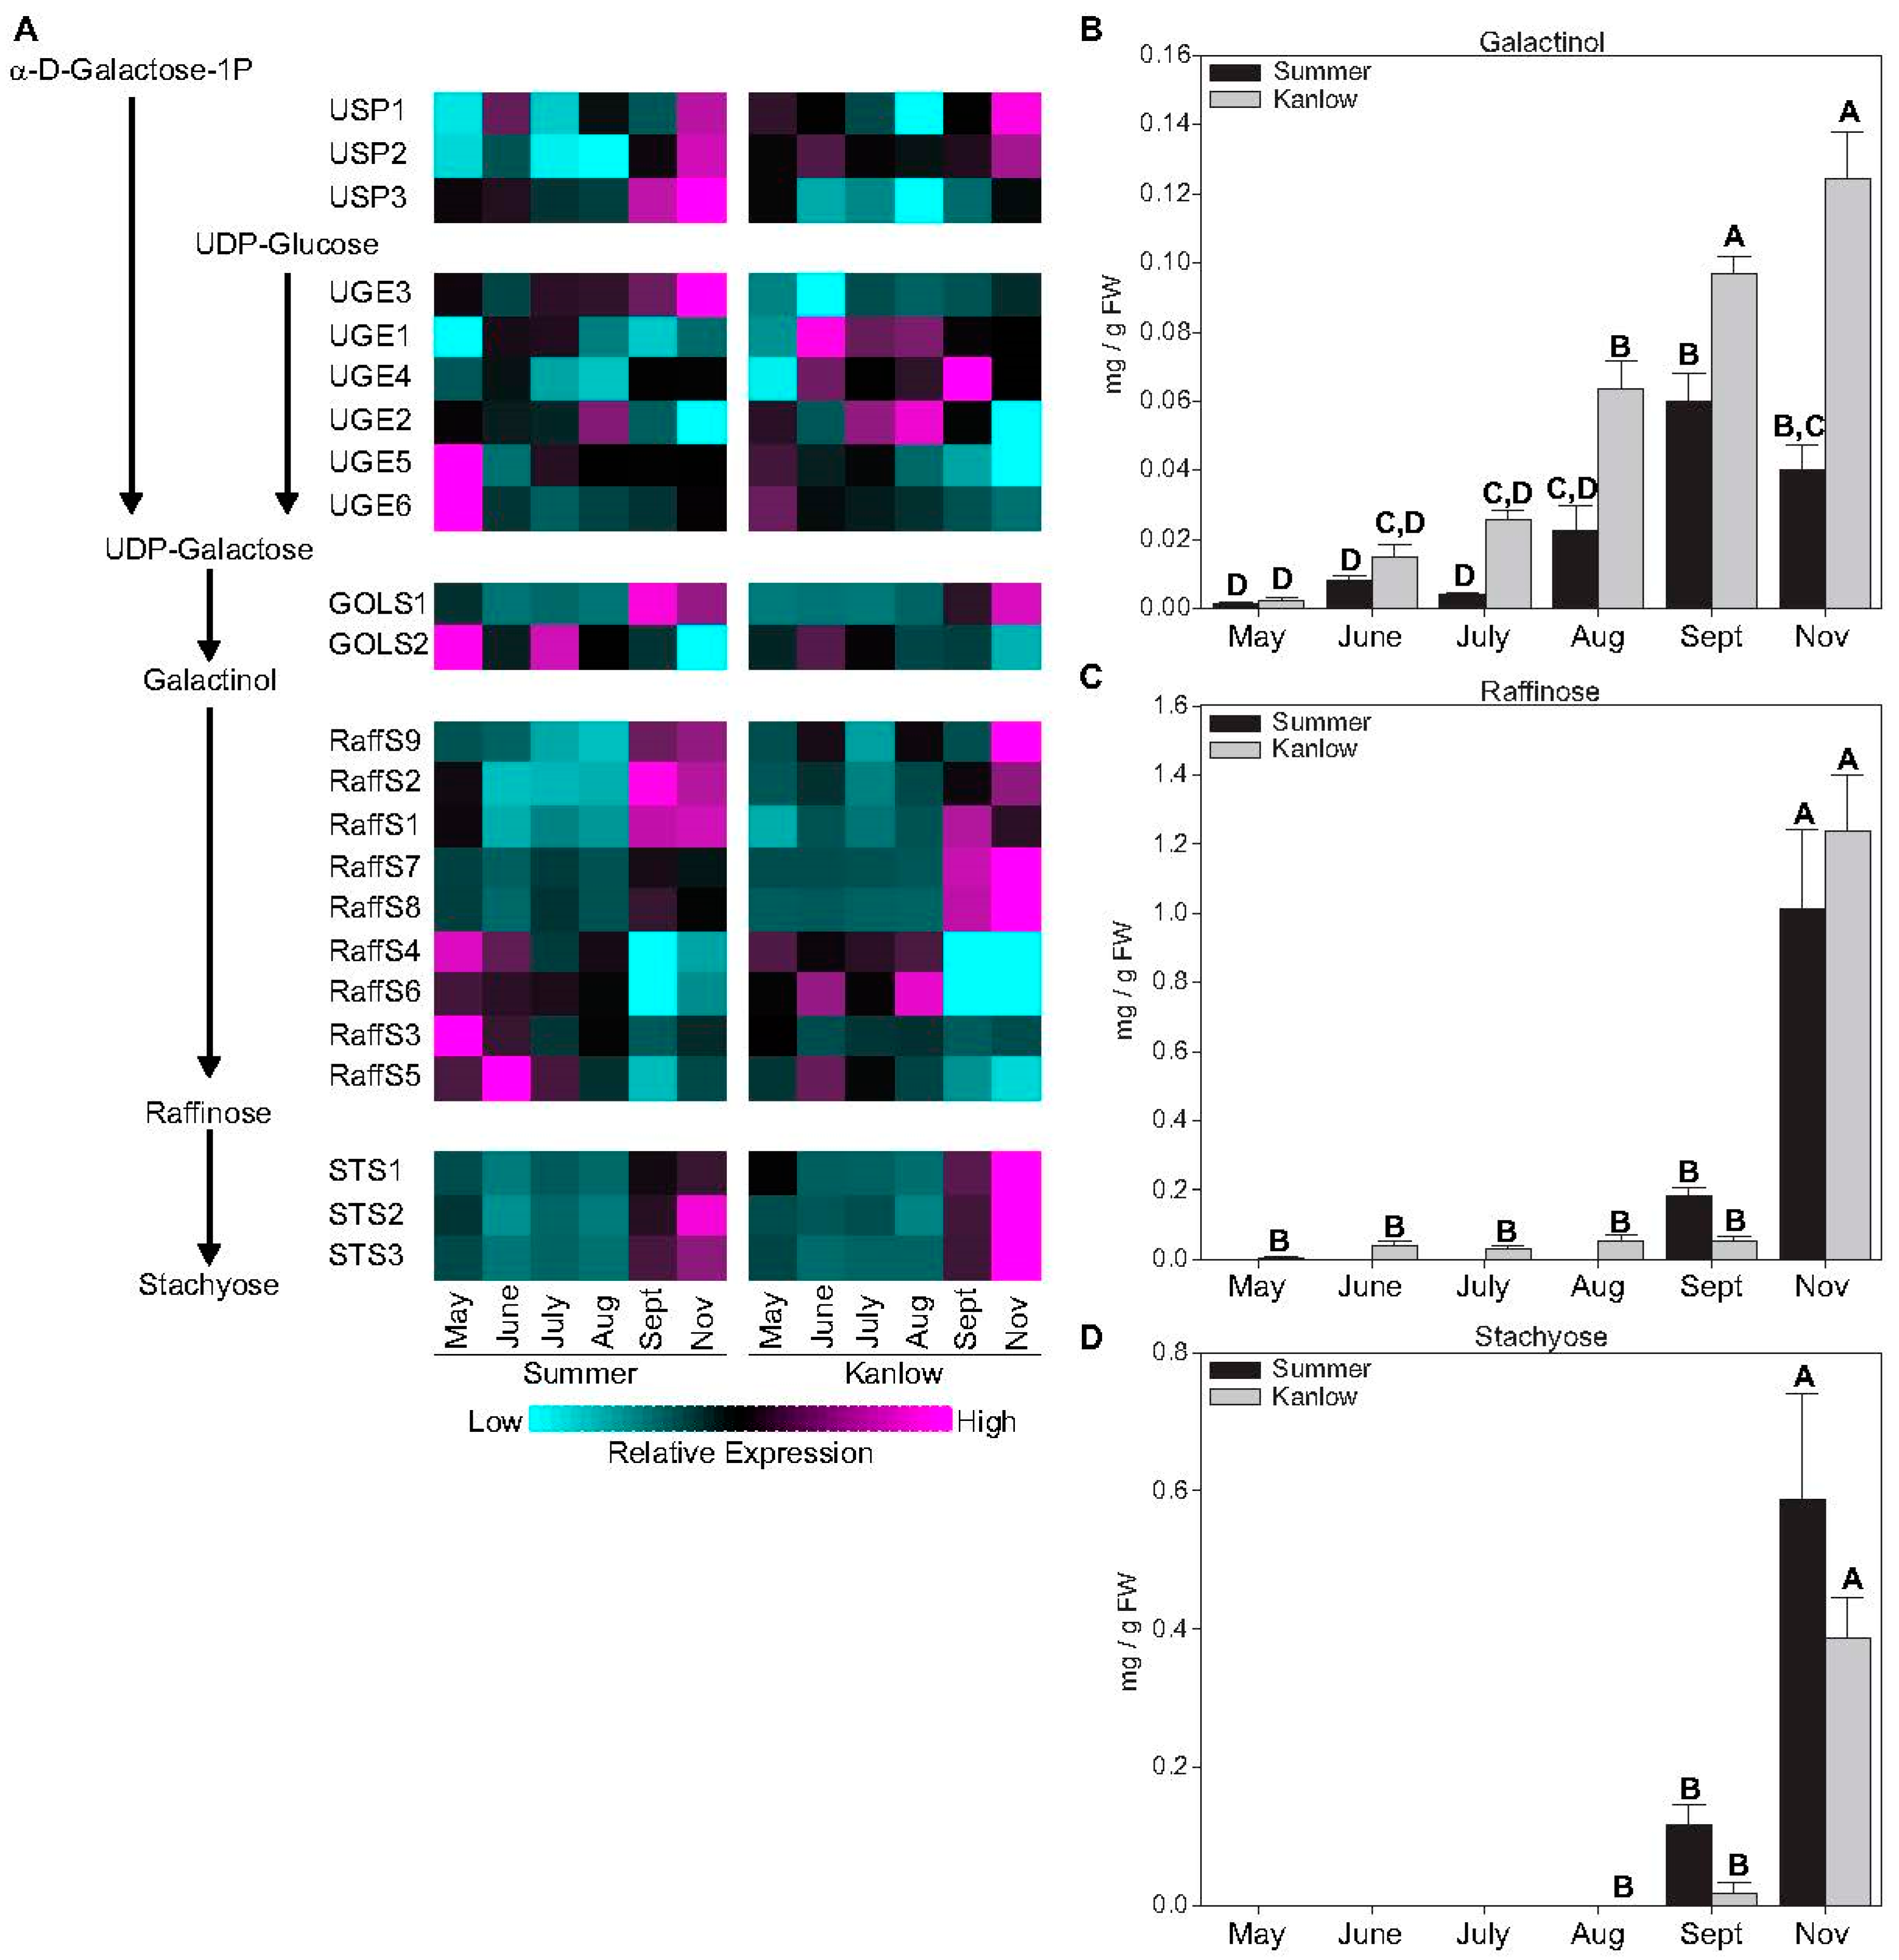
2.2. Sucrose and Raffinose-Family Oligosaccharides Levels Tracked with Transition to Dormancy
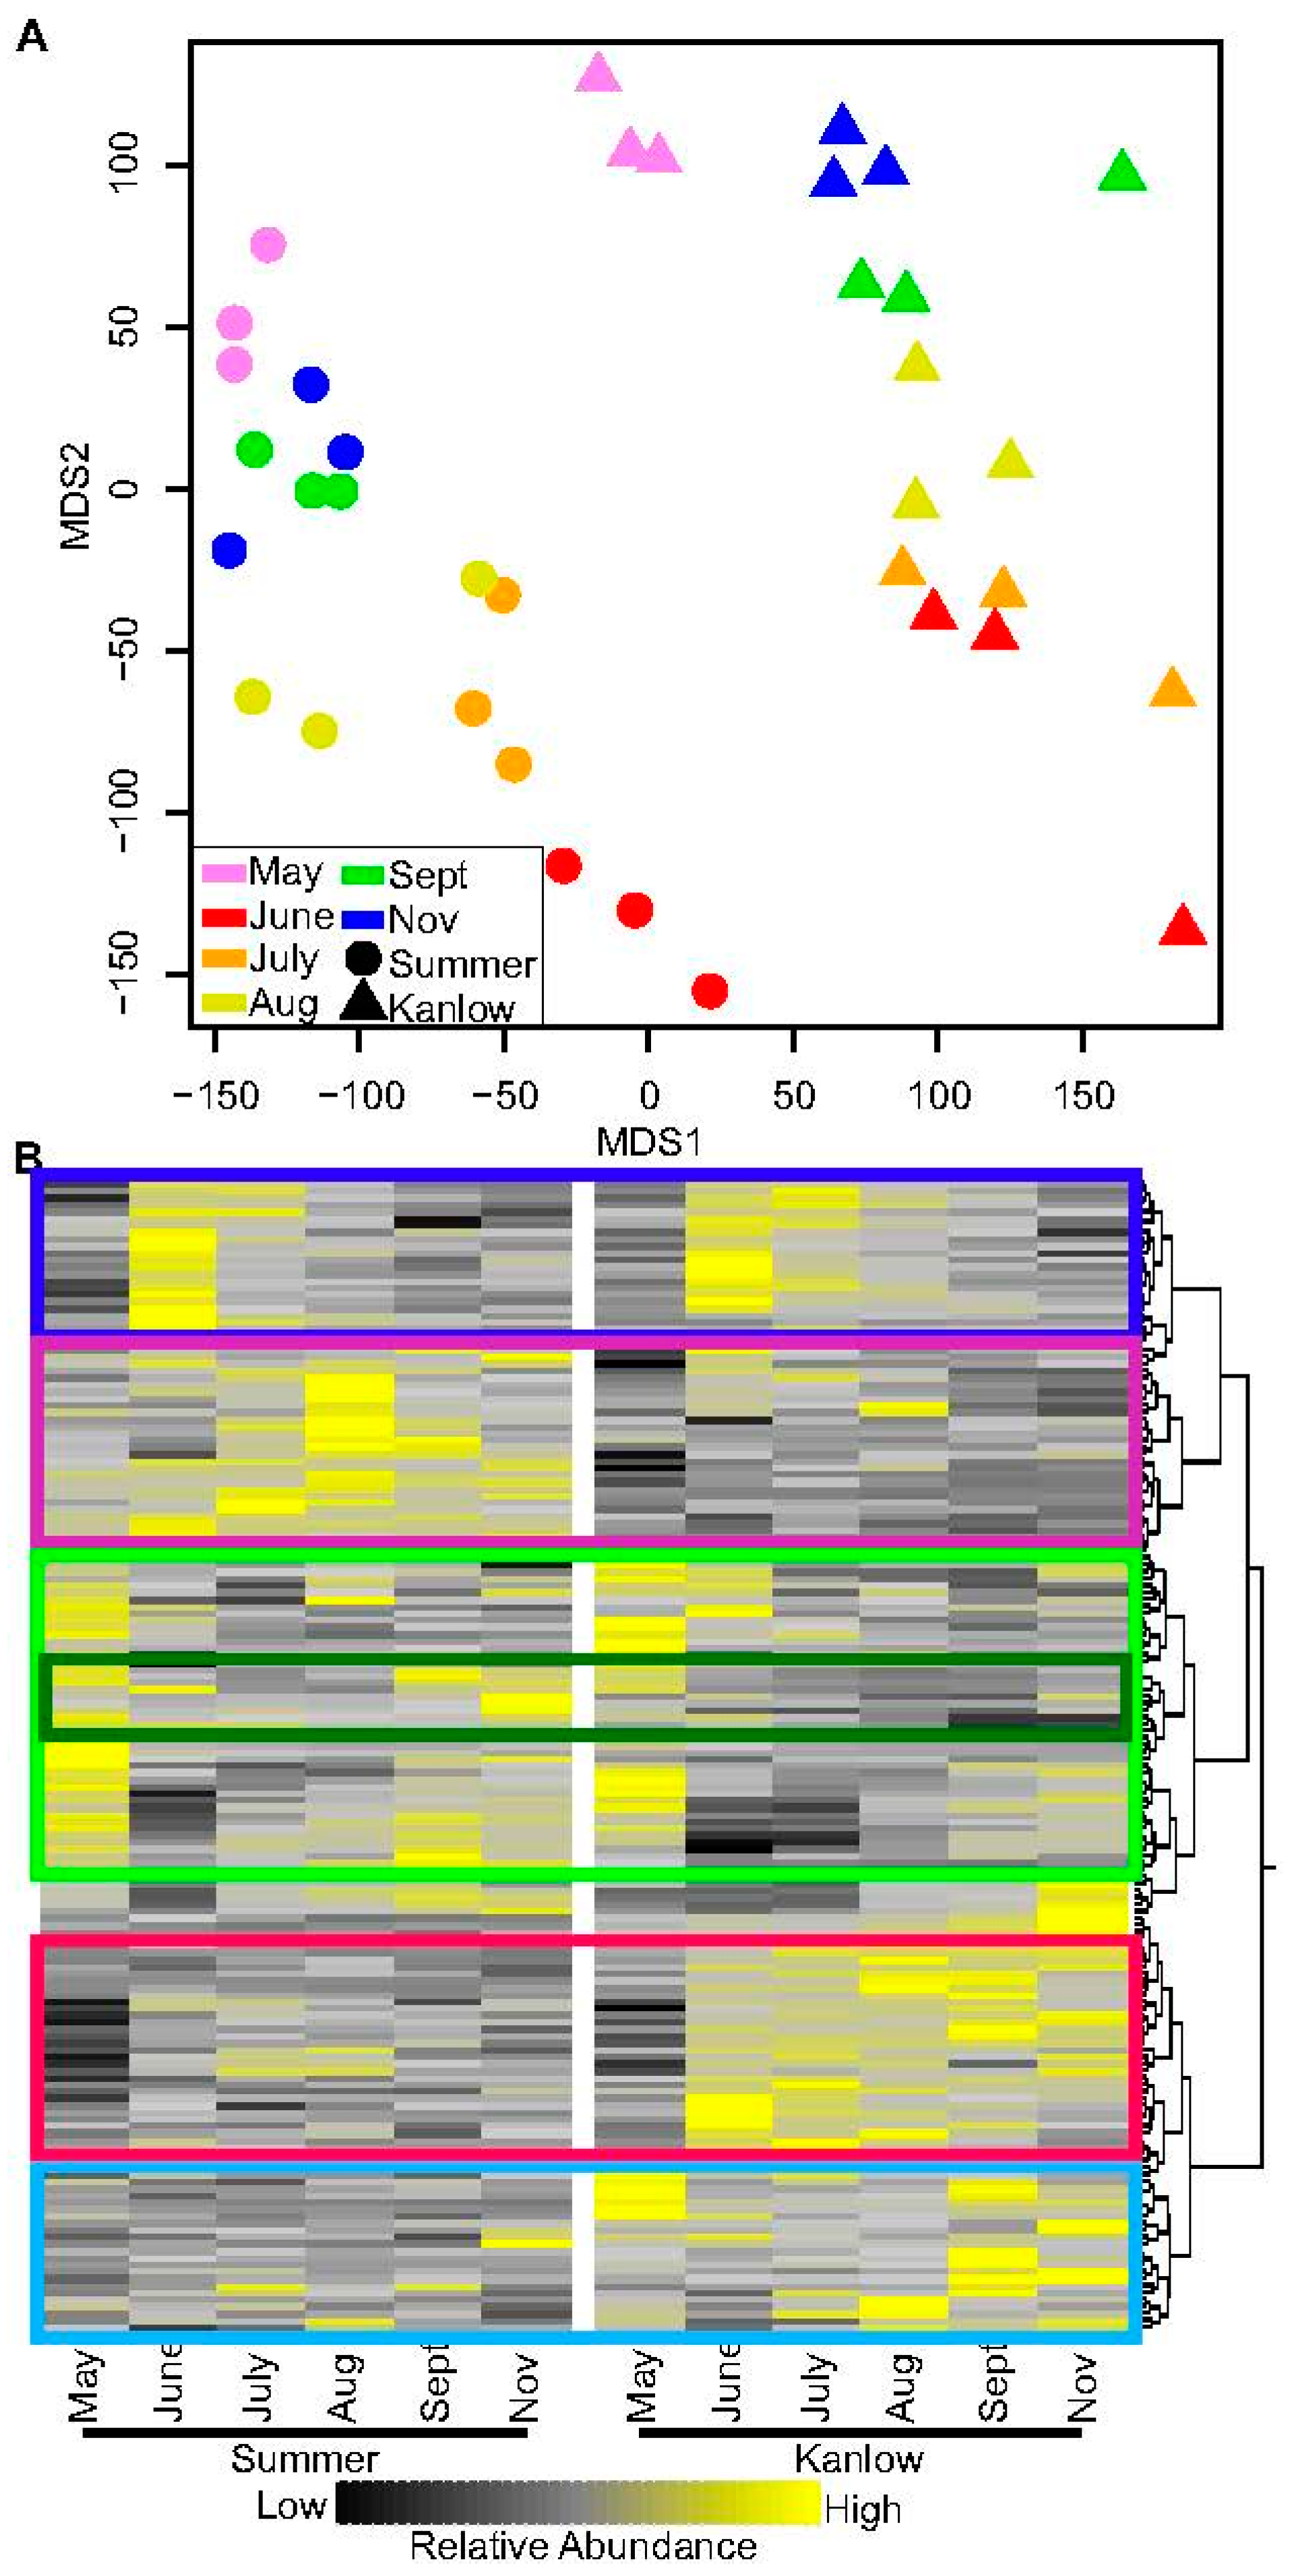
2.3. Metabolite Levels Differentiate Summer and Kanlow Rhizomes
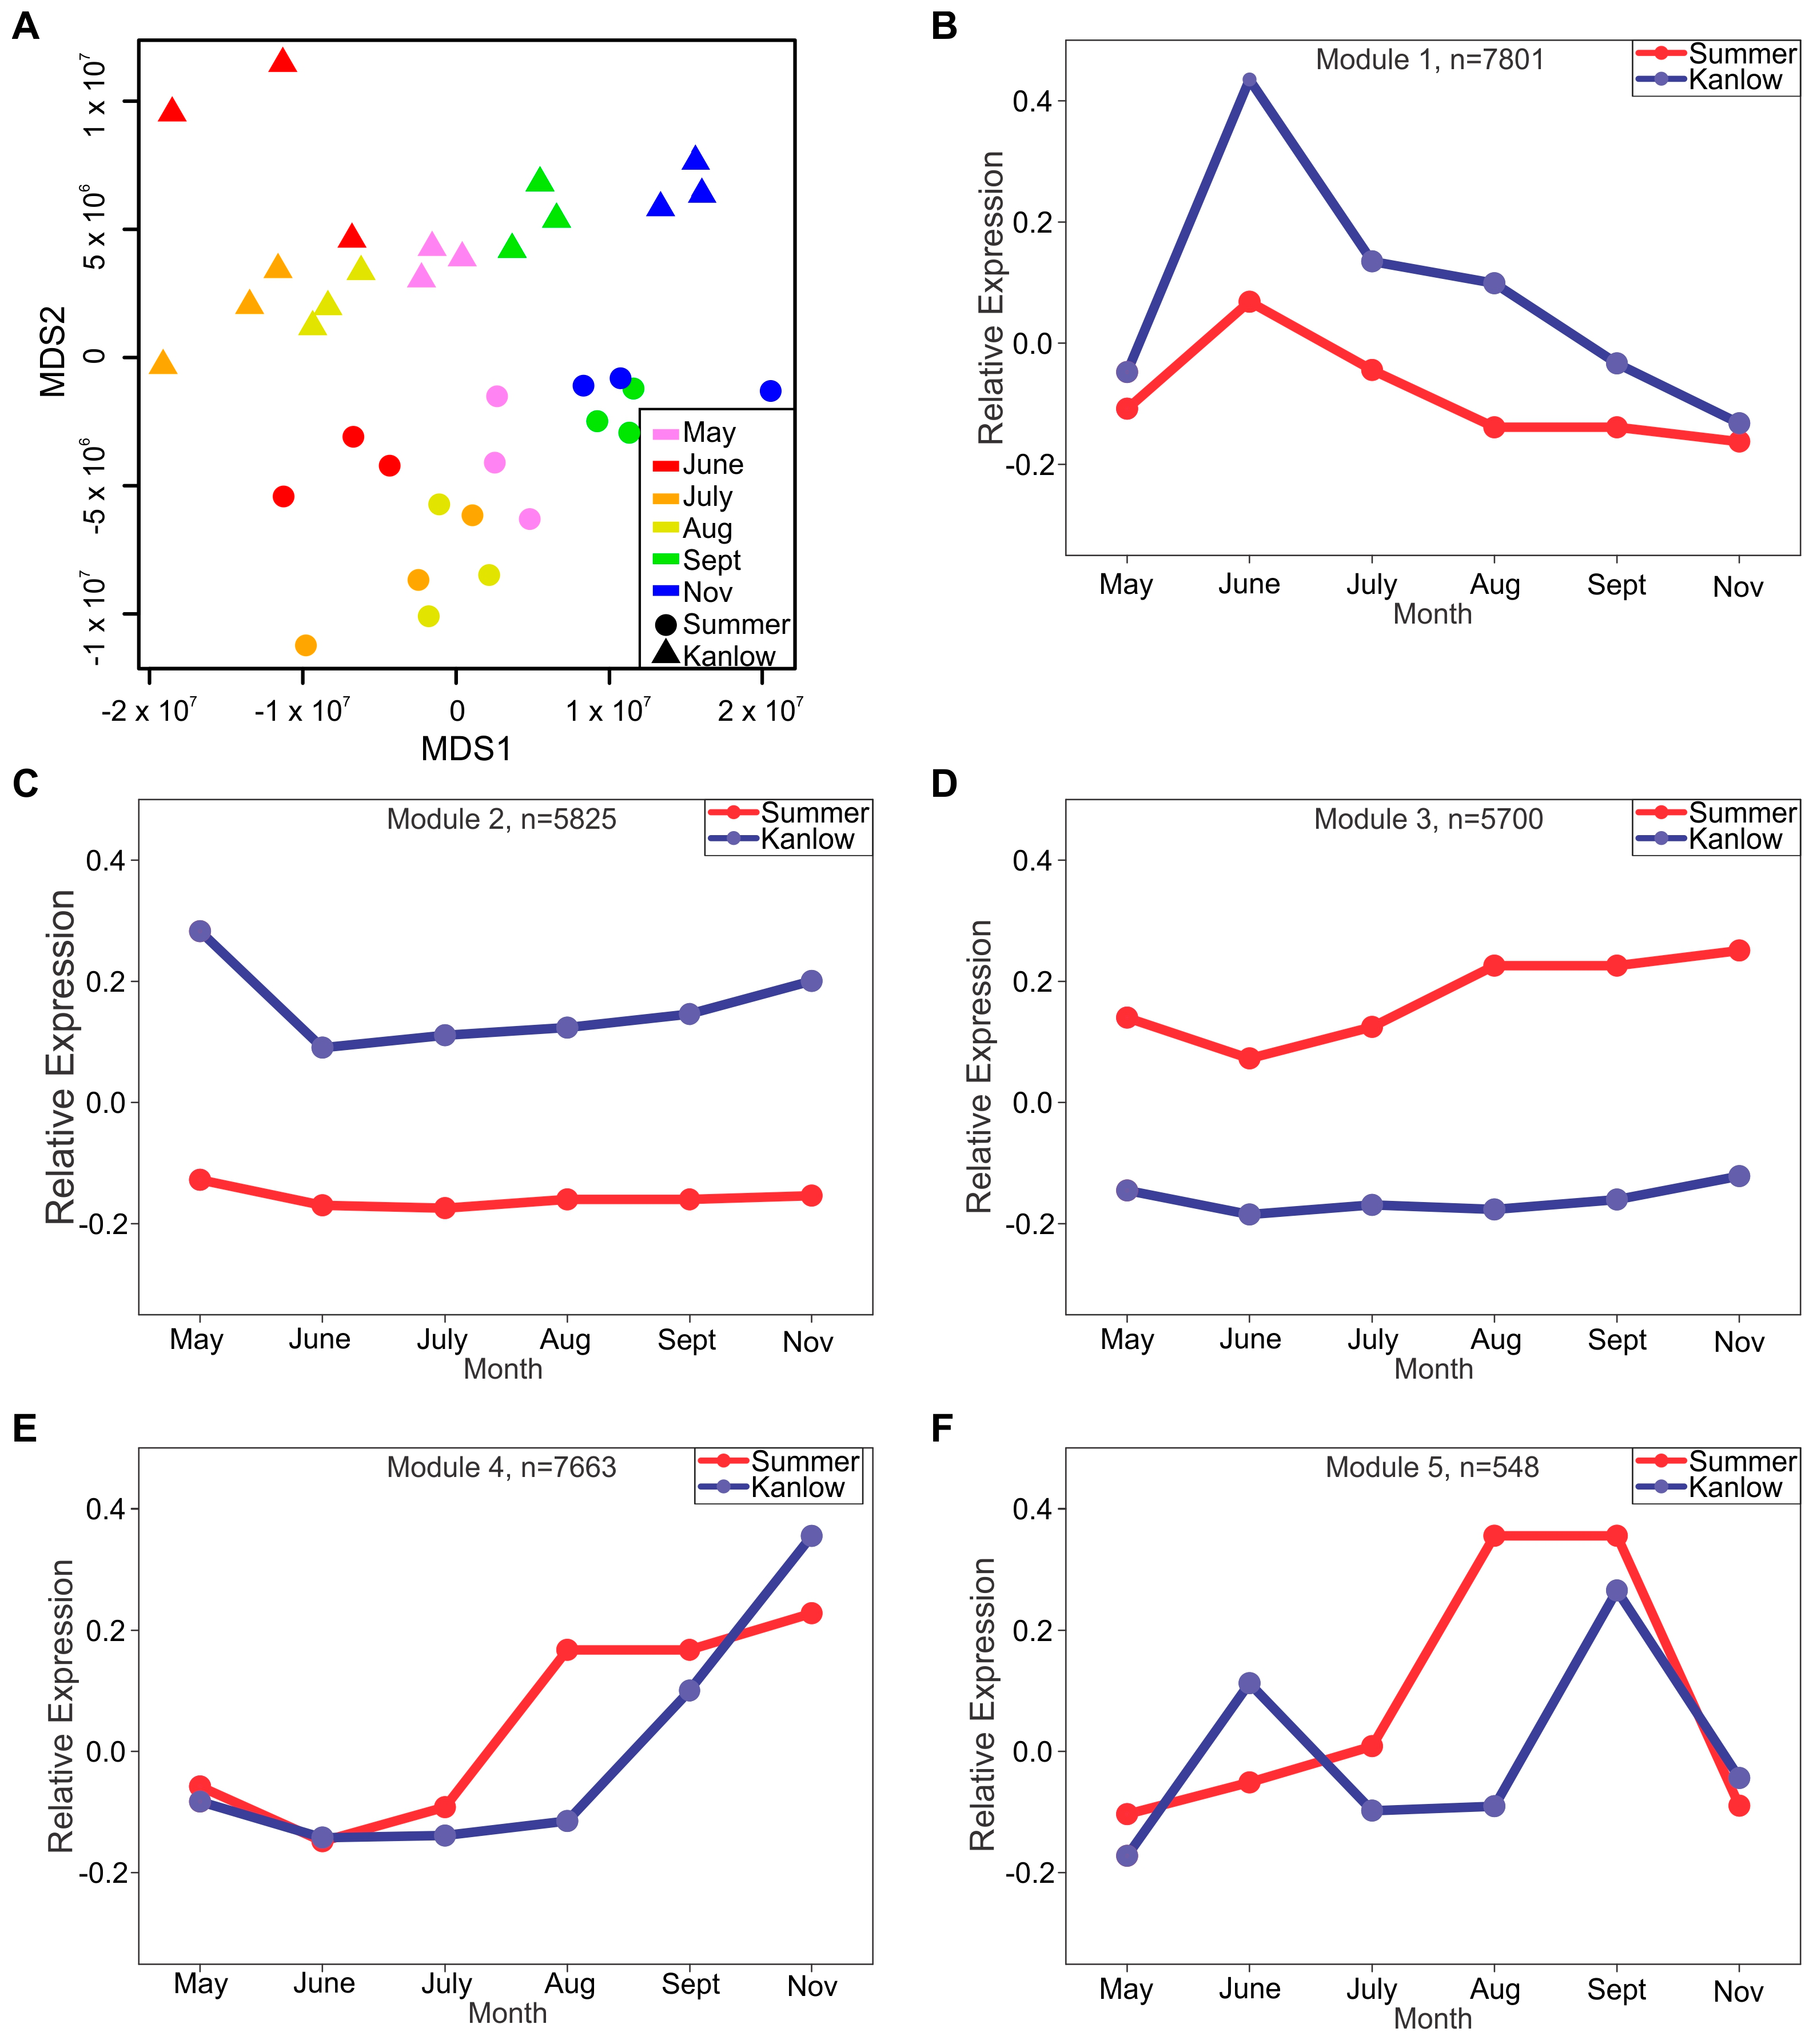
2.4. Kanlow and Summer Transcriptomes Were Differentiated over the Growing Season
2.5. Transporter Gene Families Were More Abundant in Specific Modules
2.6. Transcription Factors Were Differentially Enriched in Modules 1–5
3. Discussion
4. Materials and Methods
4.1. Plant Growth and Sampling
4.2. Transcriptomics
4.3. Metabolite Analyses
4.4. Water Soluble Carbohydrates (WSC)
4.5. Galactinol Analysis
4.6. Bioinformatic and Statistical Analyses
Supplementary Materials
Author Contributions
Funding
Data Availability Statement
Acknowledgments
Conflicts of Interest
References
- Casler, M.D.; Vogel, K.P.; Lee, D.K.; Mitchell, R.B.; Adler, P.R.; Sulc, R.M.; Johnson, K.D.; Kallenbach, R.L.; Boe, A.R.; Mathison, R.D.; et al. 30 Years of Progress toward Increased Biomass Yield of Switchgrass and Big Bluestem. Crop Sci. 2018, 58, 1242–1254. [Google Scholar] [CrossRef]
- Bartley, L.; Wu, Y.; Saathoff, A.; Sarath, G. Switchgrass Genetics and Breeding Challenges; John Wiley and Sons: Hoboken, NJ, USA, 2013; pp. 7–31. [Google Scholar] [CrossRef]
- Casler, M.D.; Vogel, K.P. Selection for Biomass Yield in Upland, Lowland, and Hybrid Switchgrass. Crop Sci. 2014, 54, 626–636. [Google Scholar] [CrossRef]
- Vogel, K.P.; Sarath, G.; Saathoff, A.J.; Mitchell, R.B. Switchgrass. Energy Crops 2011, 3, 341–380. [Google Scholar]
- Vogel, K.P.; Schmer, M.R.; Mitchell, R.B. Plant Adaptation Regions: Ecological and Climatic Classification of Plant Materials. Rangel. Ecol. Manag. 2005, 58, 315–319. [Google Scholar] [CrossRef]
- Casler, M.D.; Vogel, K.P.; Taliaferro, C.M.; Wynia, R.L. Latitudinal Adaptation of Switchgrass Populations. Crop Sci. 2004, 44, 293–303. [Google Scholar] [CrossRef]
- Poudel, H.P.; Sanciangco, M.D.; Kaeppler, S.M.; Buell, C.R.; Casler, M.D. Genomic Prediction for Winter Survival of Lowland Switchgrass in the Northern USA. G3 Genes Genomes Genet. 2019, 9, 1921–1931. [Google Scholar] [CrossRef]
- Evans, J.; Sanciangco, M.D.; Lau, K.H.; Crisovan, E.; Barry, K.; Daum, C.; Hundley, H.; Jenkins, J.; Kennedy, M.; Kunde-Ramamoorthy, G.; et al. Extensive Genetic Diversity is Present within North American Switchgrass Germplasm. Plant Genome 2018, 11, 170055. [Google Scholar] [CrossRef] [PubMed]
- Vishwakarma, K.; Upadhyay, N.; Kumar, N.; Yadav, G.; Singh, J.; Mishra, R.K.; Kumar, V.; Verma, R.; Upadhyay, R.G.; Pandey, M.; et al. Abscisic Acid Signaling and Abiotic Stress Tolerance in Plants: A Review on Current Knowledge and Future Prospects. Front. Plant Sci. 2017, 8, 161. [Google Scholar] [CrossRef]
- Howe, G.T.; Horvath, D.P.; Dharmawardhana, P.; Priest, H.D.; Mockler, T.C.; Strauss, S.H. Extensive Transcriptome Changes During Natural Onset and Release of Vegetative Bud Dormancy in Populus. Front. Plant Sci. 2015, 6, 989. [Google Scholar] [CrossRef]
- Palmer, N.A.; Saathoff, A.J.; Scully, E.D.; Tobias, C.M.; Twigg, P.; Madhavan, S.; Schmer, M.; Cahoon, R.; Sattler, S.E.; Edmé, S.J.; et al. Seasonal below-ground metabolism in switchgrass. Plant J. Cell Mol. Biol. 2017, 92, 1059–1075. [Google Scholar] [CrossRef] [PubMed]
- Sarath, G.; Baird, L.M.; Mitchell, R.B. Senescence, dormancy and tillering in perennial C4 grasses. Plant Sci. 2014, 217, 140–151. [Google Scholar] [CrossRef]
- Vogel, K.P.; Mitchell, R.B.; Casler, M.D.; Sarath, G. Registration of ‘Liberty’ Switchgrass. J. Plant Regist. 2014, 8, 242–247. [Google Scholar] [CrossRef]
- Edmé, S.J.; Palmer, N.A.; Sarath, G.; Muhle, A.A.; Mitchell, R.; Yuen, G. Genetic Resistance of Switchgrass to Rust Evaluated in a Composite Upland × Lowland Population in Lab and Field Settings. Agronomy 2022, 12, 3137. [Google Scholar] [CrossRef]
- Edmé, S.; Mitchell, R. Genetic Analysis of Yield and Quality Traits in Switchgrass Based on Population Crosses. Agronomy 2021, 11, 2220. [Google Scholar] [CrossRef]
- Lim, J.; Lim, C.W.; Lee, S.C. Core Components of Abscisic Acid Signaling and Their Post-translational Modification. Front. Plant Sci. 2022, 13, 895698. [Google Scholar] [CrossRef]
- Zhang, M.; Zhu, C.; Duan, Y.; Liu, T.; Liu, H.; Su, C.; Lu, Y. The intrinsically disordered region from PP2C phosphatases functions as a conserved CO2 sensor. Nat. Cell Biol. 2022, 24, 1029–1037. [Google Scholar] [CrossRef]
- Lumba, S.; Toh, S.; Handfield, L.-F.; Swan, M.; Liu, R.; Youn, J.-Y.; Cutler, S.R.; Subramaniam, R.; Provart, N.; Moses, A.; et al. A Mesoscale Abscisic Acid Hormone Interactome Reveals a Dynamic Signaling Landscape in Arabidopsis. Dev. Cell 2014, 29, 360–372. [Google Scholar] [CrossRef]
- Theune, M.L.; Bloss, U.; Brand, L.H.; Ladwig, F.; Wanke, D. Phylogenetic Analyses and GAGA-Motif Binding Studies of BBR/BPC Proteins Lend to Clues in GAGA-Motif Recognition and a Regulatory Role in Brassinosteroid Signaling. Front. Plant Sci. 2019, 10, 466. [Google Scholar] [CrossRef] [PubMed]
- Poudel, H.P.; Tilhou, N.W.; Sanciangco, M.D.; Vaillancourt, B.; Kaeppler, S.M.; Buell, C.R.; Casler, M.D. Genetic loci associated with winter survivorship in diverse lowland switchgrass populations. Plant Genome 2021, 14, e20159. [Google Scholar] [CrossRef] [PubMed]
- Willick, I.R.; Lowry, D.B. Cold acclimation threshold induction temperatures of switchgrass ecotypes grown under a long and short photoperiod. Physiol. Plant. 2022, 174, e13812. [Google Scholar] [CrossRef]
- Hasan, M.M.; Liu, X.-D.; Waseem, M.; Guang-Qian, Y.; Alabdallah, N.M.; Jahan, M.S.; Fang, X.-W. ABA activated SnRK2 kinases: An emerging role in plant growth and physiology. Plant Signal. Behav. 2022, 17, 2071024. [Google Scholar] [CrossRef] [PubMed]
- Brookbank, B.P.; Patel, J.; Gazzarrini, S.; Nambara, E. Role of Basal ABA in Plant Growth and Development. Genes 2021, 12, 1936. [Google Scholar] [CrossRef]
- Fidler, J.; Graska, J.; Gietler, M.; Nykiel, M.; Prabucka, B.; Rybarczyk-Płońska, A.; Muszyńska, E.; Morkunas, I.; Labudda, M. PYR/PYL/RCAR Receptors Play a Vital Role in the Abscisic-Acid-Dependent Responses of Plants to External or Internal Stimuli. Cells 2022, 11, 1352. [Google Scholar] [CrossRef] [PubMed]
- Palmer, N.A.; Saathoff, A.J.; Tobias, C.M.; Twigg, P.; Xia, Y.; Vogel, K.P.; Madhavan, S.; Sattler, S.E.; Sarath, G. Contrasting Metabolism in Perenniating Structures of Upland and Lowland Switchgrass Plants Late in the Growing Season. PLoS ONE 2014, 9, e105138. [Google Scholar] [CrossRef] [PubMed]
- Salvi, P.; Varshney, V.; Majee, M. Raffinose family oligosaccharides (RFOs): Role in seed vigor and longevity. Biosci. Rep. 2022, 42, BSR20220198. [Google Scholar] [CrossRef]
- Sengupta, S.; Mukherjee, S.; Basak, P.; Majumder, A.L. Significance of galactinol and raffinose family oligosaccharide synthesis in plants. Front. Plant Sci. 2015, 6, 656. [Google Scholar] [CrossRef] [PubMed]
- Palmer, N.A.; Chowda-Reddy, R.V.; Muhle, A.A.; Tatineni, S.; Yuen, G.; Edmé, S.J.; Mitchell, R.B.; Sarath, G. Transcriptome divergence during leaf development in two contrasting switchgrass (Panicum virgatum L.) cultivars. PLoS ONE 2019, 14, e0222080. [Google Scholar] [CrossRef]
- Tiedge, K.; Li, X.; Merrill, A.T.; Davisson, D.; Chen, Y.; Yu, P.; Tantillo, D.J.; Last, R.L.; Zerbe, P. Comparative transcriptomics and metabolomics reveal specialized metabolite drought stress responses in switchgrass (Panicum virgatum L.). New Phytol. 2022, 236, 1393–1408. [Google Scholar] [CrossRef] [PubMed]
- Tiedge, K.; Muchlinski, A.; Zerbe, P. Genomics-enabled analysis of specialized metabolism in bioenergy crops: Current progress and challenges. Synth. Biol. 2020, 5, ysaa005. [Google Scholar] [CrossRef]
- Li, X.; Sarma, S.J.; Sumner, L.W.; Jones, A.D.; Last, R.L. Switchgrass Metabolomics Reveals Striking Genotypic and Developmental Differences in Specialized Metabolic Phenotypes. J. Agric. Food Chem. 2022, 70, 8010–8023. [Google Scholar] [CrossRef]
- Tilhou, N.W.; Poudel, H.P.; Lovell, J.; Mamidi, S.; Schmutz, J.; Daum, C.; Zane, M.; Yoshinaga, Y.; Lipzen, A.; Casler, M.D. Genomic prediction of switchgrass winter survivorship across diverse lowland populations. G3 Genes Genomes Genet. 2023, 13, jkad014. [Google Scholar] [CrossRef] [PubMed]
- Kim, D.; Langmead, B.; Salzberg, S.L. HISAT: A fast spliced aligner with low memory requirements. Nat. Methods 2015, 12, 357–360. [Google Scholar] [CrossRef] [PubMed]
- Liao, Y.; Smyth, G.K.; Shi, W. Feature Counts: An efficient general purpose program for assigning sequence reads to genomic features. Bioinformatics 2014, 30, 923–930. [Google Scholar] [CrossRef]
- Love, M.I.; Huber, W.; Anders, S. Moderated estimation of fold change and dispersion for RNA-seq data with DESeq2. Genome Biol. 2014, 15, 550. [Google Scholar] [CrossRef] [PubMed]
- Langfelder, P.; Horvath, S. WGCNA: An R package for weighted correlation network analysis. BMC Bioinform. 2008, 9, 559. [Google Scholar] [CrossRef] [PubMed]
- Pan, X.Q.; Welti, R.; Wang, X.M. Simultaneous quantification of major phytohormones and related compounds in crude plant extracts by liquid chromatography–electrospray tandem mass spectrometry. Phytochemistry 2008, 69, 1773–1781. [Google Scholar] [CrossRef]
- Schmitz, A.J.; Begcy, K.; Sarath, G.; Walia, H. Rice Ovate Family Protein 2 (OFP2) alters hormonal homeostasis and vasculature development. Plant Sci. 2015, 241, 177–188. [Google Scholar] [CrossRef]
- Koch, K.G.; Palmer, N.A.; Donze-Reiner, T.; Scully, E.D.; Seravalli, J.; Amundsen, K.; Twigg, P.; Louis, J.; Bradshaw, J.D.; Heng-Moss, T.M.; et al. Aphid-Responsive Defense Networks in Hybrid Switchgrass. Front. Plant Sci. 2020, 11, 1145. [Google Scholar] [CrossRef]
- Chong, J.; Wishart, D.S.; Xia, J. Using MetaboAnalyst 4.0 for Comprehensive and Integrative Metabolomics Data Analysis. Curr. Protoc. Bioinform. 2019, 68, e86. [Google Scholar] [CrossRef]
- Giannoccaro, E.; Wang, Y.J.; Chen, P.Y. Comparison of two HPLC systems and an enzymatic method for quantification of soybean sugars. Food Chem. 2008, 106, 324–330. [Google Scholar] [CrossRef]
- Hou, A.; Chen, P.; Shi, A.; Zhang, B.; Wang, Y.-J. Sugar Variation in Soybean Seed Assessed with a Rapid Extraction and Quantification Method. Int. J. Agron. 2008, 2009, 484571. [Google Scholar] [CrossRef]
- Donze-Reiner, T.; Palmer, N.A.; Scully, E.D.; Prochaska, T.J.; Koch, K.G.; Heng-Moss, T.; Bradshaw, J.D.; Twigg, P.; Amundsen, K.; Sattler, S.E.; et al. Transcriptional analysis of defense mechanisms in upland tetraploid switchgrass to greenbugs. BMC Plant Biol. 2017, 17, 46. [Google Scholar] [CrossRef] [PubMed]


| Transporter Class | M1 | M2 | M3 | M4 | M5 |
|---|---|---|---|---|---|
| ACA | 6 | 6 | 15 | 11 | 0 |
| CAX | 5 | 1 | 5 | 7 | 0 |
| KUP | 9 | 5 | 12 | 5 | 0 |
| Major Facilitator | 22 | 5 | 21 | 31 | 0 |
| Na/H Exchanger | 1 | 1 | 5 | 8 | 0 |
| PHT | 6 | 1 | 5 | 2 | 1 |
| PTR | 32 | 15 | 13 | 6 | 0 |
| VIT | 0 | 0 | 2 | 2 | 0 |
| LSI | 0 | 0 | 1 | 0 | 1 |
| TF Family | M1 | M2 | M3 | M4 | M5 |
|---|---|---|---|---|---|
| BBR-BPC | 0 | 0 | 0 | 5 | 0 |
| bHLH | 53 | 16 | 14 | 9 | 0 |
| bZIP | 32 | 11 | 20 | 25 | 0 |
| C3H | 8 | 5 | 9 | 23 | 0 |
| CPP | 3 | 2 | 1 | 8 | 0 |
| ERF | 40 | 9 | 13 | 5 | 0 |
| GeBP | 1 | 1 | 3 | 5 | 0 |
| HB | 1 | 1 | 0 | 7 | 0 |
| HD-ZIP | 22 | 7 | 8 | 6 | 0 |
| HSF | 4 | 1 | 5 | 12 | 1 |
| MYB | 37 | 4 | 14 | 13 | 2 |
| MYB-related | 13 | 5 | 8 | 25 | 1 |
| NAC | 27 | 16 | 22 | 12 | 0 |
| WRKY | 17 | 11 | 13 | 8 | 0 |
| YABBY | 7 | 0 | 0 | 0 | 0 |
Disclaimer/Publisher’s Note: The statements, opinions and data contained in all publications are solely those of the individual author(s) and contributor(s) and not of MDPI and/or the editor(s). MDPI and/or the editor(s) disclaim responsibility for any injury to people or property resulting from any ideas, methods, instructions or products referred to in the content. |
© 2023 by the authors. Licensee MDPI, Basel, Switzerland. This article is an open access article distributed under the terms and conditions of the Creative Commons Attribution (CC BY) license (https://creativecommons.org/licenses/by/4.0/).
Share and Cite
Palmer, N.A.; Sarath, G.; Bowman, M.J.; Saathoff, A.J.; Edmé, S.J.; Mitchell, R.B.; Tobias, C.M.; Madhavan, S.; Scully, E.D.; Sattler, S.E. Divergent Metabolic Changes in Rhizomes of Lowland and Upland Switchgrass (Panicum virgatum) from Early Season through Dormancy Onset. Plants 2023, 12, 1732. https://doi.org/10.3390/plants12081732
Palmer NA, Sarath G, Bowman MJ, Saathoff AJ, Edmé SJ, Mitchell RB, Tobias CM, Madhavan S, Scully ED, Sattler SE. Divergent Metabolic Changes in Rhizomes of Lowland and Upland Switchgrass (Panicum virgatum) from Early Season through Dormancy Onset. Plants. 2023; 12(8):1732. https://doi.org/10.3390/plants12081732
Chicago/Turabian StylePalmer, Nathan A., Gautam Sarath, Michael J. Bowman, Aaron J. Saathoff, Serge J. Edmé, Robert B. Mitchell, Christian M. Tobias, Soundararajan Madhavan, Erin D. Scully, and Scott E. Sattler. 2023. "Divergent Metabolic Changes in Rhizomes of Lowland and Upland Switchgrass (Panicum virgatum) from Early Season through Dormancy Onset" Plants 12, no. 8: 1732. https://doi.org/10.3390/plants12081732
APA StylePalmer, N. A., Sarath, G., Bowman, M. J., Saathoff, A. J., Edmé, S. J., Mitchell, R. B., Tobias, C. M., Madhavan, S., Scully, E. D., & Sattler, S. E. (2023). Divergent Metabolic Changes in Rhizomes of Lowland and Upland Switchgrass (Panicum virgatum) from Early Season through Dormancy Onset. Plants, 12(8), 1732. https://doi.org/10.3390/plants12081732